DOWNSTREAM PETROLEUM - Australian Institute of Petroleum
←
→
Page content transcription
If your browser does not render page correctly, please read the page content below
DOWNSTREAM PETROLEUM

DOWNSTREAM
PETROLEUM
CONTENTS
} AIP mission and objectives
} Message from the AIP Chairman
} Australian liquid fuel supply and demand
} International and Asian refining
} Financial performance of AIP Members
} Economic contribution of the Industry
} Australian refinery competitiveness
} National fuel quality standards
} Biofuels and alternative fuel
} Reducing greenhouse gas emissions
} Maintaining supply security and reliability
} The international crude oil and product markets
} The Australian wholesale fuels market and prices
} The Australian retail fuels market
} Environment health and safety
DOWNSTREAM PETROLEUM

      AIP MISSION
      AND OBJECTIVES

      AIP was formed in 1976 to promote effective dialogue between the oil industry,
      government and the community. It replaced a number of other organisations
      such as the Petroleum Information Bureau that had been operating in Australia
      since the early 1950s. AIP has gained national and worldwide recognition as a
      key representative body of Australia’s downstream petroleum industry.

      AIP’s mission is to promote and assist in        As well as its policy development and
      the development of a strong, internationally     advocacy role, AIP also runs the Australian
      competitive Australian downstream                Marine Oil Spill Centre (AMOSC) in Geelong
      petroleum industry, operating safely,            and Perth to support oil spill preparedness
      efficiently, economically, and in harmony with   and response by the broader petroleum
      the environment and community expecations.       industry. AIP also manages or sponsors
                                                       important industry environmental and health
      Through the active involvement of its member
                                                       programs, including CRC Care and Health
      companies, AIP provides responsible and
                                                       Watch. The Cooperative Research Centre for
      principled representation of the industry
                                                       Contamination Assessment and Remediation
      along with factual and informed discussion
                                                       of the Environment (CRC CARE) undertakes
      of downstream petroleum sector issues.
                                                       innovative, cutting edge research aimed
      This includes through AIP representation
                                                       at preventing, assessing and remediating
      on key government advisory bodies and
                                                       contamination of soil, water and air. For
      statutory committees. AIP and member
                                                       over 35 years, AIP has also sponsored the
      companies advocate government policies
                                                       independent Health Watch study which
      that are harmonised across all Australian
                                                       tracks the health of over 20 000 past
      jurisdictions, apply equally to all industry
                                                       and present employees of the Australian
      participants and are based on sound
                                                       petroleum industry.
      science supported by comprehensive
      economic analysis.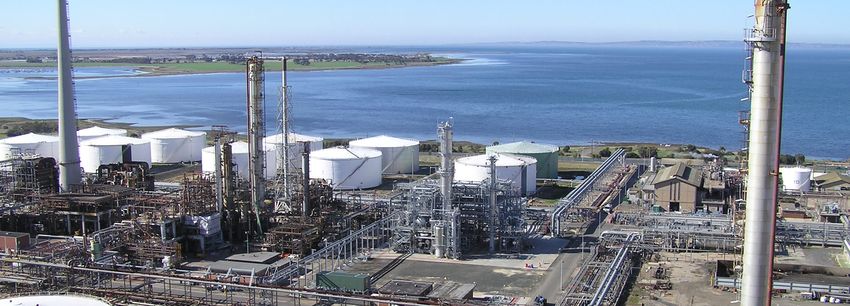
DOWNSTREAM PETROLEUM

      MEMBERS
      •   BP AUSTRALIA PTY LTD              •   MOBIL OIL AUSTRALIA PTY LTD
      •   CALTEX AUSTRALIA LIMITED          •   VIVA ENERGY AUSTRALIA PTY LTD

      ASSOCIATE MEMBERS
      •   AFTON CHEMICAL ASIA PACIFIC LLC   •   PTTEP AUSTRALASIA PTY LTD
      •   BEACH ENERGY                      •   RIO TINTO SHIPPING PTY LTD
      •   BHP BILLITON PTY LTD              •   SANTOS LTD
      •   CHEVRON AUSTRALIA PTY LTD         •   SAPURAOMV
      •   CONOCOPHILLIPS                    •   SGH ENERGY PTY LTD
      •   COOPER ENERGY LIMITED             •   SHELL AUSTRALIA PTY LTD
      •   ENI AUSTRALIA                     •   TERMINALS PTY LTD
      •   EQUINOR                           •   TRIANGLE ENERGY LTD
      •   INPEX BROWSE LTD                  •   VERMILION OIL AND GAS AUSTRALIA
      •   JADESTONE ENERGY LTD                  PTY LTD
      •   NORTHERN OIL & GAS PTY LTD        •   WOODSIDE ENERGY LTD
      •   PAPUAN OIL SEARCH LTD             •   WOOLWORTHS LTD
      •   PETRO DIAMOND AUSTRALIA PTY LTD
DOWNSTREAM PETROLEUM

      MESSAGE
      FROM THE AIP
      CHAIRMA N
      Downstream Petroleum outlines the key facts and issues impacting Australia’s
      downstream petroleum industry.

      Australia’s downstream petroleum industry           Challenging global economic conditions
      is a critical component of the Australian           have also weakened crude and product
      economy, safely and reliably providing high         demand. Despite closure of refineries in
      quality competitively priced liquid fuels to        mature markets in Europe and Japan (and
      support a range of other sectors including          four in Australia since 2003), there has been
      mining, agriculture and transport.                  a recent large-scale expansion of refining
                                                          capacity particularly in the Middle East and
      The industry is currently confronted with
                                                          Asia. These new mega-refineries, often built
      a sustained period of uncertainty and
                                                          with direct government financial support,
      global and domestic structural change.
                                                          have both scale and cost advantages over
      Global megatrends, geopolitical forces and
                                                          Australian refineries.
      dynamic markets require Australian refiners,
      wholesalers and retailers to be nimble and
      creative to remain competitive. While the
      Australian industry has a long, demonstrated
      track record of responding to uncertainty,
      decisions by governments can have a
      profound impact on operations and viability.
      Internationally, geopolitical factors including
      trade wars and unrest in the Middle East,
      is driving significant market volatility, which
      reverberate through to price volatility at the
      pump. As OPEC attempts to manage the
      volume of supply provided by its members,
      this is being offset by ever increasing new
      supplies of crude oil, notably from the US.
      Notwithstanding the challenges associated
      with this volatility, this has in part provided a
      benefit to Australian refiners through access
      to an increasingly diverse source of crude oil
      refinery feedstock to better manage risk.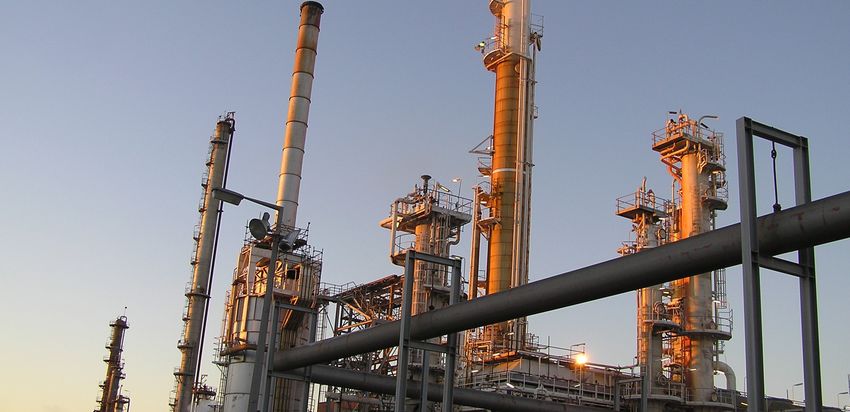
DOWNSTREAM PETROLEUM

      This additional refinery capacity, coupled with
      lower than anticipated demand, has resulted
      in an oversupply of petroleum products in
      the region, leading to extremely low refiner
      margins in the first half of 2019, which
      continue to remain unsustainably low.
      The Australian refining industry has in recent
      years responded to these cyclical market
      pressures through stringent cost control,
      operational efficiencies, and integration into
      the Asian fuels market. Complementing the
      critical role played by domestic refineries,
                                                        reduce the impacts from its own operations,
      Asian integration provides additional diversity
                                                        the industry is developing cleaner traditional
      and flexibility of supply arrangements that
                                                        fuels and alternative fuels such as biofuels
      underpin secure supply into Australia, as
                                                        and hydrogen, while assessing the
      confirmed over many years by numerous
                                                        implications and opportunities of vehicle
      Government and independent reviews.
                                                        electrification in the coming decades. The
                                                        petroleum industry also supports other
                                                        sectors’ efforts to reduce emissions, such
      SIGNIFICANT INVESTMENT IN
                                                        as the shipping industry’s compliance with
      DOMESTIC STORAGE, REFINERY
                                                        IMO regulations around lower sulfur bunker
      RELIABILITY AND PRODUCTIVITY
                                                        fuels in 2020. Each of these activities require
      AND PIPELINE INFRASTRUCTURE
                                                        substantial investment by the industry at
      H A S F U R T H E R E N H A N C E D S U P P LY
                                                        all levels of the supply chain and must be
      S E C U R I T Y.
                                                        underpinned by robust technology, market
                                                        and risk assessment.
      The industry also plays its role in responding
                                                        Structural change is also occurring at the
      to community expectations in relation to the
                                                        retail level, including through considerable
      environment and climate change. Along with
                                                        changes in retail site ownership. Although
      a program of continuous improvement to
                                                        major brands are highly prominent in the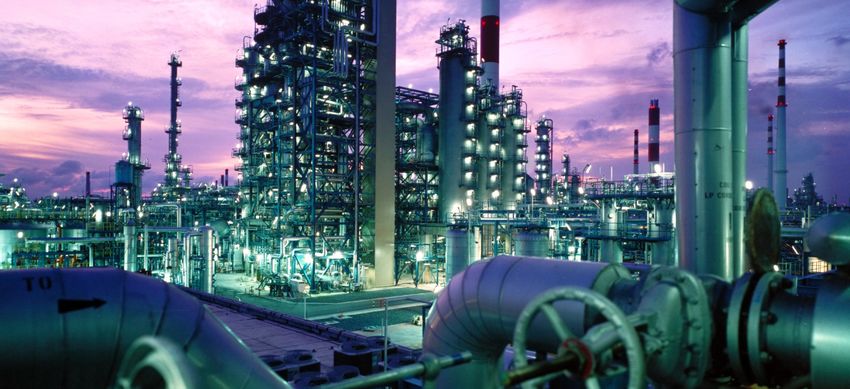
DOWNSTREAM PETROLEUM

      Australian market, fuel majors directly operate
      and set the price for less than fifteen percent   U L T I M A T E LY, I N D U S T R Y S U C C E S S
      of sites. Government intervention, including      IS ACHIEVED THOUGH CLEAR AND
      mandates on forecourt fuel offerings, can         STABLE LONGER-TERM POLICY
      impact site viability.                            FRAMEWORKS BASED ON SOUND
                                                        MARKET-B ASED PRINCIPLES.
      Despite these challenges, actions by
      Australia’s petroleum companies support
      consumers paying some of the lowest retail        Government and industry can achieve
      prices in the OECD.                               mutually beneficial outcomes, evidenced
                                                        by the agreement to transition to low
                                                        sulfur gasoline. The announced timeline
      THE ACCC CONTINUES TO CONFIRM                     for implementation provides the best
      THAT AROUND 85 PERCENT OF                         balance between delivering environmental
      RETAIL PRICES ARE DETERMINED                      improvements and minimising any impacts on
      BY INTERNATIONAL REFINED FUEL                     consumers, whilst also providing long term
      PRICES, THE EXCHANGE RATE AND                     policy certainty to the local refining industry
      GOVERNMENT TAXES.                                 to facilitate potential investment and business
                                                        decisions.
      Australia will continue to be a high cost         The Australian petroleum industry remains
      operating environment. The key role for           fully committed to ensuring ongoing reliable
      governments therefore is to ensure a              supply of affordable and quality fuels to
      competitive open market and a level playing       the Australian market, through continued
      field for local market operators, whilst          investments and tough decisions to improve
      ensuring that the domestic industry is not        productivity and ensure economic viability.
      competitively disadvantaged to our regional
      counterparts and that innovation continues to     Andy Holmes
      be fostered.                                      Chairman, AIP
DOWNSTREAM PETROLEUM

      Australian liquid
      fuel supply and
      demand

                     KEY MESSAGES

      •   The Australian refining industry is a price    •   Growth in imports reflects the gap
          taker in the Asian region, and there is a          between fuel demand and production
          direct relationship between Australian and         from Australia’s four oil refineries which
          Asian fuel prices.                                 must compete with imports from Asian
                                                             refineries.
      •   Industry profitability is largely determined
          by supply and demand in the Asian              •   Australian refineries meet around 64% of
          refining market.                                   petrol demand in Australia and 48% of
                                                             overall fuels demand.
      •   There is currently significant surplus of
          supply of petroleum products in the Asian      •   With a diverse source of supply from
          region.                                            both domestic production and imports,
                                                             the Australian downstream petroleum
      •   Demand for petroleum products has not
                                                             industry will continue to provide reliable
          been strong enough to absorb the output
                                                             supplies to consumers at competitive
          from new refinery capacity installed in
                                                             market prices.
          Asia each year for the last decade.
      •   Asian excess supply capacity has
          provided a ready source for fuel imports
          to Australia, including growing petrol
          imports by independent fuel suppliers.
DOWNSTREAM PETROLEUM

      In 2018–19, Australia’s domestic refineries supplied around 48 percent of
      total petroleum products required by Australia’s major industries and the fuel
      distribution network of around 7 100 service stations. The reliability of the fuel
      supply chain is robust given the unique logistic and geographic challenges in
      Australia.

      Australian petroleum refineries are highly      It also produces a substantial volume
      capital intensive, technically sophisticated    of chemical feedstock.
      facilities that employ a wide range of highly
                                                      In 2018–19, Australia consumed 60 710 ML
      skilled personnel and provide significant
                                                      (mega litres) of petroleum products - or
      economic and other benefits to key Australian
                                                      around 166 ML per day- a 17 percent
      industries.
                                                      increase since 2010-11. Australian refineries
      The Australian oil refining industry            produced 29 100 ML of petroleum products,
      produces a range of petroleum products          of which almost 4 percent was exported
      comprising:                                     (excluding LPG).

                PETROL                        DIESEL                      JET FUEL
                (38%)                         (31%)                       (14%)

                FUEL OIL                      LPG                         OTHER PRODUCTS
                (3%)                          (3%)                        (11%)
DOWNSTREAM PETROLEUM
Net imports from over 20 countries accounted While Australia has its own indigenous crude oil
for 56 percent (or around 34 200 ML) of total production, this has been declining and around
consumption, as highlighted in the following 79 percent was exported in 2018–19. These
chart. A proportion of this imported volume was crudes are largely unsuitable for Australian
supplied to northern and north western areas refineries to manage their product slate, while the
of Australia where it is more economic to supply locations of Australian refineries also contribute
directly from Asia due to domestic refinery to the quantity of exports. Crude oils required
locations and local terminal configuration. to meet the product demand mix in Australian
Numerous import terminals are located around refineries were imported from over 20 countries,
Australia providing ready access to the Australian but mainly from the Asia-Pacific region (57
market. The bulk of imported fuel came from percent) including New Zealand and PNG. The
refiners and regional suppliers in Japan remaining imports of crude oil was sourced from
and South Korea and imports from India are the Middle East (23 percent), Africa (16 percent)
increasing. and others (4 percent).
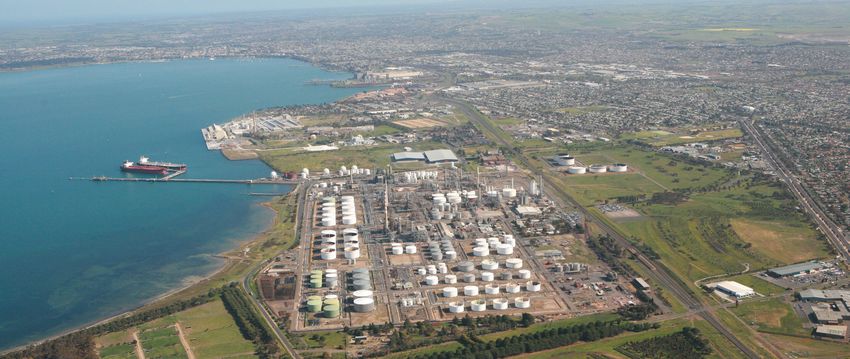
REFINERIES AND MAJOR FUEL IMPORT TERMINALS
3
4
1 Geelong (Viva Australia refinery)
1 2
2 Altona (Mobil refinery)
3 Lytton (Caltex refinery)
4 Kwinana (BP refinery)
Port/TerminalDOWNSTREAM PETROLEUM
IMPORTS OF PETROLEUM PRODUCTIONS 2018-19
Singapore South Korea Japan China Malaysia Others
27% 21% 16% 11% 8% 17%
Others - Chinese Taipei, Netherlands, Indonesia, UAE, India, USA, Estonia, Saudi Arabia, Thailand, UK, NZ
IMPORTS OF CRUDE OIL 2018-19
Malaysia UAE Brunei Algeria Libya Indonesia NZ PNG Others
31% 17% 7% 6% 6% 6% 5% 5% 19%
Others - Gabon, Vietnam, Nigeria, USA, Congo, Russia, Azerbaijan, Thailand, Pakistan, Yemen, Singapore, India
Source: Australian Petroleum Statistics
AUSTRALIAN FUEL PRICES Since 2000–01:
Australian refineries operate in a global market • Diesel use has increased by around 125
and compete directly with imports coming percent due largely to growth in mining
into Australia. Locally produced petroleum industry activities in Australia and growth in
products must therefore be priced to be sales of vehicles with new generation diesel
competitive with imports (i.e. import parity technology engines.
pricing) from the Asian region. • Jet fuel use has increased by around 76% due
There is no tariff protection and there are to growth in air travel for business and leisure.
a range of fuel terminal facilities, including • Overall petrol use has declined slightly by
in every seaboard capital, through which 3 percent as vehicle fuel efficiency has
Australia’s liquid fuel demand is supplied, continued to improve. Use of regular unleaded
either through imported product or from the petrol (ULP) has declined by more than 45
domestic refineries. percent as consumers chose new vehicles
Profitability of the Australian refining industry that recommend the use of higher octane fuels
is therefore largely determined by product or have moved to ethanol blend petrol. The
prices in Asia, and its viability depends on our demand for ethanol blend petrol increased to
competitiveness against imports from refiners a peak of 18 percent of petrol use in 2010–11,
in Asia. While there are have been recent largely as a consumer preference response
and planned increases in Australian refinery to the ethanol fuel mandate in NSW, but has
capacity, future growth in Asian imports is still subsequently declined to less than 14 percent
expected to meet demand growth, providing of total petrol use.
additional supply diversity. Petroleum product use varies across the
Australian states and territories, reflecting
a range of factors. This includes the
CHANGING AUSTRALIAN main economic activities and resources
DEMAND FOR PETROLEUM in jurisdictions, their population base and
PRODUCTS dispersion, the age and structure of vehicle
fleets, and their infrastructure capacity and
Over the past decade, Australian use of
performance (eg. airports). For example,
petroleum products has increased by around
there is higher diesel use in the mining States
2 percent per year.
of WA, NT and QLD, higher jet fuel use in
Petrol, diesel and jet fuel use now comprise major airport centres, and higher use of
89 percent of the total petroleum product premium gasoline in NSW as a result of the
demand. government’s ethanol mandate policy.20 20
0
0
2,000
4,000
6,000
8,000
10,000
5,000
10,000
15,000
20,000
25,000
30,000
35,000
00 00
-0 -0
20 1 20 1
01 01
-0 -0
20 2 20 2
02 02
DOWNSTREAM PETROLEUM
-0 -0
20 3 20 3
03 03
-0 -0
4
2000–01 to 2018–19, ML
20 20 4
04 04
-0 -0
20 5 20 5
Source: Australian Petroleum Statistics
05 05
-0 -0
20 6 20 6
06 06
-0 -0
20 7 20 7
07 07
-0 -0
20 8 20 8
08 08
-0 -0
20 9 20 9
09 09
-1 -1
0
Diesel
20 20 0
Jet Fuel
10 10
-1 -1
20 1 20 1
11 11
-1 -1
20 2 20 2
12 12
-1 -1
20 3 20 3
13 13
-1 -1
20 4 20 4
14 14
-1 -1
20 5 20 5
15 15
-1 -1
20 6 20 6
16 16
-1 -1
20 7 20 7
17 17
-1 -1
20 8 20 8
18 18
AUSTRALIAN USE OF MAIN PETROLEUM PRODUCTS:
-1 -1
9 9DOWNSTREAM PETROLEUM
AUSTRALIAN CONSUMERS
CONTINUE TO HAVE A VERY
STRONG PREFERENCE FOR SPORTS
UTILITY VEHICLES (SUVS), WHICH
ACCOUNT FOR AROUND 40% OF
TOTAL NEW PASSENGER VEHICLE
SALES
There also continues to be steadygrowth in
sales of new diesel passenger vehicles, albeit
off a low base..
Electric Vehicles
A more recent development in passenger
transport has been the interest and growth
in Electric Vehicles (EVs), particularly Hybrid
vehicles, which have grown rapidly from a
very low base in recent years.
CHANGING Ambitious targets, government policy and
AUSTRALIAN TRENDS very significant subsidies including purchase
IN PASSENGER incentives, have lowered vehicle costs,
extended vehicle ranges, and reduced
TRANSPORT consumer barriers. Lower battery costs and
The Passenger Transport Task improvements in battery density over recent
Passenger transport in Australia is changing years have also played a role, together with
with population growth anddevelopments in the renewables share in electricity generation
public transport and city planning. Consumer and growth in the EV portfolios of OEMs.
preferencesand new vehicle technologies While the sector has developed at a rapid
are also playing arole in these trendsand will pace, the impact on the total vehicle
continue to do so.In Australia’smetropolitan population is still hardly noticeable in most
centres,total travel has increased vastly over nations.
time, reflecting the significant underlying
population growth in capital cities. Australia’s In 2018, the IEA estimated that the
major cities continue to sprawl outwards worldwide number of EVs on the
leading to longer average trip times. This has road was 5.1 million (69% of them are
resulted ina major increase in the total annual battery electric vehicles or BEVs and
transport task in passenger-kilometres (pkms). 31% plug-in hybrids electric vehicles
The servicing of this passenger transport or PHEVs), with the total number
task is dominated by private motor vehicles, of passenger vehicles on the road
which account for around 90 per cent of the worldwide of around 1 billion.
motorised pkm task within our capital cities.
Over the last decade or so, however, there
Around 2.1% of global vehicle sales in 2018
has been a rise in passenger numbers across
were EVs. However, in some markets the
many Australian urban public transport
market share is significantly higher with China
systems, particularly as a result of expansions
now the largest market for EVs (45% of world
to transport infrastructure and services.
sales), with the Unites States accounting for
In terms of passenger vehicles, consumer
22% and Europe 24%. Norway, underpinned
preferences and utility remain the strong driver
by a range of government incentives, is the
of private transport trends.
global leader in terms of market share.DOWNSTREAM PETROLEUM
In Australia, of the 1 million new vehicles
typically sold each year, EV sales have been
modest. In 2019, some 6,718 EVs were sold
(just under 0.7% of total vehicle sales. As
a result, EVs represent a very small share
of the 14 million passenger vehicle fleet in
Australia with an average vehicle age of 10
years. Australian motorists have also typically
favoured hybrids over pure electric vehicles
(BEVs).
The extent of the future EV contribution to AIP believes that alternative energy sources
the passenger transit task, in Australia and and vehicles will have a place in a diversified
globally, is not clear. There is a wide array Australian passenger transport market, as
of forecasts of future EV uptake, ranging long as they are available at a competitive
from low scenarios of around 20 million EVs price, reliably supplied, acceptable to
globally in 2040 (ES EIA) to forecasts of more consumers, and produced sustainably.
than 500 million vehicles worldwide (BNEF).
A market-based policy framework will
Future EV uptake is complex and critically best facilitate the uptake of electrified
dependant on a wide range of factors. passenger vehicles on reliable, sustainable
and competitive market terms. It will also
For example, including: encourage a lower emissions energy supply
and use that avoids market distortions,
• Vehicles – vehicle mix, technology,
increased energy prices and lower transport
performance, production, costs and
fuel security.
existing fleet turnover
The development of robust, efficient and
• Batteries - production capacity, storage/
commercial markets for all transport fuels
density, reliability, cost and disposal
and vehicles will be best supported by:
• Key input markets and pricing – lithium
• policy and investment stability
and electricity market developments and
pricing • a level playing field for competing transport
fuels/vehicles and market participants
• Distribution Network – availability of
recharge infrastructure and network and • the minimum level of efficient and well-
related costs targeted government regulation.
• Consumer demand and preferences – AIP believes that government policy in
demand, convenience, vehicle/transport support of a higher uptake of electric
preferences. vehicles (e.g. for purported environmental
benefits) needs to be:
A competitive free market with a predictable • based on a demonstrated market failure
regulatory framework that does not pick
winners and losers will best serve consumers, • based on sound science
suppliers, investors, and local communities • cognisant of other policy settings
in developing economic prosperity, energy
security, and environmental protection. • transparent, with clear and credible
objectives.
Accelerating the EV uptake, beyond current
market and technical constraints, needs This policy framework reflects fundamental
to be carefully considered and managed, industry drivers, including the long lead times
particularly given linkages and dependences required for industry investment and the
to other energy sectors (electricity) and to key significant capital employed by the fuels and
input markets (batteries/lithium). passenger vehicle industries.DOWNSTREAM PETROLEUM
International and
Asian Refining
The global refining industry is fundamentally changing as
emerging and maturing trends re-shape the global supply
and demand patterns for crude oil and petroleum products.
Although crude oil and petroleum products products and the associated strong refiner
are traded globally, major regional markets margins. This was particularly apparent in
have developed around the main demand Asia.
centres of North America, Europe and
However, the GFC resulted in a substantial
Asia, with each market having its own
reduction in global petroleum product
characteristics. Refineries play an integral role
demand, with only modest prospect of a
in these regional markets, with the financial
recovery of lost demand over the short to
viability of individual refineries heavily
medium term. As a consequence, refiner
influenced by supply and demand in the
margins dropped substantially, in some cases
markets.
falling into negative territory. The refining
Prior to the Global Financial Crisis (GFC) industry, particularly in Europe and OECD
in 2008, there was a significant surge in Asia, reacted to this financial challenge by
investment in refinery upgrades and in new terminating or deferring investment plans,
refinery construction commitments, largely in reducing the utilisation rates for refineries, and
response to growing demand for petroleum progressively closing less viable refineries.DOWNSTREAM PETROLEUM
The three key regional benchmarks are highlighted in the chart below. The benchmark for
Australian refineries is the Singapore margin.
REGIONAL REFINING MARGINS 1992 - 2018
$30
$25
$20
$15
$10
$5
$0
-$5
92
93
94
95
96
97
98
99
00
01
02
03
04
05
06
07
08
09
10
11
12
13
14
15
16
17
18
19
19
19
19
19
19
19
19
20
20
20
20
20
20
20
20
20
20
20
20
20
20
20
20
20
20
20
US dollars per barrel USGC Medium Sour Coking
US dollars per barrel NWE Light Sweet Cracking
US dollars per barrel Singapore Medium Sour Hydrocracking
Source: BP Statistical Review of World Energy
Notwithstanding these developments, a refinery utilisation rates at many refineries.
number of countries, particularly China and For example, China added, on average,
India, continued to press ahead with major almost 1 million barrels per day of refining
refinery construction programs as part of capacity every year from 2010 to 2015. This
national development goals. construction and expansion program has
continued in China with the addition of more
Although petroleum product demand has
than 2 million barrels per day in new capacity.
slowly recovered from the GFC, these trends
By comparison, since 2008 some 4 million
have continued to play out across Europe,
barrels per day of older refining capacity has
North America and Asia, with older refineries
been closed in North America, Europe, Japan
closing, continuing refinery construction across
and Australia.
Asia and the Middle East, and lower than usual
WORLD REFINING CAPACITY
35,00
30,00
25,00
Million barrels per day
20,00
15,00
10,00
5,00
0,00
North America S & Central Europe C’Wealth of Middle East Africa Asia Pacific
America Ind. States
1970 1980 1990 2000 2010 2015 2018
Source: BP Statistical Review of World EnergyDOWNSTREAM PETROLEUM
This development in North America has A surplus refining capacity is forecast for
compounded the effects of the other global the Asian region through to around 2025,
trends in the refining industry, particularly in notwithstanding the refinery rationalisation
Europe, such that there is an ongoing global that is occurring across Asia, particularly
surplus refining capacity and depressed with less viable refineries in Japan and
refiner margins in other markets. Australia. Nonetheless, the extent of the
oversupply is significantly below the scale
that was observed from 2008 to 2015 when
HOWEVER, WITH SUBSTANTIAL
Australian refineries experienced substantially
N E W R E F I N I N G C A P A C I T Y, T H E
depressed profitability.
MIDDLE EAST AND ASIA ARE
I N C R E A S I N G LY T H E G LO B A L H U B The change in the Asian regional supply
FOR FUTURE PETROLEUM PRODUCT balance points to a slowly improving outlook
AND REFINING TRADE for Australian refineries and underpins
investments being made to drive a
The IEA has predicted that the changing sustainable ongoing future. However, history
geography of oil supply and demand will has shown that periods of improving margins
transform global oil trade with Asia taking an lead to over investment in the refinery sector
increasing share of global imports, and gross in Asia which then again suppress margins.
oil exports from the United States overtaking The capital investment fluctuations explain the
those from Saudi Arabia by the mid-2020s. cyclical nature of the refining business.
ASIAN EXCESS SUPPLY CAPACITY
Proportion of total Supply (%)
Excess Supply (millions of barrels)
Source: FACTS GLOBAL ENERGY and Caltex AustraliaDOWNSTREAM PETROLEUM
Financial
Performance
of AIP
Members
KEY MESSAGES
• Refining is a highly cyclical business. • The profitability in the wholesale and
retail sectors of the industry, have
• There is a direct correlation between
largely been constant given the strong
Australian refining industry profitability
competitive nature of the industry.
and international refiner margins.
• Despite this overall poor financial
• The depressed refiner margins since
performance within the industry, there
the start of the GFC have meant largely
has been continued investment in
negative refining profits over the six
refineries of over $2bn over the last 5
years.
years.
• Combined with a strong Australian dollar
• Any significant investment required in
this led to the closure of three Australian
coming years, over and above operating
refineries, Clyde and Kurnell in Sydney
and maintenance investment, will be
and Bulwer Island in Brisbane.
tested against the potential for a return.
• ACCC data highlights the different net
• Australian refiners are expected to
profitability performance of the domestic
continue to seek ways to remain
refining sector over a decade where the
competitive through productivity
average ranged from around 2.5 cents
improvements, technological innovation
per litre (cpl) in the early part of the last
and a strong focus on cost containment.
decade, with average losses through to
2014 of around 0.5 cpl. • Fuel excise collection and payments
of $18 billion contributed around 5 per
• While improved financial performance
cent of taxation revenue to the Australian
is expected due to an upturn in the
Government in 2015-16.
cycle, excess supply in the Asian region
will continue to present a challenging
environment for the Australian refining
industryDOWNSTREAM PETROLEUM
ACCC FINANCIAL The ACCC has not published financial
REPORTING ON THE performance data for the petroleum
industry since the December 2014 ACCC
PETROLEUM INDUSTRY
Monitoring Report.
The Australian Competition and Consumer
Click here to see the report
Commission (ACCC) formally monitors and
reports on the prices, costs and profits relating
to the supply of fuel in the petroleum industry
in Australia. The ACCC’s monitoring role is by
Ministerial direction under the Competition and
Consumer Act 2010.
The ACCC financial reporting covers the three
major sectors of the downstream petroleum
industry: total supply (refining and importing),
wholesaling and retailing across all major
market operators. For each sector, ACCC
reporting presents detailed cost, revenue and
This means 2013-14 is the latest industry data
profitability data.
available, but updated financial performance
The extensive industry data required for data is expected to be published by the ACCC
these ACCC Reports is supplied under in the second half of 2019. As soon as it is
legal requirement each year by AIP member available, AIP will publish the ACCC’s financial
companies and other major fuel suppliers performance data in Downstream Petroleum.
operating in the Australian market.
AUSTRALIAN REFINERY PROFITABILITY
Refinery sector real unit net profit, all products: 2002-03 to 2013-14
Source: ACCC Annual Price Monitoring Report, Dec 2014DOWNSTREAM PETROLEUM
Ec onomic
Contribution
of the Industry
KEY MESSAGES
• Australian refineries have been very long • The Australian refineries also spend
standing participants in the local market hundreds of millions each year
as the major transport fuel suppliers, purchasing goods and services in
with all current refineries being their local area and State, contributing
operational for over 50 years. to significant jobs and business
opportunities.
• The four Australian refineries currently
supply around half of Australia’s total • The refineries also make a very
liquid fuel needs, and around 65 percent significant contribution to government
of petrol consumed in our market. revenue, including over $15 billion in fuel
excise to the Federal Government from
• Other Australian industries are
fuel sales.
positively impacted by refineries
which provide key inputs to their own • Independent economic modelling
activities. Approximately 65 percent has found that a refinery contributes
of the total value of Australian liquid around $1 billion in economic activity on
fuel consumption is in the transport, average to the local economy each year
mining, construction, agriculture and
• This industry also provides significant
manufacturing industries.
additional indirect benefits, including
• Total new capital investment in the reliability and security of fuel supply,
refining industry was $2 billion over the sharing inputs with other industries, and
last 5 years. innovation, technology and knowledge
spillovers.
• As a high-tech industry, the refining
sector has highly skilled workforces with • Australian refineries are also active
an even mix between direct employees investors and participants in numerous
and contractors whose numbers can community development activities to
double during major turnaround work. enhance the education, environment and
health outcomes of the local area.DOWNSTREAM PETROLEUM
DIRECT CONTRIBUTION OF REFINERIES
Each refinery provides significant economic benefits to the local and State
economy where it is located, and also contributes to fuel supply security for
Australia as a whole through supply diversity and flexibility.
The economic impact of each refinery • taxes that the refinery collects and pays to
includes: the Commonwealth and State Governments
as well as local council rates
• the economic benefit of value adding (i.e.
refining petroleum products) • the economic benefit of employment
- demand for qualified personnel and
• the impact on industries that source inputs
providing apprenticeships and other forms
from the refinery or that provide products/
of on the job training.
services to it
• financial impacts (new capital investment
and profits)
AUSTRALIAN REFINERIES:
KEY DIRECT ECONOMIC BENEFITS
2015 2016
Refinery Production (Value Add)
Total Petroleum Products (million litres) 24,194 25,722
Total Petrol products (million litres) 10,818 11,653
New Capital Investment
Refinery Investment ($million) $308 $389
Total for the Last 5 Years ($million) n/a $2,050
Direct Employment
Refinery Employees (FTE) 2,048 1,966
Australia – Total Employment (FTE) 10,669 10,282
Direct Wages & Salaries
Refinery Employees ($million) $323 $303DOWNSTREAM PETROLEUM
Financial Benefits The Australian refineries paid wages and
salaries to their direct refinery employees
Due to the capital-intensive nature of totaling $303 million in 2016, similar to the
petroleum refining, the industry routinely previous year. Total wages and salaries
requires large and ongoing capital investment paid are significantly higher when including
in plant and equipment to continue safe and contractor wages.
reliable operations. Over the last 5 years,
the total new capital investment in Australian Contribution to government revenue
refineries was over $2 billion. This represents
an average annual investment of $400 million AIP member companies recognise that the
across the four refineries, which is consistent taxes they pay, and collect and pay, form a
with the total refinery investment of $389 significant part of their economic contribution to
million in 2016. In simple terms, the average Australia and to the States where they operate.
annual investment per refinery is in the range
of $50-$150million. The refining companies in Australia:
Employment Benefits • pay corporate income taxes, royalties
and stamp duties,
I N 2 0 1 6 , W O R K E R S D I R E C T LY • collect and pay employee taxes, GST
EMPLOYED BY THE AUSTRALIAN and fuel excise tax
REFINERIES STOOD AT AROUND
• pay land tax and local council rates,
2,000 PERSONS.
licenses and charges.
This compares with total direct employment
for AIP member companies across all their
In 2018, the Australian refining companies
Australian operations was more than 10,000
collected and paid around $16 billion in fuel
persons in 2016.
excise. On average, around $310 million a
Actual labour use in the refineries is week in fuel excise is collected and paid to
substantially larger than this direct the Australian Government by all the refining
employment, because the refining sector also companies, making them amongst the
employs a significant number of contractors largest corporate tax collectors in Australia.
on a non-permanent basis and which varies
The bulk fuel terminals (refinery, import
throughout the year, and also year-to-year
and marketing terminals) of AIP member
depending on major maintenance cycles.
companies constitute the bonded
During normal periods of operation, refineries warehouses at which fuel excise is collected.
employ almost as many contractors as The fuel excise on petrol and diesel is 42.3
direct permanent employees. During these cents per litre, aviation fuel 3.6 cents per
periods, the main tasks of contractors include litre, LPG 13.8 cents per litre and ethanol 2.6
maintenance, engineering, inspection, water cents per litre.
treatment and security. However, compared
to normal periods of operation, the number
AROUND $5-6 MILLION PER ANNUM
of contractors could as much as double
IS PAID IN LOCAL GOVERNMENT
during periods when some production units
RATES AND CHARGES FOR
are shut down to allow for major upgrade and
FOR JUST REFINERY RELATED
maintenance programs (called “turnarounds”,
ACTIVITIES.
which occur every 4-6 years).DOWNSTREAM PETROLEUM
INTRINSIC INDUSTRY LINKAGES
Many industries use petroleum products, and The five major industrial users of petroleum
for some industries they make up a large share products include the transport, construction,
of intermediate input costs. This means that mining, manufacturing and agriculture
the petroleum refining industry’s products have industries, which make up 64 percent of
intrinsic links with the rest of the Australian petroleum product use in Australia. Transport
economy. is the largest industry user of petroleum
products, making up around 23 percent of
The chart below shows the use of petroleum
total Australian use.
products in industries where refinery products
are particularly important inputs. Use in each Some outputs from these industries are, in turn,
industry is reported as a share of total use of important inputs for other Australian industries.
petroleum products in Australia. Based on the Therefore, any shocks (such as the closure of
latest available ABS data, industries account a refinery) to the petroleum refining sector will
for 66 percent of domestic petroleum product flow though all sectors of the economy via links
use and households account for 34 percent – with the agriculture, manufacturing, mining and
making households the largest fuel user group transport industries.
in Australia.
USE OF REFINERY PRODUCTS AS A SHARE
OF TOTAL AUSTRALIAN USE: 2016-17
Households
Transport
Construction
Mining
Manufacturing
Agriculture, Forestry and Fishing
Wholesale & Retail Trade
Utilities Supply & Services
0% 5% 10% 15% 20% 25% 30%
Source: ABS, Australian National Accounts: Input-Output Tables Cat No 5209.0.55.001 (latest edition).
NOTE: Manufacturing use excludes that used by the petroleum industry itself.DOWNSTREAM PETROLEUM
INDIRECT BENEFITS
Refining also provides for a range of indirect benefits including:
•Reliability and security of supply: The •Innovation and spillovers: As a high-tech
domestic refining capacity contributes to industry, the refining industry benefits the
the overall health of the Australian economy economy through innovation, technology
through its contributions to the level of and knowledge spillovers to other sectors
fuel supply reliability and flexibility. This (inc. through the mobile contractor
is important for efficient production and workforce). Major technological investments
mobility of labour and other products. made by the refining industry include
Supply security is enhanced in Australia improvements in safety, environmental
through the availability of both domestically management, new product development,
refined and imported fuels from a wide and production improvements and de-
diversity of supply sources. bottlenecking. This stimulates innovation
and technological improvements in other
• Input sharing: The refining industry benefits
sectors, without them having to bear the
other sectors through increasing demand for
full costs.
certain inputs shared with other industries
(e.g. engineering services, chemicals, •Community development and investment:
electronic equipment and mechanical Australian refineries actively participate in
components); this assists these sectors numerous community development activities
achieve economies of scale and benefit and groups to enhance the education,
from lower costs in their supply chains (e.g. environment and health outcomes of the
petrochemicals, plastics and heavy industry/ local area (including grants, donations,
manufacturing sectors). volunteer work, and sponsorship). These
can be expected to have wider economic
benefits like higher GDP and consumer
living standards.DOWNSTREAM PETROLEUM
QUICK FACTS:
AUSTRALIAN REFINERIES
TOTAL TRANSPORT
FUEL PRODUCED 30 BILLION
LITRES
BY AUSTRALIA’S
FOUR REFINERIES TOTAL PETROL
PRODUCED BY
50%
TOTAL CRUDE
AUSTRALIA’S FOUR
OIL REFINED
REFINERIES
LAST YEAR
65%
AIP MEMBER COMPANY TYPICALLY, AS MANY CONTRACTORS
DIRECT EMPLOYEES: ARE EMPLOYED AS DIRECT (PERMANENT)
AT REFINERIES EMPLOYEES
TWICE THE NUMBER OF
2,000 CONTRACTORS DURING MAJOR
REFINERY MAINTENANCE
X2
ACROSS AUSTRALIA
10,000+ DIRECT WAGES AND AVERAGE INDUSTRY
SALARIES PAID EACH YEAR ANNUAL PROFIT FOR
TO REFINERY EMPLOYEES ALL FUEL SOLD
TOTAL INVESTMENT IN
(EXCLUDING CONTRACTORS)
AUSTRALIAN REFINERIES
OVER THE LAST FIVE YEARS $300+ 2 CENTS
$2.0
MILLION
PER
BILLION AVERAGE ANNUAL
LITRE
CONTRIBUTION TO THE LOCAL
ECONOMY BY A REFINERY
AVERAGE ANNUAL FUEL TAX HUNDREDS
(EXCISE) COLLECTED AND
PAID TO GOVERNMENT $1 BILLION OF COMMUNITY GROUPS,
PROGRAMS, SCHOOLS AND
LOCAL ENVIRONMENT INITIATIVES
$16 SUPPORTED EACH YEAR BY
REFINERIES
BILLIONDOWNSTREAM PETROLEUM
Australian
refinery
competitiveness
KEY MESSAGES
• Over the past decade, the industry has • Australian refineries continue to be
been through a period of significant challenged:
restructure.
- excess refinery capacity in Asia
• The Australian refining industry is part of - increased competition from mega-
a highly competitive global oil market. refineries in Asia
• Profitability and ongoing viability will - commercial pressures for increased
be determined largely by supply and business efficiencies and avoidance
demand in the Asian refining industry. of new costs
• Australian refineries see a long-term - general tightening of regulatory
viable future as long as productivity can requirements
be improved, costs can be controlled and - implementation of climate change
new costs are not borne by industry as a policies
result of unnecessary regulation. - competing demand and high cost
• Australian refineries are smaller than for maintenance and construction
regional competitors, but do have services, and skilled labour
their own competitive advantages • Continued viability of Australian
including market access and integration, refineries will require a stable policy
efficiencies reliability, and speciality and investment environment and
products production. energy policy based on open,
efficient and competitive market
principles.DOWNSTREAM PETROLEUM
Over the past decade, Australia’s refining output mix to meet the demand and quality
industry has been through a period of standards of their target markets.
substantial restructure. As a result, Australia
Each Australian refinery will seek to maintain
now has four refineries, each with its own
an individual competitive advantage through
discrete competitive advantages that has
concentrating on areas where a significant
ensured its current viability. Although the
cost or efficiency advantage is evident. For
refineries were generally constructed in the
example, the use of domestic advantageously
1950s and 1960s, they have been extensively
priced feedstock, high utilisation rates,
upgraded since then, notably during 2005
establishing niche markets and access to key
and 2006 in order to meet tighter fuel
markets all underpin competitive advantage.
standards. These refineries are relatively
small by world standards, with the largest
While the cost of crude oil is the major
having a capacity of 8 830 ml pa (megalitres
input cost for refineries (around 90 per
per year), compared with the four largest
cent according to the ACCC), other key
Asian refineries which produce between
expenses for refineries include:
30 000 ml pa and 70 000 ml pa. Australian
refineries offer none of the economies of • crude oil shipment and storage,
scale benefits that are available from these • utilities and energy charges,
larger refineries.
• additives, catalysts and chemicals,
AUSTRALIAN REFINERIES
• capital costs, financing and
2019 depreciation,
Refinery Capacity
• wages and salaries,
(ml pa)
Lytton (Caltex—Brisbane) 6300 • plant maintenance,
Altona (Mobil—Melbourne) 5220 • site security and systems,
Geelong (Viva Energy—Geelong) 7470 • regulatory measures,
Kwinana (BP—Kwinana) 8830
• product shipment and storage, and
Total 27 820
• government taxes and charges.
REFINERY
COMPETITIVENESS
Refineries seek to manage the challenges
Economies of scale provide a key competitive they face by improving the efficiency of their
advantage in refining, with larger refineries operations through enhanced refinery yields,
having lower unit costs of production and the reliability and cost containment. Continued
ability to purchase inputs (e.g. crude oil) in availability of highly trained technical staff
larger parcels hence at lower unit costs. and contractors can contribute to high levels
Economies of scale arise from larger of refinery efficiency.
production runs, lower capital and labour Compared to refineries across Asia,
costs per unit of production, and lower Australian refineries suffer from substantial
purchasing costs for larger volumes of disadvantages in operating and capital
inputs, such as crude oil and energy. costs that virtually preclude Australia from
Newer refineries also benefit from the latest consideration for major new refinery projects.
technology with efficiencies realised from The relatively small Australian refineries offer
greater flexibility in the crude oil inputs and no economies of scale benefits. Australian
product slates produced. labour and construction costs for new and
Refiners seek to run the optimal mix of crude expanded refinery investments remain high
oils through their refineries, depending on compared to costs in most countries in Asia.
the relative price of available crudes, the
specific refinery equipment, and the desiredDOWNSTREAM PETROLEUM
AS AN INDUSTRIALISED NATION, Government policies will impact on the ability
AUSTRALIA OFFERS NONE OF THE of Australian refiners and fuel importers to
CAPITAL OR OPERATING COST attract further investment funds for refinery
BENEFITS AVAILABLE IN MANY and import terminal upgrades, and ultimately
DEVELOPING COUNTRIES for major maintenance programs.
The taxation and investment regimes applying Key policy influences on the
in Asia are also highly attractive for new facility competitiveness of the Australian
construction and for substantial refinery downstream petroleum industry are:
upgrades, through the provision of taxation • fuel quality regulation,
holidays, substantial investment allowances
and investment facilitation. • energy policy,
These competitive disadvantages for • liquid fuel supply reliability and
Australian refineries compared to Asia can security policies,
impact adversely on the decisions that must • alternative fuels policies and mandates,
be taken locally on investments in major
• fuel and corporate taxation,
refinery upgrades and overhauls. The closure
of the Clyde refinery in 2009 was a direct • industrial relations frameworks, skilled
result of these disadvantages that included: labour availability and training,
•n
ot regionally competitive because of the • climate change policy,
small scale,
• environmental and OHS regulation,
•d
id not generate sufficient cash to justify
• competition regulation, and
further investments, and
• fuel retailing regulation.
•a
lternative supplies could be sourced from
the Asian region.
In each of these areas, AIP and member
More complex and costly environmental
companies advocate policies that are
and other regulatory measures also pose
harmonised across all Australian jurisdictions,
significant constraints on new investment in
apply equally to all industry participants and
Australia and provide ongoing challenges for
are based on sound science supported by
existing Australian refineries. Overlapping
comprehensive economic analysis.
federal, state and local government regulations
also increase the complexity of operations and Proposals for changes to current market-
raise the costs of doing business in Australia. based policy settings need to clearly
demonstrate that:
THE ROLE OF
• a real market failure or vulnerability exists
GOVERNMENT
within the industry,
AIP considers that the key role for
• new policy measures will produce a net
governments is to provide a clear, stable
benefit to the community and will not impact
longer term policy framework, underpinned
adversely on the competitiveness of the
by a strong market-based approach.
industry or liquid fuel supply security and
reliability, and
Government policy should:
• continued reliance on domestic and
• ensure a competitive and open market
international markets is unable to deliver
is maintained in Australia,
a similar outcome.
• ensure that the local refining industry is
Any proposals for governments to intervene in
not competitively disadvantaged in the
the operation of the fuels markets should be
Asian region, and
on the basis of a demonstrated market failure
• maintain a strong commitment to which the market or consumers cannot, or
technical skills development in the cannot efficiently, resolve.
Australian education system.DOWNSTREAM PETROLEUM
National
fuel quality
standards
KEY MESSAGES
• The Australian Government regulates fuel • Cleaner fuels require major refinery
quality standard with a view to improving investment, cost more to produce and
urban air quality (reduced smog and lead to higher CO2 emissions from
particulates), reduce greenhouse gas refineries.
emissions, and improve vehicle fuel
• AIP and member companies support
efficiency. Standards can also facilitate
improved fuel standards and are working
the introduction of advanced engine
towards meeting the Government’s
technologies.
implementation date of 2027.DOWNSTREAM PETROLEUM
AIP supports appropriate national fuel quality Over the past decade the Australian refining
standards to facilitate the introduction of sector has invested well over $3 billion to
advanced engine technologies and so help implement the Australian Government’s
reduce scientifically established urban air Cleaner Fuels Program.
quality impacts.
This program was designed to help
The Fuel Quality Standards Act 2000 provides significantly improve urban air quality,
the regulatory framework for fuel quality including an 80 per cent reduction in nitrogen
standards in Australia. AIP continues to oxides by 2020. New vehicle technologies,
work closely with governments and the motor particularly high compression, direct injection
vehicle industry to ensure that fuel quality petrol engines and high compression,
standards are consistent across Australia, common rail diesel engines will enable further
and predictable, so that participants in the improvements in fuel economy and lower
market have sufficient time to implement and emissions to be achieved.
adjust to any new standards.
REDUCTION IN VEHICLE EMISSIONS
FROM CLEANER FUELS
2,000 2010 2020
0%
-10%
-20%
-30%
-40%
-50%
-60%
-70%
-80%
-90%
Hydrocarbons Benzene 1,3-Butadiene Oxides of nitrogen Particulate matter (PM10) Carbon MonoxideDOWNSTREAM PETROLEUM
Modelling of Victorian air quality by CSIRO confirms these reductions in motor
vehicle emissions and projects that by 2030 emissions from motor vehicles
will become a relatively small source of nitrogen oxide emissions compared to
other domestic and industrial sources.
AVERAGE DAILY NOx REFORMS TO
EMISSIONS: AUSTRALIAN FUEL
Tonnes per day
STANDARDS
In late 2016, the Australian Government
established a Ministerial Council on
Vehicle Emissions to review Australia’s fuel
standards, along with reviews into both
vehicle emissions standards to reduce
noxious emissions, and fuel efficiency
standards to reduce carbon emissions.
Following broad and extensive
consultation, the Government
announced in 2019 that the best option
to meet its objectives is to:
• Reduce sulfur in petrol to 10 parts per
millions from 1 July 2027
• Retain regular unleaded petrol
• Reduce the pool average of aromatic
content in petrol from 42 per cent to 35
per cent, effective 1 January 2022
• Review the aromatic content in petrol
limit by 2022 to set a reduced limit
by 2027 or establish an alternative
solution
• The Department is continuing to
consult with industry on the remaining
parameters in the fuel standards
to finalise these before the current
standards sunset on 1 October 2019.
This timeline for implementation provides
the best balance between delivering
environmental improvements and minimising
any impacts on consumers, whilst also
providing long term policy certainty to the
local refining industry to facilitate potential
investment and business decisions. It
Source: CSIRO also provides certainty for the vehicle
industry over the next decade to facilitate
the introduction of the latest vehicle
technologies.DOWNSTREAM PETROLEUM
THE GOVERNMENT’S DECISION REFINERY TRANSITION
ALSO INCLUDES CONCRETE TO 10PPM GASOLINE
STEPS BY INDUSTRY AND THE
GOVERNMENT ALONG THE Australia’s four refineries will
IMPLEMENTATION TIMEFRAME collectively be required to invest
TO DEMONSTRATE ONGOING around $1bn. Refineries also require
PROGRESS. long lead times to design, construct
and commission the necessary
infrastructure, whilst also ensuring
This includes a substantial review in 2022,
continuity and security of supply of
to determine aromatic limits in petrol from
fuel for all Australians:
2027, when there will be greater clarity
in the market and regulatory environment • 2 Year pre-FEED (Front End
internationally for both the refining and Engineering and Design)
car industries. - $15m detailed investigations of
AIP public submissions throughout feasible options including internal
the review process have consistently and contract resources (internal
demonstrated that the sulfur and aromatic resources don’t exist)
levels in petrol available to Australian - complex mathematical models to
motorists are already substantially below ascertain feasibility
the regulated limits. Importantly, the
Industry has committed to report to - Board or corporate approval for
Government annually to safeguard this expenditure
existing fuel quality over the transition - 5 Year Construction
period to the commencement of the new
- Establishment of engineering
petrol standard.
project teams
- Detailed design works across
multiple complex refining assets
- Tendering multiple design packages
(e.g. mechanical, civil etc).
- Detailed discussion with statutory
bodies for scope of approvals
- Community and local industry
engagement
- Coordination of works with
operation of existing facilities
This Government decision, in particular
the timeframe provided, acknowledges - Pre-commissioning and
the very significant investment that would commissioning of works
need to be made by the Australian • 3 year turnaround (long term
refining industry whilst meeting the maintenance) coordination
challenges of continuing strong
competitive pressures from larger - Each refinery is on a different
refineries in the Asia Pacific region. It turnaround cycle
highlights the importance the Government - Out of program turnarounds greatly
places on the economic contribution of increase cost and risk
domestic refineries, particularly in their
local communities, and in supporting
supply reliability and security to the local
market.You can also read