Deliverable 8.1 Market Research - uptime
←
→
Page content transcription
If your browser does not render page correctly, please read the page content below
Project No: 768634
                            Call: H2020-FoF-2017
                             Topic: FoF-09-2017
                             Type of Action: IA
                      Duration: 01.09.2017 – 31.08.2020

                      Deliverable 8.1
                      Market Research
Lead Beneficiary      Mews Partners
Type of Deliverable   Report
Dissemination Level   Public
Submission Date       31.03.2019
Version no.           2.0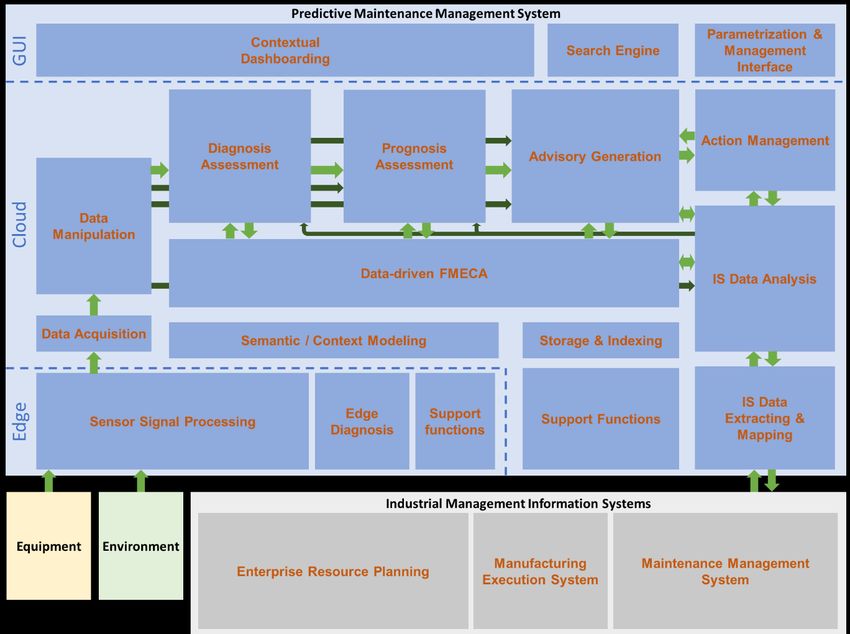
PUBLIC Versioning and contribution history Version Description Contributions 1.0 First release (M9) Mews Partners 2.0 Second release (M18) Mews Partners Reviewers Name Organisation Yves Keraron ISADEUS Vasilis Boursinos MAILLIS Stathis Anastasiou MAILLIS Copyright UPTIME Consortium 2017-2020 Page 2 / 56

Table of Contents
       List of Figures................................................................................................................................... 4
       List of Tables .................................................................................................................................... 4
       List of Abbreviations ........................................................................................................................ 5
Executive Summary ................................................................................................................................. 6
1.     Introduction ..................................................................................................................................... 7
     1.1.     Objectives ................................................................................................................................ 7
     1.2.     Links to other deliverables ...................................................................................................... 7
2.     Maintenance Market Overview ...................................................................................................... 8
     2.1.     Traditional maintenance market situation .............................................................................. 8
     2.2.     Opportunities offered by new technologies ......................................................................... 10
     2.3.     Maintenance stakeholders .................................................................................................... 11
     2.4.     Adoption of new types of maintenance ................................................................................ 13
3.     UPTIME Value Proposition Definition ........................................................................................... 14
     3.1.     UPTIME Vision ....................................................................................................................... 14
     3.2.     Functional map ...................................................................................................................... 15
     3.3.     Innovative Exploitable Assets ................................................................................................ 16
     3.4.     Resulting Value proposition .................................................................................................. 21
4.     Competitive Analysis ..................................................................................................................... 23
     4.1.     Predictive maintenance competitive landscape ................................................................... 23
     4.2.     Functional benchmark ........................................................................................................... 26
5.     Market approach towards PdM .................................................................................................... 27
     5.1.     Client’s needs and challenges ............................................................................................... 27
     5.2.     How do end-users tackle PdM? ............................................................................................. 29
     5.3.     Receptivity towards UPTIME Value Proposition ................................................................... 31
6.     Business opportunity assessment ................................................................................................. 36
     6.1.     Market segmentation ............................................................................................................ 36
     6.2.     Market prioritization ............................................................................................................. 38
       6.2.1 Sector attractiveness (Y-axis) ............................................................................................... 38
       6.2.2 UPTIME’s business strength (X-axis) .................................................................................... 39
     6.3.     Business opportunity assessment ......................................................................................... 43
       6.3.1 Pricing analysis ..................................................................................................................... 43
       6.3.2 Market assessment .............................................................................................................. 44
     6.4.     Recommendations on market positioning ............................................................................ 48
7.     Conclusion ..................................................................................................................................... 51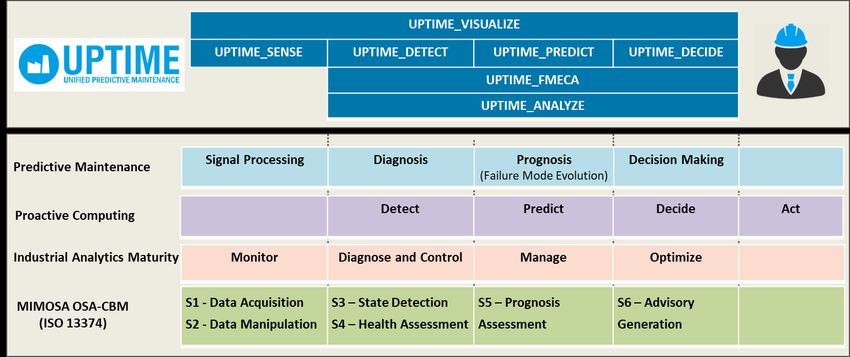
PUBLIC References ............................................................................................................................................. 52 Appendix A – Competitive analysis methodology ................................................................................. 53 Appendix B – Market analysis methodology ......................................................................................... 55 List of Figures Figure 2-1 – Repair, maintenance and installation (C33) turnover in Europe (EUR million) – Source Eurostat ................................................................................................................................................... 9 Figure 2-2 – Value Chain of Predictive Maintenance ............................................................................ 12 Figure 2-3 – Readiness to implement (Source BCG survey) .................................................................. 13 Figure 3-1 – The UPTIME Concept ........................................................................................................ 15 Figure 3-2 – UPTIME functional map (v9) ............................................................................................ 16 Figure 3-3 – IEA approach to reduce project complexity ...................................................................... 17 Figure 3-4 – Convergence process during UPTIME meeting ................................................................. 19 Figure 3-5 – IEA K-brief template .......................................................................................................... 20 Figure 5-1 – Perceived benefits of PdM (source: PwC study) ............................................................... 27 Figure 5-2 – Criteria to determine the criticality of assets .................................................................... 29 Figure 6-1 – Attractiveness-Strength Matrix Framework...................................................................... 41 Figure 6-2 – UPTIME Attractiveness-Strength Matrix ........................................................................... 42 Figure 6-3 – Evaluation of the PdM market for UPTIME based on OEE approach (top-down) and pricing approach (bottom-up) ........................................................................................................................... 45 Figure 6-4 – Estimated UPTIME market potential by sector (million EUR) ........................................... 47 Figure 6-5 – UPTIME Attractiveness-Strength Matrix with market potential ....................................... 49 Figure B-1 – Breakdown of the participants per country ...................................................................... 56 List of Tables Table 1-1 – Link to other deliverables .................................................................................................... 7 Table 2-1 – Stakeholders in Predictive Maintenance (PdM) ................................................................. 11 Table 3-1 – UPTIME IEA list ................................................................................................................... 18 Table 4-1 – Functionalities comparison ................................................................................................ 26 Table 6-1 – Market segmentation ......................................................................................................... 37 Table 6-2 – Sector Attractiveness by Market Segment ......................................................................... 39 Table 6-3 – UPTIME’s Business Strength by Market Segment .............................................................. 40 Table 6-4 – PdM deployment project cost structure ............................................................................ 44 Table 6-5 – UPTIME’s Market Sizing by Market Segment ..................................................................... 46 Table A-1 – List of investigated potential competitors ......................................................................... 53 Table A-2 – List of comparison criteria .................................................................................................. 54 Copyright UPTIME Consortium 2017-2020 Page 4 / 56
PUBLIC
List of Abbreviations
Abbreviation Meaning
CMMS Computerized Maintenance Management System
ERP Enterprise Resource Planning
MES Manufacturing Execution System
MVP Minimum Viable Product
Nomenclature of Economic Activities = Nomenclature des Activités
NACE
économiques dans la Communauté Européenne in French
OEE Overall Equipment Effectiveness
P3M Predictive Maintenance Management Model
PdM Predictive Maintenance
PLC Programmable Logic Controller
RUL Remaining Useful Life
SCADA Supervisory Control And Data Acquisition
UPTIME Unified PredicTIve Maintenance systEm
Copyright UPTIME Consortium 2017-2020 Page 5 / 56PUBLIC
Executive Summary
This document is the second release of Deliverable 8.1 “Market Research” of UPTIME project, a project
supported by European Union’s Horizon 2020 research and innovation program under grant
agreement No. 768634. For more information on this project, please refer to the following website
https://www.uptime-h2020.eu/.
As the UPTIME market research report, this deliverable presents:
- An overview of the predictive maintenance market in Europe in order to understand its
ecosystem and value chain, identify its drivers and opportunities;
- A competitive analysis to identify where UPTIME stands towards competition and its key
differentiators;
- The UPTIME value proposition that introduces UPTIME added value with respect to the market
needs and competition;
- A market receptivity analysis with a feedback about UPTIME Value proposition
- A market prioritization analysis that identifies the most promising market segments for the go-
to-market strategy
- A business opportunity assessment that evaluates with concrete figures the size of the market
within reach of UPTIME
- A strategic analysis that combines all the aspects depicted above to guide the exploitation
strategy.
Two releases of the report have been planned in order to provide inputs to the development of the
UPTIME system and components (D8.1a due at M9) and to propose recommendations to the
Consortium on the positioning of UPTIME (D8.1b due at M18). Compared to the first release that has
been published at M9, the second one provides a deeper strategic analysis thanks to a further
competition and market analysis.
Copyright UPTIME Consortium 2017-2020 Page 6 / 56PUBLIC
1. Introduction
As an introduction, this section presents the objectives of this deliverable and the links it has to other
deliverables of the UPTIME project.
1.1. Objectives
The objective of this deliverable is to define a successful strategic positioning for UPTIME. To do so, we
shall define:
What is our unique value proposition
Who are our target customers and how we can reach them
As such, the competitive analysis aims at:
Understanding the ecosystem of predictive maintenance & identify market trends
Identifying how UPTIME positions itself towards competition
Proposing recommendations on how UPTIME should be exploited
Simultaneously, the market analysis aspires to:
Understand potential client’s needs
Test receptivity of UPTIME value proposition
Identify perceived strengths & weaknesses
This general approach has been considered rather as a guideline than as a formal methodology. It is
important to understand that these goals are not decorrelated, as they nourish and feed themselves
from each other. Specifically, the market and competition analysis can fine-tune and refine the
identification of the IEAs and adjust UPTIME value proposition.
1.2. Links to other deliverables
The current deliverable is related to several other ones of the UPTIME project, as presented below in
Table 1-1.
Table 1-1 – Link to other deliverables
Deliverable Nature of the relationship
D1.1 Catalogue of PdM Models,
Output: List of potential competitors
Techniques, Platforms (RINA)
D1.2 UPTIME PdM Management Model Input: UPTIME MVP and functional map
and MVP (MEWS) Output: UPTIME MVP recommendations
D2.1 Conceptual Architecture and
Input: UPTIME architecture and functionalities
System Specification (ICCS)
D7.2 Dissemination, Awareness Creation Output: UPTIME Value proposition and market
and Communication Kit (ISADEUS) segmentation
D8.2 Business Model, Exploitation and Input: IEA
Innovation Management (MEWS) Output: Strategic analysis and recommendations
Copyright UPTIME Consortium 2017-2020 Page 7 / 56PUBLIC
2. Maintenance Market Overview
To identify how UPTIME can and should create value in the maintenance market, it is first crucial to
understand the market, its drivers, its current opportunities and challenges. Thus, section 2 presents
the status of the maintenance market that may be currently shifting towards predictive maintenance.
2.1. Traditional maintenance market situation
Maintenance holds a strategic position in companies’ activities. Its strategy can greatly vary from one
structure to another. It can either be internalized with in-house dedicated teams or outsourced to
maintenance service providers, either partially or fully. The drivers, opportunities and challenges of
the industrial end-users in maintenance can then be derived from the study of the outsourced
maintenance market that will be detailed in section 2.1.
Industrial maintenance service providers have long benefited from structural drivers (outsourcing
maintenance to subcontractors, making industrial equipment more complex, etc.). But in a market that
is gradually maturing, the game is changing. Today, strategic changes must be made, particularly to
break the race to the lowest bidder. A historical trend that is gradually leading the profession into a
dangerous deflationary spiral and pushing some customers to reinternalize repair and maintenance
work, as managers are not fully satisfied with the quality of services in relation to costs.
While industrial maintenance service providers have been used to an average annual growth rate in
Europe of more than 6% since the early 2000s, the dynamic has tended to slow down since 2009. The
economic crisis and the difficulties encountered by client companies have resulted in a record number
of company failures and closures of production units, accentuating the structural phenomenon of
deindustrialisation.
Moreover, the growth potential in the petrochemical and steel site maintenance segment, the sector's
two main opportunities according to Xerfi1, is currently particularly low. Almost all the companies have
already outsourced these functions, only carrying out the exploitation of their operations: as an
example, groups operating petrochemical sites (Total, ExxonMobil, Ineos, Solvay, etc.) are already
outsourcing all maintenance tasks.
It is also difficult for maintenance stakeholders to conquer new markets. The sectors that could be
potentially the most promising, such as the agricultural and food industries or the pharmaceutical
industry, are still only opening up to outsourcing to a limited extent.
More than the high cost, the main obstacle is confidentiality. Companies do not want their
manufacturing secrets to be disclosed by outside parties. The risks of loss, over the years, of technical
expertise and know-how are also put forward as reasons for not using subcontractors.
As a result, the average outsourcing rate (share of activity outsourced to external companies) in the
field of industrial maintenance in Europe has been capped at around 35% since 2010. In the absence
of this main driver of growth, the activity of maintenance generalists tends to run out of breath.
According to Eurostat, industrial maintenance, repair and installation in Europe represented
approximately 170 billion euros in 2015 as shown in Figure 2-1.
1 Xerfi, Le marché de la maintenance industrielle à l’horizon 2018
Copyright UPTIME Consortium 2017-2020 Page 8 / 56PUBLIC
175.000
170.000
165.000
160.000
155.000
150.000
145.000
140.000
2011 2012 2013 2014 2015
Figure 2-1 – Repair, maintenance and installation (C33) turnover in Europe (EUR million) – Source Eurostat
The deterioration of the economic environment has also aggravated the decrease in the activity of
maintenance contractors in recent years. Faced with shrinking order volumes and uncertain prospects,
decision-makers have been forced to make trade-offs. The budgetary restrictions imposed by industrial
firms have been particularly focused on maintenance, one of the main items of expenditure, which
effects are not immediately quantifiable. Moreover, the capacity utilisation rate in industry has
remained below the long-term average since 2009, potentially resulting in fewer breakdowns and
malfunctions. However, this trend is expected to reverse as economic conditions improved since 2015.
One factor that weighs on the profession's turnover is prices. While they increased by 2.8% in 2012,
the rates for repairs and maintenance of industrial sites increased by only 0.8% in 2015. Maintenance
service providers face strong market power from their customers, which has been increasing in recent
years. Companies no longer hesitate to renegotiate their contracts and seek to use competition to
obtain the most advantageous prices. It is thus becoming increasingly difficult for maintenance and
repair operators to pass on price increases to customers.
Of course, the drivers of growth are less strong today compared to the prosperous periods of the
2000s. However, industrial maintenance professionals will always benefit from a comfortable growth
rate. According to Xerfi estimations, the turnover of "unit outage" specialists averages 4.3% per year
between 2016 and 2018. It must be said that maintenance contracts run over several years, so
operators in the profession benefit from recurring revenues and are therefore less sensitive to
economic conditions. Moreover, with the improvement of their business prospects, contractors will
have the means to be more aggressive, in particular to implement new maintenance strategies, in
connection with industrial modernization projects.
Copyright UPTIME Consortium 2017-2020 Page 9 / 56PUBLIC
2.2. Opportunities offered by new technologies
As stated above, the maintenance market is gradually maturing with common expertise and technical
know-how does not provide a competitive advantage to maintenance service providers anymore.
Faced with market saturation and margins under pressure, subcontractors can be easily interchanged.
In that context, maintenance stakeholders are seeking to expand their offer towards more
remunerative services, particularly predictive maintenance.
Extensive literature details the types of maintenance strategies that can be followed, with new
maintenance services that appeared thanks to new technologies:
Reactive or curative or corrective maintenance: Fix when asset is broken
Preventive maintenance: Fix before asset is broken
Maintenance optimization
o Planned or systematic maintenance: Maintenance action conducted regardless of
Ease of implementation
asset condition or with visual and instrument inspections
o Condition-based maintenance: Diagnosis based on data collected from sensors
placed on asset, with analytics assessing its present condition (anomaly detection)
o Predictive maintenance: Prognosis based on the evolution of data, with advanced
analytics on real-time and historical data assessing its future condition (failure
prediction)
o Prescriptive maintenance: Assisted decision-making with action recommendation
based on prognosis and workflow management (maintenance vs. production
optimization)
Now, the traditional maintenance market which was essentially based on reactive and planned
maintenance is currently shifting towards condition-based and predictive maintenance. The main tools
needed to implement new maintenance services already exist: sensors, PLCs, big data, IoT, cloud
computing. This makes it possible to detect faults before they occur, based on the information
recorded by the sensors and the data history.
Like electronic components (microprocessor, battery, memory, radio device for data transfer), the cost
of manufacturing sensors tends to be reduced thanks to improved production processes and
economies of scale. The cost of sensors vary from euros cents to thousands of euros depending on
their quality, the type of data they collect, the environment in which they are installed, etc. The cost
of adding chips for capturing and wirelessly transmitting information from the physical world is
becoming so low that any industrial equipment manufacturer may now wonder whether it is worth
adding a form of "intelligence" to its products.
However, the benefits of these new maintenance services must be confronted with the complexity of
their implementation and the investments needed upfront. The choice will then depend, among
others, on the criticality of assets and the savings that these new maintenance services will enable.
These considerations will be further developed in section 5.2.
Copyright UPTIME Consortium 2017-2020 Page 10 / 56PUBLIC
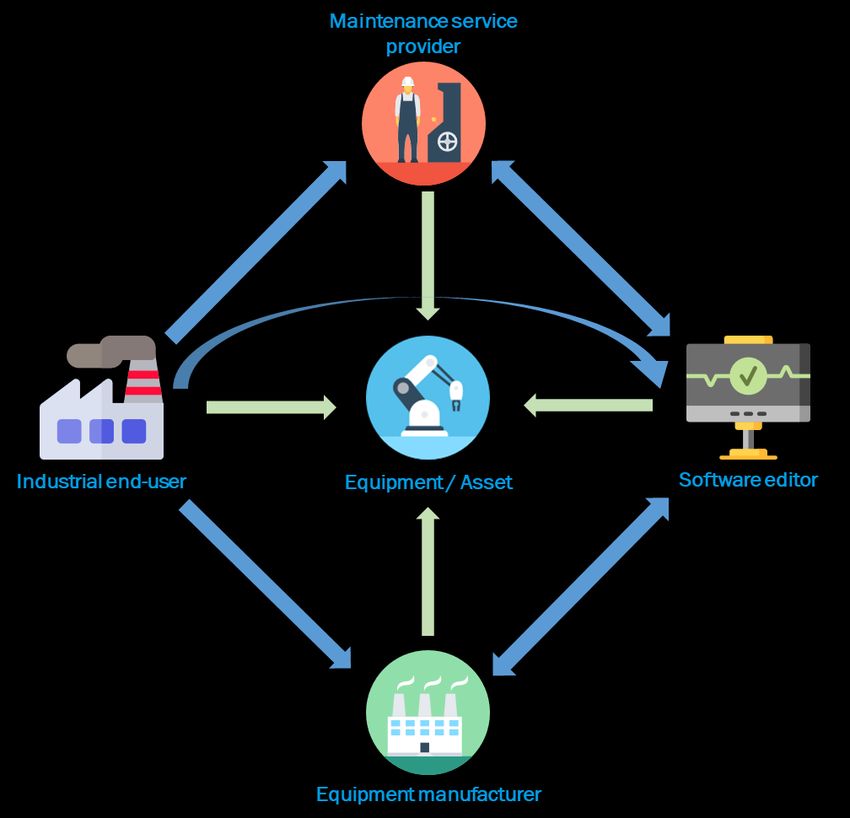
2.3. Maintenance stakeholders
A clear overview of stakeholders involved in predictive maintenance value chain is important to
analyse the context and market for UPTIME, to formulate value propositions and identify optimal
communication channels. The different types of stakeholders relevant to this market research are
presented below in Table 2-1:
Table 2-1 – Stakeholders in Predictive Maintenance (PdM)
Stakeholder group Type Interest in PdM Description Example of organizations
Maximizing OEE End-users that use
Potential Reduce equipment and
Industrial end-users Cf. Figure 2-2
adopter maintenance machines that require
costs maintenance
Bouygues, CMI, Fives
maintenance, Eiffage,
Third-parties that have SODI, Ponticelli, Fouré
Potential
Maintenance service Selling PdM been contracted to Lagadec, Christof
adopter /
providers solutions ensure the maintenance industries, EuroMaint Rail,
partner
of plant’s equipment Infinite Group, Fluor,
Endress+Hauser,
QuantService, NCH Europe
Manufacturers that
Potential Selling an
Equipment produce the equipment General Electric, Siemens,
adopter / integrated PdM
manufacturers used in plants by end- Bosch
partner solution
users
IBM, Oracle, Microsoft,
Companies that develop
SAP, C3 IoT, Uptake,
Software editors and Selling PdM the information systems
Potential partner Dassault Systèmes, PTC,
integrators solutions to allow predictive
Intergraph, Aveva,
maintenance
Bentley, OSI Soft
Industrial end-users may choose to carry out repair and maintenance work in-house by a
dedicated team. If so, they prefer to keep control of this type of activity internally. The choice
to internalize maintenance activities is increasingly made possible thanks to technological
innovations. In that case, they will rely on technological providers such as software editors for
their CMMS and/or Predictive Maintenance (PdM) solutions.
On the other hand, some industrial end-users may choose to contract maintenance service
providers to benefit from their know-how, optimise personnel management, make their costs
more flexible or focus their activities on their core business. In that case, maintenance
software providers either rely on technological partners to develop their PdM solution or
develop in-house expertise. This category includes generalist maintenance service providers
and also mono-sectoral maintenance service providers.
Equipment manufacturers increasingly tend to offer "all-inclusive" solutions to industrial end-
users including the supply, financing, installation and maintenance of equipment. The
objectives are multiple: to provide new sources of revenue, offer services with higher added
value, develop recurring revenue through multi-year contracts or even differentiate
themselves from competition. This competition from equipment manufacturers is expected to
continue and even intensify in the next years. In that case, similarly to maintenance software
Copyright UPTIME Consortium 2017-2020 Page 11 / 56PUBLIC
providers, they either rely on technological partners to develop their PdM solution or develop
in-house expertise.
The software editors and integrators are rushing into the new market segment offered by
predictive maintenance: IBM, Microsoft, SAP have developed a predictive maintenance offer
thanks to their expertise in Big Data, IoT and machine learning. These digital giants and start-
ups could thus disrupt the competitive environment of PdM by capturing a growing share of
the value. This category includes generalist software editors, start-ups specialized in predictive
maintenance solutions and CMMS editors.
The relationships between these stakeholders in the value chain are represented below in Figure 2-2:
Figure 2-2 – Value Chain of Predictive Maintenance
Towards each one of these stakeholders, UPTIME approach and strategy will differ according to its
value proposition. In particular, equipment manufacturers, maintenance service providers and
software editors can be either seen as potential competitor or as potential partners.
Copyright UPTIME Consortium 2017-2020 Page 12 / 56PUBLIC
2.4. Adoption of new types of maintenance
The leaders of maintenance service providers, such as Cofely Endel, PPM (Emcor) or Actemium (Vinci
Energies) make predictive maintenance a major development axis. This theme is most often integrated
into future plant projects. It is about designing smarter plants and making the product more relevant,
more optimized, without interruption, without defects. These new generation production lines
integrate computerized systems which consequently allow for improved maintenance.
As such, players such as Fives or Vinci Energies are seeking to take the leadership of the Industry 4.0.
It is by becoming technological prescribers for "smart" plant projects that the maintenance
stakeholders will succeed in becoming true partners of the principals, and not simple subcontractors
subject to pressure on prices.
According to a BCG analysis report, Digital Manufacturing technologies could help reduce production
costs (excluding raw materials) by 20 to 40 percent. Industrial end-users, though aware of the benefits
that digital manufacturing technologies can deliver, struggle to effectively adopt and implement digital
technologies. According to that same BCG study, almost half of the interviewed industrial organizations
are not yet prepared for the arrival of new technologies for digital manufacturing, as presented below
in Figure 2-3.
Not yet prepared
Developed first concepts
Developed clear business case
Implemented first measure
Full concept in implementation
0% 5% 10% 15% 20% 25% 30% 35% 40% 45%
Figure 2-3 – Readiness to implement (Source BCG survey)
According to a PwC report that surveyed 280 industrial end-users in Europe, two-third of respondents
are still conducting visual and instrument inspection in their maintenance strategy. Only 11% of
respondents claim having deployed predictive maintenance capabilities. A 2014 study by RolandBerger
found that only 15% of time was spent on predictive maintenance activities vs. 40% on reactive
maintenance and 45% on preventive maintenance. As a result, only 22 percent of managers were
happy with their maintenance programs.
However, according to a Momenta Partner report, predictive maintenance analytics solutions is
expected to grow to be a $24 billion market, globally, by 2019 with the more advanced segments of
the market – predictive and prescriptive maintenance – likely to grow the most. These categories will
account for the majority (over 60 percent) of the maintenance analytics market by 2019 increasing
from only 23 percent in 2014.
Copyright UPTIME Consortium 2017-2020 Page 13 / 56PUBLIC
3. UPTIME Value Proposition Definition
The value proposition is a marketing statement for potential customers to make them understand the
value and give them the willingness to buy. It should highlight that the product will bring more value
than other similar offerings. We need to highlight what differentiates us from the competition, and
clearly explain UPTIME positioning.
Then, UPTIME Value Proposition should stem from UPTIME vision and architecture (detailed in section
3.1), its functionalities (detailed in section 3.2) and its innovative exploitable assets (detailed in section
3.3).
3.1. UPTIME Vision
The UPTIME vision detailed below has been presented in the Deliverable 2.1 “Conceptual Architecture
and System Specification”.
The UPTIME vision is based upon the predictive maintenance background, the technological pillars of
Industry 4.0, IoT and proactive computing as well as the baseline existing tools in the consortium. The
UPTIME aims to enable the predictive maintenance implementation in manufacturing firms with the
aim to maximize the expected utility and to exploit the full potential of predictive maintenance
management, sensor-generated big data processing, e-maintenance, proactive computing and
industrial data analytics. UPTIME will be able to be applied in the context of the production process of
any manufacturing company regardless their processes, products and physical model used. The
unification of the novel e-maintenance services and tools will lead to overcoming of the existing
commercial software and research prototypes limitations and will conclude in a novel predictive
maintenance solution covering the whole prognostic lifecycle. Unification is achieved by bringing
together approaches, tools and services each one of which implements a different phase of the
predictive maintenance architecture in order to effectively support different enterprise management
layers, i.e. operational (e.g. maintenance engineers), management (e.g. factory manager), strategic
(e.g. board of directors) by aggregating and interpreting data captured from the production system
and effectively sharing the massive amount of information throughout the whole organization, both
horizontally and vertically. For example, a maintenance engineer is interested in the real-time
visualization of results (diagnostics, prognostics, recommendations, etc.) for conducting his day-to-day
duties; the factory manager is interested in an aggregation of information at a week level for studying
the number and type of failures, the implemented actions, etc., while the board of directors require a
more aggregated form of information, e.g. for studying (e.g. in the form of reports) the production
process performance at a monthly level.
UPTIME aims to reframe predictive maintenance strategy in a systematic and unified way.
Furthermore, it aims to enable the transition of maintenance strategy from time-based, preventive, to
condition based, predictive by utilizing the most recent advancements in maintenance management
and computer science. The UPTIME e-maintenance services will provide the required support for real-
time information processing through all the steps of the unified predictive maintenance framework. In
addition, they will provide the capability of configuring various parameters at the design time, offline,
for taking into account expert knowledge and of visualizing the current and the predicted state of the
production system through an associated dashboard. To provide effective guidance, support and
information sharing to maintenance engineers as well as to other enterprise management levels, the
extended UPTIME e-maintenance services will address the various steps of the unified predictive
maintenance approach and will incorporate interconnections with other industrial operations related
to production planning, quality management and logistics management.
Copyright UPTIME Consortium 2017-2020 Page 14 / 56PUBLIC
The UPTIME vision converges and synthesizes predictive maintenance, proactive computing, the
Gartner’s levels of industrial analytics maturity and the ISO 13374 as implemented to MIMOSA OSA-
CBM, in order to create a consistent basis for a generic predictive maintenance architecture in an IoT-
based industrial environment. In this way, the Operational Technology and the Information Technology
can also be converged in the context of Industry 4.0. Figure 3-1 depicts the relationships among these
concepts and their aggregation to UPTIME_SENSE, UPTIME_DETECT, UPTIME_PREDICT,
UPTIME_DECIDE, UPTIME_ANALYZE, UPTIME_FMECA and UPTIME_VISUALIZE phases.
Figure 3-1 – The UPTIME Concept
3.2. Functional map
The Functional Map for the UPTIME Solution is a tool that constantly evolves to reflect the latest shared
understanding of the partners involved in its development. As a result, the elements detailed here will
evolve in time.
The reference version at the time of the creation of the first version of this deliverable is version 9, as
shown in Figure 3-2. A detailed version of this functional map is available on Deliverable 1.2 (D1.2).
Copyright UPTIME Consortium 2017-2020 Page 15 / 56PUBLIC
Figure 3-2 – UPTIME functional map (v9)
3.3. Innovative Exploitable Assets
The first step of the exploitation process we conducted consisted of:
identifying the main research project expected outcomes,
detecting the most promising results from an exploitation point of view: the “IEA” (Innovative
Exploitable Assets),
assessing their potential of innovation (in which extent, we are developing something new).
We started the exploitation plan by the identification of IEAs (Innovative Exploitation Assets), as shown
below in Figure 3-3:
1. to reduce the complexity of exploitation by managing smaller pieces that could have value for
exploitation,
2. to bring a common understanding of UPTIME results, enabling partners from different domain
and having different prospective to converge (different objectives, cultures, background).
Our approach with IEA has helped partners to have a clear understanding of all project outcomes,
products, services and knowledge generated within the project that could potentially be exploited.
Copyright UPTIME Consortium 2017-2020 Page 16 / 56PUBLIC
Figure 3-3 – IEA approach to reduce project complexity
The identification of the IEA has been done by cross-checking UPTIME general description, the
architecture, the functional map presented in section 3.2 and the functionalities prioritized with KANO
model (detailed in D1.2).
We set up a preliminary list of IEAs at the beginning of the project, as presented in Table 3-1. This list
has been updated with the partners all along the project, through periodical reviews: it has been
expanded and amended with emerging exploitation ideas throughout the project lifetime.
Copyright UPTIME Consortium 2017-2020 Page 17 / 56PUBLIC
Table 3-1 – UPTIME IEA list
IEA Owner Individual Value Proposition
Capture data from a high variety of sources and bring configurable
diagnosis capabilities on the edge for real-time applications: Sensor &
1) Modular Edge Data Collection &
BIBA recipient agnostic hardware abstraction gateway; Adaptive & flexible
Diagnosis
data collection & diagnosis tool chain; Efficient stream data processing on
the edge with cloud functionality
2) Structured & contextualized Create « templated » mappings from custom schema to reference
UBITECH
industrial data platform schema through a simple graphical mapping tool
Providing a simple and configurable interface to transfer time-series
based data (such as sensor streams) from the edge to the further
3) Mapping & Extracting of Equipment centralized modules by guaranteeing annotations with necessary meta
BIBA
data information, interfaces to different and extensible hardware types (from
basic sensors over PLCs to complex information such as images) as well as
providing data cleaning and wrangling functionality.
Uplifting maintenance-related data from legacy and operational systems
in various ways (e.g. as files or via APIs), extracting the data schema and
4) Mapping & Extracting of Legacy DB SUITE5
semi-automatically identifying the relevant model mappings to the
UPTIME reference model
5) Configurable Diagnosis & Health Intelligent diagnosis to provide a reliable interpretation of the asset’s
BIBA
Assessment health
Advanced prognostic capabilities, using generic algorithms or specifically
6) Configurable Prognosis BIBA
tailored ones depending on need for optimization and user expertise
Provide continuously improved recommendations of optimal
7) Continuously Improved Proactive
ICCS maintenance actions and optimal times of their implementation based on
Action Recommendation
historical data and real-time prognostic results
Ensuring that up-to-date enterprise data are always in the loop of
predictive maintenance by extracting rules and patterns and by gathering
8) Analysis of Legacy DB SUITE5
insights from existing data with the help of various analytics algorithms,
partly addressing the cold start problem
9) Maintenance Actions Manage predictive maintenance actions & their implementation:
Parametrization & Management UBITECH scheduling, traceability with links to existing systems for a consistent
interface management of the maintenance
10) Industrial data dashboarding & Configurable visualization to save time analyzing data and getting
PTA
visualization insights, to support decision making and develop new solutions
Estimation of possible failure modes and risk criticalities evolution based
11) Data-driven FMECA RINA
on measured physical parameters
Copyright UPTIME Consortium 2017-2020 Page 18 / 56PUBLIC
To prepare the exploitation of the results of UPTIME, we captured the most critical information of each
IEA in a single structured document to be used as printed A3 – called Knowledge Brief (or K-Brief).
K-Brief was a powerful tool being used to share efficiently key information, facilitate discussions and
support decisions between partners. Its template is presented in Figure 3-5.
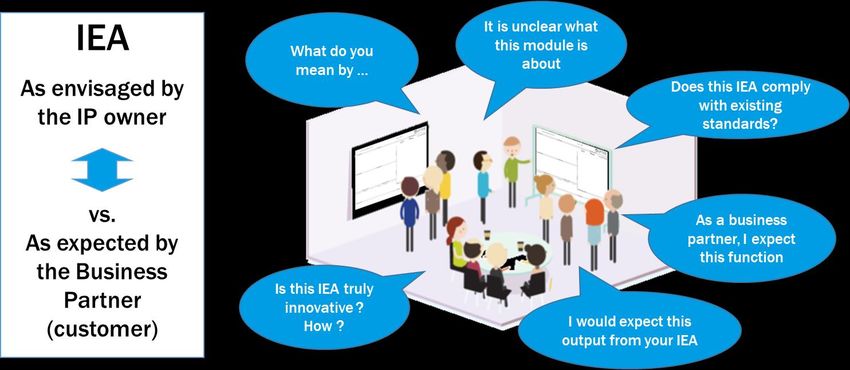
For each IEA, the value must be characterized by the IEA producer (who “pushes” its value proposition)
and by the business scenario (who “pulls” its expectations).
The producer of the IEA is the Owner of the related K-brief. The role of the owner is to:
Promote the IEA,
Identify the key contributors and business partners to involve,
Plan and lead reviews on his K-brief,
Ensure the progress of the K-Brief,
Share and communicate on his work package using the K-brief.
K-brief is an effective way to help partners convergence (as shown in Figure 3-4): technical and
academics partners providing IEA (push) and business partners supposed to use IEA (pull). It has been
a continuous convergence process all along the project, as depicted in the following figure.
Figure 3-4 – Convergence process during UPTIME meeting
Copyright UPTIME Consortium 2017-2020 Page 19 / 56PUBLIC
Figure 3-5 – IEA K-brief template
Left section of the K-brief (Figure 3-5)
The IEA innovation potential is captured in the left section of the K-brief, with analysis of the state of
the art. It allows IEA owner to describe the differences of the innovation proposed by UPTIME
compared to existing competing products and services.
Right section of the K-brief (Figure 3-5)
The link with business scenarios on the right of the K-brief aims to ensure that each feature will be
exploited. In order to provide inputs and to test this research project, three very diverse business cases
are addressed as proof of concept/demonstrators. These IEAs will be assessed regarding the three
application scenarios (on the right side of the knowledge brief).
Copyright UPTIME Consortium 2017-2020 Page 20 / 56PUBLIC
3.4. Resulting Value proposition
In order to dispose of an impactful UPTIME description for our contacts to target customers, we took
time to formalize what is UPTIME Value Proposition based on each IEA value proposition and the
functionalities prioritized with KANO model (detailed in D1.2).
The value proposition is a marketing statement for potential customers to make them understand the
value and give them the willingness to buy. It should highlight that the product will bring more value
than other similar offerings. We need to highlight what differentiates us from the competition, and
clearly explain UPTIME positioning.
The objective here is to explain why UPTIME solution will be better than existing ones (distinguish
UPTIME solution from the competition), indicating the level of innovation and our proposal beyond
the state-of-the-art.
This content is useful for our market assessment during the project (for our interviews with target
customers), but above all in the exploitation phases (after the end of the project) each time we need
to discuss with a target customer. After discussions with partners (and before comparing to target
customer and experts’ point of view), the statement that has been selected is the following:
Copyright UPTIME Consortium 2017-2020 Page 21 / 56PUBLIC
A fully adaptable, modular and integrable end-to-end predictive maintenance framework for
industrial & manufacturing assets and high-value products, from sensor data collection to optimal
maintenance planning. Through advanced prognostic algorithms, it predicts upcoming failures or
losses in productivity. Then, decision algorithms recommend the best action to be performed at the
best time to optimize total maintenance and production costs and improve OEE.
Benefits:
Acquisition and analysis of sensor-generated and historical data in an Industry 4.0
environment
Advanced diagnostic and prognostic capabilities for detecting the current health state and
the future behaviour of equipment based on streaming data and FMECA outcomes
Continuously improved proactive decision-making capabilities for mitigating the impact of
future failures and for planning appropriate actions
Our vision is built upon the predictive maintenance concept and our technological pillars (i.e. Industry
4.0, IoT and Big Data, Proactive Computing) in order to result in a unified information system for
predictive maintenance. Our open, modular and end-to-end architecture aims to enable the
predictive maintenance implementation in manufacturing firms with the aim to maximize the
expected utility and to exploit the full potential of predictive maintenance management, sensor-
generated big data processing, e-maintenance, proactive computing and industrial data analytics.
Our solution can be applied in the context of the production process of any manufacturing company
regardless of their processes, products and physical models used.
Key features:
Sense:
o Data aggregation from heterogeneous sources with universal connectivity gateways
o Configurable diagnosis capabilities on the edge
Detect:
o Configurable Asset Diagnosis & Health Assessment
Predict:
o Configurable predictive algorithms to detect trends and estimate the asset's
remaining useful life (RUL) and upcoming conditions
Decide:
o Proactive maintenance action/timing recommendations
o Trade-offs of scenarios to consider alternative actions and impacts on costs
o Continuously improved recommendations over time
Act:
o Action implementation management handled natively or through CMMS interface
Copyright UPTIME Consortium 2017-2020 Page 22 / 56PUBLIC
4. Competitive Analysis
As stated above, the objectives of the competitive analysis are to:
Understand the ecosystem of predictive maintenance & identify market trends
Identify how UPTIME position itself towards competition
Propose recommendations on how UPTIME should be exploited
It goes without saying that this competitor analysis approach is intrinsically linked with the market
need analysis. These two studies were conducted simultaneously as one enriched the other and vice
versa.
4.1. Predictive maintenance competitive landscape
The platform ecosystem is very rich and fragmented. It was not conceivable to investigate all UPTIME’s
potential competitors individually. Based on UPTIME’s IEA, we have identified the major companies
that may be local or global competitors and sorted them in 6 categories:
Maintenance service providers: e.g., Fives Maintenance, CMI Group
Equipment manufacturer: e.g., Schneider Electric, General Electric
Software editors: e.g., IBM, Microsoft Azure, SAP, Oracle
Start-ups: e.g., Braincube, Uptake, SpaceTime Insight
EU research projects: e.g., PROASENSE, Toreador, SPEEDD
End-users internal projects: e.g., SAFRAN Analytics, EDF, SNCF
These categories of competitors offer the same main functionalities as UPTIME either partially or
globally. Depending on the extent of its functionalities overlap, a competitor may be to a greater or
lesser degree relevant towards UPTIME value proposition.
Maintenance service providers and equipment manufacturers are not originally actors of the
computing industry and they use the computing infrastructure of IBM Maximo / Microsoft
Azure / Amazon Services for Cloud and processing capabilities to offer predictive maintenance
solutions. They have developed a custom industry-oriented layer of applications and their
competitive advantage is based on their knowledge and expertise of the industrial
environment. They claim to be the best positioned with their expertise to deploy an adapted
and integrated predictive maintenance strategy. To accelerate the deployment of new
technologies in their processes, maintenance service providers have set up partnerships with
technological partners. For example, Vinci Energies, through its Actemium brand dedicated to
industrials, has partnered with the software editor Augmensys to develop industrial
augmented reality solutions.
The software editors are rushing into this new market segment: IBM, Microsoft, SAP have
developed a predictive maintenance offer thanks to their expertise in Big Data, IoT and
machine learning. These digital giants and start-ups could thus disrupt the competitive
environment of PdM by capturing a growing share of the value. They provide a modular toolkit
environment that enables the development of applications (on-site or Cloud solutions). They
also provide a large range of modules that allows to meet customers’ expectations thanks to
their application marketplace. Thus, they are able to customize applications that meet
companies’ needs (user interfaces or application layers above their infrastructure). Their
Copyright UPTIME Consortium 2017-2020 Page 23 / 56PUBLIC
solutions may be more suited for large firms for custom-made applications and large
deployments.
The predictive maintenance landscape is extremely fragmented and competitive. While numerous
companies highlight their algorithmic capabilities as key differentiators, we find limited differentiation
in technology and lack of adoption from customers. Furthermore, it is unclear if any technology
differentiator will truly emerge to provide companies with enduring advantages.
The competitive environment for maintenance service providers has deteriorated in recent years:
- The market leverage of customers is overwhelming: industrial maintenance being a market
governed by calls for bids, the price is today the main criteria for the choice of customers;
- New players are entering the market: equipment manufacturers increasingly offer “all
inclusive” solutions including the supply, financing, installation and maintenance of
equipment. Their objectives are to develop recurring revenues through multi-year contracts
or to differentiate themselves from the competition;
- Competition from CMMS is intensifying: computer-aided maintenance software (CMMS)
makes it possible to optimize the operation of internal repair-maintenance services. These
tools are based on the prioritisation of the various maintenance operations required. As a
result, customers have less need for maintenance service providers. Among CMMS leaders:
Info, Mismo, CARL International;
- Intra-sector competition is exacerbated by the slowdown in activity and the homogeneity of
supply. Of course, there are differentiation axes (progressive transformation of the actors from
simple curative repair to predictive maintenance), but it has to be said that a large part of the
basic offer is now commonplace and interchangeable
- As a result of strong competitive pressures in the sector, margins are deteriorating over the
medium term. Operators have in fact resorted more frequently to subcontracting and
temporary work in order to make their costs more flexible. They have also had to increase their
expenditure on staff training and certification to operate in sensitive sites, such as for nuclear
maintenance specialists.
In such a context, most maintenance players seek to take the leadership of the cost battle. For
example, new technologies can offer better management of employee productivity. To this end, Cofely
Endel rolled out the "Connected Operator" system to 5,000 employees in 2015. They now have a tablet
and a software suite thanks to which they can consult the project's digital file as well as the various
safety instructions and "good practices" during interventions. In the end, the operator's intervention
time is reduced, and the reporting of operations is made more reliable thanks to the possibility of
taking photos during interventions.
Industrial maintenance leaders are implementing new types of contracts to govern their relationships
with customers. The aim is to better meet customers' expectations in terms of service quality and to
highlight the value of their services to reduce deflationary pressures. The CMI group distinguishes itself
from its competitors by offering several ranges of contracts (from the simplest to the most complex)
to achieve a higher or lower level of performance (intermediate and final). For example, the group
offers a global maintenance contract indexed to production where the remuneration of services is
directly linked to the productivity of industrial equipment.
Historically, maintenance contracts were based solely on an obligation of means. The parties simply
decide on the number of staffs, the frequency of visits to check the proper functioning of the
equipment or the number of materials required. Today, more and more maintenance contracts are
Copyright UPTIME Consortium 2017-2020 Page 24 / 56PUBLIC
based on an obligation for results. Although these seem more restrictive for maintenance service
providers, they nevertheless allow them to have their professionalism better recognised and to
negotiate on criteria other than price. In a performance-based contract, only the result is contractual.
The necessary means used are the responsibility of the maintenance service provider. It must use all
the means necessary to obtain the result: the products used, the processes, the material assistance,
etc.
The CMI group offers a wide range of services in industrial maintenance:
controls and monitoring of equipment
periodic inspections, degradation analyses and repairs
associated mechanical repairs (welding, machining, etc.)
supply and management of spare parts
In order to best meet the expectations of its clients, the CMI group has set up several types of
contracts:
maintenance in controlled expenses where the cost of the intervention is directly function
of the services and the means implemented
maintenance at the bills where the intervention is described in terms of equipment, duration
of services and cost
global flat-rate maintenance which corresponds to the complete coverage of a given area
for a given time and amount
global maintenance indexed to production where the remuneration of services is directly
linked to the production of equipment
delegated maintenance by which customers outsource the management of their
maintenance. Within this framework CMI takes all the necessary measures to ensure the
optimal operation of the tool and achieve the performance objectives set. Delegated
maintenance therefore includes audit, assistance, monitoring and training services that
enable customers to significantly improve the technical performance of their industrial site
without having the responsibility of coordination.
Another avenue explored by professionals is to become pilots (or project management assistants) in
the maintenance sector to advise customers on the increasing complexity of maintenance professions.
ADF develops know-how around four areas of expertise: calculation and related expertise, general
installation and mechanical studies, project management assistance and technical document
management.
ADF offers services in preparation for unit outages. To do this, it relies on maintenance know-how
and a maintenance engineering office that masters the standards intended to guarantee health,
safety and the environment on the site by carrying out risk analysis.
Copyright UPTIME Consortium 2017-2020 Page 25 / 56PUBLIC
4.2. Functional benchmark
In our analysis, we have compared potential competitors by the functionalities that they claim to offer
as marketed on their website.
Table 4-1 – Functionalities comparison
Number of competitors
Feature who claim that they Comments
offer it
Very few of them (5 out of 34) highlight their
configuration and customization capabilities in their
Edge data collection & 34 out of 61 competitors
presentation, stating that it can be an option.
diagnosis (59.6%)
2 out of these 5 specify that it can be done through a
third-party integrator
55 out of 61 competitors Basic functionality for a predictive maintenance
Data Acquisition
(96.4%) platform
30 out of the 52 highlight their health assessment
52 out of 61 competitors
Diagnosis capabilities. The others only send alerts if the sensor
(91.2%)
exceeds a pre-specified threshold
Only 10 out of the 34 offer an existing & configurable
34 out of 61 competitors algorithm repository
Prognosis
(59.6%) Only 14 out of the 34 is compatible with several types
of analytics techniques
Only 6 out of the 17 can take into account production
Advisory generation & 17 out of 61 competitors schedule and costs
decision-making (29.8%) Only 1 out of the 17 provide maintenance scenario
trade-off analysis to consider alternative solutions
None of them highlight the possibility to interact with
IS interfacing and data 20 out of 61 competitors existing legacy systems, to generate maintenance
analysis (35%) ticket or to allocate resources or to automatically
modify production planning
Functionality that is not highlighted in their website
marketing message. However, during our face-to-face
0 out of 61 competitors
FMECA interviews, some of them actually do rely on a FMECA
(0%)
model to identify possible failure modes and risk
criticalities
Most interviewed companies only offer condition-based maintenance with limited predictive
capabilities as detailed in Table 4-1. Furthermore, a few offer an assisted decision-making for operators
and even less are looking to optimize a full suite of operational and scheduling problems. These higher-
level intelligence functions are just starting to emerge, and the level of vertical customization required
is high. Nonetheless, this is where the true value of predictive maintenance solutions will eventually
manifest. By integrating operational data with ERP, we will have solutions that finally “close the loop”
for business. This is mostly due to the fact that most predictive maintenance solutions are relatively
recent (few years).
Technologically speaking, algorithms and advanced analytics capabilities are not relatively innovative.
It is rather the application of these technologies in the field with proven results which is very rare.
Every PdM provider has already deployed condition-based monitoring projects but none of them,
among the interviewees, have deployed an integrated and full predictive maintenance project. They
claim that available data is not sufficient to obtain a robust analytic model as historic data collected by
their customers is, in most cases, unexploitable and unreliable.
Copyright UPTIME Consortium 2017-2020 Page 26 / 56You can also read