The Post-2020 Biodiversity Framework: Targets, indicators and measurability implications at global and national level - OECD
←
→
Page content transcription
If your browser does not render page correctly, please read the page content below
The Post-2020 Biodiversity Framework:
 Targets, indicators and measurability implications
             at global and national level

__________________________

Interim report, November 2019

Prepared by the OECD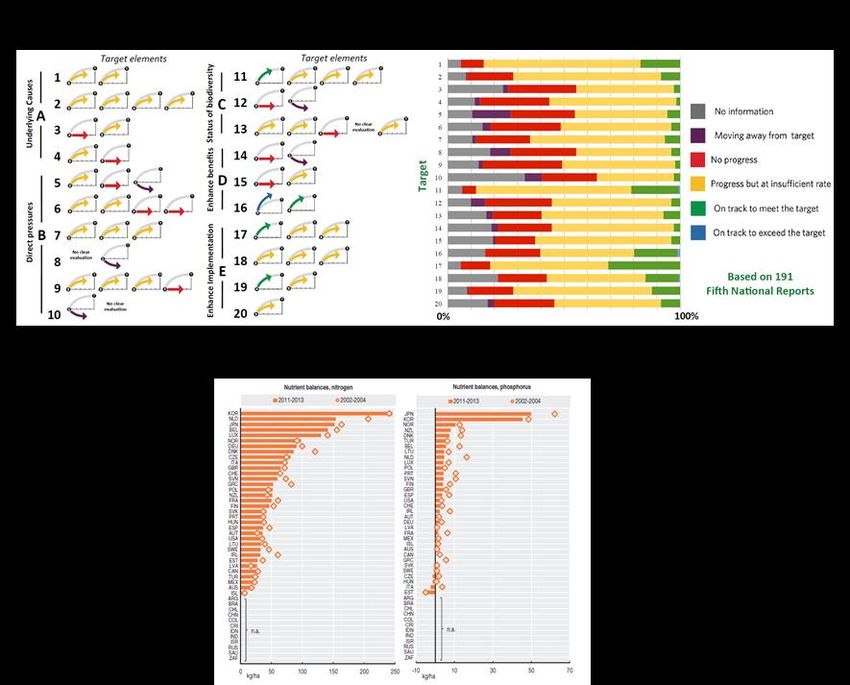
2
Note by the Secretariat
This document presents the second iteration of the OECD report on The Post-2020
Biodiversity Framework: Targets, indicators and measurability implications at global and
national level. This second iteration builds on an earlier background paper that was
circulated for the OECD international expert workshop on this issue, convened on 26
February, 2019. Discussions and insights from the workshop have been incorporated into
this document, as well as further analysis on how the measurability of the post-2020 global
biodiversity framework could be enhanced.
The analysis on SMART targets and indicators covered herein are therefore also directly
relevant to the development of baselines and the monitoring framework of the post-2020
global biodiversity framework (CBD/SBSTTA/23/2/Add.4).
This document reflects work-in-progress and will be further updated as draft post-2020
targets are put forward. More specifically, once target nomenclature and formulation have
been further developed, global indicators will be tied to each of the 2030 targets, taking
into consideration the need for national and regional targets to scale up to global targets
and vice versa (see para 28 in CBD/SBSTTA/23/2/Add.4), so as to further develop the
tables in section 5 of this report, which cover possible thematic targets and associated
indicators, including headline indicators, on the state of biodiversity, the pressures on
biodiversity and the responses to address these.
The document is being circulated as an Information document for the CBD Subsidiary
Body on Scientific, Technical and Technological Advice (SBSTTA) meeting on 25-29
November, 2019.
This report has been prepared under the oversight of the OECD Environmental Policy
Committee and its Working Party on Biodiversity, Water and Ecosystems. The OECD
Secretariat gratefully acknowledges the valuable insights provided by the participants to
the OECD international expert workshop on 26 February, 2019; comments and feedback
received from WPBWE delegates; as well as the European Commission for financial
support for this project.
This document, as well as any data and any map included herein, are without prejudice to
the status of or sovereignty over any territory, to the delimitation of international frontiers
and boundaries and to the name of any territory, city or area.
Please cite this document as:
OECD (2019), “The Post-2020 Biodiversity Framework: Targets, indicators and
measurability implications at global and national level”, November version.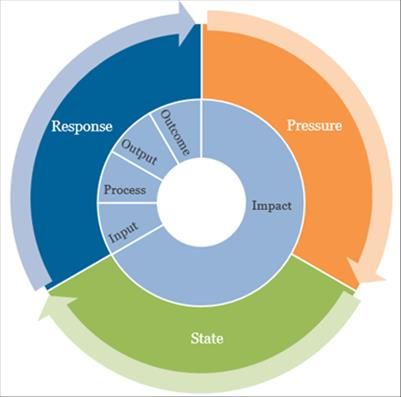
3
Table of Contents
Note by the Secretariat.......................................................................................................................... 2
1. The 2011-2020 Aichi Biodiversity Targets and the transition to the Post-2020 global
biodiversity framework ......................................................................................................................... 5
1.1. The current and evolving international context under the CBD ................................................... 5
1.2. Aims and objectives of this work.................................................................................................. 7
1.3. Environmental targets and indicators: Principles, criteria, concepts ............................................ 8
2. The Aichi Biodiversity Targets and the current set of indicators ............................................... 11
2.1. The Aichi Biodiversity Targets: An overview and some characteristics .................................... 11
2.2. The indicator suite for the Aichi Biodiversity Targets and the BIP ............................................ 13
2.3. Lessons learned from the Aichi targets and associated indicators: successes, challenges and
opportunities ...................................................................................................................................... 18
3. Recent developments relevant to the post-2020 biodiversity framework ................................... 22
3.1. On the structure of the post-2020 biodiversity framework - and its measurability implications 22
3.2. On enhancing the measurability of the post-2020 framework at global and national level ........ 25
4. A preliminary analysis of the proposed targets summarised in document
CBD/POST2020/PREP/1/INF/2 ......................................................................................................... 35
5. Possible elements of targets and associated indicators to include in a post-2020 global
biodiversity framework ....................................................................................................................... 39
5.1. Possible targets on state, available indicators, and whether they meet the headline indicator
criteria ................................................................................................................................................ 39
5.2. Possible targets on pressures, available indicators, and whether they meet headline indicator
criteria ................................................................................................................................................ 41
5.3. Possible targets on responses (i.e. actions), available indicators, and whether they meet
headline indicator criteria .................................................................................................................. 43
The 2011-2020 Aichi Biodiversity Targets ....................................................................... 46
Targets and Indicators for SDG 14 ................................................................................... 48
To conserve and sustainably use the oceans...................................................................................... 48
Targets and Indicators for SDG 15 ................................................................................... 49
To protect, restore and promote sustainable use of terrestrial ecosystems, sustainably manage
forests, combat desertification, and halt and reverse land degradation and halt biodiversity loss .. 49
Potential targets for enabling actions for biodiversity in the post-2020 framework in
submissions to the CBD ...................................................................................................................... 51
Text taken from CBD (2019[25]) Synthesis of the Views of the Parties and Observers on the Scope
and Content of the Post-2020 Global Biodiversity Framework: ....................................................... 51
Potential targets for biodiversity in the post-2020 framework in submissions to the
CBD (excluding enabling conditions) ................................................................................................ 53
For Official Use
4
Text taken from CBD (2019[25]) Synthesis of the Views of the Parties and Observers on the Scope
and Content of the Post-2020 Global Biodiversity Framework: ....................................................... 53
References ............................................................................................................................................ 58
Tables
Table 1.1. Types of Responses and the Theory of Change ..................................................................... 9
Table 2.1. Characteristics of the 2011-2020 Aichi Biodiversity Targets .............................................. 12
Table 2.2. Characteristics of SDG 14 and 15 targets............................................................................. 13
Table 2.3. Overview of primary indicators under the BIP for the Aichi Biodiversity Targets ............. 15
Table 3.1. Multi-country data sources for natural assets (to be further developed) .............................. 26
Table 3.2. Multi-country data sources for responses (to be further developed) .................................... 31
Table 3.3. Examples of possible response indicators to monitor progress towards biodiversity
mainstreaming ............................................................................................................................... 33
Table 4.1. Preliminary assessment of the proposed post-2020 targets summarised in
CBD/POST2020/PREP/1/INF/2.................................................................................................... 36
Table 5.1. Possible elements of targets on state, available indicators and whether they meet
headline indicator criteria .............................................................................................................. 40
Table 5.2. Possible elements of targets on pressures, available indicators and whether they meet
headline indicator criteria .............................................................................................................. 42
Table 5.3. Examples of potential sets of indicators for selected responses ........................................... 43
Table 5.4. Possible targets on responses, available indicators and whether they meet headline
indicator criteria ............................................................................................................................ 44
Figures
Figure 1.1. A schematic of the pressure-state-response indicator framework and how it relates to
the theory of change ........................................................................................................................ 9
Figure 2.1. Primary Indicators under the BIP by Aichi Target and Type ............................................. 14
Figure 2.2. Various ways to measure progress ...................................................................................... 19
Figure 2.3. Summary of progress towards the Aichi Targets ................................................................ 20
Figure 3.1. Possible elements of a post-2020 biodiversity framework.................................................. 23
Figure 3.2. Possible elements of a post-2020 biodiversity framework, including headline indicators . 245
1. The 2011-2020 Aichi Biodiversity Targets and the transition to the Post-2020 global
biodiversity framework
1.1. The current and evolving international context under the CBD
1. The 2011-2020 Aichi Biodiversity Targets are a set of five strategic goals and 20
targets that Parties to the UN Convention on Biological Diversity (CBD) are intended to
use as a guiding framework for their national commitments towards biodiversity
conservation, sustainable use and the equitable sharing of its benefits arising from the use
of genetic resources. As these Targets will expire in 2020, Parties to the CBD will need to
adopt a revised suite of targets for the post-2020 global biodiversity framework. Agreement
on this is also likely to have implications for two of the Sustainable Development Goals
(SDGs), namely SDG 14 on Life under Water and SDG 15 on Life on Land, as several of
the targets therein come directly from the Aichi Biodiversity Targets, and are therefore also
due to expire in 2020.
2. The 2011-2020 Strategic Plan for Biodiversity was a significant improvement to
the one preceding it. The Aichi Biodiversity Targets set out a flexible framework that
Parties are encouraged to use at the national level, inter alia, to guide their National
Biodiversity Strategies and Action Plans (NBSAPs). These 20 targets resulted in the need
to re-convene an Ad-Hoc Technical Expert Group (AHTEG) on indicators for the Strategic
Plan, in order to provide guidance on global and national indicators needed to measure
progress towards the achievement of the Aichi Targets.1 This process led to the adoption
of CBD COP Decision XIII/28, in 2015, on Indicators for the Strategic Plan for
Biodiversity 2011-2020 and the Aichi Biodiversity Targets.2
3. While the global biodiversity indicators are improving3 and efforts are underway to
address the remaining data gaps through initiatives such as the Biodiversity Indicators
Partnership (BIP), it remains inherently difficult to measure progress towards the Aichi
Targets at national level in a consistent and comparable way.
4. This is in contrast to, for example, measuring efforts to mitigate climate change,
which can be measured in a single unit of tCO2e. Efforts to mitigate biodiversity loss and
degradation are not captured in a single indicator; measuring performance on biodiversity
requires multiple different indicators (e.g., reduce forest loss, reduce the number of
threatened species). Moreover, under the UN Framework Convention on Climate Change
and the recent Paris Agreement, an international climate goal has been set (i.e., to keep
global temperature rise in this century well below 2 degrees centigrade) and Parties are
required to put forward Nationally Determined Contributions (NDCs). The NDCs therefore
create a bottom-up approach, to complement the top-down approach, helping to bridge the
two and therefore serves to provide transparency on whether the aggregated NDCs are
sufficient to achieve the international goal. Such a framework could arguably also be useful
in the context of the CBD.
5. The agreed goals and targets of the post-2020 global biodiversity framework will
therefore have implications for their measurability at both a global and national level.
1
UNEP/CBD/ID/AHTEG/2015/1/3
2
CBD/COP/Decision XIII/28
3
Both in terms of the comprehensiveness of what is being monitored (for the 2011-2020 Aichi
Targets) and the means of monitoring.
For Official Use6
Further consideration needs to be given to how the actual objectives of any post-2020
framework for biodiversity will enable an assessment of their progress and the
contributions that individual nations are making towards the international goals and targets.
Ideally, all targets would be specific, measurable, ambitious, realistic and time-bound
(SMART).
6. The post-2020 biodiversity framework will need to address the challenges
encountered in 2011-2020, the relevant targets of the SDGs, among other issues. CBD
COP14 in Egypt adopted a number of decisions relevant to the post-2020 biodiversity
framework, which include:
Decision 14/1: Updated assessment of progress towards selected Aichi Biodiversity
Targets and options to accelerate progress.
Decision 14/34: Comprehensive and participatory process for the preparation of the
post-2020 global biodiversity framework.
7. Following an initial CBD invitation for views on the preparation, scope and content
of the post-2020 global biodiversity framework, 95 submissions, from governments,
international organisations, NGOs and others, were received.4 A synthesis of views was
made available on 24 January 2019 [CBD/POST2020/1/INF/1], together with a summary
of the synthesis on 25 January 2019 [CBD/Post2020/PREP/1/1]. Para 9 (h) and (j) of this
latter document state:
(h) The different elements of the post-2020 global biodiversity framework should
be linked through a conceptual framework. Some have suggested that this should
be based on the Strategic Plan for Biodiversity while others have suggested
alternative approaches, including a pyramid approach with layers of objectives,
actions and targets in support of an “apex goal” and combinations of outcome and
output targets;
(j) The post-2020 global biodiversity framework should contain targets which are
specific, measurable, ambitious, realistic and time-bound. These targets should be
knowledge-based, including on scientific and traditional knowledge, address both
desired outcomes and processes, be easy to communicate and be designed to
galvanize action across society. There is support for using the Aichi Biodiversity
Target as a starting point for discussing future targets. Some expressed the view
that changes to the Aichi Targets should be kept limited. Others suggested more
comprehensive changes, and numerous suggestions for additional or revised
targets have been proposed;
8. Following a second invitation for views, a further synthesis of views was made
available on 23 May 2019 [CBD/Post2020/PREP/1/INF2]. In addition, following a series
of regional consultation meetings on the post-2020 global biodiversity framework, the first
meeting of the Open-Ended Working Group on the post-2020 biodiversity framework took
place on 27-30 August in Nairobi, Kenya. All documents for this meeting are available at:
https://www.cbd.int/conferences/post2020/wg2020-01/documents. The latest round of
submissions on the post-2020 global biodiversity framework are available at:
https://www.cbd.int/conferences/post2020/submissions/2019-075, and the CBD issued
CBD/SBSTTA/23/2/Add.4 on 15 October, 2019.
4
https://www.cbd.int/post2020/submissions/7
1.2. Aims and objectives of this work
9. The objectives of this work are threefold: (i) to take stock of the lessons learned
from the current 2011-2020 biodiversity framework, as these relate to targets and
indicators; (ii) to examine options to improve on the existing structure and measurability
of possible new biodiversity (goals and) targets under the post-2020 global biodiversity
framework, at both global and national level; and (iii) to identify key gaps in the indicator
suite, the feasibility of addressing these gaps and the implications of this for creating
SMARTer targets in the post-2020 framework.
10. A background paper was prepared in time for an international expert workshop,
convened by the OECD, on February 26, 2019.5 This paper builds on the background paper,
the discussions at the OECD international expert workshop, and other recent discussions
relevant to the post-2020 global biodiversity framework. Section 2 summarises lessons
learned from the Aichi Biodiversity Targets to date, including the successes and challenges,
as these relate to measurability. Section 3 examines opportunities for enhancing the
measurability of the post-2020 framework, and puts forward a proposal to include a smaller
sub-set of headline indicators in the post-2020 biodiversity framework, whereby the
underlying data is consistent and comparable across countries. It also provides an overview
of multi-county datasets that could be used to help identify what type of targets and
associated indicators could be developed to enhance measurability, at both global and
national level, of the post-2020 biodiversity framework. Section 4 provides a preliminary
analysis of the post-2020 targets proposed to date. Section 5 provides a preliminary
framework on possible thematic targets for the state of biodiversity, the pressures on
biodiversity and the responses to address these, together with initial inputs on the possible
indicators available to monitor progress towards these in a consistent and comparable way
across countries. Governments could use this as a basis as they consider targets and the
associated indicators necessary to monitor progress towards these.
11. This paper aims to provide technical analysis to help to inform the post-2020
biodiversity decision-making process. This work does not intend to make any
presuppositions with regard to the ambition of any possible post-2020 targets.
5
The OECD workshop was intended to provide a platform for discussion and exchange of views,
notably as it relates to CBD Decision 14/34, para 12, a, b, c, j, to consider:
(a) Scope, elements and structure of the post-2020 global biodiversity framework;
(b) Considerations related to ambitious, realistic and, where possible, measurable,
time-bound targets and corresponding indicators, reporting and monitoring frameworks
and baselines to be developed in a coherent way;
(c) Mechanisms for monitoring and reviewing implementation, including through the
use of indicators and the alignment of national reporting under the Convention and its
Protocols;
(j) Approaches, implications and opportunities for, enhancing mainstreaming;
For Official Use8
1.3. Environmental targets and indicators: Principles, criteria, concepts
12. It may be useful, at the outset, to recall some general principles, criteria and
concepts relevant to environmental targets and indicators, and how these have been related
to biodiversity thus far. Environmental targets should, ideally, be specific, measurable, and
time-bound. A set of criteria has been developed by the OECD to help guide the design of
environmental indicators. It states that all indicators should be assessed/evaluated
according to their (i) policy relevance, (ii) analytical soundness, and (iii) measurability
(OECD, 1993[1]). The CBD has also noted that the ideal indicator for measuring progress
should be (CBD, 2010[2]):
“policy-relevant and meaningful, biodiversity relevant, scientifically sound,
accepted by a broad public, lend itself to affordable monitoring and modelling, and
be sensitive enough to detect changes in systems with in timeframes and on scales
relevant to decision-making”
These criteria have also been put forward in the so-called “SMART” concept of targets
which the CBD defines as (CBD, 2010[2]) :
Specific
Measurable
Ambitious
Realistic, and
Time-bound.
13. The Pressure-State-Response model provides a commonly accepted framework for
identifying and structuring indicators. It distinguishes indicators of environmental
pressures (both direct and indirect), indicators of environmental conditions, and indicators
of societal responses. Societal responses can be further disaggregated into those undertaken
by government, households, and business (OECD, 2001[3]). In this paper, responses focus
more heavily on those by government. When designing the current biodiversity framework
in 2010, the Parties to the CBD adopted a modified Driver-Pressure-State-Impact/Benefit-
Response framework6 for applying the indicators to be consistent with Strategic Plan for
Biodiversity and the Aichi targets (CBD, 2010[2]).
14. With this in mind, and following the literature on the theory of change, the types of
response indicators can be further compartmentalised into inputs, processes, outputs,
outcomes and impacts (Table 1.1). Thus, if the responses are effective (and lead, in the last
stage, to positive impacts), they should manifest in an improvement in the state of
biodiversity (as depicted in Figure 1.1).
6
In the extended DPSIR causal framework, drivers refer to the underlying causes of environmental
change, such as economic growth, industry, etc.; and impacts refer to e.g. species loss, habitat
fragmentation and economic damage.9
Table 1.1. Types of Responses and the Theory of Change
Indicator type Definition Examples
Input Measures the material and immaterial pre-conditions and ● Budget allocated for biodiversity
resources - both human and financial - provided for an ● Number of staff
activity, project, programme or intervention
Process Measures the progress of processes or actions that use ● Establish an inter-Ministerial Committee for biodiversity
inputs and ways in which program services and goods are
provided
Output Measures the quantity, quality, and efficiency of ● New legal or policy instruments
production of goods or services as a result of an activity, ● Studies such as National Ecosystem Assessments
project, programme or intervention ● Biodiversity and ecosystem values are integrated into
national accounts
Outcome Measures the intermediate broader results achieved ● Reduced pesticide use
through the provision of outputs ● Larger protected areas
Impact Measures the quality and quantity of long-term results ● Improved condition of biodiversity and sustainability of
generated as a result of achieving specific outcomes ecosystem services, such as number of threatened
species
Source: Adapted from OECD (2018[4]), Mainstreaming Biodiversity for Sustainable Development.
Figure 1.1. A schematic of the pressure-state-response indicator framework and how it
relates to the theory of change
Source: Authors.
15. In the context of biodiversity, suggestions for target and indicator development are
briefly summarised here. (Butchart, Di Marco and Watson, 2016[5]) argue that ideally,
targets should avoid using ambiguous language, setting goals that are unquantifiable and
introducing redundant or complex terms that are open to interpretation, and clear
definitions of the terms used should be readily available with the targets themselves. They
also state that specific, quantifiable targets, with an established timeframe create greater
clarity and transparency surrounding the actions required.
16. Di Marco et al. (2016[6]) state: An important part of an efficient global plan for
biodiversity conservation is the establishment of an efficient framework for monitoring
progress toward targets. However, the set of indicators used for target monitoring is
sometimes inadequate, hindering the ability to accurately monitor some of the targets
(Shepherd et al., 2016[7]).
For Official Use10
17. Kuempel et al (2016[8]) suggest that identifying a comprehensive set of indicators,
which are able to represent the changing state of a study system (e.g., the threatened species
of a country), is an important step to be taken every time new targets are being defined. For
each indicator, it is important to clarify whether it refers to conservation outputs (e.g., new
legislation for protected areas), outcomes (e.g., greater coverage of protected areas) or
impacts (e.g. higher species abundance), what is the availability of baseline data, and what
is the cost of collecting and maintaining new data. 11
2. The Aichi Biodiversity Targets and the current set of indicators
2.1. The Aichi Biodiversity Targets: An overview and some characteristics
18. The Aichi Biodiversity Targets sit within the framework of five strategic goals,
with the 20 targets covering a broad range of areas. These areas can be summarised as:
Goal A (underlying causes): Awareness, values and strategies, incentives, sustainable
production and consumption. Goal B (direct pressures): habitats/forests, fish, agriculture,
pollution, invasive alien species, climate change/ocean acidification. Goal C (status of
biodiversity): Protected Areas, threatened species, genetic diversity, Goal D (enhance
benefits): ecosystems, resilience, Nagoya Protocol. Goal E (enhance implementation):
NBSAPs, knowledge, science and technology, and resource mobilisation/finance. The
Aichi goals and targets are provided in Annex A.
19. The SDGs are also relevant to the post-2020 biodiversity framework with SDG
targets 14 and 15 focussing specifically on Life below water and Life on land, respectively.
Nearly half of the targets under SDG 14 and 15 stem from the Aichi Biodiversity Targets
and are therefore also due to expire in 2020. The SDG 14 and 15 targets also make explicit
mention to Small-Island Developing States (SIDS) and small-scale fisheries; and to
mountains, amongst a few other issues (see Annex B and C for the SDG targets and
indicators).
20. Table 2.1 summarises the characteristics of the Aichi Biodiversity Targets in terms
of whether: (i) they reflect Pressure-State-Response variables; (ii) if a Response variable,
whether they relate to inputs, processes, outputs, outcomes or impacts (see Table 1.1); and
(iii) the target is quantitatively specific.
For Official Use12
Table 2.1. Characteristics of the 2011-2020 Aichi Biodiversity Targets
Aichi Target Pressure-State-Response Input-Process-Output-Outcome- Quantified or quantitatively specific
Impact target
1 State No
2 Response Process No
3 Response Output No
4 Response Input, process No
(and outcome but not defined)
5 State (and Pressure) Partially
6 Response, Pressure, State Output and outcome Implicitly (100% target)
7 Response Output Implicitly (100% target)
8 Pressure Implicitly (100% target)
9 State, Response Process and output No
10 Pressure No
11 Response Output Yes, partially
12 State Outcome Implicitly and partially
13 State, Response Process No
14 State Outcome No
15 State, Response Outcome Partially (15% restoration)
16 Response Process Yes, binary
17 Response Process Yes, binary
18 State No
19 State No
20 Response Input No but yes in further decisions (i.e.
doubling)
Source: Authors
21. The Aichi Biodiversity Targets are therefore composed of 10 targets that contain
elements referring to the state of biodiversity, 4 that refer to the pressures, and 12 on
responses (where sometimes a target covers multiple elements). Of the Aichi targets that
can be classified as ‘response’ targets, 2 focus on inputs, 6 on processes, 5 on outputs and
5 on outcomes.
22. A similar summary of characteristics for SDG 14 and 15 targets is provided in Table
2.2. Across the range of targets under SDG 14 and 15, the only quantitative target is 14.5,
i.e., “By 2020, conserve at least 10% of coastal and marine areas, consistent with national
and international law and based on the best available scientific information”, which is based
on CBD Aichi Biodiversity Target 11. 13
Table 2.2. Characteristics of SDG 14 and 15 targets
SDG Target Pressure-State-Response Input-Process-Output-Outcome-Impact Quantified or quantitatively-
specific target
14.1 Response Outcome No
14.2 Response Process No
14.3 Response Outcome No
14.4 State, Response Process and Impact No
14.5 Response Output Yes
14.6 Response Input No
14.7 State, Response Process and Outcome No
14.A State, Response Process and Outcome No
14.B Response Input No
14.C Response Process No
15.1 Response Process No
15.2 State, Response Process and Output No
15.3 Response Output and Impact No
15.4 Response Impact No
15.5 State, Response Process, Outcome, Impact No
15.6 Response Process No
15.7 Response Process and Outcome No
15.8 Response Process and Outcome No
15.9 Response Process No
15.A Response Input No
15.B Response Input No
15.C Response Input No
Source: Authors
2.2. The indicator suite for the Aichi Biodiversity Targets and the BIP
23. Decision XIII/28 of the CBD COP 13 welcomed an updated list of indicators for
the Strategic Plan for Biodiversity 2011-2020. The decision also emphasised that the list of
indicators provides a flexible framework for Parties to adapt, as appropriate, to their
national priorities and circumstances. The indicative list of indicators covers 98 specific
indicators, 35 of which are highlighted as having potential for disaggregation to the national
level (BIP, 2018). The BIP (2018) document also notes, however, that the uptake of these
indicators by countries has been limited to date.
24. It would be interesting to undertake an inventory of the indicators being used at
national level, as reported in the 6th National Reports, to monitor progress towards each of
the Aichi Targets, and to develop summary statistics on the frequency of use of each of the
indicators across all the National Reports. Such analysis would, in essence, help to create
a baseline of information on what indicators are currently being used at national level, and
could help to inform the post-2020 biodiversity framework with respect to the indicators
that are most frequently used. This work could perhaps be undertaken by the CBD
Secretariat.
25. Aiming to support the development of indicators via a more top-down approach,
the Biodiversity Indicators Partnership (BIP) is a global initiative to promote the
For Official Use14
development and delivery of biodiversity indicators.7 As of September 2019, the BIP has
over 60 partner organisations and includes nearly 75 indicators accepted for monitoring
progress towards the Aichi targets ( Table 2.3)8. The BIP uses an extended Pressure-State-
Response (P-S-R) framework that includes a fourth category, Benefit, to classify indicators
which track the benefits that biodiversity provides to people, such as ecosystem services.
The P-S-R-B categories are designated by the creators/developers of the indicators.9
26. In terms of pressure, state, response and benefits indicators, the information in
Table 2.3 can be summarised as depicted in Figure 2.1 below. According to this, the BIP
currently covers 19 indicators relevant to pressures, 29 relevant to state, 23 indicators
relevant to responses, and 1 indicator relevant to benefits.
Figure 2.1. Primary Indicators under the BIP by Aichi Target and Type
10
Number of Primary indicators on the
9
8
7
6
Benefit
BIP
5
Response
4
State
3
Pressure
2
1
0
1 2 3 4 5 6 7 8 9 10 11 12 13 14 15 16 17 18 19 20
Aichi Target
Notes: Only target 14 has a benefit indicator, namely: red list index (species used for food and medicine).
Source: Authors, based on information available at https://www.bipindicators.net
7
The primary role of the BIP is to serve the global user community by responding to the indicator
requests of the CBD and other biodiversity-related Conventions, for IPBES, for reporting on the
Sustainable Development Goals, and for use by national and regional governments.
8
The BIP and its’ Steering Committee acts as a gatekeeper, assessing each indicator for certain data
and coverage requirements before being accepted. Another round of review for additional proposed
indicators for the BIP is currently underway.
9
The type of indicator in Table 2.3 is not entirely consistent with the type of target in Table 2.1.
This could be due to the ambiguous language present in the targets and that the types of indicator
are self-defined/reported by the creators. 15
Table 2.3. Overview of primary indicators under the BIP for the Aichi Biodiversity Targets
Aichi Operational BIP Indicator Applicable Type Preliminary comments / data coverage
Target at national [to be completed]
level
1 Biodiversity Barometer Y Response About public awareness. 16 countries. Perhaps an enabling
condition?
1 WAZA bio-literacy survey N Response Not global coverage and data available for 2012-15.
1 Global biodiversity engagement Y State Not yet applied at the national level
indicator
3 Trends in potentially Y Pressure 45 countries currently reporting to the OECD PSE database,
environmentally harmful support but data is reported as an aggregate.
to agriculture
3 Number of countries with Y Response More than 90 countries currently contributing to the OECD
biodiversity-relevant taxes PINE database but data is not comprehensive
3 Number of countries with Y Response More than 90 countries currently contributing to the OECD
biodiversity-relevant fees and PINE database but data is not comprehensive
charges
3 Number of countries with Y Response More than 90 countries currently contributing to the OECD
biodiversity-relevant tradable PINE database but data is not comprehensive
permit schemes
4 Ecological Footprint Y Pressure Derived from multiple datasets. Measures the amount of
biological productive land and water area required to produce
the food, fibre and raw material an individual, population or
activity requires. Can be applied at a range of scales, and
flexible.
4 Red List Index (impacts of Y Pressure
utilisation)
4 Red List Index (internationally Y Pressure
traded species)
4 Percentage of Parties with Y Response Indicator of trade driven declines, subject to CITES listings
legislation in Cat. 1 CITES
4 HANPP Y Pressure Measures the percentage of NPP used by humans. Only goes
until 2005, update planned for 2019
4 Number of MSC Chain of Y Response
Custody Certification holders by
distribution country
4 Number and volume of MSC Y Response
certified consumer-facing
products by distribution country
5 Wetland Extent Trends Index Y? State Cannot separate human-made from natural wetlands, and not
freely available
5 Red List Index (forest specialist Y Pressure
species)
5 Forest Area as % of total land Y State Based on the FAO Global forest resources assessments, only
area applicable to forest specialist species. Also FAO definition
includes plantations so potentially misleading in some areas
5 Proportion of land that is Y State This measure is aggregated and collected at a relatively low
degraded over total land area resolution, hence it provides a useful guide, but is not useful
for assessing degradation at a sub-national level
5 CGMFC-21 (Continuous Global Y State Time series of changes in mangroves since 2000, next update
Mangrove Forest Cover) planned in 2020, but so far nothing beyond 2012 is available
online. The indicator also only covers one particular ecosystem
and does not provide estimates of uncertainty.
5 Biodiversity habitat index Y Pressure Time series of habitat quality and biodiversity value based on
land cover change and PREDICTS database. Good resource
but computationally intensive and not freely available.
6 Marine trophic index Y Pressure Measures the extent to which areas are over-fished, but
declines can be masked by the geographic expansion of
fisheries.
6 Living planet index (trends in Y State Measures the decline in populations of by-catch through
target and bycatch species) reported data, does not directly measure sustainability of
management
For Official Use16
6 Marine Stewardship Council N Response Represents ~10% of global catch and includes all landings
(MSC) certified catch under a countries flag
6 Proportion of fish stock within N Pressure Cannot be used nationally, but a useful global indicator
biologically sustainable level
6 Red List Index (impact of Y Pressure
fisheries)
6 Large Reef Fish Y State
7 Area of forest under FSC and Y Response Can track progress towards sustainable forest management.
PEFC
7 Wild Bird Index (forest and Y State Resource intensive data collection and reliant on other forms
farmland specialist) of biodiversity varying with Birds
7 Living planet Index (farmland Y State Resource intensive data collection but potential to track more
species) than just birds.
8 Trends in loss of reactive Y Pressure Periodically available and expressed as the loss per capita.
nitrogen to the environment
8 Trends in nitrogen deposition Y Pressure Applicable at multiple scales and long time-series available.
Also able to provide projections of future changes. This is a
spatial indicator
8 Red List Index (impacts of Y Pressure Shows the impacts of pollution, but relies on the accuracy of
pollution) the underlying Red List assessments.
8 Water Quality Index for Y Pressure Global dataset with potential for use in the future.
Biodiversity
9 Red List Index (impacts of Y Pressure Relies on accuracy of underlying assessments, which is
invasive alien species) variable.
9 Trends in the number of Y Pressure Covers 21 countries
invasive alien species
introduction events
9 Proportion of countries adopting Y Response Measures progress for legislation but not the environmental
relevant national legislation and impact of those policies.
adequate resourcing the
prevention or control of IAS
9 Trends in invasive species N Response Useful, but mostly limited to islands
vertebrate eradication
10 Ocean Health Index Y State Annual and available at a range of scales, potentially useful for
assessing national marine health post 2020
10 Climatic impacts on European Y State Useful, but limited in scope both geographically and
and North American birds taxonomically, could be expanded, but data requirements are
high.
10 Red List Index (reef-building Y Pressure See other red list indicators
corals)
10 Cumulative impact on marine Y Pressure Tests a range of stressors, can be applicable at a range of
ecosystems scales. Potentially useful for measuring progress
10 Live Coral Cover Y State Only available for the year 2000
10 Reef Fish Thermal Index Y State
11 Protected area coverage Y Response Simple measure of area inside PA, useful as a basic indicator
of progress
11 Protected area coverage of Key Y Response As above, but more targeted as KBA have been identified as
Biodiversity Areas essential for maintaining biodiversity
11 Protected area coverage of Y Response Useful for assessing PA network representativeness, can be
ecoregions applied at a range of scales (national and global).
11 Proportion of important sites for Y State* Sort of a meta indicator that combines some elements of the
terrestrial and freshwater above with other datasets (available through the integrated
biodiversity that are covered by biodiversity assessment tool)
protected areas, by ecosystem
type
11 Protected area connectedness Y Response Complicated measure of how connected protected areas are
index to each other; can be calculated at a range of scales. Created
by CSIRO in partnership with GEO BON and GBIF
11 Y Response Uses a range of data inputs and comes up with an index value
for how ecologically representative a PA network, is based on
Protected Area CSIRO’s own habitat and diversity map. Applicable at a range
representativeness index of scales. Technically challenging. 17
11 Protected Area Management Y Response Based on the Global database for Protected Area
Effectiveness Management Effectiveness (GD-PAME). Potentially useful, but
a wide range of methodologies used and most self-assessed.
11 Protected Connected Y State*
(ProtConn)
11 Wildlife Picture Index in tropical Y State
forest protected areas
12 Red List Index Y Pressure Based on Red List assessments, which utilised a globally
standard methodology, constantly updated. Can be sensitive
to asymmetrical distribution of monitoring and research efforts
globally.
12 Wildlife Picture Index Y State Utilises camera trap (and other sensor) data to monitor
changes in wildlife communities in the tropics. Useful but
limited to a few sites in 15 countries.
12 Living Planet Index (forest Y State
specialists)
12 Living Planet Index Y State Meta-indicator constructed from 19,500 population datasets of
4,180 species. Applicable at a range of scales and useful to
measure change. Technically challenging to construct.
12 Number of species extinctions Y State
(birds and mammals)
12 Number of extinctions N State Indicates the number of extinctions prevented through
prevented conservation actions globally.
12 Biodiversity Intactness Index Y State Derived from the PREDICTS database, BII indicates the
(BII) average abundance of a large, taxonomically, and ecologically
diverse set of naturally-occurring species in a terrestrial area,
relative to a baseline with minimal human impacts. Technically
challenging to construct.
13 Red List Index (wild relatives of Y State
domesticated animals)
13 Proportion of local breeds Y State
classified as being at risk, not-
at-risk or at unknown level of
risk of extinction
13 Comprehensiveness of Y State
conservation of socially and
culturally valuable species
14 Red List Index (species used for Y Benefit See other Red List
food & medicine)
14 Red List Index (pollinating Y State See other Red List
species)
14 PA coverage of montane Y State
biodiversity sites
15 Bioclimatic Ecosystem Y State
Resilience Index (BERI)
16 Number of Parties to CBD to Y Response Basic indicator of progress
Nagoya Protocol
17 Number of Countries with Y Response Indicator of an enabling condition/process (as per response)
developed or revised NBSAPs
18 Index of linguistic diversity Y State Data available until 2010. What is the correlation?
19 Growth in species occurrence Y Response
records accessible through
GBIF
19 Proportion of known species Y Response Good measure of progress for the Red List
assessed through IUCN Red
List
20 ODA to biodiversity Y Response Covers bilateral ODA to biodiversity based on the OECD DAC
Rio-Markers
Notes:* These indicators have been categorised as state (on the BIP website), but could arguably be categorised
as responses.
Source: Authors, adapted from https://www.bipindicators.net/ (accessed 27 September 2019).
For Official Use18
2.3. Lessons learned from the Aichi targets and associated indicators: successes,
challenges and opportunities
27. The 2011-2020 Aichi Biodiversity Targets replaced the 2010 biodiversity target
which was: to achieve by 2010 a significant reduction of the current rate of biodiversity
loss at the global, regional and national level as a contribution to poverty alleviation and
to the benefit of all life on Earth. The CBD 2010 target was also embedded as target 7.B of
the Millennium Development Goals (MDGs). While the 2010 target was ambitious and
time-bound, it was criticised for being vague and for lacking an appropriate plan of action
for its achievement (Perrings et al., 2011[9]). The 2010 target helped increase awareness of
biodiversity issues, including through its incorporation into the MDGs, but was unable to
galvanise sufficient actions and ultimately did not achieve its stated objective (Mace et al.,
2010[10]). The 2011-2020 Aichi Biodiversity Targets were therefore acknowledged to be an
improvement on the 2010 target as they are much more precise (Perrings et al., 2011[9])
28. More specifically, the Aichi targets are much better targeted to the pressures on
biodiversity loss than the previous target and much more specific, explicitly covering a
wide range of different ecosystems and the pressures that adversely impact on them. In
addition, the Aichi targets are a large improvement over the 2010 target as they include not
just the state and pressures of biodiversity, but also responses (Table 2.1). Harrop and
Pritchard (2011[11]), for example, highlighted how the additional specificity provided by
the Aichi targets should facilitate the Parties in developing focussed policy instruments at
the national level.
29. Despite being a clear improvement on the 2010 target, various challenges remain.
Butchart et al (2016[5]), for example, analysed each element of the 20 targets for
measurability, linguistic ambiguity, unnecessary complexity and redundant language. They
found that most of the targets (14 of 20) lack quantifiable elements, meaning there was no
measurable threshold that could be met in order to judge if the target has been reached.
Further, they found only two targets (16 and 17) were composed of entirely quantifiable
elements, meaning that in the vast majority of cases the measuring of target attainment is
not possible. Butchart et al. (2016[5]) find an average of 2.8 elements per target, and suggest
this complexity undermines the ability of countries to identify what actions need to be taken
to attain the targets. Further, the use of ambiguous language can lead to divergent
interpretations among Parties creating ‘wiggle room’, further hampering target attainment
(Maxwell et al., 2015[12]).
30. With regard to indicators and the ability to monitor progress towards the Aichi
Targets, the lack of quantifiable elements10 is further undermined by the lack of specific
indicators and baselines available. For example, Tittensor et al. (2014[13]) tried to assess
progress towards the Aichi targets and were unable to identify any suitable indicators for
four of the 20 targets (at that time). Moreover, many of the targets themselves lack
sufficient baselines against which progress can be measured (Han et al., 2016[14]). Mcowen
et al. (2016[15]) found a significant number of the indicators had shortcomings with respect
to their alignment, spatial coverage or temporal relevance, calling into question the ability
to measure progress towards the Aichi targets.
31. Comprehensive efforts to monitor and evaluate progress towards the Aichi Targets
include the fourth Global Biodiversity Outlook (GBO4) (CBD, 2014[16]) (Figure 2.2 a) and,
more recently, the Intergovernmental Science-Policy Platform on Biodiversity and
10
Meaning that there is no clear binary or numeric threshold to be met in order for the target to be achieved. 19
Ecosystem Services (IPBES) Global Assessment report (IPBES, 2019) (Figure 2.3). Both
of these may be considered to be top-down approaches. In contrast, evaluating progress
based on CBD National Reports can be considered a bottom-up approach (Figure 2.2b).
These evaluations are based, arguably to a large extent, on qualitative approaches. Overall,
monitoring progress in a consistent and comparable way across countries remains
challenging.
32. In contrast, the approaches used under, for example, the UNFCCC and the OECD
Green Growth Indicators framework are, in many ways, more quantitative (Figure 2.2c).
As can been seen in Figure 2.2.c, since the metric used for the indicator is consistent and
comparable across countries (and over time), this also allows the assessment of progress
against a baseline (i.e., the diamond shape in the figure). The question on enhancing the
measurability of the post-2020 framework can thus be considered a question of how to
evolve from approaches such as (a) and (b) in Figure 2.2, to (c).
Figure 2.2. Various ways to measure progress
Source: CBD (2014[16]), Global Biodiversity Outlook 4; SCBD presentation at regional consultation workshop,
Japan, 28 January, 2019; OECD (2017[17]), Green Growth Indicators 2017.
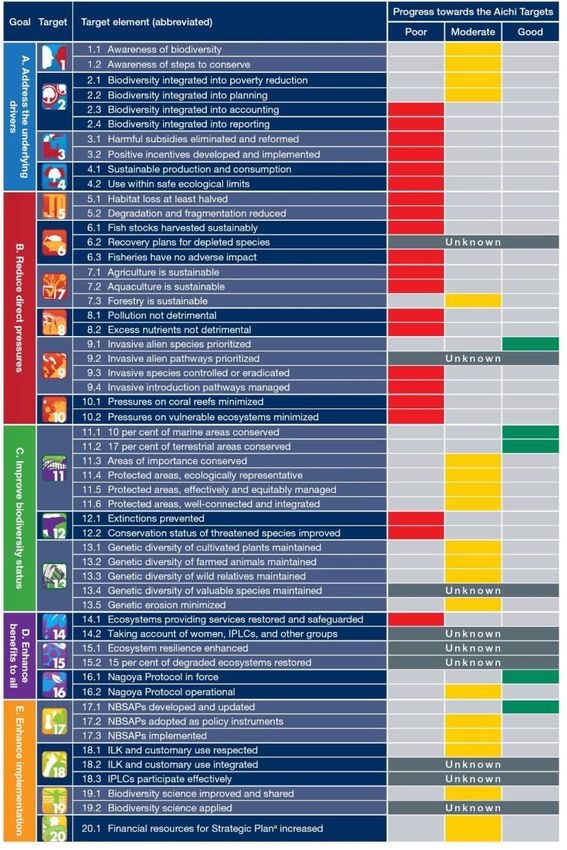
33. The Intergovernmental Platform on Biodiversity and Ecosystem Services (IPBES)
released its Global Assessment report (IPBES 2019) in May 2019, wherein they also review
progress towards the Aichi Biodiversity Targets. The summary of progress towards target
elements is scored as good, moderate, poor or unknown (Figure 2.3).
For Official Use20
Figure 2.3. Summary of progress towards the Aichi Targets
Source: IPBES (2019) Chapter 3. Assessing progress towards meeting major international objectives related to
nature and nature’s contributions to people.
https://www.ipbes.net/system/tdf/ipbes_global_assessment_chapter_3_unedited_31may.pdf?file=1&type=no
de&id=35279
34. The open source and flexible nature of the BIP has allowed for the continuous
growth of available indicators, from 22 at the beginning of 200811 to more than 70 over a
decade later in 2019. Through the Minding the Gap12 initiative, the BIP has attempted to
identify and fill gaps in the current suite of indicators. Consequently, there are now a
diverse and broad range of indicators for almost all the Aichi targets (with the notable
11
https://web.archive.org/web/20080119164010/http://www.twentyten.net:80/target.htm
12
https://www.bipindicators.net/minding-the-gap-how-the-bip-is-filling-indicator-gaps 21
exception of target 2), which provide a rich landscape of data on the state, pressures and
responses (and benefit) on global biodiversity. As noted earlier, the uptake of these
indicators by countries has been limited to date (BIP, 2018). The plurality of information
provided by current indicators on each target is also some way from the original intention
of creating a “small set of headline indicators” suggested by the CBD SBSTTA in 2010
(CBD, 2010[2]).
35. Mcowen et al (2016[15]) argue the plurality of different available indicators has
resulted in information asymmetry across the Aichi targets. For example, the total number
of primary indicators for tracking progress towards each target vary from 9 indicators for
Target 11, to 0 indicators for Target 2 (see Figure 2.1).
36. Aichi Targets 2 and 12 illustrate the key interactions and challenges between target
and indicator creation. Target 2 lacks any indicators, which is perhaps unsurprising given
it contains no quantifiable elements, and there is no agreed definition of what constitutes
“biodiversity values” (Butchart, Di Marco and Watson, 2016[5]; Mcowen et al., 2016[15]).
Further “national and local development and poverty reduction strategies and planning
processes”, represent a wide variety of strategies, plans and planning processes, which can
differ significantly between countries (OECD, 2018[4]) making internationally comparable
metrics (needed for a global indicator) difficult to create (Mcowen et al., 2016[15]). In
contrast, target 12 contains only quantifiable elements and no linguistic ambiguity, lending
itself well to indicator creation.
37. Green et al. (2019[18])also find that SMARTer biodiversity targets are associated
with greater progress. Some further lessons on indicator development, as noted in BIP
(2018[19]), are provided below (see CBD/COP/14/INF/40):
Comprehensive and reliable indicators are underpinned by a reasonable quantity
and quality of data. Key gaps in temporal, spatial and taxonomic coverage need to
be addressed which would further strengthen the indicators available for flexibly
tracking targets.
A large number of other freely available data sources exist, that could support
countries in reporting on progress; these data sources should be widely promoted
to Parties (see UNEP-WCMC (2018[20]))
38. For studies that have examined the use of indicators at the national level, see
Hagerman et al. (2016[21]) for an application to Canada, and Rochette et al (2018[22]) for
case studies in Africa. Hagerman et al. (2016[21]), for example, conducted a systematic
content analysis of 154 documents to assess the nature and extent of national
implementation of the Aichi Targets using Canada as a case study. Results indicated that
“most responses are aspirational, with only 28% of responses implemented. Implemented
responses tended to be associated with targets with specified levels of ambition that
emphasised biophysical values, or targets that are relatively straightforward to achieve in
this context (e.g., knowledge capacity and awareness)”.
For Official Use22
3. Recent developments relevant to the post-2020 biodiversity framework
3.1. On the structure of the post-2020 biodiversity framework - and its
measurability implications
39. The current structure of the Aichi Targets and the indicator suite can be described
as flat, where the 20 targets can be considered to be equally important. The 5 strategic goals
represent “aspirations for achievement at a global level”13 which are unquantifiable.
Beyond the targets and strategic goals, there is also a short vision statement and longer
mission, from which the strategic goals are taken.
40. Following the first and second submission of views14 on the post-2020 biodiversity
framework, CBD/POST2020/PREP/1/INF/2 notes that a range of views have been
reflected on the possible scope and content of a post-2020 global biodiversity framework,
including on:
(d) the elements of the post-2020 global biodiversity framework, including: (i) the
conceptual framework; (ii) the 2050 Vision for Biodiversity; (iii) its mission; (iv)
its strategic goals; (v) biodiversity targets; (vi) tools and mechanisms for
implementation; (vii) review processes; and (viii) indicators; (e) participation; (f)
mainstreaming and synergies; (g) communication and outreach; and (h) gaps in
the Strategic Plan for Biodiversity 2011-2020 that could be addressed in the post-
2020 global biodiversity framework.
41. Drawing on several submissions available at the time, OECD (2019) put forward a
proposed structure for the targets as depicted in Figure 3.1.
13
https://www.cbd.int/sp/elements/
14
CBD/POST2020/PREP/1/INF/1 and CBD/POST2020/PREP/1/INF/2, respectively. By 24 May,
2019, a total of 74 submissions were received, of which 21 were from Parties, including one from
the European Union and its member States. 23
Figure 3.1. Possible elements of a post-2020 biodiversity framework
Source: OECD (2019), Biodiversity: Finance and the Economic and Business Case for Action.
42. This proposed structure is in line with option 2 in Non-paper 02, released on 18
July, 2019, which states:
Option 2: Goals and targets can be divided in three groups:
A) Biodiversity goals (status of biodiversity)
B) Targets related to the drivers of biodiversity loss or threat, and
C) Enabling conditions and actions objectives
43. Some differences between the concepts outlined in this paper versus those in Non-
paper 02 are that in this paper, the terms goals, targets and objectives are not used
interchangeably. In addition, (and in contrast to the language used in the IPBES Global
Assessment report), the term ‘pressures’ is here preferred to ‘drivers’, as there is already a
well-documented literature on the driver-pressure-state-response framework (see e.g.
(Oesterwind, Rau and Zaiko, 2016[23])
44. This paper also attempts to make a strong case for the need for any post-2020 targets
to cover targets on both the pressures and the responses (i.e., and not just on responses that
are intended to reduce the pressures). It is argued here that explicit targets are needed on
pressures, so that incentives continue to be provided to national statistics offices,
intergovernmental organisations and the scientific community to monitor and report on the
pressures on biodiversity (and that the quality of this data improves over time). Indicators
on pressures are just as important as indicators on the state of biodiversity. If the post-2020
biodiversity framework does not include targets on pressures, this may lead to a decline in
the quality of data and indicators on these. Targets and indicators on the state of biodiversity
and on the responses put in place to address and reverse biodiversity loss are necessary but
not sufficient. There are likely to be long time-lags between the introduction of a response
and the resulting impact on the state of biodiversity. Targets and indicators on pressures
can help to bridge this gap, allowing to examine whether the responses are also having an
impact on reducing the pressures on biodiversity.
For Official UseYou can also read