GLOBAL STATUS REPORT 2017 - Towards a zero-emission, efficient, and resilient buildings and construction sector - World Green Building Council
←
→
Page content transcription
If your browser does not render page correctly, please read the page content below
Towards a zero-emission, efficient, and
resilient buildings and construction sector

        GLOBAL STATUS REPORT
        2017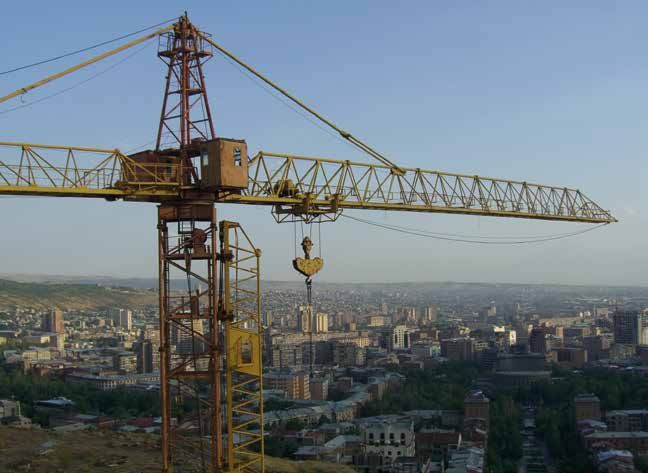
Acknowledgements
The Global Status Report 2017 was prepared by Thibaut Abergel, Brian Dean and John Dulac of the International Energy Agency (IEA) for
the Global Alliance for Buildings and Construction (GABC). The report was coordinated by United Nations Environment Programme and
was made possible by the generous support of the governments of France and Germany as well as the French Environment and Energy
Management Agency (ADEME).
The authors would like to thank the following persons for their important contributions, input, comments and review of the 2017 Global
Status Report, including:
Allen Ang – Keppel Land Limited, Singapore
Miriam Badino – ICLEI -Local Governments for Sustainability
Manfred Braune – Green Building Council South Africa (GBCSA)
Victoria Burrows, Jonathan Laski, Audrey Nugent and Terri Wills – World Green Building Council (WorldGBC) and Thulani Vuyo Kuzwayo –
WorldGBC Africa Regional Network
Tan Wang Cai and Sebastian Wang – Sunseap Leasing Pte Ltd, Singapore
Laura Cozzi, Brian Motherway and David Turk – International Energy Agency (IEA)
Anna Creed and Cory Nestor – Climate Bonds Initiative
Luca De Giovanetti – Sustainable Development Advisor
Jamila El Harizi and Majida El Ouardirhi – Ministry of National Planning, Urban Planning, Housing and City Policy (Ministère de
l’Aménagement du Territoire National, de l’Urbanisme, de l’Habitat et de la Politique de la Ville), Morocco
Peter Graham – Global Buildings Performance Network (GBPN)
Thomas Guéret, Régis Meyer and Yves Laurent Sapoval – Ministry of Ecological and Inclusive Transition (Ministère de la Transition
Écologique et Solidaire), France
Ursula Hartenberger – Royal Institution of Chartered Surveyors (RICS)
Pekka Huovila - The 10YFP Programme on Sustainable Buildings and Construction
Benoit Lebot – International Partnership for Energy Efficiency Cooperation (IPEEC)
Eric Mackres – World Resources Institute (WRI)
Rusmir Musić – International Finance Corporation (IFC)
Martina Otto and Nora Steurer – United Nations Environment Programme
Oliver Rapf and Max Ramezani – Buildings Performance Institute Europe (BPIE)
Cecilia Rinaudo – La Voute Nubienne
Kyryl Tomliak – Advisor, State Agency for Energy Efficiency and Energy Saving of Ukraine
Ryan Jin Zhanha – Nanyang Technological University, Singapore
Victor Zuñiga – Ministry of Energy (Secretaría de Energía), Mexico
Cover Images: © La Voute Nubienne, © iStock, © Shutterstock, ©John Dulac
Copyright © United Nations Environment Programme, 2017
This publication may be reproduced in whole or in part and in any form for educational or non-profit purposes without special permission
from the copyright holder, provided acknowledgement of the source is made. The United Nations Environment Programme would
appreciate receiving a copy of any publication that uses this publication as a source.
No use of this publication may be made for resale or for any other commercial purpose whatsoever without prior permission in writing
from the United Nations Environment Programme.
The electronic copy of this report can be downloaded at www.globalabc.org
Citation: UN Environment and International Energy Agency (2017): Towards a zero-emission, efficient, and resilient buildings and
construction sector. Global Status Report 2017.

Disclaimer
The views expressed in this Global Status Report 2017 are not necessarily those of the GABC partners. The designations employed and the presentation of
the material in this publication do not imply the expression of any opinion whatsoever on the part of the authors, the United Nations Environment Programme
or the International Energy Agency concerning the legal status of any country, territory, city or area, nor of its authorities, nor concerning the delimitation of
its frontiers or boundaries. Moreover, the views expressed do not necessarily represent the decision of the stated policy of the United Nations Environment
Programme or International Energy Agency, nor does citing of trade names or commercial process constitute endorsement.

ISBN No.: 978-92-807-3686-1
Job No.: DTI/2151/PA
UNEP 188

Geographical disclaimer
The designations employed and the presentation of material in this publication do not imply the expression
of any opinion whatsoever on the part of the United Nations Environment Programme or the International
Energy Agency concerning the legal status of any country, territory or city or its authorities, or
concerning the delimitation of its frontiers or boundaries.

                                                                                                             UN Environment promotes
                                                                                                          environmentally sound practices
                                                                                                        globally and in its own activities. This
                                                                                                   publication is printed on 100% recycled paper,
                                                                                                     using vegetable - based inks and other eco-
      French Environment &                                                                       friendly practices. Our distribution policy aims to
    Energy Management Agency

                                                                                                     reduce UN Environment's carbon footprint.
Towards a zero-emission, efficient, and
resilient buildings and construction sector

GLOBAL STATUS REPORT
2017

GLOBAL STATUS REPORT 2017

Preface
The global buildings sector is growing at unprecedented rates, and it will continue to do so. Over the next 40 years, the
world is expected to build 230 billion square metres in new construction – adding the equivalent of Paris to the planet
every single week.

This rapid growth is not without consequences. While buildings sector energy intensity has improved in recent years,
this has not been enough to offset rising energy demand. Buildings-related CO2 emissions have continued to rise by
around 1% per year since 2010, and more than four million deaths each year are attributable to illness from household
air pollution.

Fortunately, many opportunities exist to deploy energy-efficient and low-carbon solutions for buildings and construction.
These solutions will necessitate greater effort to implement strategic policies and market incentives that change the pace
and scale of actions in the global buildings market.

This year’s Global Status Report looks at the state of global buildings and construction since the historic Paris Agreement
at the 21st Conference of Parties. It considers the numerous commitments and actions by countries, cities, industry and
related stakeholders to help put the global buildings and construction sector on a sustainable trajectory.

The report makes clear that while global progress is advancing, there is a growing urgency to address energy demand
and emissions from buildings and construction. Current policies and investments fall short of what is needed, and what
is possible.

Ambitious action is needed without delay to avoid locking in long-lived, inefficient buildings assets for decades to come.
Examples across the multitude of actions by Global Alliance for Buildings and Construction (GABC) countries and part-
ners illustrate that this ambition is indeed possible.

It is our hope that this status report, along with continued international collaboration and best practice sharing, helps
to raise awareness of the needs and opportunities to put global buildings and construction on a sustainable pathway.

Dr Fatih Birol
Executive Director
International Energy Agency

2
GLOBAL STATUS REPORT 2017

                   We urgently need to move towards a pollution free planet,
to tackle climate change and to drive sustainable development. We can only
do that with decisive action in this sector. Technologically and commercially
viable solutions exist, but we need stronger policies and partnerships to scale
 them up more rapidly. Many thanks to all the partners who work to produce
         this annual update on the progress made and the challenges ahead.

                                                               Erik Solheim
                                                          Executive Director
                                    United Nations Environment Programme

                                                                                     3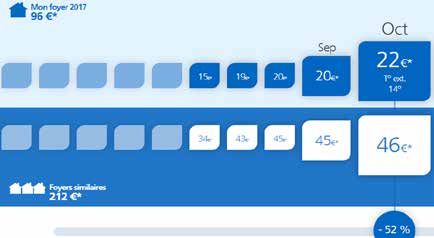
GLOBAL STATUS REPORT 2017
Table of Contents
Global Perspectives . . . . . . . . . . . . . . . . . . . . . . . . . . . . . . . . . . . . . . . . . . . . . . . . . . . . . . . . . . . . . . . . . . . . . 6
Tracking progress 9
Human factors 10
Data and measurement 12
Priorities for action 13
Global Status . . . . . . . . . . . . . . . . . . . . . . . . . . . . . . . . . . . . . . . . . . . . . . . . . . . . . . . . . . . . . . . . . . . . . . . . . 14
Buildings-related climate commitments 18
Country commitments 18
Local governments 19
Private sector 19
Pathways to Sustainable Buildings and Construction . . . . . . . . . . . . . . . . . . . . . . . . . . . . . . . . . . . . . . . . . 20
Building envelope improvements 22
Technology choice 22
Technology performance 23
Key Sustainable Buildings Technology Solutions . . . . . . . . . . . . . . . . . . . . . . . . . . . . . . . . . . . . . . . . . . . . 25
Global market trends 26
Recent achievements across countries 28
Key Sustainable Buildings Policy Developments . . . . . . . . . . . . . . . . . . . . . . . . . . . . . . . . . . . . . . . . . . . . . 30
New policies announced or introduced in 2016 or 2017 30
Building energy codes 32
Building energy codes updated or implemented in 2016 or 2017 33
Building energy certifications 34
Certifications updated or implemented in 2016 or 2017 35
Investments and Finance to Enable Transformation . . . . . . . . . . . . . . . . . . . . . . . . . . . . . . . . . . . . . . . . . . 37
Global investments 37
Investor confidence 37
Green bonds 37
Locking in Better Buildings for Tomorrow, Today . . . . . . . . . . . . . . . . . . . . . . . . . . . . . . . . . . . . . . . . . . . . . 40
Urgent need for implementation of mandatory building energy codes 40
A call to action 41
Implications beyond energy savings and emission mitigation 41
Key Findings . . . . . . . . . . . . . . . . . . . . . . . . . . . . . . . . . . . . . . . . . . . . . . . . . . . . . . . . . . . . . . . . . . . . . . . . . . 42
Global Alliance for Buildings and Construction Working Groups . . . . . . . . . . . . . . . . . . . . . . . . . . . . . . . . 43
5
GLOBAL STATUS REPORT 2017

     Global Perspectives
    Buildings and construction together account for 36% of global final
    energy use and 39% of energy-related carbon dioxide (CO2) emissions
    when upstream power generation is included1.

    Progress towards sustainable buildings and construction is advancing,
    but improvements are still not keeping up with a growing buildings
    sector and rising demand for energy services. The energy intensity per
    square meter (m2) of the global buildings sector needs to improve on
    average by 30% by 2030 (compared to 2015) to be on track to meet
    global climate ambitions set forth in the Paris Agreement.

    FIGURE 1          Global final energy use per square meter

                200

                150
       kWh/m2

                100

                 50

                 0
                 2000                  2005                    2010                   2015              2020                 2025              2030

                                                    Historical                         RTS                     30% by 2030

Notes: EJ = exajoules; kWh/m2 = kilowatt-hours per square metre: RTS = Reference Technology Scenario.
Source: IEA (2017), Energy Technology Perspectives 2017, IEA/OECD, Paris www.iea.org/etp/.

1    This data covers buildings and construction, including the manufacturing of materials and products for building construction that was not included in
     the Global Status Report 2016. More methodological details are available in the section “Global Status”.

6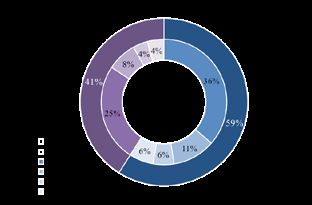
GLOBAL STATUS REPORT 2017
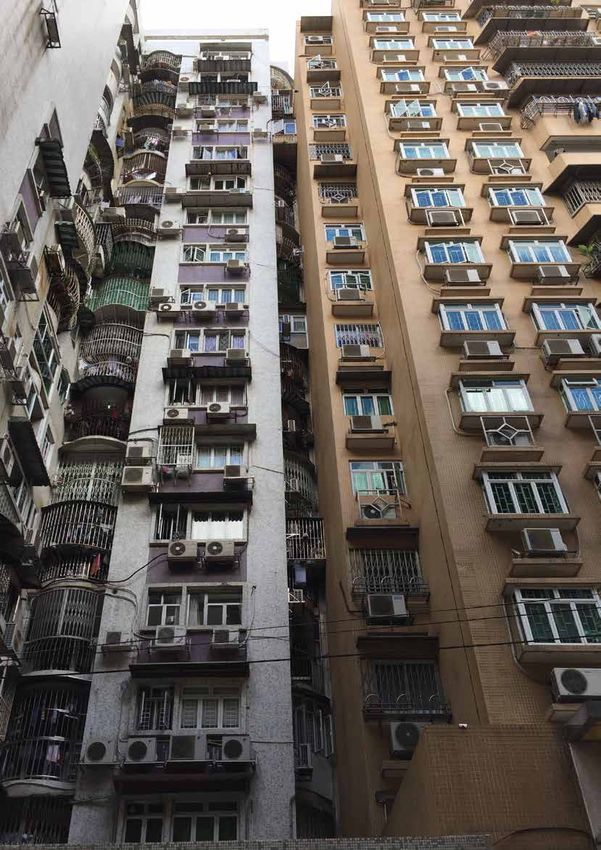
The global buildings sector continues to grow, with floor of power generation, with direct emissions from buildings
area reaching an estimated 235 billion m2 in 2016. Final stable at around 2.8 Gt CO2. By contrast, CO2 emissions
energy use by buildings grew from 119 exajoules (EJ) in from buildings construction grew steadily, from 3.1 GtCO2
2010 to nearly 125 EJ in 2016. Fossil fuel use in buildings in 2010 to around 3.7 GtCO2 in 2016.
remained almost constant since 2010 at roughly 45 EJ
(Figure 2). Buildings sector energy intensity (in terms of energy use
per m2) continues to improve at an annual average rate
On a positive note, global annual buildings-related carbon of around 1.5%. Yet, global floor area continues to grow
emissions appear to have peaked, at least temporarily, by about 2.3% per annum, offsetting those energy inten-
at around 9.5 gigatonnes of CO2 (GtCO2) in 2013, then sity improvements.2 Continuing this trend in the coming
decreasing to 9.0 GtCO2 in 2016. However, that drop was decades will make it increasingly difficult to achieve ambi-
largely due to progress in reducing the carbon intensity tions for a 2 degree Celsius (°C) world or below.
FIGURE 2 Global buildings sector energy consumption by fuel type, 2010 - 2016
140 3,5%
Renewables
120 3,0% Commercial heat
100 2,5% Electricity
Annual change
Natural gas
80 2,0%
EJ
Oil
60 1,5% Coal
40 1,0% Biomass (traditional)
20 0,5%
Floor area growth
0 0,0% Intensity reduction
Source: derived with IEA (2017), World Energy Statistics and Balances, IEA/OECD, Paris, www.iea.org/statistics
KEY POINT
Buildings final energy demand increased by 5 EJ from 2010 to 2016 as energy-
efficiency efforts have not kept up with rising floor area.
The Paris Agreement marked a turning point in the call Yet, energy-efficient, low-carbon products are already
to limit global warming. Seizing on that momentum, rapid available in most markets today. Upfront investments can
deployment of energy-efficient and low-carbon solutions represent a key barrier to adoption, but many high-perfor-
for buildings and construction can help put the world on a mance technologies (e.g. light-emitting diodes [LEDs])
sustainable trajectory. and technology packages (e.g. heat pumps combined
with insulation) are typically cost-effective.
Multiple opportunities exist to mitigate greenhouse gas
(GHG) emissions in the buildings and construction sector. The establishment of a review-and-revise platform
The energy and emissions savings potential in buildings reflecting Parties’ “highest possible ambitions” is already
remains largely untapped due to continued use of less leading to positive developments with regards to end-use
efficient technologies, alongside lack of effective poli- equipment efficiencies and building code implementation
cies and weak investments in sustainable buildings and in several new countries.
construction in many countries. Consumer choices and
behaviour also play a key role.
2 IEA (2017), Tracking Clean Energy Progress 2017, IEA/OECD, Paris, www.iea.org/etp/tracking2017/
7GLOBAL STATUS REPORT 2017
However, greater effort is needed to implement strate- Deep energy renovations of existing buildings (e.g.
gic policies and market incentives to encourage broad 50% to 70% energy intensity improvements, with the
uptake of energy saving and sustainable solutions. The objective of moving towards high-performance and
UNFCCC facilitative dialogue in 2018 and the formal low-carbon buildings, such as near-zero energy buildings
collective review in 2023 are key milestones to bridge [nZEBs]), are another priority over the coming decades.
the gap between climate ambitions and policy action in This is especially true for Organisation for Economic
buildings and construction. Co-operation and Development (OECD) countries, where
roughly 65% of the total expected buildings stock in 2060
There is a growing urgency to address energy and emis- is already built today.
sions from buildings and construction if ambitions for a 2°C
world or below are to be achieved. Over the next 20 years, Achieving climate ambitions will require intensified policy
more than half of new buildings expected to 2060 will be response to drive change and scale up actions across the
constructed. More alarmingly, two-thirds of those additions buildings and construction sector. This includes a sound
are expected to occur in countries that do not currently have balance of regulatory tools (e.g. building energy codes),
mandatory building energy codes in place.3 incentives and financing tools, information and capacity
building, and support for successful business models
Building growth will be particularly rapid in Asia and Africa that attract private-sector investments and innovative
(Figure 3). For instance, floor area in India is expected to solutions. It also will likely require changes in behaviour
double by 2035. Yet, only part of the sector is covered by and social practices.4
mandatory building energy codes.
FIGURE 3 Floor area additions to 2060 by key regions
Africa
Current floor area
China
India
North America Floor area additions
Europe
2017-30
ASEAN
Latin America
2030-40
Other Asia
Middle East
2040-50
OECD Pacific
Russia and Caspian region
2050-60
- 90 - 60 - 30 0 30 60 90
billion m2
Notes: OECD Pacific includes Australia, New Zealand, Japan and Korea; ASEAN = Association of Southeast Asian Nations.
Source: IEA (2017), Energy Technology Perspectives 2017, IEA/OECD, Paris, www.iea.org/etp
KEY POINT
There is urgent need to address rapid growth in inefficient and carbon-intensive
buildings investments, especially in developing countries.
3 IEA (2017), Energy Technology Perspectives 2017, IEA/OECD, Paris, www.iea.org/etp
4 Lucon O. et al. (2014), Buildings in: Climate Change 2014: Mitigation of Climate Change. Contribution of Working Group III to the Fifth Assessment
Report of the Intergovernmental Panel on Climate Change, Cambridge University Press, Cambridge, http://www.ipcc.ch/pdf/assessment-report/ar5/
wg3/ipcc_wg3_ar5_chapter9.pdf
8GLOBAL STATUS REPORT 2017
Tracking progress FIGURE 4 Scope of NDCs and building policies
by policy type and emissions coverage
82% of final energy consumption NDC SUBMISSIONS
in buildings was supplied by fossil NDCs 192
fuels in 2015. Buildings 132
(including primary energy input for power generation; Energy efficiency 101
traditional use of biomass excluded) Renewables 49
0 Number of countries 195
193 countries have submitted nationally determined
contributions (NDCs). 132 NDCs explicitly mention the BUILDING ENERGY CODES
buildings sector. Among them, 101 pointed to energy-effi- Country policy 62
ciency opportunities to meet mitigation targets. 49 coun- Country NDC 40
tries committed to use renewable sources of energy in
0 Number of countries 195
buildings to improve access to clean energy and endorse
adoption of low-carbon energy assets.
BUILDING ENERGY CERTIFICATIONS
While building energy codes, certifications and high-effi- Country policy 84
ciency technologies are crucial to achieve the transition Country NDC 1
to sustainable buildings, the majority of NDCs do not
0 Number of countries 195
mention specific projects or targets relat ed to energy
performance standards or efficient building technology
deployment. This is the case even for some countries that BUILDING ENVELOPES
have such policies in place. Country policy 1841
Country NDC 678
Of the buildings-specific actions, improving building
0 Emissions with policy coverage (MtCO2) 3540
envelope performance and enhancing cooling equipment
efficiency cover the largest share of buildings-related
emissions (Figure 4). Space heating is not mentioned SPACE HEATING EQUIPMENT
explicitly in most NDCs, even though it accounts for nearly Country policy 665
30% of buildings-related carbon emissions. Country NDC 67
Other countries only submitted economy-wide emissions 0 Emissions with policy coverage (MtCO2) 2588
reduction targets. Some of these coutries have policies
in place but did not report nor complement them in their SPACE COOLING EQUIPMENT
NDCs. Specifying intended actions in the buildings and con- Country policy 622
struction sector would help clarify and track the important
Country NDC 212
role the sector can play in meeting global GHG mitigation.
0 Emissions with policy coverage (MtCO2) 952
Despite progress, NDCs to date still fall short of tapping
into the 4.9 GtCO2 of potential annual emissions abate-
WATER HEATING EQUIPMENT
ment that could be achieved if countries were to pursue
strategic low-carbon and energy-efficient buildings Country policy 386
technology deployment.5 Globally, current policies cover
Country NDC 134
roughly 47% of buildings-related CO2 emissions. If NDC
0 Emissions with policy coverage (MtCO2) 1045
pledges are achieved in addition to those existing policies,
coverage would only likely be extended to about 60%.
LIGHTING
Country policy 822
Country NDC 152
0 Emissions with policy coverage (MtCO2) 1094
5 Further information on buildings sector carbon abatement potential Notes: MtCO2 = megatonnes of CO2. Indirect emissions from building envelopes
and technology policy strategies can be found in the IEA’s Energy are calculated based on the total carbon abatement potential related to heating and
Technology Perspectives 2017 (www.iea.org/etp). cooling in buildings.
9GLOBAL STATUS REPORT 2017
Human factors Connected devices that can improve building-occupant
The human factor, including occupant choices and interaction are taking off rapidly in many markets. For
behaviour in buildings, significantly affects energy use instance, smart thermostat adoption doubled from 3% in
in buildings. Building design and characteristics influ- 2014 to 6% in 2016 in the United States.7
ence occupant feeling of comfort (and therefore energy Smart building energy management can help to ensure
demand). Occupant behaviour and needs equally influence that energy is consumed when and where it is needed,
building operations and performance. improving the responsiveness and efficiency of building
Human factors can be addressed through a variety of energy services, while also accounting for user prefer-
measures, including but not limited to heating ventilation ences and improving the overall quality of life in buildings.
and air conditioning regulations (e.g. to ensure indoor air Smart buildings can also be at the forefront of decarbonis-
quality control), building design (e.g. to enable daylight har- ing the broader energy system, providing flexibility through
vesting, passive heating, passive cooling and optimised air energy controls, storage and demand response.8
flows) and construction materials (e.g. to enable greater Real-time data collected through the controls and sen-
thermal comfort). sors can also potentially help governments, utilities and
A few countries have already started to promote occu- customers to predict, measure and monitor real-time
pant-friendly technologies and building attributes that buildings energy use and performance. That data could
could enable energy savings. For instance, human factors be used to assess where action is needed (e.g. for building
are explicitly mentioned in building codes in the People’s maintenance), when investments are not performing as
Republic of China (hereafter, “China”’); some elements are expected or where intervention could deliver on energy
even mandatory requirements. Other countries, such as and emissions savings.
the United States and Canada, have made documentation
of best practices for building design and construction
available. Many countries in the European Union have
legislation in place for these issues.6
From an operational perspective, improved sensors
and user controls can enable improved human-building
interactions. IEA analysis on the role of digitalisation in
buildings finds that smart contols and connected devices
could save 230 EJ in cumulative energy savings to 2040,
lowering buildings energy consumption by as much as
10% globally, while improving thermal comfort and deliv-
ering greater amenity to building occupants (Figure 5).
Those savings would also help reduce the carbon intensity
of the power sector, through better management of energy
supply and demand across the grid. © Shutterstock
6 BPIE (Buildings Performance Institute Europe) (2015), Indoor Air Quality, Thermal comfort and Daylight: Analysis of Residential Building Regulations in
Eight EU Member States, Brussels, http://bpie.eu/wp-content/uploads/2015/10/BPIE__IndoorAirQuality2015.pdf
7 Wilczynski, E. (2017). “Turning Up the Heat: The Rapid Surge in Smart Thermostat Programs”, E Source, http://www.esource.com/Blog/ESource/ES-
Blog-3-6-17-Smart-Thermostats
8 BPIE (Buildings Performance Institute Europe) (2017), Opening the door to Smart Buildings, Brussels, http://bpie.eu/publication/opening-the-door-to-
smart-buildings/
10GLOBAL STATUS REPORT 2017
FIGURE 5 Energy saving potential from digitalisation (cumulative, 2018-2040)
250
200
150 Non-residential
EJ
100 Residential
50
0
Source: IEA (2017), Digitalization and Energy, IEA/OECD, Paris, www.iea.org/digital/
KEY POINT
Active controls could save up to 230 EJ cumulatively to 2040, roughly twice the
energy consumed by the entire buildings sector in 2017.
Transforming energy use in buildings and construction
sector will require a better understanding of people’s BETTER PLACES FOR PEOPLE
needs and expectations in buildings. Multiple examples In October 2016, the WorldGBC project Better Places
already exist that demonstrate how better buildings and for People released a report on Building the Business
building design influence occupant experience, behaviour Case for health, wellbeing and productivity in energy-
and energy demand. For instance, the World Green efficient and low-carbon buildings. The report features
Building Council (WorldGBC) is working across countries case studies illustrating how green buildings enhance
and partners to build an evidence base on the intersec- occupant health, wellbeing and productivity, which
tion between the human factor and energy demand and deliver business value for building owners and investors.
emissions in buildings. This includes the link between key For instance, call-centre productivity in Saint-Gobain's
building elements, such as indoor air or lighting quality, North American headquarters saw a 97% increase in
with building energy use, employee sick days and even sales-generated leads and a doubling in leads per call
worker productivity. after increasing daylighting by 25% and ensuring 90%
of workspaces had a view to the outdoors. WorldGBC
Quantifying the benefits of sustainable buildings and con-
is planning to release a similar follow-up report with
struction is a key element to demonstrate the business
15 additional case studies demonstrating the value of
value in accounting for human factors in buildings design
green buildings in March 2018.
and operation. For example, Skanska’s renovated office in
Bentley Works (United Kingdom) was certified as BREEAM
Excellent, and data collected by the human resources
team showed that employee sick days decreased by three
days on average compared to other Skanska offices. The
savings from that reduction were estimated at nearly
USD 37 000 in 2015.9
9 WorldGBC (World Green Building Council) (2016), Building the Business Case: Health, Wellbeing and Productivity in Green Offices, London, http://www.
worldgbc.org/sites/default/files/WGBC_BtBC_Dec2016_Digital_Low-MAY24_0.pdf
11GLOBAL STATUS REPORT 2017
Data and measurement EDF France provides users with an energy benchmark
The report Global Trends in Data Capture and Management dashboard that displays information on monthly electricity
in Real Estate and Construction found that while buildings and gas consumption relative to households with similar
data is often collected, the information is typically used by profiles. Links to information on energy-saving tips, tools
individual stakeholders and not shared for broader use.10 and even certified professional contacts can also be found
The survey also found that the value of that data is not well within the same dashboard tool.
understood, even within organisations that need better
data, limiting ability to access and use better information.
Transparency (e.g. through open databases and public TRACKING COOLING PROGRESS
disclosure) could remove many barriers regarding useful The Kigali Cooling Efficiency Programme (K-CEP),
data for buildings. established in 2017 to support the Kigali Amendment
to the Montreal Protocol, will launch an online
There are several new initiatives dedicated to improving
database and progress tracker in 2018. The data and
buildings data. The IEA technology collaboration pro-
tracker, hosted by the IEA Global Exchange Platform,
gramme on Energy in Buildings and Communities has
will work across countries and with K-CEP partners
created a programme of work (Annex 70) looking at actual
to track information on cooling equipment energy
building energy use and data across multiple countries.11
efficiency, refrigerants, investments and policies.
Annex 70 has a three part research effort to:
This data will be used to track progress towards high-
1. Compare approaches to developing buildings stock performance cooling technologies and the phase-down
data sets and models to identify and share lessons of hydrofluorocarbons with climate-safe coolants.
learned;
2. Establish best practice in methods used for gathering UNITED STATES
and analysing real building energy use data;
The Bullitt center is the first net-zero energy building in
3. Evaluate the scope for using that data to inform policy Seattle. The building has exceeded its original goal and
making and support industry in the development of low generated as much as 60% more energy than it actually
energy solutions. consumes. The building also has an online dashboard
that was developed to support energy-efficient
C40 Cities has similarly started a technical assistance behaviour and track how much energy the building is
programme to support private and municipal building using in real time.
efficiency networks with building energy data. The ICLEI
– Local Governments for Sustainability carbonn Climate
Registry (cCR) is another platform for cities, towns and DATA FOR SMART BUILDINGS
regions that allows for exchange, learning and bench-
The Smart Building Alliance (SBA) for smart cities,
marking among more than 1 000 registered entities while
created in 2012, brings together 200 organisations in
providing data that feeds into global climate negotiations.
France and aims at converging the digital transition
In the European Union, many member states, such as and energy transition of the buildings sector by
Denmark, Ireland and the Netherlands, now have publically promoting two quality charters, "Ready2Grid" and
accessible databases about the energy performance of "Ready2Services" that will help deliver offers and
individual buildings or clusters of buildings. This type solutions for active management of buildings through
of publically accessible data, collected through Energy interoperable and smart data. The two labels will be
Performance Certificates in Europe for example, could certified and will indicate the readiness of a building or
be expanded across other countries to map and monitor technology to deliver digital services, including ones
building energy performance.12 related to energy. The SBA hopes the labels will unlock
the potential for connected solutions that enable better
In many countries, utility companies are now also using data and management of energy use.
buildings energy data, such as electricity or gas consump-
tion, to provide useful information to consumers about their
energy consumption patterns and spending. For instance,
10 RICS (Royal Institution for Chartered Surveyors) (2017), Global Trends in Data Cature and Management in Real Estate and Construction, RICS Insights
Paper, https://www.rics.org/be/knowledge/research
11 More information can be found at https://energyepidemiology.org/
12 BPIE (Buildings Performance Institute Europe) (2015), Energy Performance Certificates Across the EU: A Mapping of National Approaches, Brussels,
http://bpie.eu/publication/energy-performance-certificates-across-the-eu/
12GLOBAL STATUS REPORT 2017
Image source: EDF France, https://equilibre.edf.fr
Priorities for action 1. URBAN PLANNING POLICIES FOR ENERGY EFFICIENCY AND
RENEWABLES
A global transformation to a highly ener-
Use urban planning policies to impact the form and compactness of
gy-efficient and low-carbon buildings and buildings to enable reduced energy demand and increased renewable
construction sector is key to ensure global energy capacity.
ambitions for a 2°C world or below.
2. IMPROVE THE PERFORMANCE OF EXISTING BUILDINGS
By 2060, buildings sector floor area will Increase the rate of building energy renovation and increase the level of
double, adding more than 230 billion m2 to energy efficiency in existing buildings.
the planet in new buildings construction.
Those additions are equivalent to building 3. ACHIEVE NET-ZERO OPERATING EMISSIONS
the current floor area of Japan every single Increase uptake of net-zero operating emissions for new and existing
buildings, including through system-level solutions such as zero-carbon
year from now until 2060.
district energy.
There is a critical window of opportunity 4. IMPROVE ENERGY MANAGEMENT OF ALL BUILDINGS
to address buildings and construction
Reduce the operating energy and emissions through improved energy
in the coming decade to avoid lock-in management tools and operational capacity building.
of inefficient buildings over the next 40
years. There is an equally critical need to 5. DECARBONISE BUILDING ENERGY
address energy performance improve- Integrate renewable energy and reduce the carbon footprint of energy
ments and emissions reduction in the demand in buildings.
world’s existing buildings stock. Swift and 6. REDUCE EMBODIED ENERGY AND EMISSIONS
ambitious action is needed without delay
Reduce the environmental impact of materials and equipment in the
to avoid locking in inefficient buildings buildings & construction value chain by taking a life-cycle approach.
assets for decades to come.
7. REDUCE ENERGY DEMAND FROM APPLIANCES
There are many strategies to reduce the Collaborate with global initiatives to reduce the energy demand from
energy and climate impact of buildings appliances, lighting and cooking.
and construction. Key priorities identified
8. UPGRADE ADAPTATION
by the GABC roadmap include:
Reduce climate-change related risks of buildings by adapting building
design and improving resilience.
9. INCREASE AWARENESS
Support training and capacity building including educational and
informative tools to make the case for sustainable buildings and
construction.
13GLOBAL STATUS REPORT 2017
Global Status
The global buildings sector consumed nearly 125 EJ in Accounting for upstream power generation, buildings rep-
2016, or 30% of total final energy use. Buildings construc- resented 28% of global energy-related CO2 emissions, with
tion, including the manufacturing of materials for building direct emissions in buildings from fossil fuel combustion
such as steel and cement, accounted for an additional 26 EJ accounting for around one-third of the total. Buildings
(nearly 6%) in estimated global final energy use (Figure 6). construction represented another 11% of energy sector
CO2 emissions (Figure 7).
FIGURE 6 Share of global final energy consumption by sector, 2015
Transport
28%
Buildings
30%
Other
5% Residential
22%
Other industry
31% Non-residential
8%
Construction industry
6%
FIGURE 7 Share of global energy-related CO2 emissions by sector, 2015
Transport
22% Residential (direct)
Buildings
6%
Other 28%
9%
Residential (indirect)
11%
Other industry Non-residential (direct)…
30%
Non-residential (indirect)…
Construction industry
11%
Note: The “construction industry” is an estimate of the portion of the overall industry sector that applies to the manufacturing of materials for building construction, such as steel,
cement and glass.
Source: derived with IEA (2017), World Energy Statistics and Balances, IEA/OECD, Paris, www.iea.org/statistics
KEY POINT
Buildings and construction account for more than 35% of global final energy
use and nearly 40% of energy-related CO2 emissions.
14GLOBAL STATUS REPORT 2017
Globally, the buildings sector continues to fall short of its Between 2010 and 2016, population growth, rising
potential. CO2 emissions from buildings and construction floor area per person and greater demand for energy
rose by nearly 1% per year between 2010 and 2016, releas- services all contributed to an additional 57 EJ of cumu-
ing 76 GtCO2 in cumulative emissions during that period. lative growth over 2010 buildings energy consumption
(Figure 8). This increase in new energy demand in build-
A growing number of countries have put in place policies ings is equal to all the final energy consumed by Germany
to improve buildings energy performance. However, a during that period.
rapidly growing buildings sector, especially in developing
countries, has offset those improvements.
FIGURE 8 Decomposition of buildings final energy consumption by key contributions, 2010-2016
Notes: “Activity” represents changes in energy use per m2 (which can be due to human factors, ownership of energy-consuming equipment or growth in services value added).
“Envelope improvements” account for buildings measures that improve the energy intensity of the building envelope. “Product performance” represents energy technology efficiency
improvements. “Technology choice” represents shifts from one type of equipment and/or fuel to another. “Others” includes greater access to electricity, changes in energy demand
influences (e.g. annual cooling degree days) and any residual energy from the decomposition analysis.
Sources: Population: UN DESA (2015), World Population Prospects: The 2015 Revision, Medium Fertility Variant; services value added derived with IMF (2016), World Economic
Outlook Database: April 2016; energy decomposition calculations derived with IEA (2017), World Energy Statistics and Balances (database), http://dx.doi.org/10.1787/enestats data en
KEY POINT
Despite progress, energy efficiency improvements since 2010 have not been
enough to offset strong growth in energy demand from rising population, floor
area and buildings sector activity.
15GLOBAL STATUS REPORT 2017
FIGURE 9 Buildings sector energy consumption by fuel shares, 2010 and 2016
Source: IEA (2017), World Energy Statistics and Balances (database), http://dx.doi.org/10.1787/enestats-data-en
KEY POINT
Nearly two-thirds of global buildings sector energy consumption is supplied by
fossil fuels for direct use or for upstream power generation.
By contrast, policy efforts, technology choice and energy The share of fuels used in buildings continues to be
efficiency measures all helped to avoid 24 EJ of final very different between OECD and non-OECD countries
energy demand growth in buildings between 2010 and (Figure 9). Many non-OECD countries still rely on traditional
2016. Those energy demand offsets are equivalent to use of solid biomass (e.g. for cooking), which accounted
the energy produced by more than 340 coal power plants for one-third of total final energy demand in buildings in
during the same period.13 those countries in 2016.
Other energy savings effects, including greater access to On a positive note, traditional use of biomass per person in
electricity in developing countries, helped to offset another non-OECD countries declined steadily by around 0.5% per
14 EJ of cumulative final energy growth since 2010. year since 2010, due to a combination of factors, includ-
ing urbanisation, increasing income and greater access
The net result is that global buildings energy use increased to modern commercial fuels. Still, the improvement was
(cumulatively) by 19 EJ between 2010 and 2016, equal to not enough to offset strong population growth in those
the total final energy used in Australia during that period. countries, which increased on average by 1.3% per year
between 2010 and 2016.
Globally, fossil fuel use in buildings accounted for 36% of
total final energy consumption in 2016, down slightly from
38% in 2010. Yet, that change does not tell the whole story:
coal and oil use in buildings has remained practically con-
stant since 2010. Natural gas use grew steadily by about
1% per year.
When fossil fuel input for electricity and commercial
heat production is accounted for, this means that nearly
two-thirds of buildings energy consumption was supplied
by fossil fuels in 2016. Excluding for traditional use of
biomass, that share rises to more than 80%.14
13 A typical 500 megawatt coal power plant produces roughly 2.8 TWh per year running 5 600 hours per year at full capacity.
14 IEA (2017), World Energy Statistics and Balances (database), http://dx.doi.org/10.1787/enestats‐data‐en
16GLOBAL STATUS REPORT 2017
FIGURE 10 Buildings sector energy-carbon intensities by country, 2015
No data
> 150 tonnes CO2 per TJ
100 to 150 tonnes CO2 per TJ
50 to 100 tonnes CO2 per TJ
< 50 tonnes CO2 per TJ
Notes: 1 tonne CO2 per terajoule = 3.6 grams CO2 per kWh. Energy-carbon intensities represent the building-related CO2 emissions (including direct emissions from fossil fuel
combustion and indirect emissions from upstream power generation for electricity and commercial heat) per unit of final energy consumption in the buildings sector. These do
not include primary energy for production of electricity of electricity and commercial heat. Final energy use in buildings excludes traditional use of biomass.
Sources: IEA, calculations derived from IEA World Energy Statistics and Balances 2017, www.iea.org/statistics; IEA (2017), Energy Technology Perspectives 2017, IEA/OECD,
Paris, www.iea.org/etp
KEY POINT
Current buildings energy-carbon intensities are far from the 20 tonnes CO2 per TJ or
less needed by 2050 to meet ambitions for a 2°C world or below.
Global use of electricity in buildings grew on average by and renewables have helped improve the CO2 intensity
2.5% per year since 2010, with electricity accounting for of electricity. However, when buildings sector electricity
nearly 70% of the total growth in buildings final energy demand growth is accounted for, the net result is that
demand since 2010 and representing one-third of total buildings-related emissions from upstream power have
energy use in buildings in 2016. In some rapidly emerging remained practically constant since 2010.
economies, such as India and Indonesia, electricity use in
buildings increased by more than 500% since 2010. When power sector carbon intensities are added to the
overall fuel mix of the global buildings sector, the vast
By contrast, buildings electricity demand in OECD coun- majority of countries today have buildings-related carbon
tries has remained relatively stable in recent years, largely intensities (in tonnes of CO2 per terajoule [TJ]16) that are far
due to energy efficiency improvements. At the same time, from the CO2 intensities required to meet ambitions for 2°C
electricity use is still up 25% since 2000. or below (Figure 10). In order to meet those ambitions set
forth in the Paris Agreement, buildings sector energy-car-
Overall, the buildings sector represents nearly 55% of bon intensities need to decrease to less than 20 tonnes of
global electricity demand. Buildings continue to place a CO2 per TJ before 2050.17
growing demand on the power sector, whose average effi-
ciency was only 43% in 2015.15 Low-carbon power supply
15 This excludes electricity produced by co-generation (the combined production of heat and power), which accounted for roughly 9% of total global
electricity production in 2015 and had an average global efficiency (main activity producers) of 60%
16 Energy-carbon intensities for the buildings sector have been estimated without energy demand from traditional use of biomass, as this is largely
speaking an energy access and affordability issue in developing countries.
17 IEA (2017), Energy Technology Perspectives 2017, IEA/OECD, Paris, www.iea.org/etp.
17GLOBAL STATUS REPORT 2017
Buildings-related climate commitments
Country commitments
FIGURE 11 Buildings sector emissions coverage as per explicit intended actions in country NDCs
New in 2016
New in 2017
No known NDC
No explicit coverage
Coverage less than 25%
Coverage less than 50%
Coverage less than 75%
Coverage above 75%
Notes: Emissions coverage is estimated using specific mentions of measures related to the buildings sector, buildings end-use or technology with respect to 2016 buildings
sector CO2 emissions. Country NDCs that do not explicitly mention building measures or actions, for example in the case of economy-wide targets in the European Union, have not
been counted in the emissions coverage. Additional information on country policy coverage can be found in other sections of this report (e.g. on building energy codes).
Sources: IEA estimated derived using IEA World Energy Statistics and Balances 2017, www.iea.org/statistics and IEA (2017), Energy Technology Perspectives 2017, IEA/OECD,
Paris, www.iea.org/etp
KEY POINT
Buildings-related NDCs only cover less than 15% of buildings sector emissions
beyond existing country policies.
NDC SUBMISSIONS
NDCs have a large role to play in reporting upon and com-
plementing existing policies to achieve country mitigation NDCs 192
targets. Overall, country submissions have been positive, Buildings 132
with 132 NDCs explicitly mentioning the buildings sector
Energy efficiency 101
in their intended actions.
Renewables 49
At the same time, nearly one-third of NDCs mentioning 0 Number of countries 195
buildings do not indicate any specific actions on how they
would achieve their ambitions, even if existing or planned
BUILDING ENERGY CODES
national policy actions may address the buildings and in line with a low-carbon transition. Current ambitions
construction sector. Hence emission coverage for country Country policy 62
set forth in the NDCs only cover around 13% of global
policies exceeds coverage of NDCs (Figure 4). Country
buildings NDC CO2
sector 40 emissions. Specifying buildings and
construction actions
0 in country NDCs would
Number of therefore
countries help
195
Assertive effort is needed to expand upon current
to clarify and track progress, while equally highlighting the
commitments and ensure that NDCs translate into real
global priority and importance of addressing emissions
investments that transform buildings and construction BUILDING ENERGY CERTIFICATIONS
mitigation in the sector.
Country policy 84
Country NDC 1
18
0 Number of countries 195
BUILDING ENVELOPESGLOBAL STATUS REPORT 2017
Local governments to participate in Energy Efficiency in Buildings (EEB)
In March 2017 in the United States, 383 Climate Mayors Amplify project, launched at COP22 in Marrakesh. The
representing more than 20% of the United States popula- project seeks to apply a business-led approach to develop
tion committed to act in support of the goals set forth in and implement action plans leading to energy efficiency in
the Paris Agreement. buildings.19 To date, EEB Amplify has already worked with
stakeholders across the building value chain in 10 pilot
In June 2017, mayors of 140 of the world’s largest cities markets and is working to increase this to 50 further inter-
expressed commitment to climate goals, along with sup- ventions by 2020 in other regions.
port from United Cities and Local Governments (UCLG),
C40 Cities Climate Leadership Group (C40) and ICLEI – In May 2017, the WorldGBC launched a call to businesses,
Local governments for Sustainability.18 All in all, more than governments and non-governmental organisations to
7 500 local authorities of all sizes are now involved in the dramatically increase ambitions and transform the global
Global Covenant of Mayors for Climate and Energy. buildings sector. From Thousands to Billions- Coordinated
Action towards 100% Net-Zero Carbon Buildings seeks to
Private sector have all new buildings operate at net-zero carbon from
2030. It also calls for 100% of buildings meeting net- zero
In 2017, the World Business Council for Sustainable
carbon by 2050.20
Development (WBCSD) called on its member companies
NEW NDCS SUBMITTED IN 2016 AND 2017
2 countries submitted NDCs in 2017
Timor-Leste promoted clean cook stoves to reach a target of 20 000 households. It also mentioned energy-efficient
lamps and building codes as way to drive energy-efficiency in the buildings sector.
Uzbekistan announced its plan to improve energy efficiency in buildings through a programme of measures to
transition to low-carbon development. The NDC specifies that the electricity, housing and utility sectors will be
included in the programme.
6 countries submitted NDCs in 2016
Democratic People’s Republic of Korea identified low-carbon products such as high-performance heat pumps
and solar hot water heaters to replace coal-fired space heaters or hot water heaters in buildings. The NDC also
mentions energy-efficient wood stoves to replace conventional wood and coal stoves, as well as energy-efficient air
conditioners.
Sri Lanka announced its plan to use solar water heating technology combined with other renewable energy sources,
such as wind and biomass, for tourism facilities. It also pledged to use building management systems to take
advantage of demand side response in buildings.
Pakistan pledged to use energy standards and labelling (ESL) to deploy high-efficiency technologies for lighting,
space heating, refrigerators and air conditioners. The NDC also notes efforts strengthen public sector capacity to
promote, regulate and monitor ESL for manufacturers and importers.
Chile outlined its national construction strategy, setting forth guidelines to integrate the concept of sustainable
development in the construction sector.
Panama and Malaysia submitted economy-wide targets, but without specific mention of buildings.
18 UNFCCC (2017), “Mayors of 140 of World’s Largest Cities Express Commitment to Paris Goals”, 23 June 2017, http://newsroom.unfccc.int/paris-
agreement/the-cities-of-the-world-proclaim-the-montreal-declaration/
19 WBCSD (2016), “Energy Efficiency in Buildings: time to amplify action in 50 cities by 2020”, 10 November 2016, http://www.wbcsd.org/Projects/
Energy-Efficiency-in-Buildings/News/WBCSD-and-partners-launch-EEB-Amplify-at-COP22
20 For more information, visit http://www.worldgbc.org/advancing-net-zero
19GLOBAL STATUS REPORT 2017
Pathways to Sustainable Buildings
and Construction
Today’s critical challenge is to ensure the momentum The 2°C Scenario (2DS), consistent with a 50% probability
around the transformation of buildings and construction to limit the expected global average rise of temperatures
and to speed up its progress. The current trajectory falls below 2°C, reflects the need to deploy high-efficiency
short. The IEA’s Reference Technology Scenario (RTS), and low-carbon solutions for buildings and construction.
which accounts for existing building energy policies and Global buildings final energy demand in the 2DS stabilises
climate-related commitments, shows that final energy around 130 EJ beyond 2030, with buildings-related CO2
demand in the global buildings sector will increase by 30% emissions dropping by 85% over current levels by 2060.
by 2060 if more ambitious effort is not made to address Around 55% of those reductions are from low-carbon
low-carbon and energy-efficient solutions for buildings power generation, which is supported by energy-efficiency
and construction (Figure 12). As a result, buildings-related measures in buildings.
CO2 emissions would increase by another 10% by 2060,
adding as much as 415 GtCO2 to the atmosphere over the
next 40 years – half of the remaining 2°C carbon budget
and twice what buildings emitted between 1990 and 2016.
FIGURE 12 Buildings sector final energy consumption by scenario and fuel type, 2016 – 2060
175 175
150 150 Renouvelables
Chaleur commerciale
125 125
Electricité
kWh/m2
100 100
Gaz naturel
EJ
75 75 Pétrole
50 50 Charbon
Biomasse (traditionnelle)
25 25
0 0
2016 2030 2045 2060 2030 2045 2060 2030 2045 2060 Intensité énergétique
RTS 2DS B2DS
Source: IEA (2017), Energy Technology Perspectives 2017, IEA/OECD, Paris, www.iea.org/etp
KEY POINT
Achieving the 2DS or B2DS requires a major shift to put global buildings on a
highly energy-efficient and net-zero carbon pathway to 2060.
20GLOBAL STATUS REPORT 2017
FIGURE 13 Key contributions to CO2 emissions reduction in the global buildings sector to 2060
10 RTS
Direct emissions
8 reduction
Envelope
6 improvement
Gt CO 2
4 Technology choice
2 Technology
2DS performance
0
B2DS Indirect (power)
-2
Notes: “Direct emissions reduction” represents a decrease in emissions from reductions in direct fossil fuel consumption in the buildings sector. “Envelope improvements” include
measures (including deep energy renovations) that improve the energy intensity of the building envelope. “Technology choice” represents shifts from one type of technology and/
or fuel to another (e.g. incandescent lamps to LEDs or gas boilers to electric heat pumps). “Technology performance” represents energy technology efficiency improvements (e.g.
higher operational performance for heat pumps). “Indirect (power)” emissions reduction is from improved carbon intensities of power generation, where negative emissions are
from carbon capture and storage (CCS) technologies.
Source: IEA (2017), Energy Technology Perspectives 2017, IEA/OECD, Paris, www.iea.org/etp
KEY POINT
Accelerated energy-efficiency and a shift away from fossil fuels are needed to
achieve net-zero emissions in the buildings sector before 2060.
The Beyond 2°C Scenario (B2DS) sets out a rapid decar- Capturing the enormous energy savings potential in the
bonisation pathway in line with goals set forth in the global buildings sector would deliver a broad range of
Paris Agreement to limit future temperature increases benefits, including significant reductions in CO2 emissions
to well-below 2°C. The B2DS includes a rapid adoption and other pollutants that pose a threat to human health.
of highly efficient, low-carbon solutions for buildings and Achieving the 2DS already requires an unprecedented
construction, including: rigorous and widespread appli- effort to develop and deploy energy-efficient and low-car-
cation of building energy codes, broad-scale renovation bon technologies over the next 40 years, using a broad
of the existing buildings stock, aggressive deployment of range of policy measures and market incentives. Going
high-performance technologies and a strategic shift away beyond the 2DS would require even swifter and more
from fossil fuel use in buildings. The B2DS reverses histor- assertive policy action to drive innovation and move
ical trends of increasing energy demand in buildings and markets as quickly as possible over the next decade to
results in a net decrease in energy demand below 115 EJ best buildings practices and low-carbon, high-efficiency
by 2060, reaching net-zero emissions in the buildings technology solutions.
sector before 2060 (Figure 13).
The B2DS represents more than 275 GtCO2 of cumulative
emissions reduction to 2060 compared with the RTS –
more than all the carbon emissions produced by the global
energy sector between 2006 to 2014. Shifts away from
fossil fuels, alongside building envelope measures, tech-
nology choice (e.g. LED lamps) and continued improve-
ments in product performance (e.g. higher efficiencies for
heat pumps) all contribute to 140 GtCO2 of total emissions
reduction attributable to buildings. Those measures also
play a key role in supporting decarbonisation of the power
sector by 2060.
21GLOBAL STATUS REPORT 2017
Building envelope improvements The transition to sustainable buildings needs assertive
Building envelope design, materials and construction all implementation and enforcement of building energy
have a large influence on heating and cooling loads in codes for new construction across all countries. It also
buildings, which represented nearly 3.5 GtCO2 of emis- requires an aggressive scaling up of deep building energy
sions from buildings in 2015. More importantly, choices renovations of the existing global stock. Rapid progress
in building envelope investments can influence building is needed to double the average annual improvement in
energy demand and emissions for decades or more. global building envelope performance (in kWh/m2) from
around 0.75% to more than 1.5% per year.
The energy savings potential from improved building
envelope performance improvements is huge: globally, This would require enormous effort (including appropriate
high-performance buildings construction and deep energy financing mechanisms) to ensure markets adopt best
renovations of existing building envelopes represent a sav- practices and high-performance envelope technology
ings potential more than all the final energy consumed by solutions, especially in rapidly emerging economies
the G20 countries in 2015, or around 330 EJ in cumulative where new construction risks locking in less-than-optimal
energy savings to 2060.21 investments.
Technology choice
FIGURE 14 Heating and cooling final energy use and equipment stock shares by scenario to 2060
Notes: Excludes traditional use of solid biomass. Fossil fuel equipment includes coal boilers, oil boilers and all gas-powered technologies (e.g. gas condensing boilers).
Conventional electric equipment includes electric resistance, instantaneous heaters and electric heat pumps with an efficiency below 300%. Efficient electric equipment includes
electric heat pumps with efficiencies greater than 300%. Renewables include solar thermal equipment and efficient biofuels.
Source: IEA (2017), Energy Technology Perspectives 2017, IEA/OECD, Paris, www.iea.org/etp.
KEY POINT
Energy-efficient and low-carbon heating and cooling technology investments
would reduce final energy demand in buildings by 25 % over current levels.
21 IEA, Energy Technology Perspectives 2017, www.iea.org/etp/
22You can also read