Non-technical Challenges in Developing Offshore Renewable Energy Projects - North Sea Solutions for Innovation in Corrosion for Energy
←
→
Page content transcription
If your browser does not render page correctly, please read the page content below
Non-technical
   Challenges in
   Developing Offshore
   Renewable Energy
   Projects
   North Sea Solutions for Innovation
   in Corrosion for Energy

   June
   2018

nessieproject.com
The NeSSIE project (2017-2019) seeks to deliver new business and investment opportunities in
corrosion solutions and new materials for offshore energy installations. The project aims to draw on
North Sea regional expertise in traditional offshore sectors (i.e. oil and gas, shipbuilding) in order to
develop solutions for emerging opportunities in offshore renewable energy sources (wave, tidal and
offshore wind energy).

The NeSSIE project is cofunded by the European Maritime and Fisheries Fund (EMFF).

© NeSSIE - North Sea Solutions for Innovation in Corrosion for Energy – 2018
Non-technical Challenges in developing Offshore Renewable Energy Projects        Project NeSSIE

PUBLICATION
This report has been produced by the NeSSIE Project Consortium (Deliverable 3.1).

DISCLAIMER
This publication reflects only the authors’ views and the European Union is not responsible
for any use that may be made of the information contained therein.

Reproduction is authorised provided the source is acknowledged.

Source: NeSSIE Project – cofunded by the European Maritime and Fisheries Fund (EMFF)
– www.nessieproject.com

AUTHORS
Leonore van Velzen(UEDIN)
Mark Laurie (UEDIN)
Shona Pennock (UEDIN)
Marcos Suarez Garcia (BEC)
Uxue Goitia Barrenetxea (BEC)

ACKNOWLEDGEMENTS
Thanks to the NeSSIE project partners for their review of, and contribution to, this report.
Non-technical Challenges in developing Offshore Renewable Energy Projects                                                         Project NeSSIE

Table of Contents
1     Acronyms ........................................................................................................................................ 8
2     Executive Summary ........................................................................................................................ 9
3     Introduction .................................................................................................................................. 10
4     Market development .................................................................................................................... 12
    4.1      Market Wave and Tidal energy ....................................................................................................... 13
      4.1.1          Market status and prospects ................................................................................................... 13
      4.1.2          LCOE status and prospects ...................................................................................................... 15
    4.2      Market Offshore Wind energy......................................................................................................... 16
      4.2.1          Market status and prospects ................................................................................................... 16
      4.2.2          LCOE status and prospects ...................................................................................................... 18
    4.3      Capacity targets of North Sea basin countries ................................................................................ 18
    4.4      ORE Market Challenges ................................................................................................................... 19
      4.4.1          The combination of technical and non-technical challenges .................................................. 20
5     Finance mechanisms .................................................................................................................... 21
    5.1      Early stage demonstration project funding ..................................................................................... 21
      5.1.1          Public early stage demonstration project funding .................................................................. 22
      5.1.2          Private early stage demonstration project funding ................................................................ 22
    5.2      Finance over medium to long term ................................................................................................. 23
    5.3      Finance Wave and Tidal energy ....................................................................................................... 25
      5.3.1          Finance status and prospects .................................................................................................. 25
      5.3.2          Public early stage funding........................................................................................................ 26
      5.3.3          Private early stage funding ...................................................................................................... 28
      5.3.4          Medium to long term funding ................................................................................................. 28
    5.4      Finance Offshore Wind energy ........................................................................................................ 28
      5.4.1          Status and prospects ............................................................................................................... 28
      5.4.2          Public early stage funding........................................................................................................ 29
      5.4.3          Private early stage funding ...................................................................................................... 30
      5.4.4          Medium to long term financing ............................................................................................... 30
    5.5      Financing ORE in North Sea basin countries.................................................................................... 31
    5.6      ORE Funding Challenges .................................................................................................................. 33
      5.6.1          Public funding coordination .................................................................................................... 33
      5.6.2          Funding coverage for trajectory to commercialisation ........................................................... 33

                                                                                                                                                            4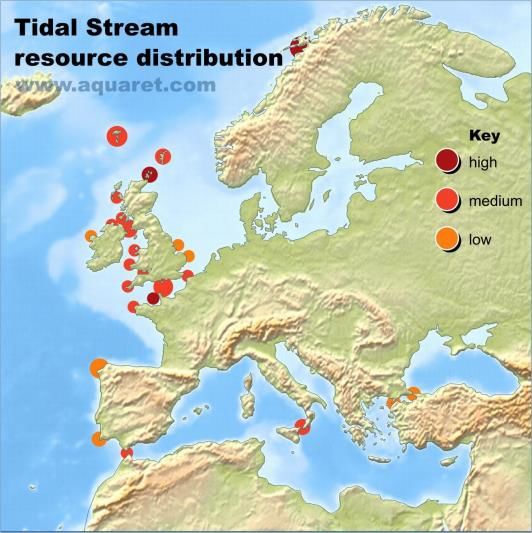
Non-technical Challenges in developing Offshore Renewable Energy Projects Project NeSSIE
5.6.3 Communication ....................................................................................................................... 34
6 Infrastructure................................................................................................................................ 35
6.1 Hard infrastructure .......................................................................................................................... 35
6.2 Soft Infrastructure ........................................................................................................................... 38
6.3 Infrastructure in the North Sea basin countries .............................................................................. 39
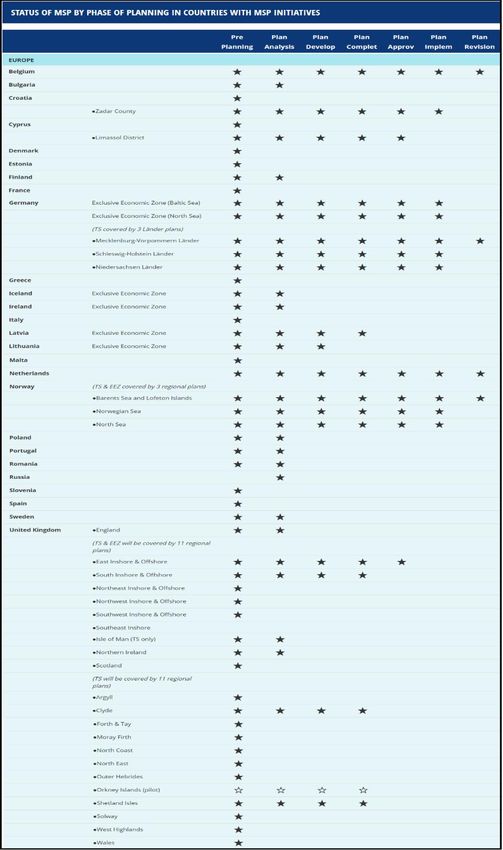
6.3.1 Marine Spatial Plans ................................................................................................................ 39
6.3.1 ORE deployment ‘Hotspots’ .................................................................................................... 41
6.4 ORE Infrastructure challenges ......................................................................................................... 42
6.4.1 Conflicts of use ........................................................................................................................ 42
6.4.2 Lack of skilled workers ............................................................................................................. 42
6.4.3 Grid capacity ............................................................................................................................ 42
7 Regulatory structure/instruments................................................................................................ 43
7.1 Regulatory aspects .......................................................................................................................... 43
7.1.1 Laws and Regulations .............................................................................................................. 43
7.1.2 Consenting and Licensing ........................................................................................................ 44
7.1.3 Environmental Impact Assessments ........................................................................................ 45
7.1.4 Standards and Certification ..................................................................................................... 46
7.2 Regulations in North Sea basin countries ........................................................................................ 47
7.3 ORE Regulation challenges .............................................................................................................. 48
7.3.1 Uncertainties environmental impact ....................................................................................... 48
7.3.2 Consenting and Licensing uncertainties .................................................................................. 48
7.3.3 Standards/certification process............................................................................................... 48
8 Conclusion .................................................................................................................................... 50
8.1.1 Market structure ..................................................................................................................... 50
8.1.2 Financial mechanisms .............................................................................................................. 50
8.1.3 Infrastructure........................................................................................................................... 50
8.1.4 Regulatory aspects .................................................................................................................. 50
9 References .................................................................................................................................... 51
10 Appendix I ..................................................................................................................................... 58
5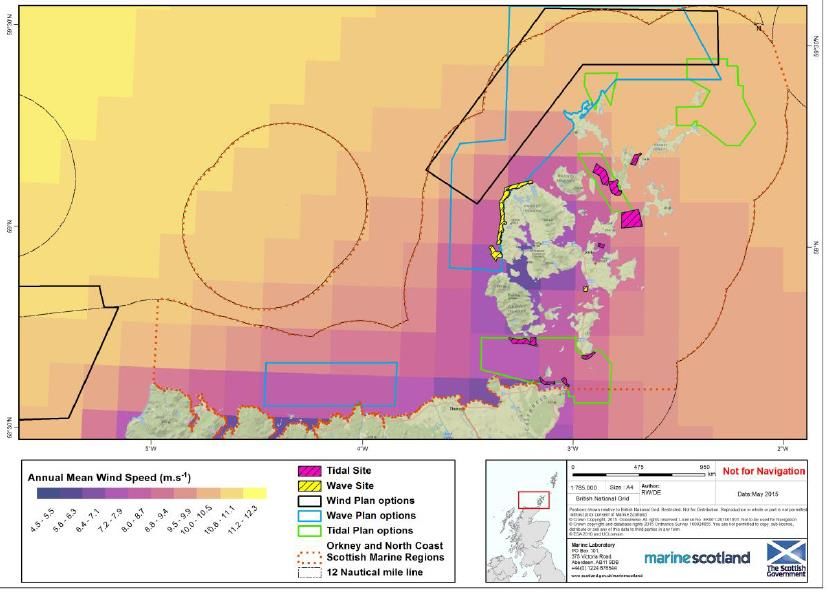
Non-technical Challenges in developing Offshore Renewable Energy Projects Project NeSSIE
List of Figures
Figure 1 – Integration of WP2 and WP3 deliverables to produce final Roadmap and NeSSIE mission goals ....... 10
Figure 2 – Expected development of marine energies, based on [3] .................................................................... 13
Figure 3 – Map of wave energy resource In Europe [5] ........................................................................................ 14
Figure 4 – Map of tidal current resource In Europe [7] ......................................................................................... 15
Figure 5 – Expected Wave & Tidal LCOE evolution as of cumulative deployment [10] ......................................... 16
Figure 6 – Global Cumulative Offshore Wind Capacity in 2016 [12] ..................................................................... 16
Figure 7 – European offshore wind project pipeline five-year outlook [13] .......................................................... 17
Figure 8 – Offshore wind LCOE range and trajectory from 2015 to 2030, including estimated LCOE [15] ........... 18
Figure 9 – Average investment distribution breakdown for each renewable technology in 2016 [34] ................ 21
Figure 10 – Investor type by risk appetite and technology readiness of wave and tidal energy [35] ................... 23
Figure 11 – Cumulative wind energy investment in Europe up to 2013 [36] ........................................................ 24
Figure 12 – Major equity investors in offshore wind in 2016 [37] ........................................................................ 24
Figure 13 – Investment outlook in new assets for the period 2010-2020 under WindEurope’s Central Scenario (in €bn)
[40]........................................................................................................................................................................ 29
Figure 14 – Summary of market push and pull mechanisms for ocean energy in the EU based on Carbon Trust
deployment scenarios [6] ...................................................................................................................................... 34
Figure 15 – Mean annual wind speed (m/s) across PFOW area [58] .................................................................... 36
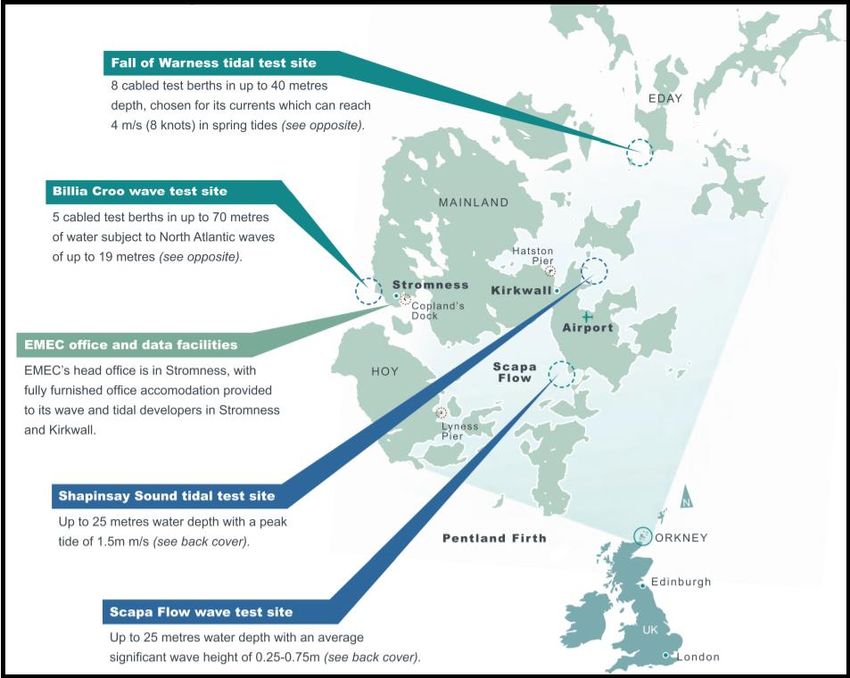
Figure 16 – EMEC test centre location and facilities [59] ..................................................................................... 36
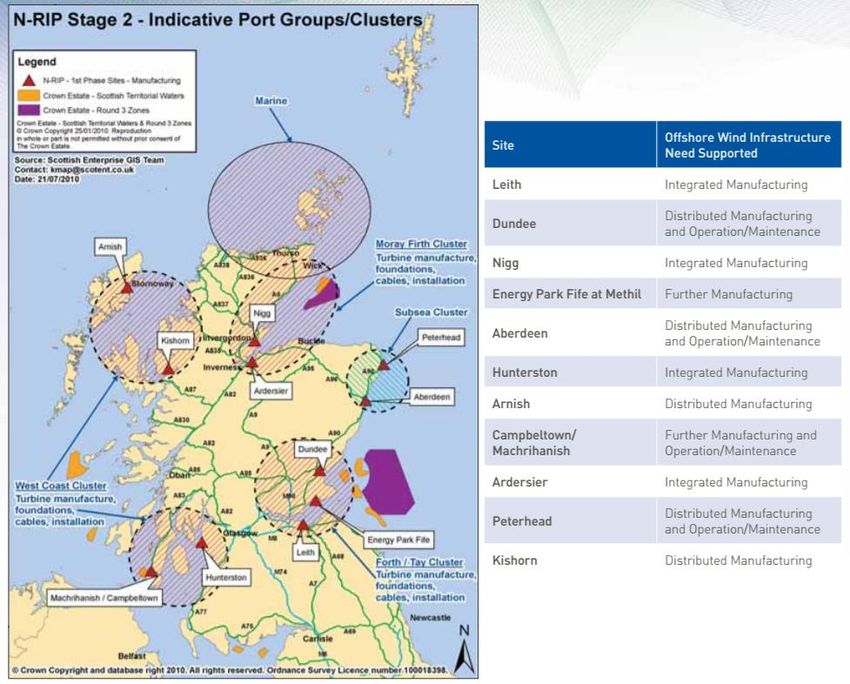
Figure 17 – Scotland’s regional supply chain support to the offshore wind industry [60] .................................... 37
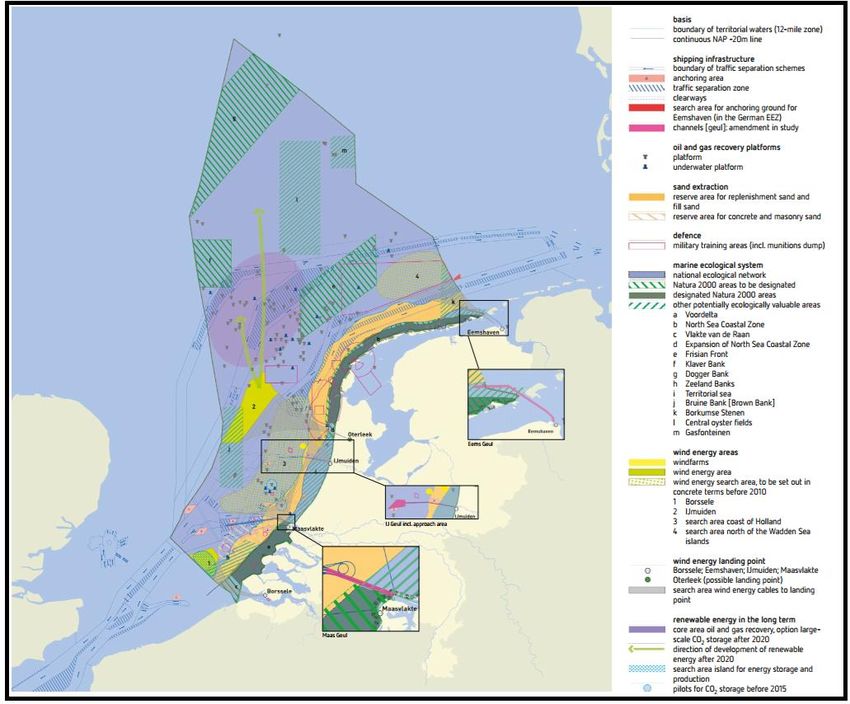
Figure 18 – Dutch National Water Plan 2009-2015 showing wind farm and onshore port locations [62] ........... 38
Figure 19 – Cyclical process of the Marine Directive [96] ..................................................................................... 44
Figure 20 – Existing UK SEA programmes conducted prior to 2008 [105] ............................................................ 46
Figure 21 – Stage-gate metrics to be developed around the challenges of ocean energy [114] .......................... 47
6
Non-technical Challenges in developing Offshore Renewable Energy Projects                                                                        Project NeSSIE

List of Tables
Table 1 – Examples of wave energy projects in operation in 2017 in the North Sea basin, based on [4] ......................... 13

Table 2 – Examples of tidal current projects in operation in 2017 in the North Sea basin based on [4] .......................... 14

Table 3 – Offshore wind resource and potential floating wind capacity in Europe, USA, and Japan [14] ........................ 17

Table 4 – Renewable energy capacity targets of North Sea basin countries, including wave, tidal and offshore wind
energy activities. ............................................................................................................................................................... 19

Table 5 – Offshore wind funding structures based on WindEurope report [36] ............................................................... 25

Table 6 – H2020 projects funded to support wave energy innovation actions [6] ........................................................... 26

Table 7 – H2020 projects funded to support tidal energy innovation actions [6] ............................................................. 27

Table 8 – Examples of European Funding mechanisms for wave and tidal energy [39] ................................................... 28

Table 9 – Examples of H2020 funded wind energy projects [42] ...................................................................................... 30

Table 10 – Push and Pull support mechanism within the North Sea basin countries [6] .................................................. 32

Table 11 – Marine Spatial Plans (MSPs) of North Sea basin countries ............................................................................. 39

Table 12 – Status of Marine Spatial Planning across the EU [58] .................................................................................... 40

Table 13 – Examples of infrastructure hotspots for ORE demonstration projects in the North Sea basin ........................ 42

Table 14 – Examples of International Conventions, Agreements and Directives applicable to Marine Renewable Energy
project development (adjustment of NeSSIE D2.2 report) ................................................................................................ 43

Table 15 – Examples of Acts and Regulations in North Sea basin countries that implement the Marine Strategy
Framework Directive ......................................................................................................................................................... 48

                                                                                                                                                                                   7
Non-technical Challenges in developing Offshore Renewable Energy Projects   Project NeSSIE

1     Acronyms

ACS    Anti-corrosion solution
CAPEX Capital expenditure
GWEC Global Wind Energy Council
IRENA International Renewable Energy Agency
JRC    Joint Research Centre
LCOE   Levelised Cost of Energy
MSP    Marine Spatial Plan
NREAP National Renewable Energy Action Plan
O&M    Operation and Maintenance
OEM    Original equipment manufacturers
OPEX   Operating expenditure
ORE    Offshore renewable energy
OWT    Offshore wind turbine
RES    Renewable energy source
SME    Small to Medium size Enterprise
TEC    Tidal energy converter
WEC    Wave energy converter
WP     Work Package

                                                                                             8
Non-technical Challenges in developing Offshore Renewable Energy Projects               Project NeSSIE

2   Executive Summary

This report supports the aim of NeSSIE to develop Offshore Renewable Energy (ORE) demonstration projects
related to corrosion issues through the identification of the current landscape. An overview of the market,
finance, infrastructure and regulatory status regarding ORE in Europe, specifically for the North Sea basin
countries, followed by the challenges encountered in these areas for the development of ORE towards
commercialisation.

In terms of market deployment, wave and tidal energy are at a relatively early stage, followed by floating
offshore wind, whereas fixed offshore wind has reached commercialisation. It is expected for marine energy
generation to move towards industrial roll-out by 2030. Market challenges for ORE to reach their deployment
potential are varied and specifically the combination of technical and non-technical challenges. These include
affordability, performance, standardisation, reliability, survivability, installability and environmental
considerations.
Due to the early stage of marine energy, project development comes with high risks, resulting in difficulties
in securing funding. For these early stage ORE technologies to move towards commercialisation, financial
support throughout the complete trajectory towards commercialisation is required to avoid technologies
disappearing in the ‘valley of death’ between demonstration and commercial status. To ensure sufficient and
appropriate funding sources, the need for coordination is expressed.
Both hard and soft infrastructure aspects are of relevance to the ORE sector. Hard infrastructure refers to
the tangible facilities such as ports, vessels, transport, power, manufacturing facilities, etc. required to
facilitate the ORE roll-out. Soft infrastructure encompasses the health and safety regulations and legislation,
personnel training, design/manufacturing standards and offshore environmental impact assessments
required. Identified infrastructure challenges are a conflict of marine space, the lack of skilled workers and
an insufficient grid capacity for these renewable energy sources to be connected.
Within the European Union and the Member States, there are different legal instruments, with different
levels of enforcement power that are of importance to the implementation of the demonstration projects in
the North Sea basin.
Regulatory challenges encountered in the ORE sector are found to be related to the uncertainties in
consenting and the uncertainties of the environmental impact. In addition, the need for a clear and
encompassing certification process is indicated.

The findings of this report feed in to the NeSSIE Roadmap (Deliverable D3.4), which aims to provide a pathway
to the reduction of lifetime costs of ORE components through the use of anti-corrosion solutions (ACSs) by
identifying and prioritising the key challenges associated with ACS in the ORE sector.

                                                                                                             9
Non-technical Challenges in developing Offshore Renewable Energy Projects Project NeSSIE
3 Introduction
This report seeks to research the non-technological challenges inherent in the larger construction of the
NeSSIE Roadmap and Investment Plan to apply anti-corrosion solutions (ACSs) in the offshore renewable
energy (ORE) sector. ACSs refer to corrosion mitigation, management, monitoring as well as novel materials
usage.
NeSSIE builds on the partnerships formed in the Vanguard Initiative Energy Pilot to build robust, high-integrity
manufacturing value chains for marine offshore energy applications by identifying common areas of
expertise, identifying common challenges and developing networks to support innovative technology/service
developments. A key identified technology challenge considered was corrosion in water and corrosion
protection for marine operating devices, which have been traditionally made using steel which is highly
susceptible to corrosion in salt water. The ultimate aim is to reduce the lifetime costs of offshore renewable
energy technology components, and make devices cheaper to construct, install and operate – thus lowering
their levelised cost of electricity (LCOE) generation. Anti-corrosion systems will lead to maintaining and
potentially increasing the energy conversion efficiency, availability, survivability and reliability, whilst at the
same time significantly affecting operation costs (OPEX) associated with operation and maintenance (O&M)
activities for wave energy converters (WECs), tidal energy converters (TECs) and offshore wind turbines
(OWTs).
NeSSIE seeks to research the optimum method for translating original equipment manufacturer (OEM)
expertise and their value chains across to marine energy device construction and operations to:
• Deliver three sustainable, investable short-term demonstration projects in the North Sea region;
• Create and establish new cross-sectoral supply chains in the medium to long term;
• Build a long-term North Sea strategic specialisation partnership with wider EU regions.
This report, Deliverable 3.1 (D3.1) in the NeSSIE project, undertakes a strategic analysis of the non-technology
deployment/commercial challenges and barriers to developing ORE demonstration projects and supply
chains. This report and the work on the state of the art of anti-corrosion solutions from WP2 are used in the
development of the Roadmap (D3.4); as portrayed in Figure 1.
Figure 1 – Integration of WP2 and WP3 deliverables to produce final Roadmap and NeSSIE mission goals
10Non-technical Challenges in developing Offshore Renewable Energy Projects Project NeSSIE
The chapters of this report are broken down into key areas focusing on a North Sea basin pilot in the short-
term demonstration window and a medium/longer term future perspective:
• Market: Current development and prospects of the ORE sector.
• Finance: Early stage financing for ORE demonstration projects with the aim to translate this to ACS
innovation/new materials demonstration projects. Long-term finance strategy for post
demonstration projects and supply chains.
• Infrastructure: Hard (facilities, availability, etc.) and soft (skills, health and safety, etc.) factors
affecting small to medium enterprise’s (SME) ability to test and deliver projects.
• Regulation: Identification and suitability of environmental and consenting legislation to ACS testing
and delivery.
11Non-technical Challenges in developing Offshore Renewable Energy Projects Project NeSSIE
4 Market development
When analysing non-technological market challenges for ACSs, it is relevant to investigate the expected ORE
evolution and the driving market segments. In the case of ACSs for offshore renewable energy, this challenge
is especially complex as this potential evolution depends on the success of several different markets in, again,
different levels of technological maturity. These are wave energy, tidal stream and offshore wind, the latter
also depending on if installation takes place in shallow or deep waters (by means of floating platforms). The
first sections of this chapter gather insights on how these different offshore renewable energy sources are
expected to evolve and their key challenges. This is followed by the role of ACSs to tackle offshore renewable
challenges. This will help to identify the best targets for the three demonstration projects, which constitute
the final objective of NeSSIE.
As mentioned, the three considered ORE alternatives are at different stages of technology readiness:
• In wave energy, although a range of full-scale prototypes has been deployed, more design
divergence and further technology development is required prior to commercialisation and roll-out.
• Several tidal stream power developers are testing full-scale prototypes in offshore environments,
mainly converging to a dominant technology concept (i.e. horizontal axis). It is worth highlighting the
MeyGen project, the world’s largest tidal-stream endeavour under construction, located between
the Scottish mainland and Orkney Islands, with a first phase consisting of four 1.5MW turbines
(adding up to 6MW) and a final aim of 398MW [1].
• Offshore wind is by far the most developed market of the ORE technologies, with more than 12GW
installed in Europe. However, the floating option for deep waters has not reached commercialisation.
There are several demonstrators, which are being tested but with no dominant concept yet.
Figure 2 is a summarized timeline for the expected development of OREs considered for the demonstration
projects of NeSSIE (based on the ORECCA project [2] and the Ocean Energy Strategic Roadmap [3]). It is
organized in five different stages, as suggested by Ocean Energy Europe: R&D, Prototype, Demonstration,
Pre-Commercial and Industrial Roll-Out.
12Non-technical Challenges in developing Offshore Renewable Energy Projects Project NeSSIE
Figure 2 – Expected development of marine energies, based on [3]
In the following sections, an overview of the current deployment and expected evolution for each offshore
generation technology is discussed, with a special focus on its market potential in the North Sea basin.
4.1 Market Wave and Tidal energy
4.1.1 Market status and prospects
According to the Annual Report of the IEA OES, ‘An overview of activities in 2017’ [4] the global wave energy
deployment has increased to approximately 8 MW in 2017, however not all of this capacity is still installed
as these deployments have been demonstration projects, and thus often in the water for a limited time span.
Examples of wave energy demonstration projects in operation in 2017 in the North Sea basin are displayed
in Table 1.
Project Country, Location Device Developer Device Capcacity
Isle of Muck UK, Isle of Muck Albatern WaveNET/SQUID 22 kW
WaveEL Norway, Runde Waves4Power WaveEL 1x 200kW
CEFOW UK, Orkney Billia Croo Wello Oy Penguin 1x 500kW
Table 1 – Examples of wave energy projects in operation in 2017 in the North Sea basin, based on [4]
The number of projects located in North Sea basin countries is coherent with the distribution of wave
resource throughout Europe, as can be seen in Figure 3.
13Non-technical Challenges in developing Offshore Renewable Energy Projects Project NeSSIE
Figure 3 – Map of wave energy resource In Europe [5]
It is worth noting that for wave energy technology convergence has not yet taken place. Technological
drawbacks have reduced the confidence of investors in wave energy technology. Current initiatives (such as
the ones shown in the Table 1) are aimed at ensuring a more thorough assessment of wave energy technology
throughout the various testing and development phases.
In contrast with wave energy, tidal current technologies have made significant progress towards
industrialization in the past years with pre-commercial installed devices converging towards one technology
class, i.e. horizontal axis turbines. At the same time, some other alternatives are being tested (e.g. tidal kites).
For this technology, the path to commercialization is focusing on two main areas: large devices over 1MW,
and smaller turbines for niche markets. Examples of the tidal energy projects in the North Sea basin in
operation in 2017 can be found in Table 2.
Project Country, Location Device Developer Device Capacity
Shetland Tidal Array UK, Shetland Bluemull Sound Nova Innovation Ltd. M100 3x 100kW
MeyGen UK, Scotland Pentland Firth Atlantis Resources Ltd. AR1500 4x 1.5MW
Eastern Scheldt Netherlands, Eastern Scheldt Tocardo Internatiol B.V. T2 5x 250kW
FloTEC UK, Orkney Scotrenewables Tidal Power Ltd SR2000 1x 2MW
Table 2 – Examples of tidal current projects in operation in 2017 in the North Sea basin based on [4]
Global tidal current energy deployment surpassed 17MW in 2017. Similarly to the installed wave energy
projects, due to the demonstration nature of these projects and the associated time limit not all of the 17 is
currently installed [4].
According to the JRC Ocean Energy Status Report 2016 Edition, the majority of worldwide tidal projects occur
in Europe, specifically in the North Sea basin [6]. This predominance of tidal projects in the North Sea basin,
specifically in the UK, is related to the available resources, as shown in Figure 4. The projects in the
Netherlands are located at the storm surge barriers, creating an increased tidal flow.
14Non-technical Challenges in developing Offshore Renewable Energy Projects Project NeSSIE
Figure 4 – Map of tidal current resource In Europe [7]
Ocean Energy Europe, the industry association, estimates a combined 100 GW of wave and tidal energy
capacity can be deployed in Europe by 2050 [8]. The global market for ocean energy could see 337 GW of
installed capacity by 2050 [9]. It should be noted that this capacity roll-out will largely depend on the funds
assigned to R&D and on the ability to converge to a successful technology with competitive LCOE.
4.1.2 LCOE status and prospects
The emerging state of wave and tidal energy, as it is still in the prototype or pre-commercial stage, adds a
complexity in identifying LCOE levels. Latest estimations indicate that tidal energy has costs around
€350/MWh, with higher costs for wave energy at about €450/MWh [10].
For Europe, the ORE market presents a potential progress towards a resource-efficient economy, with high
projections in terms of economic growth and job creation. However, the forecasted large scale and
commercial deployment are still far away. The increase in ORE installed capacity will only be possible if a
dramatic reduction of the LCOE of these renewable sources is achieved. In an analysis in 2014 led by the
Vanguard Initiative ADMA Pilot [11], market experts, wind farm developers and technology OEM companies
suggested that a competitive LCOE should be around 130-150 €/MWh for wave and tidal generation by 2020.
The SI Ocean report ‘Wave and Tidal Energy Market Deployment Strategy for Europe’ indicates the expected
cost reduction through the cumulative deployed capacity (Figure 5). This shows the necessity of
demonstration projects to drive down the cost, in the coming years.
15Non-technical Challenges in developing Offshore Renewable Energy Projects Project NeSSIE
Figure 5 – Expected Wave & Tidal LCOE evolution as of cumulative deployment [10]
4.2 Market Offshore Wind energy
4.2.1 Market status and prospects
As the Global Offshore Wind 2016 and Beyond report from the GWEC states [12], offshore wind is a more
developed market that has shown steady annual growth in the past year, building up to a global installed
cumulative capacity of 14.4 GW in 2016 (Figure 6). A total of 2.2 GW offshore wind was installed in 2016.
Although numbers were down 31% from the 2015 record, the future looks promising as the industry
continues maturing, investor confidence grows, and the new generation of machines are expected to
increase in capacity and to become more cost-efficient.
Figure 6 – Global Cumulative Offshore Wind Capacity in 2016 [12]
16Non-technical Challenges in developing Offshore Renewable Energy Projects Project NeSSIE
Over 85% of global offshore wind power is located in Europe, where the North Sea basin countries currently
dominate the market. The UK is the world’s largest market and accounts for just under 36% of installed
capacity, followed by Germany with 29%. Denmark now accounts for 9%, the Netherlands for 8% and Belgium
for 5% of the world’s offshore wind market [12].
The quality of the wind resource and the shallow depths of the North Sea basin countries will keep their focus
on offshore wind development in Europe in the next five years. In fact, the high number of projects that
started construction confirms a noticeable activity in the next years, with an annual average of 3.4 GW added
in 2017 and 2018 [13] (Figure 7).
Figure 7 – European offshore wind project pipeline five-year outlook [13]
There will be significant capacity addition in all North Sea basin countries (UK, Germany, Belgium, France,
Denmark and the Netherlands). By 2020, the European cumulative offshore wind capacity will be about 25
GW [13].
The short-term growth of the offshore wind market will be led by fixed-bottom structures that need lower
levels of investment. However, given that there are limited locations with shallow waters suitable for fixed-
bottom foundations and that there is extensive wind resource in deep waters, floating wind is potentially a
highly scalable future energy source in a number of markets.
There is significant potential and interest in floating structures in Japan, the United States, and a number of
European countries including the UK, Norway, France, Portugal and Spain. This is shown in Table 3 from the
Carbon Trust report [14].
Table 3 – Offshore wind resource and potential floating wind capacity in Europe, USA, and Japan [14]
17Non-technical Challenges in developing Offshore Renewable Energy Projects Project NeSSIE
4.2.2 LCOE status and prospects
There has been a significant LCOE reduction for offshore wind, with the reduction expected to continue in
the coming years. Figure 7 shows the current and projected LCOE range trajectory from 2015 to 2030
included in Wind Europe’s 2017 offshore wind resource assessment. The LCOE values of 2018 fall in the range
of €100-€140/MWh. Wind farms to be commissioned after 2020 have prices ranging 65-95€/MWh [15]. This
is below the competitive value of €100/MWh as indicated by the previously mentioned Vanguard Initiative
ADMA Pilot report [9]. For example, in early 2017 the UK government awarded a contract to Dong Energy at
a price of 65€/MWh for its 1.4 GW Hornsea II Project off England's north-east coast, which will become the
world's largest offshore wind farm [16]. In addition, Vattenfall won a bid mid-2017 for two wind farms
(Vesterhav Nord and Vesterhav Syd) with a combined capacity of 350MW just off the west coast of Jutland
(Denmark) with a LCOE of €61/MWh [17]. These low LCOE values can be realized due to the advantageous
locations. The sites have a good resource, are close to shore - removing the need for an offshore substation
thus saving money in the transmission system, are close to potential construction ports and operation and
maintenance ports and are suitable for monopole foundations.
Figure 8 – Offshore wind LCOE range and trajectory from 2015 to 2030, including estimated LCOE [15]
4.3 Capacity targets of North Sea basin countries
The renewable energy targets of the North Sea basin countries are briefly described in Table 4, with a specific
focus on the wave, tidal and offshore wind activities where applicable.
Country Targets
The country’s binding target for 2030 is 13% of renewable energy generation. The offshore wind energy
concessions in the Belgian North Sea will have the biggest impact on renewables, leading up to a total
of 2.2 GW of offshore wind power installed by 2020 [18]. Offshore wind already constitutes a mature
market in Belgium with a large offshore development. Belgian wind projects in the North Sea may not
Belgium
require any state subsidy in the near future [19].
Regarding wave and tidal energy deployment, the focus is on R&D and demonstration projects, such as
FlanSea and Laminaria devices, rather than deploying commercial ocean energy systems due to the mild
sea climate [18].
Denmark is known as the wind energy pioneer, with a clear target of 50% of electricity generation to be
met by wind energy before 2020 [20]. A stable tender framework offers selected bidders 15 years of
stable cash flows. The 2012 Energy Agreement set out Denmark’s significant offshore wind expansion in
Denmark
the form of tenders, in which the lowest bidder wins and cover the first 50,000 full-load hours [21].
The National strategy on wave energy of 2012 resulted in both the ‘Danish Partnership for Wave Energy’,
to encourage innovation and collaboration, and the Roadmaps for Wave Energy Development in 2015.
18Non-technical Challenges in developing Offshore Renewable Energy Projects Project NeSSIE
In addition, Denmark has a test centre, DanWEC. This centre includes the grid connected test site of
Nissum Bredning and the Hanstholm site [18].
The total of offshore wind energy capacity has reached 5.3 GW in 2017 [22]. The offshore wind power
industry is moving away from subsidy-based deployment through the implementation of auctions.
Tidal and wave energy is covered under the EEG (Renewable Energy Sources Act) with fixed feed-in
Germany
tariffs of €12.4 cents/kWh for projects below 500 kW [4]. In addition, tidal and wave R&D, such as the
TIdalPower project, is funded under the energy research programme of the Federal Ministry for
Economic Affairs and Energy [4].
The European and national renewable energy targets have resulted in new legislation coming into force
that should ensure 4.45 GW of offshore wind capacity by 2023 [23].
The Ministry of Economic Affairs and the Ministry of Infrastructure have acknowledged the energy and
Netherlands
export potential of marine renewables (wave and tidal). This resulted in industry, governmental and
research organizations to join forces in a trade association called the EWA (Dutch Energy from Water
Association) [18]. There are no capacity targets set specifically for tidal or wave energy.
The Norwegian 2020 renewable energy target is 67.5% of gross final energy consumption generated
from renewable sources [24]. This relatively high share of renewables is possible due to the large
hydropower resource. Norway recognizes the large offshore wind energy resources. There is a specific
Norway
interest in floating structures due to the potential of deployment at larger water depths [25].
There are no specific policies applied for wave and tidal energy, it is included in the general renewable
energy policies and programmes.
Sweden plans to have 100% clean energy generation (including nuclear energy) by 2040 [26]. In 2017,
an installed capacity of about 200 MW of offshore wind was grid-connected [27].
Sweden Regarding tidal and wave energy, Swedish technology is at the forefront of innovation with at least seven
relevant developers (Ocean Harvesting, Waves4Power, Minesto, Corpower, Wavetube, Seabased and
Gaiatellus).
The UK targets to source 15% of all energy and 10% of transport fuels from renewables by 2020.
Currently, the UK has the largest amount of installed offshore wind capacity in Europe. In 2017, the total
UK installed offshore wind capacity in waters off the UK reached 7.5 GW [28].
R&D on marine energy is supported by the UK governments (and the EU), for example through Wave
Energy Scotland [29] and Marine Energy Wales [30].
Table 4 – Renewable energy capacity targets of North Sea basin countries, including wave, tidal and offshore wind energy activities.
4.4 ORE Market Challenges
OREs have various market challenges that will need to be tackled to reach their market potential. This
requires the involvement of companies directly involved in the sector, such as the technology developers,
but also companies with products and services that could be adapted to help solve some of these challenges.
The diversification of the oil and gas, and maritime sectors into offshore renewable energies would provide
a lot of prior experience and knowledge transfer of ACS.
A study by the UK Energy Research Centre (UKERC) identified the main high-level challenges for wave and
tidal energy deployment as follows [31]:
• Affordability: refers to achieving a lifetime cost that is competitive with other energy sources.
• Reliability: refers to the operational health of the device over its lifetime.
• Survivability: refers to the ability of a device to survive extreme events. Components are critical to
this challenge, either in resisting such events or in mitigating the impacts of failures.
• Installability: relates to the ability to install the energy converter. Vessels, crew and equipment
increase the deployed costs of components.
• Predictability: is the ability to understand the interaction between the environment and the devices.
Components can help capture information to help predict future events.
• Operability: is the ability to control, operate and maintain devices.
19Non-technical Challenges in developing Offshore Renewable Energy Projects Project NeSSIE
• Manufacturability: refers to the development of structure that can easily be manufactured.
A study by one of the NeSSIE partners added the following aspects to the above mentioned challenges:
• Environmental Impact: refers to the effect that the deployment of the structures has on the
environment.
• Health and Safety: refers to the safety of device operators and the general public alike.
As part of the European Technology and Innovation Platform for Ocean Energy (ETIP Ocean), a prioritisation
was made of challenges for ocean energy to move to commercialisation are identified [32]. A prioritisation
was made of these challenges to indicate the challenges with highest importance to be addressed by the
sector, divided in the categories technology, financial, and environmental and socio-economics.
4.4.1 The combination of technical and non-technical challenges
In the ‘Study on Lessons for Ocean Energy Development’ by the European Union [33], it is pointed out that
the encountered difficulty in the development of the ORE market, specifically wave and tidal energy, is based
on several challenges technical and non-technical challenges (see the previously mentioned challenges).
Specifically the combination of these challenges complicate the path towards commercialisation, as the
challenges are interlinked. Several factors, from technical performance to funding availability, influence the
successful implementation.
20Non-technical Challenges in developing Offshore Renewable Energy Projects Project NeSSIE
5 Finance mechanisms
The maturity of the technology varies for each type of offshore renewable energy and therefore also their
funding challenges and financial barriers. There is a wide range of existing public and private funding
mechanisms, which should be specific for each alternative technology.
This chapter will discuss the current and expected status of investment in ORE. This is followed by an
indication of potential early stage project funding as well as medium and long-term funding possibilities,
followed by the ORE funding challenges.
5.1 Early stage demonstration project funding
The maturity of a technology is a key factor concerning the offer of available financing mechanisms. Funding
is particularly challenging for technologies transitioning from R&D towards the prototype and demonstration
stages, as there often is a long timeframe to deployment and intensive CAPEX investment required. The
probability of failure along the innovation chain in combination with the cost of investment is a key risk for
developing technologies. The probability of a technology failing to reach the market decreases along the
innovation chain while technology investment reaches a peak between late stage R&D and early stage
deployment.
In the case of marine energy, currently there is a focus on deployment of demonstration projects. In most
cases, the marine energy technology developers do not have the scale of capital needed to finance those
projects, which make alternative sources of finance crucial.
The risk attached to projects involving emerging technologies limits the number of potential investors, where
mainly risk-tolerant investors are interested, as there is uncertainty about the development and the success
that the technology will have in the future. There are a range of possible stakeholders that fit into this profile
and are able to fund technology development along the innovation chain, including various finance focussed
organisations (private equity, venture capital etc.), governmental support and corporations active in
renewable energy technologies (technology developers and users). Figure 9 shows the most common
investor profiles for each renewable technology in 2016. As can be seen, the majority of investments in
marine energy was in the form of R&D support from governments. This is an indicator of the early stage of
this sector and the difficulties with ensuring financial backing. Other sources that are or will become of
relevance to finance demonstration projects for MRE could be those indicated in the figure, namely, public
markets, venture capital or private capital and companies investing in R&D. Since the wind sector is a much
more mature sector, including a higher level of investor confidence, the majority of the project financing
comes from asset finance (Figure 9).
100%
Asset finance
80%
Small Distributed
Capacity
60% Public Markets Position
Venture Capital and along
40% Private Equity
Corporate R&D
innovation
20% chain
Government R&D
0%
Solar Wind Biofuels Geothermal Biomass & Small hydro Marine All
w.t.e renewables
Figure 9 – Average investment distribution breakdown for each renewable technology in 2016 [34]
21Non-technical Challenges in developing Offshore Renewable Energy Projects Project NeSSIE
Attention should be paid to the early stages of technology development, from R&D towards demonstration
of full-scale devices, since it is the phase in the project lifecycle when proposals are most likely to be
cancelled.
To understand the origin and characteristics of the different investment sources in marine technologies,
public and private early stage funding methods for ORE will be analysed separately in the following sections.
5.1.1 Public early stage demonstration project funding
As previously mentioned, public funding is the most important source of investment for wave and tidal
technologies. Public policy support instruments for ocean energy technologies include both push and pull
mechanisms such as:
• Public research grants – push: the main financial source for emerging technologies in the path
towards becoming commercially competitive, in the form of government support programmes.
• Risk insurance funds - pull: the insurance industry is offering innovative products for the renewable
energy sector with the aim of reducing the volatility associated with these technologies. The available
products are mainly directed to cover the financial impact of the intermittency of renewable sources
caused by the variability of resources.
• Feed-in-tariffs (FIT) - pull: a policy mechanism designed to accelerate investment in renewable
energy technologies by means of offering long-term contracts to renewable energy producers,
typically based on the cost of generation of each technology.
• Feed-in-premiums (FIP) - pull: under this policy scheme, electricity from renewable energy sources
is sold on the spot market for electricity and the producers receive an additional amount on top of
the market price.
• Tradable certificates - pull: these certificates are a market-based subsidy; they are a financial asset
issued to certified green electricity producers to ensure a certain amount of electricity come from
renewable sources.
• Tendering - pull: auctions and tendering schemes for RES are competitive mechanisms to financially
support RES projects. In auctions, the cost of electricity production is the only criterion to be
evaluated, while tenders may include additional criteria.
• Soft loans - pull: a loan with a below-market rate of interest, in some cases with long repayment
periods. The providers are usually governments.
Depending on the support scheme applied to a project, the implied risks to the investors are different. In
general, the sector is demanding new financing instruments focused on flexibility, in order to reduce the
short-term risk inherent to the early stage of the ORE market.
5.1.2 Private early stage demonstration project funding
As previously stated, high CAPEX, low revenue projections and high investment risk due to uncertainties make
it challenging to find private investors willing to support wave and tidal energy demonstrators. Moreover, a
lack of operational experience drives up insurance premiums limits the coverage available and makes it
difficult for potential backers to assess technology risk.
Figure 10 shows the relationship between investor types classified by risk appetites and the technology
readiness in wave and tidal energy, as investigated by ORE Catapult [35]. Usually neither commercial banks
nor state-backed banks or utilities are interested in the high-risk demonstration projects with low financial
22Non-technical Challenges in developing Offshore Renewable Energy Projects Project NeSSIE
returns. According to ORE Catapult, any stakeholder seeking to finance a MRE demonstration project should
either ask for public support or engage a venture capital or an OEM, since those investor profiles are willing
to accept a high risk and often have a profound knowledge of devices [35].
Figure 10 – Investor type by risk appetite and technology readiness of wave and tidal energy [35]
• Venture Capital (VC): private equity investors that act in small or early-stage
projects/technologies/firms that are deemed to have a high growth potential. At present, they are
unlikely to be the initial investors in ORE projects due to the lack of confidence in the ORE market
associated with the profitability delay of the investment. There is a need for other financial backers,
with a preference for the public sector.
• Utilities: end-users of marine energy converters, who could potentially take an investor role when
risks are mitigated.
• OEMs and supply chain: companies involved in the marine energy supply chain have a good
understanding of the technological risks. Due to their direct involvement in the development of the
projects, they encounter high losses if a project is unsuccessful.
• State-backed banks: banks that are able to fund projects with higher risks compared to commercial
banks due to the support they receive from governments. A well-known example is the Green
Investment Bank (GIB).
• Institutional investors: investors likely to be involved when projects start to become bankable,
therefore at a point the risks have been significantly reduced, such as pension funds.
• Commercial banks: investors with a very low risk profile and therefore unlikely to participate in early
stage funding.
5.2 Finance over medium to long term
Medium to long-term financing means investment requirements for the commercial project lifetime, namely
up to 15 to 25 years. Where offshore wind energy deployment is at the stage of requiring medium to long-
term financing, wave and tidal energy is focused on acquiring early stage financing. Therefore, the financing
options discussed below are based on offshore wind examples.
Investors will often be a combination of the previously mentioned public and private early stage investors;
however, the reduction in investment risk increases the number of interested parties at this stage of
financing. Figure 11 provides an overview of the investment sources in wind energy up to 2013, showing the
great variety of entities/investors participating in offshore wind energy.
23Non-technical Challenges in developing Offshore Renewable Energy Projects Project NeSSIE
Figure 11 – Cumulative wind energy investment in Europe up to 2013 [36]
The ‘Finance and Investment trends’ report by WindEurope provides a list of major equity investors in
offshore wind energy in 2016 [37], summarised in Figure 12. Power producers provided almost 70% of the
equity investment in offshore wind energy.
Institutional investors Corporates
360 MW 171 MW
13% 6% Power producers
Diversified financial services Diversified financial
408.34 MW Power producers services
14% 1,912 MW
67% Institutional
investros
Corporates
Figure 12 – Major equity investors in offshore wind in 2016 [37]
The same report reveals relevant finance structures applied in offshore wind in 2016 [37]:
• Bond financing: capital is raised for the project by selling project bonds or green bonds. This is a
fixed-income security for the investor. The increase in the number of offshore wind project bond
transactions in recent years demonstrates the progress achieved in understanding the sector’s risks.
• Initial Public Offerings (IPOs): shares are sold on the capital market, making the project or company
a public entity. In 2016, Europe reached the highest level of issuance in the last seven years, raising
a total of €5.2bn IPOs.
• Equity financing: raising capital through selling stock, giving the investors ownership in return in the
form of stocks. This is one of the most critical phases in the collection of funds for a project, most of
the transactions were carried out in the pre-construction phase.
• Power Purchase Agreements (PPAs): a contract between two parties where one party sells both
electricity and renewable energy certificates (RECs) to another party. PPAs are widely used in Europe,
facilitating investments for utility scale projects.
Depending on commercial, financial and tax reasons, a range of funding structures can be applied to make
24Non-technical Challenges in developing Offshore Renewable Energy Projects Project NeSSIE
the projects more attractive to potential investors. The table below shows an overview of these structures
based on an analysis carried out by WindEurope [36]. Given the current large offshore wind projects, multi-
source financing solutions will play a more important role, with the additional benefit of partners sharing
their knowledge within the project.
Name Structure Characteristics
• One entity has full ownership of the project.
• Benefits:
o Simplicity;
Sponsor equity
o Full control of the project.
• This model becomes less sustainable with the increasing capacity of
the projects.
• The ownership of the project is divided between multiple partners,
Incorporated together forming a joint venture or special purpose vehicle.
joint venture • There are two ways of considering the incorporated joint venture: (1)
(JV) or Special held on the balance sheet as an investment or, (2) consolidated as a
Purpose Vehicle subsidiary of the shareholder’s group.
(SPV) • In case of tax losses, there cannot be a transfer to the shareholder’s
group (significant in early years).
• A funding structure with a loan, therefore relying on the future cash
flows generated, with the project's assets, rights, and interests held as
secondary security or collateral.
• Lenders may also have limited recourse to the assets of the sponsor.
SPV with debt
• Benefits:
finance
o Clarity on income flows;
o Ability to obtain solid security structure;
o Clarity on ownership of asset and obligations;
o Clarity of contractual structure and counterparty.
• This structure allows the project to be considered as an investment by
Unincorporated the sponsor.
Joint Venture • Each investor can consolidate all the profits and losses of the SPV into
one group account.
Unincorporated • Same basis as the traditional unincorporated joint venture apply.
Joint Venture • The debt is mostly used to allocate different risks or to apportion PPA
with debt liability or responsibilities.
Table 5 – Offshore wind funding structures based on WindEurope report [36]
5.3 Finance Wave and Tidal energy
5.3.1 Finance status and prospects
Wave and tidal energy are Capital Expenditure (CAPEX) intensive as the cost of the device; infrastructure and
installation represent a very high share of the kilowatt-hour (kWh) cost, estimated at 60–80% of the final cost
of energy. In order to ensure the development of wave and tidal technologies, it is necessary to focus the
funding to the progress of those technologies along the innovation chain and therefore enable cost
reductions. This means that developers need access to high levels of funding upfront, before any revenue is
generated, whether this be debt, grant or equity-based.
25You can also read