Marine habitats of the Lamu-Kiunga coast: an assessment of biodiversity value, threats and opportunities - Kennedy Osuka, Melita Samoilys, James ...
←
→
Page content transcription
If your browser does not render page correctly, please read the page content below
Marine habitats of the Lamu-Kiunga coast: an assessment of
                 biodiversity value, threats and opportunities

                 Kennedy Osuka, Melita Samoilys, James Mbugua,
                                     Jan de Leeuw, David Obura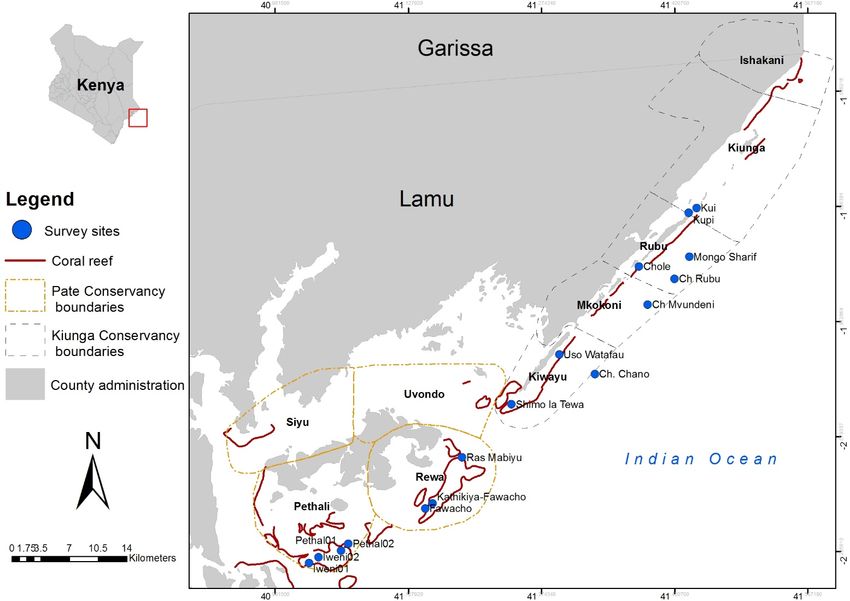
Marine habitats of the Lamu-Kiunga coast: an assessment
          of biodiversity value, threats and opportunities

Kennedy Osuka, Melita Samoilys, James Mbugua, Jan de Leeuw, David Obura
LIMITED CIRCULATION

Correct citation: Osuka K, Melita Samoilys M, Mbugua J, de Leeuw J, Obura D. 2016. Marine habitats of the
Lamu-Kiunga coast: an assessment of biodiversity value, threats and opportunities. ICRAF Working paper
number no. 248 World Agroforestry Centre. DOI: http://dx.doi.org/10.5716/WP16167.PDF

Titles in the Working Paper series aim to disseminate interim results on agroforestry research and practices,
and stimulate feedback from the scientific community. Other publication series from the World Agroforestry
Centre include: Technical Manuals, Occasional Papers and the Trees for Change Series.

Published by the World Agroforestry Centre
United Nations Avenue
PO Box 30677, GPO 00100
Nairobi, Kenya
Tel: +254 20 7224000, via USA +1 650 833 6645
Email: worldagroforestry@cgiar.org
Website: www.worlagroforestry.org

© World Agroforestry Centre 2016

Working Paper No. 248

Photos/illustrations: all photos are appropriately accredited.

The views expressed in this publication are those of the author(s) and not necessarily those of the World
Agroforestry Centre.

Articles appearing in this publication may be quoted or reproduced without charge, provided the source is
acknowledged.

All images remain the sole property of their source and may not be used for any purpose without written
permission from the source.

                                                                                                            i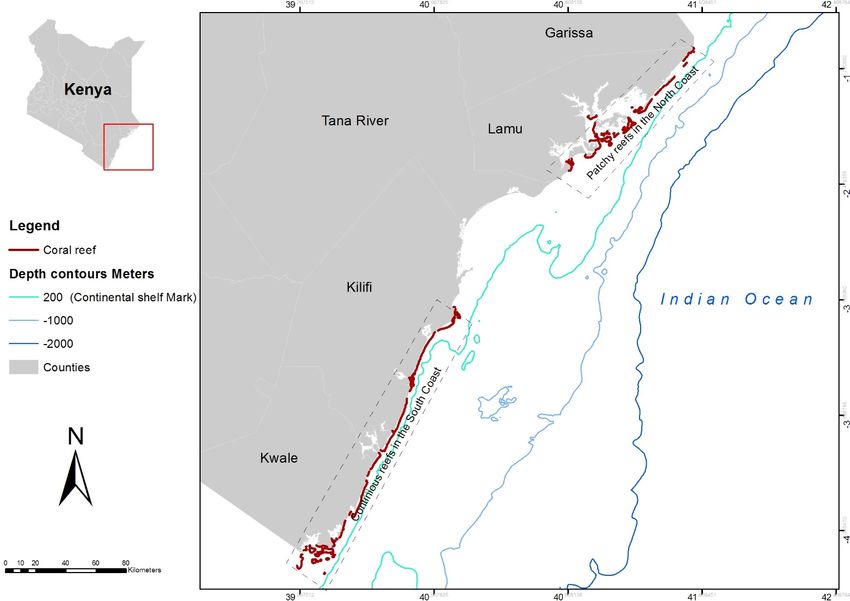
About the authors

Kennedy Osuka is research scientist at CORDIO East Africa. Email: kosuka@cordioea.net

Melita Samoilys is a director, CORDIO East Africa. Email: melita.samoilys@gmail.com

James Mbugua is a research assistant at CORDIO East Africa. Email: jmbugua@cordioea.net

Jan de Leeuw worked as a senior scientist with ICRAF's Eastern and Southern African team. He is
currently an ecologist at Baku State University. Email: jan45leeuw@gmail.com

David Obura is the coordinator for CORDIO East Africa. Email: dobura@cordioea.net

                                                                                                  ii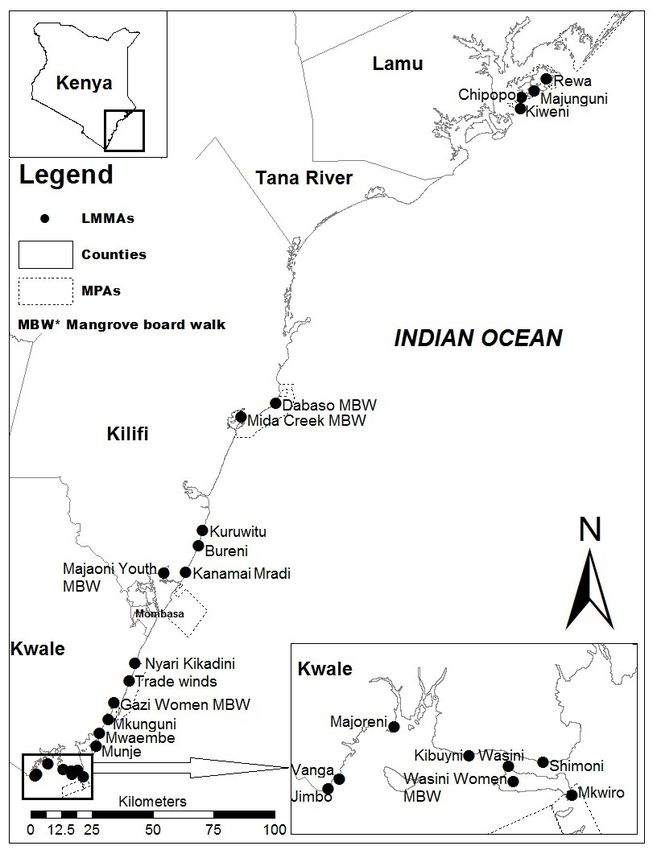
Acknowledgements

The publication is an outcome of an activity of marine biodiversity assessment, which was
commissioned by ICRAF and implemented by CORDIO East Africa. Special gratitude goes to EU through
IGAD for funding the activity. CORDIO team also thank all those who contributed to the study by
providing the information required for the preparation of this Publication. The authors would also thank
Dr. Maarifa Wakumanya, Pwani University, Grace Koech and Josephat Nyongesa for reviewing the
manuscript. Finally, the authors would like to thank the ICRAF communication team for proof reading
and publishing the working paper.

                                                                                                      iii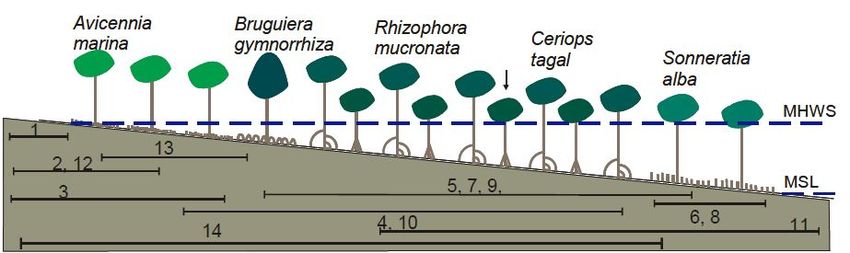
Table of Contents

About the authors .................................................................................................................................... ii
Acknowledgements ................................................................................................................................. iii
List of figures ........................................................................................................................................... vi
List of tables ........................................................................................................................................... vii
List of abbreviations .............................................................................................................................. viii
Abstract ................................................................................................................................................... ix
Introduction ............................................................................................................................................. 1
The Lamu-Kiunga seascape ...................................................................................................................... 2
   Physiography of the seascape .............................................................................................................. 2
   Geology and oceanography ................................................................................................................. 3
   Outstanding features of Lamu-Kiunga seascape.................................................................................. 3
Biodiversity of shallow marine habitats ................................................................................................... 5
   Introduction ......................................................................................................................................... 5
    Coral reefs ............................................................................................................................................ 5
      Coral diversity .................................................................................................................................. 5
      Coral reef benthos ........................................................................................................................... 6
      Coral mortality and bleaching ......................................................................................................... 8
      Resilience status of reefs ................................................................................................................. 9
      Coral reef fish diversity .................................................................................................................... 9
      Trends in fish abundance ............................................................................................................... 12
   Seagrass ............................................................................................................................................. 16
   Mangroves ......................................................................................................................................... 16
      Mangrove cover ............................................................................................................................. 16
      Mangrove diversity ........................................................................................................................ 17
      Mangrove zonation ....................................................................................................................... 19
Biodiversity of pelagic habitats .............................................................................................................. 21
   Introduction ....................................................................................................................................... 21
   Marine mammals and turtles............................................................................................................. 21
   Sharks and rays .................................................................................................................................. 22
Biodiversity uses and threats ................................................................................................................. 24
   Introduction ....................................................................................................................................... 24
   Use of fish and threats to fisheries .................................................................................................... 25
      Resource utilization and extraction ............................................................................................... 25
      Trends in fish catches .................................................................................................................... 27
      Fisheries issues .............................................................................................................................. 28
      Lamu Port and Lamu-Southern Sudan-Ethiopia Transport Corridor project ................................. 28
    Threats to seagrass beds .................................................................................................................... 28
    Threats to mangroves ........................................................................................................................ 29
      Community utilization ................................................................................................................... 29

                                                                                                                                                            iv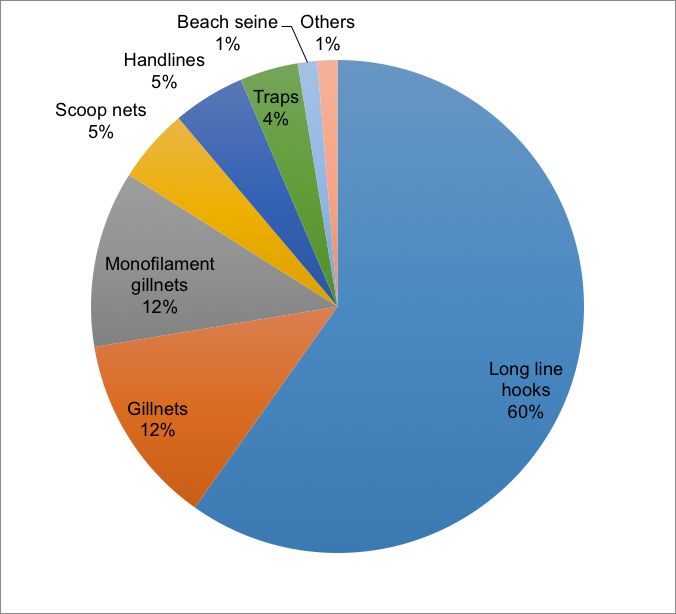
LAPSSET project ............................................................................................................................. 30
  Use of fishes and threats to the pelagic marine system .................................................................... 30
Opportunities for improved management ............................................................................................. 31
  Introduction ....................................................................................................................................... 31
    Government institutions .................................................................................................................... 34
      State Department of Fisheries ....................................................................................................... 34
      Beach Management Units ............................................................................................................. 34
      Kenya Wildlife Service ................................................................................................................... 34
      Kenya Marine Fisheries Research Institute ................................................................................... 35
    Policy and institutions for management of mangroves ..................................................................... 35
    Non-government institutions ............................................................................................................ 36
     Fisheries Cooperatives ................................................................................................................... 36
     World Wide Fund........................................................................................................................... 36
     CORDIO East Africa ........................................................................................................................ 36
  Protected Area approaches ............................................................................................................... 37
     Locally Managed Marine Areas ..................................................................................................... 37
Recommendations ................................................................................................................................. 39
References.............................................................................................................................................. 41
Appendices ............................................................................................................................................. 49
    Appendix 1. Coral genera and species list recorded in Pate-Kiunga 2015 ......................................... 49
    Appendix 2. Data treatment and analysis .......................................................................................... 53
    Appendix 3. Fish species list recorded in Pate-Kiunga in 2015 .......................................................... 54

                                                                                                                                                         v
List of figures
Figure 1: Map of coastline showing Kiunga Marine National Reserve and the conservancies ................ 2
Figure 2: Spatial extent of coral reefs of the Kenyan coast and the 200m-depth contour ...................... 3
Figure 3: Change in the cover of benthic variables in the Lamu-Kiunga area .......................................... 7
Figure 4: Map of in-situ coral reef survey sites conducted by CORDIO.................................................... 8
Figure 5: Fish abundance of 11 selected families in Kiunga-Pate seascape ........................................... 14
Figure 6: Mean density and biomass of fish families surveyed at six sites in Pate Island-Kiunga .......... 15
Figure 7: Spatial distribution of mangroves along the Kenyan coast ..................................................... 17
Figure 8: Zonation of mangroves along the land-sea interface .............................................................. 20
Figure 9: Trends in the number of fishermen in Lamu County .............................................................. 26
Figure 10: Distribution of fishing gears in Lamu County ........................................................................ 26
Figure 11: Number of illegal gears in use in Lamu County. .................................................................... 27
Figure 12: Location of 24 LMMAs in Kenya ............................................................................................ 38
viList of tables
Table 1: Densities of coral adults and recruits sampled in Kiunga Marine National Reserve .................. 8
Table 2: Total number of reef fish species per family per site.. ............................................................. 11
Table 3: Coral reef fish diversity index values for Lamu-Kiunga and from other WIO countries ........... 12
Table 4: National level mangrove area estimates in Kenya from 1931 to 2010..................................... 18
Table 5: Mangrove species of Lamu-Kiunga region ................................................................................ 19
Table 6: Species distribution and cover within the Kiunga Marine National Reserve ............................ 19
Table 7: IUCN categories of marine mammals sighted in Pate Island-Kiunga area ................................ 21
Table 8: IUCN categories of sharks and rays fished and sighted in Pate Island-Kiunga area. ................ 22
Table 9: Mean catch per unit effort from 2001-2007 of gears used in Lamu County ............................ 27
Table 10: DPSIR analysis of environmental problems affecting biodiversity in the shallow and pelagic
marine habitats.............................................................................................................................. 32
Table 11: List of BMUs in Lamu-Kiunga area .......................................................................................... 34
Table 12: Nationally gazetted Marine Protected Areas in Kenya ........................................................... 37
viiList of abbreviations
BMP Biodiversity Management Programme
BMU Beach Management Unit
CBD Convention on Biological Biodiversity
CFDI Coral Fish Diversity Index
CORDIO Coastal Oceans Research and Development Indian Ocean
CPUE Catch Per Unit Effort
DPSIR Driving Force-Pressure-State-Impact-Response framework
EACC East Africa Coastal Current
EEZ Exclusive Economic Zone
ENSO El Niño Southern Oscillation
EU European Union
FAO Food and Agriculture Organization of the United Nations
GBR Great Barrier Reef
GoK Government of Kenya
ICRAF World Agroforestry Centre
IGAD Intergovernmental Authority on Development
IP Implementing Partner
IUCN International Union for Conservation of Nature
IUU Illegal Unregulated and Unreported
KFS Kenya Forest Service
KMCC Kiunga Marine Community Conservancy
KMFRI Kenya Marine Fisheries Research Institute
KMNR Kiunga Marine National Reserve
KWS Kenya Wildlife Service
LAPSSET Lamu Port Southern Sudan-Ethiopia Transport
LMMAs Locally Managed Marine Areas
MPAs Marine Protected Areas
MSP Marine Spatial Planning
NGO Non-Governmental Organization
NRT Northern Rangelands Trust
PES Payment for Ecosystem Services
PMCC Pate Marine Community Conservancy
SDF State Department of Fisheries
TNC The Nature Conservancy
UVC Underwater Visual Census
VMS Vessel Monitoring System
WIO Western Indian Ocean
WWF World Wildlife Fund
viiiAbstract The oceanography, geology, connectivity with Gulf of Aden, diverse ecosystems and cultural world heritage are the Outstanding Universal Values of Lamu-Kiunga seascape. The oceanography supports a productive marine ecosystem that hosts a variety of marine species. The coral cover in 2015 averaged 16%, with a range of 35% inshore
Introduction

The Biodiversity Management Programme (BMP) is an Intergovernmental Authority on Development
(IGAD) initiative which aims to contribute to poverty reduction by improving the social and economic
wellbeing of populations in the region, through better regional integration in the environmental
sector. Its purpose is the conservation and sustainable management of ecosystems in order to
contribute to lasting ecosystem goods and services. ICRAF is one of BMP’s Implementing Partners (IPs)
and is managing one of the three projects aimed at developing collaborative management in three
cross-boundary land and seascapes between Kenya-Somalia, Djibouti-Ethiopia and Ethiopia-South
Sudan. The initiative is funded by the European Union (EU).

The ICRAF-led project (November 2013-November 2017) is being implemented in the cross-border
area of northeastern Kenya and southern Somalia in an area extending from the Tana River in Kenya
to the Laga Badana Bush Bush National Reserve in Somalia. This paper addresses one of the project
aims of sourcing biodiversity information and providing a synthesis of threats and opportunities. As a
partner on the ICRAF project, CORDIO East Africa was tasked with contributing to this activity by
leading the compilation and synthesis of information on marine biodiversity in the northern Kenya
part of the seascape from Lamu to the Somali border at Kiunga. With additional funding from The
Nature Conservancy (TNC), CORDIO East Africa was able to survey the Pate to Kiunga coastal marine
habitats in 2015.

The purpose of the study was to assess the near-shore coastal marine environment, its current and
potential use and benefits of ecosystem services to people, and the drivers and pressures of change
in the seascape, as well as opportunities for improved management.

This study sought to determine the current status of the marine biodiversity in the area, with a
particular focus on coral reefs and mangroves as the two dominant marine habitats in this seascape.
Current management of the national marine reserves, and information on other key aspects of this
seascape such as coral health, ecologically valuable habitats, vulnerable and threatened species,
ecosystem services and resilience to climate change were also assessed.

                                                                                                    1
The Lamu-Kiunga seascape
The Lamu-Kiunga seascape is located in the northern part of Kenya’s coast between 1.6537°S,
41.5598°E and 2.4776°S, 40.7060°E. The area borders Somalia. It has many valuable marine resources,
such as mangroves, coral reefs and seagrasses, which provide an important source of livelihood and
food security for local communities. Management of Pate Island and Kiunga area has embraced the
use of community conservancies, anchored in the Wildlife Conservation and Management Act 2013,
and established through a partnership between communities, government, The Nature Conservancy
and Northern Rangelands Trust (NRT). Pate Marine Community Conservancy (PMCC) and Kiunga
Marine Community Conservancy (KMCC) were established in 2013: PMCC is in charge of coordination
of conservation measures in four management units (blocks) of Pethali, Rewa, Uvondo and Siyu while
KMCC is responsible for Mkokoni, Kiwayu, Rubu, Kiunga and Ishakani (Figure 1). It is anticipated that
the integration of local traditional knowledge on environment with modern science and research will
improve the management of finite resources.
Source: NRT-Coast
Figure 1: Map of coastline showing Kiunga Marine National Reserve and the conservancies
Physiography of the seascape
The seascape has a continental shelf spreading about 4-6km off the mainland. The coral reef type is
characterized by patchy and fringing reefs with offshore deep reef terraces. The deep reef extends
about 4km offshore to the edge of the continental shelf, while the raised fossil reef onshore are mostly
covered with sand dunes such as the Kiwayu Island, which support halophytic shrubs, grasses and
woodland. The geology of the islands comprises the fossilized sand dunes and beaches of the
Pleistocene age (Weru et al. 2001). The coastline of Lamu seascape and northeastwards along Somalia
is mostly rocky with few indentations and is rimmed by a narrow beach. The rocks consist of
2Quaternary sediments that are in contact with Jurassic sediments and the Precambrian basement
(Pepper and Everhart 1963).
Geology and oceanography
The ocean floor of Lamu-Kiunga seascape lies on the Indian Ocean Basin within the African plate, which
broke up from Gondwanaland, the super continent, about 180 million years ago (Cande and Stegman
2011, Obura et al. 2012). The ocean floor has remained relatively unchanged making it a refuge for
different marine species.
The broader Lamu-Kiunga archipelago represents the Northern Monsoon Coastal Current eco-region
of Kenya (McClanahan 1988, Obura 2012). The Lamu-Kiunga area experiences monsoonal winds, East
Africa Coastal Current (EACC) and Somali current that significantly influences the rainfall and sea
surface temperatures (Schott et al. 2009). The influence of the Somali current with its cold upwelling
waters is higher in the seascape compared to Kenya’s southern coast, partly because of its proximity
and due to the narrow width of continent shelf in the north compared with the south (Figure 2). The
upwelling waters of the seascape enhance nutrient circulations for the primary and secondary
productivity of the marine ecosystems, supporting marine life such as fish, crustaceans, molluscs and
migratory species such as seabirds and turtles (Samoilys et al. 2015).
Source: Cordio East Africa
Figure 2: Spatial extent of coral reefs of the Kenyan coast and the 200m-depth contour
Outstanding features of Lamu-Kiunga seascape
The coral reef system in the area has a unique mix of coral and fish species representative of the East
African and the Red Sea/Arabian Gulf fauna. Convergence of the East Africa Coastal Current (EACC)
3and the cold upwelling of the Somali current cause this. For instance, an endemic angelfish of the Red
Sea/Gulf of Aden, Apolemichthys xanthotis is found in the area. The coral rag islands of Kiunga-Lamu
archipelago also act as key nesting grounds for 10,000 breeding pairs of roseate terns (Sterna
dougallii). Other birds include white-cheeked tern (Sterna represa), bridled tern (Sterna anaethetus),
white pelicans (Pelecanus onocrotalus), and African spoonbill (Platalea alba) (Weru et al. 2001). There
are also anecdotal reports of sightings of the Critically Endangered knifetooth sawfish (Anoxypristis
cuspidate) and longcomb sawfish (Pristis zijron) south of Lamu in the lower reaches of the Tana River
(Samoilys et al. 2011a).
The geology, oceanography, connectivity with Gulf of Aden, wide range of ecosystems from terrestrial
and marine habitats, and cultural world heritage are some of the Outstanding Universal Values of the
broader Lamu-Kiunga seascape. The seascape is endowed with unique habitats, extensive mangrove
forests and resident and migratory species, making it an important global biodiversity site (Weru et
al. 2001, Obura et al. 2012).
4Biodiversity of shallow marine habitats
Introduction
The habitats of Lamu-Kiunga seascape offer a wide range of ecosystem services from the complex
carbon sequestration services, primary and secondary productivity to providing habitat and nursery
grounds for numerous fish and shellfish (De La Cruz 1979, Carlton 1974). Shallow marine habitats
found in Lamu-Kiunga seascape include coral reefs, seagrass and mangroves ecosystems that provide
four ecosystem services of provisioning, regulating, cultural and supporting services.
Seagrass meadows provide numerous high value ecosystem services. They are vital habitat for marine
organisms and form important foraging grounds for the endangered marine turtles and dugongs.
Seagrass ecosystems are vital to the fishing industries as they serve as an important habitat and source
of food to large fish species, for at least a part of their life cycle. They stabilize bottom sediments with
their dense roots and rhizomes especially during storms. Seagrass beds also represent enormous
carbon sinks and are being considered in blue carbon schemes (Samoilys et al. 2015).
Coral reefs
Coral reefs are among the most productive and diverse of all marine ecosystems. They control the
ecology of near shore marine environments by providing habitat and shelter to a high diversity of fish
families, lobsters, octopus, dugongs, turtles and whale sharks. They act as a buffer for ocean waves
reaching the shore. Coral reef ecosystem supports both artisanal and commercial fisheries and hence
forms the backbone of coastal communities’ economies. Recreational activities in coral reef
ecosystems support the tourism industry, which subsequently engages other stakeholders such as
boat operators, tour companies, tour guides and hoteliers in the hospitality sector.
Coral reefs in Kenya extend from the Tanzanian border in the south to the Somali border in the north
and cover an area of 621.55 km² representing 0.2% of the Great Barrier Reef (Figure 2). Kenya’s coral
communities conform to those of the western and central Indian Ocean biogeographic zone, with
some endemic species and others of wide Indo-Pacific distribution (Obura 2012). The reefs are
typically composed of hard substrate co-existing closely with extensive sea grass communities as
described by Rosen (1971). A continuous fringing reef dominates the southern part of Kenyan reefs
while patchy and in places marginalized reefs characterize the northern part including the Pate Island
to Kiunga area. These contrasting formation patterns between the southern and the northern reefs is
attributed to the unique biophysical characteristics of the northern coast notably the fresh water
discharge from the Tana and Sabaki Rivers coupled with the nutrient rich Somali current running south
from Somalia (Survey of Kenya 2009, Obura et al. 1998).
Coral diversity
The coral reef survey in 1998 in the Pate Island-Kiunga Reserve area identified 51 genera and 146
species of corals with the reefs of Simbabaya, Kui and Bomani being more diverse than other reefs
(Obura et al. 1998). Surveys done in 2000s show presence of 180 species of corals in the Lamu-Kiunga
5seascape (Obura et al. 2012). The unique corals species in the seascape include Porites nodifera, P.
columnaris, and Coscinaraea species (Hamilton and Brakel 1984, Obura 2008). Globally rare coral
genera of Siderastrea, Horastrea, Caulastrea, and Moseleya have also been encountered in previous
coral surveys (Obura et al. 1998). The rare and endemic corals comprise Horastrea indica and
Siderastrea savignyana. Goniopora sp. is also present especially off Pate Island (Samoilys et al. 2011a).
Forty-four coral genera were recorded across all the sites (Appendix 1). The site-level species richness
varies from highs of 26 genera on many of the deep reefs at Chole, 25 genera at Shimo la Tewa, to
lows of 16-17 genera at Kui, Kupi and Pethali, all inner patch reefs. By contrast, species richness was
greatest on the shallow reefs (Shimo la Tewa, Chole, Iweni) and lowest on two deep reefs (Mongo
Shariff, Ch. Rubu) and two inner reefs (Pethali, Kui). Reef sites were strongly dominated by Porites
followed by about 15 genera that decreased progressively in relative abundance, and included Favites,
Goniastera, Coscinaraea, Favia. Eight genera were scarce, only found once in the entire survey. This
includes the endemic genus Craterastrea, which until now had been reported only within the high
diversity centre in the northern Mozambique Channel, as well as from Chagos (British Indian Ocean
Territory). Genus richness is generally low, compared to >50 genera recorded and >300 species
expected at sites in the northern Mozambique Channel (Obura 2012).
Coral reef benthos
Coral reefs globally are facing a decline in cover and change in species composition due to stressors
such as climate change, pollution, overfishing and harmful algal blooms. Estimates indicate that
globally approximately 34% of the coral reefs have been destroyed or are declining (Pandolfi et al.
2011). Global trends show a decline in hard coral cover, which has accelerated in the last few decades
(Pandolfi et al. 2003, Carpenter et al. 2008). Coral reefs of the northern offshore Kiunga area are
predominantly algal reefs with some patch coral habitats, particularly nearshore, with coral cover of
around 4% on the offshore deep reef slopes of Kiunga Marine Reserve (Samoilys 1988). Hard coral
cover estimates in 1987 on the deeper offshore reefs of Rubu, Mkokoni and Kiwayu was 86% and then later
dropped, but to levels that were always higher than the pre-bleaching level (Figure 3d). In 2006 macro-
algae cover was between 42% and 79% in the Pate-Kiunga area. This increase in macro-algae
corresponds to a reduction in hard coral cover. Studies on coral conditions and recruitment within
Kiunga Marine National Reserve, conducted systematically from 1998 to 2002 further underscore a
low recruitment in 1999, likely due to mortality following the 1998 coral bleaching and reduced
reproductive output of surviving corals (Table 1). While the cover of corals in the Pate Island-Kiunga
seascape is generally well below the average cover of Kenyan reefs (20-30%), by 2000 the cover had
6stabilized, but on average at lower levels than pre-bleaching levels. However, some sites had
recovered to higher levels within the nearshore Kiwayu and Pethali areas and are within the range of
national coral cover (Figure 3a).
a) Hard corals b) Soft corals
Ishakani Kiunga Rubu Kiwayu Mkokoni Pethali Ishakani Kiunga Rubu Kiwayu Mkokoni Pethali
50 50
45 45
40 40
Soft coral cover (%)
Coral cover (%)
35 35
30 30
25 25
20 20
15 15
10 10
5 5
0 0
1998 1999 2000 2001 2002 2003 2004 2005 2006 1998 1999 2000 2001 2002 2003 2004 2005 2006
Year Year
b) Coralline algae d) Algae
Ishakani Kiunga Rubu Kiwayu Mkokoni Pethali Ishakani Kiunga Rubu Kiwayu Mkokoni Pethali
100 100
90 90
80 80
Coralline algae (%)
Algae cover (%)
70 70
60 60
50 50
40 40
30 30
20 20
10 10
0 0
1998 1999 2000 2001 2002 2003 2004 2005 2006 1998 1999 2000 2001 2002 2003 2004 2005 2006
Year Year
Figure 3: Change in the cover of benthic variables: a) hard coral, b) soft coral, c) coralline algae and d) brown
macro-algae, from 1998 to 2006 in the Lamu-Kiunga area (Data source: CORDIO/WWF) See appendix 2 for
data treatment and analysis
From the coral reef surveys conducted in 2015 to determine the current status of reefs in the area
(Figure 4), the coral cover of Pate-Kiunga area averaged 16% across the sites, from a maximum of 35%
at Iweni to minimum of 20%) and Ch. Mvundeni (10%). However, these are not higher than levels nine years ago. In 2015,
turf algae were the dominant cover across all sites at an average of 38%, followed by hard corals (16%)
then macro algae (13%). Macro-algal cover is now substantially lower than it was in 2006. Macro algal
cover did vary between sites with higher cover at three deep reefs (Rubu, Mongo Shariff and
Mvundeni) and two shallow reefs (Kui and Pethali). Reasons for these site differences are not clear,
possibly due to site differences in nutrient enhancement from neighboring mangroves or upwelling.
7Source: Cordio East Africa
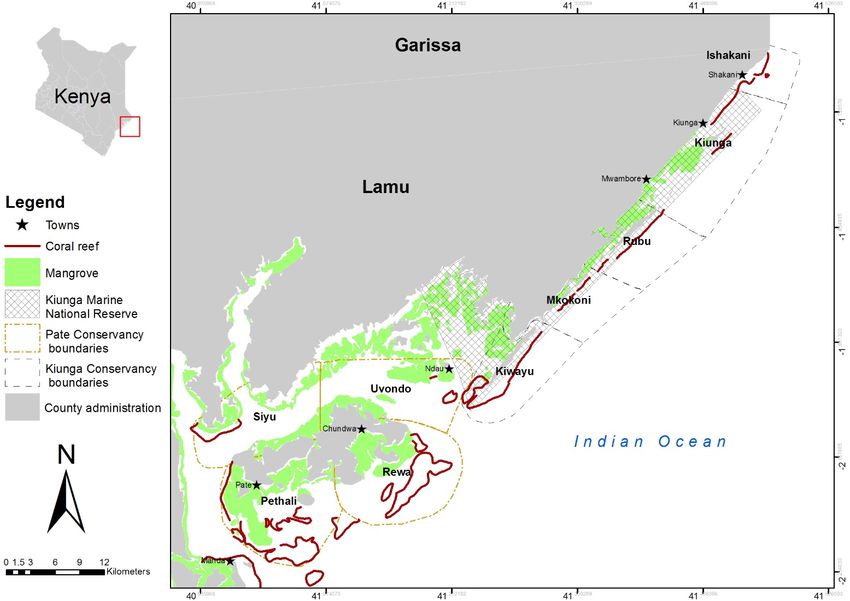
Figure 4: Map of in-situ coral reef survey sites conducted by CORDIO through support from TNC in 2015 in the
conservancies established under the NRT Coast programme.
Table 1: Densities of coral adults and recruits sampled in Kiunga Marine National Reserve from 1998 to 2002
Source: Obura and Church 2003
Coral mortality and bleaching
Increases in sea surface temperature coupled with various use of coral reefs by coastal communities
have increased pressures on coral reefs. The 1998/1999 El Nino led to bleaching of more than 80% of
the coral reefs in the Lamu-Kiunga seascape (Obura et al. 2007). Stressors such as harmful algal blooms
and disease as witnessed in January-March 2002, as well as bleaching remain the primary cause of
coral mortality in the area (Church and Obura 2004). Other than that, the economic development
witnessed in Kenya over the past few years has seen major projects commence in the northern coast,
8notably the Lamu Port Southern Sudan-Ethiopia Transport (LAPSSET) project and oil explorations.
These activities are likely to further affect the corals in the area, but the impact of these activities
remains to be assessed.
Resilience status of reefs
Globally coral reefs have demonstrated some form of resilience and resistance to both physical and
biological stressors such as fluctuations in seawater temperature. For example, in the Persian Gulf,
reefs have demonstrated resilience by thriving under extreme conditions of fluctuating water
seawater temperatures. Such scenarios have also been documented in Kenya where the reefs showed
good recovery after the 1997/1998 bleaching and after instances of coral diseases caused by harmful
algal blooms in 2002 (Church and Obura 2004). Following the El Niño Southern Oscillation (ENSO)
event, the coral reefs of the KMNR showed varying levels of resistance and resilience to bleaching
(West and Salm 2003, Obura 2004, 2012). Bleaching was evident everywhere but mortality was least
in the inner channel reefs demonstrating resilience and resistance to bleaching as a result of influence
on turbidity and water flow (Obura and Church 2004). However, resilience in the overall system
declined dramatically in 2002 because of coral disease culminating in decreased coral cover and
recruitment. With indications of a rising seawater temperature within the next 50 years on the East
African coast, management measures are urgently required to increase resilience of coral reefs along
the Lamu-Kiunga seascape.
Coral reef fish diversity
Over 30 genera and 150 species of fish were reported in the Kiunga Reserve in 2001 (Weru et al. 2001).
Deeper fore reefs as well as inner reefs of Kui, Boma and Rubu reefs showed high diversity of fish
species. Notable fish species found in the Lamu-Kiunga seascape include Red Sea/Arabian Gulf
angelfish Apolemichthys xanthotis and the Endangered Napoleon wrasse Cheilinus undulatus. A total
of 189 species of reef fish were observed during the Pate to Kiunga 2015 survey (Appendix 3), out of
a total number for the WIO of >350 in the 19 families surveyed (Samoilys and Alvarez Filip 2012). This
diversity is low, compared with reefs further south in Tanzania and Mozambique, but to be expected
for these northernmost east African reefs, which are marginal. Species richness based on the list of 19
families ranged from 45 at Chongo Chachano/Mvundeni (combined sites) to 81 at Kui (Table 2).
Families that were notably poorly represented were the Pomacentridae and Labridae, two of five most
speciose families that are considered the best indices for assessing reef fish diversity and are used in
the Coral Fish Diversity Index (CFDI) by Allen and Werner (2002). Numbers of species of these families
and the chaetodontids were very low at Chongo Chachano, Mvundeni, Rubu and Mongo Shariff (Table
2). These are the offshore deep plateau type reefs dominated by algae. Clearly species richness
improves on the inner reefs and bays where there is more coral formation, as seen in the CFDI families
and the total species counts at these other inner sites. Comparisons with other reef systems further
south on the east African coastline and in Madagascar help put these values in perspective, with total
species counts in NE Madagascar at 271 and northern Mozambique at 263 (Table 2). Species diversity
for balistids and haemulids is relatively high at the Lamu-Kiunga sites while the species diversity for
scarids and serranids is very low.
9The CFDI diversity index provides a relative global index for assessing reef fish diversity as a measure of reef health. The overall CFDI for the Pate- Kiunga reefs was 122, considerably lower than that of reefs elsewhere in the WIO (Table 3). Fawacho and Ras Mabiyu in Pate Conservancy both scored the highest CFDI at 55, with Kui at 51 and Iweni and Pethali both with 42. Other inner sites in Kiunga scored
Table 2: Total number of reef fish species per family per site
                                                                    Pethali          Fawacho      Ras         Kiwaiyu                   Kiw/Rubu          Rubu                     Kiunga
                                                                                                  Mabiyu
 Family                  Madag-      North         All        Iweni*     Pethali     Fawacho      Ras         Shimo      Uso            Chano/Mvun        Chole*          Rubu/    Kui
                         ascar       Mozamb        sites                                          Mabiyu      la         Watafau*       d                                 Sharif
                         2010        2015          Lamu-                                                      Tewa*
                                                   Kiunga
 Pomacentridae*          38          40            30         13         10          20           13          5          11             4                 6               6        13
 Pomacanthidae*          6           7             4          1          1           3            3           1          1              2                 0               2        2
 Labridae*               57          50            40         12         15          16           19          11         12             15                12              18       15
 Chaetodontidae*         22          21            17         6          4           7            2           2          1              4                 2               5        6
 Scaridae*               20          26            9          3          3           6            4           6          2              1                 3               2        6
 Acanthuridae*           28          23            22         4          7           6            9           10         5              6                 7               11       10
 Serranidae              14          18            8          0          1           1            4           2          1              1                 1               2        4
 Lethrinidae             10          9             3          2          1           1            1           1          2              0                 0               1        1
 Lutjanidae              11          10            7          4          1           2            2           2          5              1                 3               1        6
 Caesionidae             7           8             7          2          2           3            5           2          1              1                 3               1        3
 Haemulidae              6           8             9          1          2           3            3           4          3              0                 2               3        8
 Nemipteridae            2           3             1          0          0           0            0           0          1              0                 1               0        0
 Mullidae                8           6             6          1          4           1            0           1          2              1                 2               3        4
 Siganidae               6           6             4          2          2           1            1           1          1              0                 2               1        1
 Balistidae              12          9             10         1          0           0            0           0          0              6                 0               10       1
 Monacanthidae           7           2             1          0          1           0            0           0          0              0                 0               0        0
 Ostraciidae             2           5             2          0          1           0            0           0          1              1                 0               1        0
 Tetraodontidae          8           8             4          2          1           1            1           0          3              0                 1               1        1
 Carangidae              7           4             5          0          0           0            0           0          0              1                 1               2        1
 Total                   271         263           189        57         58          68           72          48         53             45                48              75       81
Values from Madagascar and Mozambique are provided for comparison. * = 5 families used to calculate the Coral Fish Diversity Index (CFDI). Blue=Pate; pink=Kiunga sites

                                                                                                                                                                                            11
Table 3: Coral reef fish diversity index (CFDI) values for Lamu-Kiunga and from other WIO countries
Location CFDI Source/date of survey
Lamu-Kiunga 122 CORDIO-TNC survey/2015
Mozambique – Mocimboa and 167 Samoilys et al. 2015/2015
Palma
Northeastern Madagascar 172 Samoilys and Randriamanantsoa
2011/2010
Northwestern Madagascar 176 Allen 2005/2002
Comoros - Grande Comore and 147 Samoilys unpubl., 2010
Moheli
CFDI = total no. species in 6 families: Chaetodontidae, Pomacanthidae, Pomacentridae, Labridae, Scaridae and Acanthuridae.
Source: Allen and Werner 2002
Trends in fish abundance
Comparisons of the fish surveys conducted using standard underwater visual census (UVC) methods
(Samoilys and Carlos 2000) from 1999 to 2008 (surveys by WWF/CORDIO), reveal variability in fish
densities of 11 selected families across the years and management areas (Figure 5). The densities of
seven families in 1987 at three areas of Rubu, Mkokoni and Kiwayu were added as reference points.
The densities of acanthurids, haemulids, lutjanids, lethrinids and scarids were significantly different
with respect to years and areas (pwere either missing or present in a few sites. The biomass was higher at Kui than other sites mainly
due to large sized lutjanids (103.8±100.9 kg/1000m2), scarids and acanthurids. Also observed at this
site was a juvenile giant grouper, Epinephelus lanceolatus, estimated at 86cm in length. In contrast,
Chongo Rubu, Shimo la Tewa and Chongo Mvundeni had the lowest biomass of fish families. In
summary, across all sites and families, densities were generally lower in 2015 than in 2006 (Figures 5
and 6).
Acanthuridae Balistidae
Ishakani Kiunga Rubu Kiwayu Mkokoni Pethali Ishakani Kiunga Rubu Kiwayu Mkokoni Pethali
3500 3000
3000 2500
Density (no./1000 m2)
Density (no./1000 m2)
2500
2000
2000
1500
1500
1000
1000
500 500
0 0
1999 2000 2001 2002 2003 2004 2005 2006 2007 2008 1999 2000 2001 2002 2003 2004 2005 2006 2007 2008
Years Years
Carangidae Chaetodontidae
Ishakani Kiunga Rubu Kiwayu Mkokoni Pethali Ishakani Kiunga Rubu Kiwayu Mkokoni Pethali
1400 180
160
1200
Density (no./1000 m2)
Density (no./1000 m2)
140
1000
120
800 100
600 80
60
400
40
200
20
0 0
1999 2000 2001 2002 2003 2004 2005 2006 2007 2008 1999 2000 2001 2002 2003 2004 2005 2006 2007 2008
Years Years
Haemulidae Kyphosidae
Ishakani Kiunga Rubu Kiwayu Mkokoni Pethali Ishakani Kiunga Rubu Kiwayu Mkokoni Pethali
2000 400
1800 350
1600
Density (no./1000 m2)
300
Density (no./1000 m2)
1400
1200 250
1000 200
800 150
600
100
400
200 50
0 0
1999 2000 2001 2002 2003 2004 2005 2006 2007 2008 1999 2000 2001 2002 2003 2004 2005 2006 2007 2008
-50
Years Years
Lethrnidae Lutjanidae
Ishakani Kiunga Rubu Kiwayu Mkokoni Pethali Ishakani Kiunga Rubu Kiwayu Mkokoni Pethali
140 4500
4000
120
Density (no./1000 m2)
Density (no./1000 m2)
3500
100
3000
80 2500
60 2000
1500
40
1000
20
500
0 0
1999 2000 2001 2002 2003 2004 2005 2006 2007 2008 1999 2000 2001 2002 2003 2004 2005 2006 2007 2008
Years Years
13Scaridae Serranidae
Ishakani Kiunga Rubu Kiwayu Mkokoni Pethali Ishakani Kiunga Rubu Kiwayu Mkokoni Pethali
500 45
450 40
400
Density (no./1000 m2)
Density (no./1000 m2)
35
350
30
300
25
250
20
200
15
150
100 10
50 5
0 0
1999 2000 2001 2002 2003 2004 2005 2006 2007 2008 1999 2000 2001 2002 2003 2004 2005 2006 2007 2008
Years Years
Siganidae
Ishakani Kiunga Rubu Kiwayu Mkokoni Pethali
400
350
Density (no./1000 m2)
300
250
200
150
100
50
0
1999 2000 2001 2002 2003 2004 2005 2006 2007 2008
Years
Data source: WWF/CORDIO
Figure 5: Fish abundance of 11 selected families in Kiunga-Pate seascape
14Ac Mean per 1000 m2 Mean per 1000 m2
Ac
an an
0
50
100
150
200
th
0
50
100
150
200
u th
rid u rid
Ba ae Ba ae
lis lis
C tid C tid
ae ae ae
C si
o C si
ae
ha ni ha on
et da et id
od
on e od ae
on
H tid H tid
ae ae ae ae
m m
ul ul
Le id Le id
ae
Abundance(#)
Abundance(#)
th th ae
r in
Kui
rin
id id
Po
Lu
tja
ae Lu a
Po tja e
m ni m ni
Ch Mvundeni
ac da ac da
Fish family
e
Fish family
an an e
th th
d i id
Sc ae Sc a e
Biomass (kg)
Biomass (kg)
ar
i a
Se da Se rida
rra e rra e
ni ni
Si dae Si dae
ga ga
ni ni
da da
e e
Ac Mean per 1000 m2 Ac Mean per 1000 m2
an an
0
50
100
150
200
0
50
100
150
200
th th
rid u u rid
Ba ae Ba ae
lis lis
C ti C tid
a da ae ae
C esio e C si
on
ha ha
et nid et id
od a od ae
on e on
H t H tid
ae idae ae ae
m m
u ul
id
Le lida Le
Abundance(#)
e
Abundance(#)
th th ae
rin rin
L id
Lu idae a
Ch Rubu
Po tj Po utja e
m anid m ni
Mongo Shariff
ac ac da
Fish family
e
Fish family
an ae an
th th
id id
Sc ae Sc a e
Biomass (kg)
Biomass (kg)
ar a
Se ida Se rida
rra e rra e
ni ni
Si dae Si dae
ga ga
ni ni
da da
e e
Ac Mean per 1000 m2 Ac Mean per 1000 m2
an an
Figure 6: Mean density and biomass of fish families surveyed at six sites in Pate Island-Kiunga area in 2015
0
50
100
150
200
0
50
100
150
200
th th
rid u u rid
Ba ae Ba ae
lis lis
C C tid
ae tida ae
C s e C si
ae
ha ion ha on
et i et id
od dae od ae
on on
H t H tid
ae idae ae ae
m m
ul ul
Le ida Le id
e
Abundance(#)
Abundance(#)
th th ae
rin rin
id
Iweni
Lu idae Lu a
Po tj Po tja e
m anid m ni
d
Shimo la Tewa
ac ac
Fish family
Fish family
an ae an ae
th th
id id
Sc ae Sc ae
Biomass (kg)
Biomass (kg)
ar ar
Se da i Se da i
rra e rra e
ni ni
Si dae Si dae
ga ga
ni ni
da da
e e
15Seagrass
Seagrass are submerged flowering plants found in shallow marine waters, such as bays and lagoons
along continental shelves. They are distributed from intertidal to subtidal soft and hard bottoms,
comprising coral reef patches, mud flats, lagoons, sandy bays, estuaries, and sheltered and exposed
reef platforms. They show clear zonation patterns with water depth, sediment structure and
exposure to air and sunlight during low tide. They are an important carbon and nutrient sink; act as a
habitat for migrating coral reef species, waterbirds, fish, dugongs and turtles; and are critical to
fisheries and coastline protection (Nagelkerken 2009). Seagrass meadows also play a role in
attenuating the currents and waves. In doing so they trap suspended organic matter in the
sediment. Provisioning services of seagrass beds include supporting commercial, subsistence and
recreational fisheries.
The seagrass beds within the Lamu-Kiunga area are extensive, but little studied, and forms one of
the most important habitats for marine fauna such as turtles and dugongs (Church and Obura 2006).
The status of these species is treated later on in this report. The dominant seagrass in Lamu-Kiunga
area is Thallasodendron ciliatum (Church and Obura 2006), though Syringodium isoetifolium,
Cymodocea serrulata, C. rotundata, Halodule wrightii, H. uninervis, Enhalus acroroides and Zostera
capansis are also present (WWF 1996, Samoilys et al. 2011a). Seagrass beds have not been
quantified over years in the Lamu-Kiunga seascape, and only recently in 2015 have Kenya Wildlife
Service initiated surveys of the seagrass beds of this area; data are not yet available.
Mangroves
Mangrove ecosystems are characteristically dominant features along the tropical and subtropical
coastline and are among the most productive ecosystems with a mean production of 8.8 tC/ha/yr
(Jennerjah and Ittekkot 2002). Kenya’s mangroves are found along the entire coast, which spans
approximately 640km from latitude 1°40’ North at Somali border to latitude 4°40’ South at the
Tanzanian border (Figure 7). Two communities of mangroves formation, fringe and creek, occur along
the coastline with the largest formation being in Lamu and Tana Delta (Ferguson 1993, Kairo et al.
2001).
Mangrove cover
The Lamu-Kiunga seascape hosts the largest stands of mangrove forests representing over 60% of
Kenya’s mangroves (Kairo 1995, GoK 2009). The standing mangrove biomass of the seascape (Mlango
wa Chano to Kiunga) was about 480t/ha in the late 1990s (Weru et al. 2001) and a stand density of
over 80% and height greater than 10m was reported in 2002 (Kairo et al. 2002).
The extent of mangrove cover in Kenya has been estimated on multiple occasions with variable values
reported (Table 4). Earlier estimates of 1981 reported 52,000 ha (Doute et al. 1981), while the most
recent cover of 2010 determined from Landsat satellite imagery estimated the total mangrove
coverage of 45,590 ha (Kirui et al. 2013). The methods used in estimating the cover and possible loss
of mangroves due to increased exploitation rates are the likely reasons for this variability in the
estimated mangrove cover over years.
16Studies at single sites have shown reduction in coverage and quality depicting a scenario where
Kenyan mangroves are conforming to the global trends of declining cover. Comparison of mangrove
cover in Lamu-Kiunga area in 1995 and 2014 shows a decline in cover (Okello et al. 2015). However,
the overall loss of mangrove cover in Lamu-Kiunga was highest between 2000 and 2005 when 2,046.17
ha of mangroves was lost. The current mangrove cover in the NRT-Coast conservancy areas within
Pate and Kiunga were estimated at 11,277 ha, which represents a 22.6% cover loss over 19 years
(Okello et al. 2015).
Figure 7: Spatial distribution of mangroves along the Kenyan coast
Mangrove diversity
The global distribution of mangroves indicates a tropical dominance with major latitudinal limits
relating best to major ocean currents. There are 9 orders, 20 families, 27 genera and roughly 70
species of mangroves occupying a total estimated area of 181,000 km2 (Spalding et al, 1997). However,
the exact number of species is still under discussion and ranges from 50 to 70 according to different
classifications. The highest species diversity is found in Asia, followed by eastern Africa (Maiti et al.
2013).
17Table 4: National level mangrove area estimates in Kenya from 1931 to 2010
Year Area (ha) Methodology and remarks Source
1931 64,427 Secondary reference, no primary FAO 1993
source provided
1971 50,000 Rough estimate. Secondary reference, FAO 1993
no primary source provided
1980 45,000 Estimation and updating FAO and UNEP 1981
1981 54,325 Remote sensing Doute et al. 1981
1983 62,380 Cited in: FAO 1991 Forest Department Kenya
1983
1988 96,100 Map analysis Spalding et al. 1997
1989 63,783 Secondary reference, the “Year” is the FAO 1991
publication year
1992 58,700 The "Year" is the publication year Semesi 1992
1995 52,980 Remote sensing Gang 1995
1996 57,300 Secondary reference, no primary WRI, UNEP, UNDP, The
source provided World Bank 1996
The "Year" is the publication year
2000 61,000 Secondary reference, no primary World Resources Institute
source provided. The "Year" is the 2000
publication year
2010 45,590 Landsat satellite imagery Kirui et al. 2011
Source: FAO, UNEP 1981
Mangrove species composition in Lamu-Kiunga area is diverse with eight of the nine species known in
Kenya present (Table 5; Weru et al. 2001). The dominant species are Rhizophora mucronata, Ceriops
tagal and Avicennia marina (Table 6). Others are Xylocarpus granatum, Xylocarpus molluccensis,
Bruguiera gymnorrhiza, Sonneratia alba and Lumnitzera racemosa (Table 5). Worth noting is the
presence of large stands of Heriteria littoralis a unique mangrove species mostly found south of Lamu
in the Tana River Delta. This species is one of the tallest, and develops broad canopies. It also supports
the growth of shrubs that attract elephants to forage in mangrove ecosystems, a unique phenomenon
in the coastal region (Samoilys et al. 2011a).
The distribution of mangrove species is significantly influenced by both human and natural factors
(Feller et al. 2010). The zonation pattern of mangroves is, for example, dynamically influenced by the
level of inundation and salt concentration in the surrounding environment (Van Speybroeck 1992).
Studies of oil spills (anthropogenic) in the Caribbean have shown that mangroves exhibit increased
mutation rates and long (approximately 20 years) recovery times may be required after repeated
18exposure (Burns et al. 1993, Klekowski et al. 1994) thus reducing their genetic vigor through death
and retardation. Such impacts are likely to happen upon full operation of the Lamu Port and
consequently change the species distribution highlighted in Table 6.
Table 5: Mangrove species of Lamu-Kiunga region
Family Species Local name Geographical
range
Avicenniaceae Avicennia marina (Forskål) Vierh. Mchu WIO, Red Sea, A
Gulf to W Pacific
Ocean
Rhizophoraceae Bruguiera gymnorrhiza (L) Lamarck Muia Indo-Pacific
Rhizophoraceae Ceriops tagal (Perr) C. B. Robinson Mkandaa WIO to W Pacific
Rhizophoraceae Rhizophora mucronata Lamarck Mkoko WIO to W Pacific
Combretaceae Lumnitzera racemosa Willd Kikandaa WIO to W Pacific
Sonneratiaceae Sonneratia alba J.E. Smith Mlilana WIO to W Pacific
Meliaceae Xylocarpus granatum Koenig Mkomafi WIO to Central
Pacific Ocean
Sterculiaceae Heritiera littoralis* (L.) Dryander Msikundazi WIO to Central
Pacific Ocean
a
Found in Tana Delta, south of Lamu
Adapted from Samoilys et al., 2011a
Table 6: Species distribution and cover within the Kiunga Marine National Reserve
Species Area (Ha) Coverage (%)
Ceriops type forests 2465.77 15.38
Mixed Ceriops types 445.05 2.78
Ceriops-Rhizophora type 1264.22 7.88
Avicennia type 2673.17 16.67
Mixed Avicennia type 560.97 3.50
Rhizophora 3871.11 24.14
Mixed Rhizophora type 3646.45 22.74
Sonneratia-Rhizophora type 507.98 3.17
Sonneratia type 601.22 3.75
Total area 16035.94 100
Source: Kairo et al. 2002
Mangrove zonation
Mangroves are typically distributed from mean sea level to highest spring tide, and perhaps the most
conspicuous feature at first glance is the sequential zonation of tree species perpendicular to the
shore (Smith, 1992). Mangrove zonation in Kenya, has been typically considered to follow similar
pattern, developing from the sea and progressively extending to the land as follows: Sonneratia alba,
19Rhizophora mucronata, Bruguiera gymnorrhiza, Ceriops tagal, Avicennia marina, Xylocarpus
granatum, Lumnitzera racemosa (Wild) and Heritiera littoralis, which shows a lot of variability (Figure
8; Kairo 2001, Dahdouh-Guebas et al. 2002). Bruguiera gymnorrhiza does not form a distinct zonation
but occurs interspersed with Rhizophora and Ceriops while Avicennia shows a disjointed and distinct
zonation displayed at two zones, one landward and one seaward. Generally, other species may be
found growing within mangrove forests and the zonation pattern may vary depending on the
biophysical characteristics of the location as well as human interference.
Adapted from Lang'at and Kairo 2013
Figure 8: Zonation of mangroves along the land-sea interface
20Biodiversity of pelagic habitats
Introduction
Pelagic habitats are of conservation importance as they are used by migratory species such as whales,
sharks and sea turtles. In contrast to the shallow coastal habitats, pelagic environments over deep
water are less productive and less diverse, but nevertheless support important offshore commercial
fisheries (FAO 2009). Some high value species of conservation importance occur in these habitats but
are not typically restricted to them, and these are detailed below. Key threats to these habitats include
overexploitation through commercial and artisanal fishing and a high potential for occurrence of alien
or invasive species. Several high and medium biodiversity value fish species may occur, including a
number of threatened mammals and elasmobranchs (sharks and rays).
Marine Mammals and Turtles
Dugongs, turtles, whales and dolphin occur in the Lamu archipelago (Table 7). Of these, one species is
Critically Endangered, three are Endangered, three are Vulnerable and one Near Threatened, under
the IUCN Red List categories (Table 7). Populations of dugongs (Dugong dugon) are known to have
occurred in the Pate Island-Kiunga area especially in the seagrass beds around the Ziwaiyu coral reef
system. However, recent sightings are very rare and the species is likely to have become extinct. In
addition, the seagrass beds around the islands are feeding grounds for green turtles (Chelonia mydas)
while the Islands of Manda and Lamu provide nesting beaches for four endangered turtles: hawksbill
(Eretmochelys imbracata), green (C. myda), loggerhead (Carretta caretta) and leatherback
(Dermochelys coriacea).
Table 7: IUCN categories of marine mammals sighted in Pate Island – Kiunga area
Common Name Species IUCN Red List category
Dugongs
Dugongs Dugong dugon Vulnerable A2bcd
Turtles
Green turtles Chelonia mydas Endangered A2bd
Hawksbill Eretmochelys imbricata Critically Endangered A2bd
Loggerhead Caretta caretta Endangered A1abd
Leatherback Dermochelys coriacea Vulnerable A2bd
Whales
Humpback whale Megaptera novaeangliae Least Concern
Sei whale Balaenoptera borealis Endangered A1ad
Sperm whale Physeter macrocephalus Vulnerable A1d
Short-finned pilot whale Globicephala macrorhynchus Data Deficient
Dolphin
Indo-Pacific humpbacked Sousa chinensis Near Threatened
dolphin
21Common Name Species IUCN Red List category
Bottle dolphin Tursiops truncatus Least Concern
Pantropical spotted Stenella attenuata Least Concern
Spinner dolphin Stenella longirostris Data Deficient
Stripped dolphin Stenella coeruleoalba Data Deficient
Short-beaked common Delphinus delphis Least Concern
dolphin
Adapted from Samoilys et al. 2011a, 2015
Local resorts and local communities have reported the presence of whales and dolphins in the Pate
area. Humpback (Megaptera novaengliae), sei (Balaenoptera borealis), sperm (Physeter
microcephalus) and pilot (Globicephala macrorhynchus) whales have been sighted in the region and
are known to breed and feed in the offshore waters (Obura et al. 2012). The whale population in this
area is vulnerable due to their rarity and threats of the drifting gillnet fishery. In 1996 a total of 500
dolphins were observed in areas outlying Manda and Pate Islands (Wamukoya et al. 1996). Most of
the dolphins are relatively common during the Northeast monsoon with the common threat being
incidental capture by the gillnet fishery.
Sharks and rays
There are 137 species of sharks and rays in the WIO region, of which 15 are endemic to the region
(Smith and Heemstra 1991). The highest diversity of sharks and rays has been recorded in
Mozambique’s waters with 73 sharks and 35 rays (Samoilys et al. 2015). In Kenya, sharks are targeted
for shark fins and liver oil. Shark fishing is a traditional practice in the Pate Island-Kiunga area, which
has operated for centuries, though the decline in catch rates has been very high: estimated at 85%
over the past 40 years (Samoilys and Kanyange 2008, Samoilys et al. 2015). Six shark species and nine
ray species have been confirmed as fished and sighted in the Pate Island- Kiunga area (Table 8), but
this list is far from exhaustive. Little is known about the status of these species and their occurrence
in Kenyan waters.
Table 8: IUCN categories of sharks and rays fished and sighted in Pate Island-Kiunga area
Species Common name IUCN Red list category
Sharks
Rhincodon typus Whale shark Vulnerable A2bd+3d
Carcharhinus melanopterus Blacktip reef shark Near Threatened
Triaenodon obesus Whitetip reef shark Near Threatened
Galeocerdo cuvier Tiger shark Near Threatened
Sphyrna lewini Scalloped hammerhead Endangered A2bd+4bd
22You can also read