Porirua Harbour Fine Scale Monitoring 2014/15 - Wriggle - Greater Wellington Regional
←
→
Page content transcription
If your browser does not render page correctly, please read the page content below
Wriggle                    coastalmanagement

  Po r i r u a H arb o u r
  Fine Scale Monitoring 2014/15

Prepared
for

Greater
Wellington
Regional
Council
June
2015
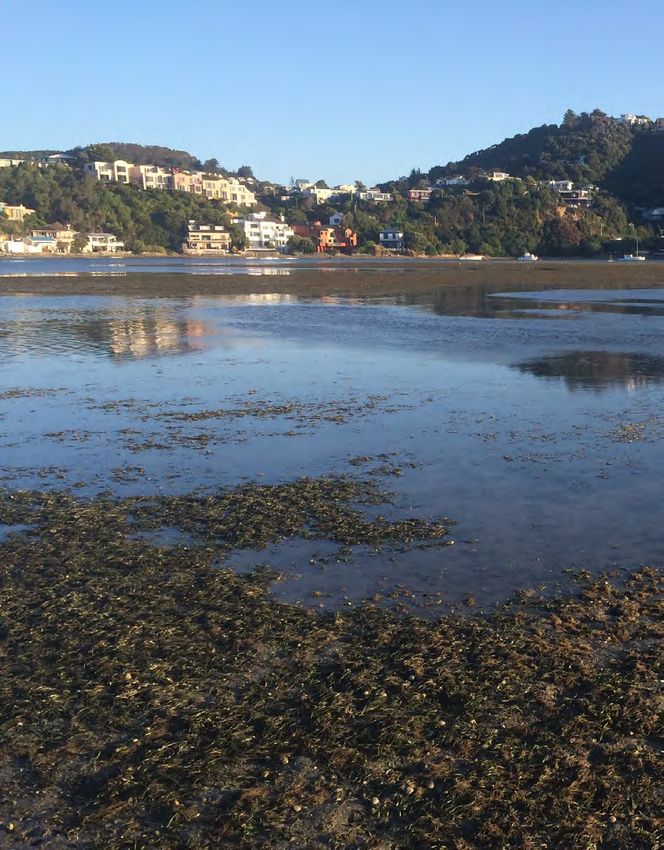
Cover Photo: Porirua Harbour (Pauatahanui Arm)
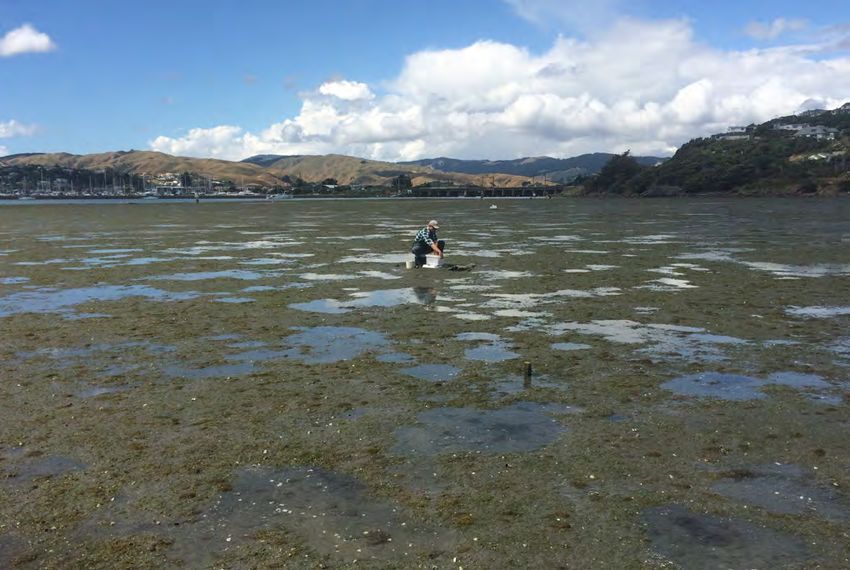
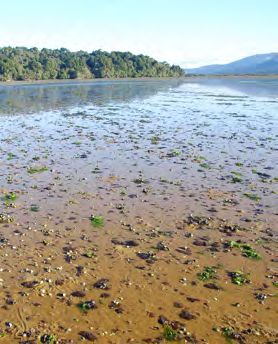
Porirua Harbour (Onepoto Arm) sampling at the Railway site

                                  Po r i r u a Es tu ar y
                              Fine Scale Monitoring 2014/15

                                           Prepared for
                                Greater Wellington Regional Council

                                                               by

                                  Barry Robertson and Leigh Stevens

                Wriggle Limited, PO Box 1622, Nelson 7040, Ph 03 540 3060, 0275 417 935, 021 417 936, www.wriggle.co.nz

                                                                                                     Wriggle     coastalmanagement   iii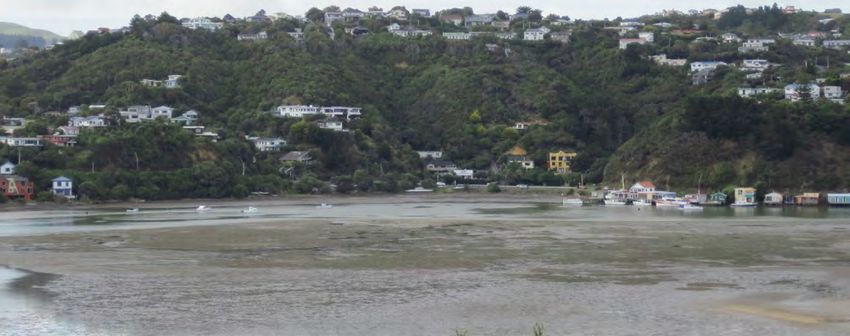
Contents
Porirua Harbour - Executive Summary ���������������������������������������������������������������������������������������������������������������������������������������� vii
1. Introduction �������������������������������������������������������������������������������������������������������������������������������������������������������������������������������������� 1
2. Estuary Risk Indicator Ratings������������������������������������������������������������������������������������������������������������������������������������������������������ 4
3. Methods���������������������������������������������������������������������������������������������������������������������������������������������������������������������������������������������� 5
4. Results and Discussion ������������������������������������������������������������������������������������������������������������������������������������������������������������������ 7
5. Summary and Conclusions ��������������������������������������������������������������������������������������������������������������������������������������������������������� 22
6. Monitoring and Management���������������������������������������������������������������������������������������������������������������������������������������������������� 23
7. Acknowledgements ���������������������������������������������������������������������������������������������������������������������������������������������������������������������� 23
8. References���������������������������������������������������������������������������������������������������������������������������������������������������������������������������������������� 24
Appendix 1. Details on Analytical Methods�������������������������������������������������������������������������������������������������������������������������������� 26
Appendix 2. 2014 Detailed Results������������������������������������������������������������������������������������������������������������������������������������������������ 26
Appendix 3. Infauna Characteristics��������������������������������������������������������������������������������������������������������������������������������������������� 31
Appendix 4. Estuary Condition Risk Ratings������������������������������������������������������������������������������������������������������������������������������ 38

                                                                                      List of Tables
Table 1.       Summary of the major environmental issues affecting most New Zealand estuaries. �������������������������������� 2
Table 2.       Summary of estuary condition risk indicator ratings used in the present report. ���������������������������������������� 4
Table 3.       Summary of physical, chemical and macrofauna results for 4 fine scale sites (2008-10 and 2015) ���������� 7
Table 4.       Summary of one way ANOVA (p=0.05) and Tukey post hoc tests for physical and chemical data ����������� 8
Table 5.       Combinations of factors with highest Spearman correlation coefficients (2008-10 and 2015). �������������� 16
Table 6.       Summary of one way ANOVA (p=0.05) and Tukey post hoc tests for macroinvertebrate data. �������������� 17
Table 7.       Summary of one way ANOVA (p=0.05) and Tukey post hoc tests for macroinvertebrate WEBI data����� 18
Table 8.       Species causing the greatest contribution to the difference between macroinvertebrates. ������������������ 19

                                                                                     List of Figures
Figure 1. Porirua Harbour showing the location of fine scale sites ������������������������������������������������������������������������������������������������6
Figure 2. Mean sediment mud content (±SE, n=3), Porirua Harbour. ������������������������������������������������������������������������������� 9
Figure 3. Mean apparent Redox Potential Discontinuity depth, (±SE, n=3), Porirua Harbour, �������������������������������� 10
Figure 4. Mean total organic carbon (±SE, n=3), Porirua Harbour������������������������������������������������������������������������������������� 11
Figure 5. Mean total nitrogen (±SE, n=3), Porirua Harbour. ������������������������������������������������������������������������������������������������ 11
Figure 6. Mean total phosphorus (±SE, n=3), Porirua Harbour. ���������������������������������������������������������������������������������������� 11
Figure 7. Mean sediment cadmium, chromium and copper concentrations (±SE, n=3), Porirua Harbour. �������� 12
Figure 8. Mean sediment nickel, lead and zinc concentrations (±SE, n=3), Porirua Harbour������������������������������������ 13
Figure 9. Principle coordinates analysis (PCO) ordination plots and vector overlays.������������������������������������������������ 15
Figure 10. Mean number of species, abundance per core, and Shannon diversity index (±SE, n=10). ���������������� 16
Figure 11. Mean abundance of major infauna groups (n=10), Porirua Harbour. ���������������������������������������������������������� 17
Figure 12. Benthic invertebrate WEBI mud/organic enrichment tolerance rating (±SE, n=10)��������������������������������� 19
Figure 13. Mud and organic enrichment sensitivity of macroinvertebrates, Porirua Harbour �������������������������������� 20
Figure 14. Mud and organic enrichment sensitivity of macroinvertebrates, Porirua Harbour �������������������������������� 21

                                                                                                                                                           Wriggle            coastalmanagement          v
All photos by Wriggle except where noted otherwise.
Wriggle coastalmanagement viP o r i rua H a rb o u r - E x ec u t i v e S u mm a ry
Porirua Harbour is an ~807ha, tidal lagoon estuary located near Porirua in the Greater Wellington region. It is part of
Greater Wellington Regional Council’s coastal State of the Environment (SOE) monitoring programme. This report sum-
marises the results of the fourth year of the fine scale monitoring (2015) at four sites within the estuary. The monitoring
results, risk indicator ratings, overall estuary condition, and monitoring and management recommendations are sum-
marised below.
Fine Scale Monitoring Results
• Sand dominated the sediments, and mud content was low-moderate.
• Sediment Oxygenation: Redox Potential Discontinuity was 1cm deep indicating moderate-poor oxygenation.
• The benthic invertebrate community mud and organic enrichment rating indicated a low risk of eutrophication and
mud impacts.
• The indicator of organic enrichment (Total Organic Carbon) was at low concentrations.
• Nutrient enrichment indicators (total nitrogen and phosphorus) were at low-moderate concentrations in all years.
• Heavy metals and arsenic were well below the ANZECC (2000) ISQG-Low trigger values (i.e. low toxicity).
• Macroalgal cover was elevated at most sites.
• Comparison of the macroinvertebrate results with environmental factors indicated that, although analyses of the fau-
nal results showed differences between the baseline 2008-2010 and the post baseline 2015 years at each of the four
sites, the environmental variables provided only a partial explanation for these differences, particularly at site Por A.
Mud and heavy metal concentrations were identified as moderately to highly correlated with the macrobenthic faunal
assemblages at sites Por B and Pau A, and to a lesser extent at Pau B.
Low Moderate Very High
RISK INDICATOR RATINGS (indicate risk of adverse ecological impacts) Very Low High Not measured
Porirua (Onepoto) Arm Pauatahanui Arm
Site Por A Railway Site Por B Polytech Site Pau A Boatshed Site Pau B Upper
2008 2009 2010 2015 2008 2009 2010 2015 2008 2009 2010 2015 2008 2009 2010 2015
Sediment Mud Content
aRPD (Sediment Oxygenation)
TOC (Total Organic Carbon)
Total Nitrogen
Total Phosphorus
Invertebrate Mud/Org Enrichment
Metals (Cd, Cu, Cr, Hg, Ni, Pb, Zn) & As
ESTUARY CONDITION and ISSUES
Overall, the first four years of fine scale monitoring show the dominant intertidal habitat (i.e. unvegetated tidal-flats) in
the Porirua Harbour is generally in “good” to “moderate” condition. In 2015, as in the 2008-2010 baseline years, the fine
scale intertidal sediments had low mud concentrations, low to moderate levels of organic enrichment, moderate sedi-
ment oxygenation, low levels of toxicity and a typical mixed tolerance macroinvertebrate community.
In terms of changes since 2010, the results showed the following;
• mud, nutrient and organic carbon concentrations were relatively stable
• heavy metals showed small increases at some sites and decreases at others
• significant small changes in the structure of the macroinvertebrate community
In terms of the condition of the harbour in relation to the key estuary ecological issues of sedimentation, eutrophication,
toxicity and habitat modification, the findings of this report need to be viewed in conjunction with other relevant moni-
toring reports.
RECOMMENDED MONITORING AND MANAGEMENT
Because Porirua Harbour is large, has high ecological and human use values, and is very vulnerable to excessive sedimen-
tation, eutrophication and disease risk, this estuary has been identified by GWRC as a priority for monitoring. Baseline
fine scale intertidal conditions were established from 2008-2010, and one year of post baseline sampling has been com-
pleted (2015). It is recommended that the next fine scale monitoring of intertidal sites be undertaken at the scheduled 5
yearly monitoring interval (i.e. 2020).
Fine scale monitoring, in conjunction with sedimentation and broad scale monitoring, provides valuable information on
current estuary condition and trends over time, particularly in relation to the widely acknowledged sedimentation issue
in the estuary, and the potential for eutrophication and toxicity. Currently, the joint Wellington Councils have adopted
long term sediment reduction targets for the Harbour and GWRC is currently undertaking a range of investigations in the
Harbour catchment focussing on sediment mitigation and potential nutrient sources.
Wriggle coastalmanagement viiWriggle coastalmanagement viii
1. Introduction
Overview   Developing an understanding of the condition and risks to coastal and estuarine habitats
           is critical to the management of biological resources. In 2007 Greater Wellington Regional
           Council (GWRC) identified a number of estuaries in its region as immediate priorities for long
           term monitoring and in late 2007 began the monitoring programme in a staged manner. The
           estuaries currently included in the programme are; Porirua Harbour [Onepoto (Porirua) and
           Pauatahanui Arms], Whareama Estuary, Lake Onoke, Hutt Estuary and Waikanae Estuary. Risk
           assessments have been undertaken for a number of other estuaries in order to establish priori-
           ties for their management.
           Monitoring of Porirua Harbour began in 2004, with the first year of fine scale baseline moni-
           toring undertaken in January 2008. The estuary monitoring process consists of three compo-
           nents developed from the National Estuary Monitoring Protocol (NEMP) (Robertson et al. 2002)
           as follows:
           1. Ecological Vulnerability Assessment (EVA) of estuaries in the region to major issues
               (see Table 1) and appropriate monitoring design. This component has been completed for
               Porirua Harbour and is reported on in Robertson and Stevens (2007).
           2. Broad Scale Habitat Mapping (NEMP approach). This component (see Table 1) docu-
               ments the key habitats within the estuary, and changes to these habitats over time. Broad
               scale intertidal mapping of Porirua Harbour was undertaken in 2008 and 2013 (Stevens and
               Robertson 2008, 2013) and subtidal mapping in 2014 (Stevens and Robertson 2014). Since
               2008, annual mapping of macroalgal cover has also been undertaken (see Stevens and
               Robertson 2015).
           3. Fine Scale Monitoring (NEMP approach). Monitoring of physical, chemical and biologi-
               cal indicators (see Table 1). This component, which provides detailed information on the
               condition of Porirua Harbour, was undertaken in 2008, 2009 and 2010 to establish a base-
               line (Robertson and Stevens, 2008, 2009 and 2010). The first year of impact monitoring was
               undertaken in January 2015 and is the subject of this report. Sedimentation rates in the
               estuary have been monitored annually in the Harbour since 2008 (see Stevens and Robert-
               son 2015, Figure 1).
           To help evaluate overall estuary condition and decide on appropriate monitoring and man-
           agement actions, a series of condition ratings have also been developed and are described in
           Section 2. The current report describes the 2015 fine scale results and compares them to the
           previous findings.
           Porirua Harbour, is a large (807ha), well flushed “tidal lagoon” type estuary fed by a number of small
           streams. It comprises two arms, each a relatively simple shape, Onepoto (283ha) and Pauatahanui
           (524ha). The arms are connected by a narrow channel at Paremata, and the estuary discharges to the sea
           via a narrow entrance west of Plimmerton. Residence time in the estuary is less than 3 days, however,
           compared to the majority of NZ’s tidal lagoon estuaries which tend to drain almost completely at low
           tide, the harbour has a large subtidal component (65%).
           The estuary is relatively shallow (mean depth ~1m), and the large intertidal area (287ha, 35% of the estu-
           ary) supports extensive areas (59ha) of seagrass growing in firm mud/sand and shellfish. The estuary
           has high ecological values and high human use, and provides a natural focal point for the thousands of
           people that live near or visit its shores.
           The harbour has been extensively modified over the years (see following page), particularly the Onepoto
           Arm where almost all of the historical shoreline and saltmarsh have been reclaimed and most of the arm
           is now lined with steep straight rockwalls flanked by road and rail corridors. The Pauatahanui Arm is less
           modified (although most of the arm’s margins are also encircled by roads), with extensive areas of salt-
           marsh remaining in the north and east, a large percentage of which have been improved through local
           community efforts.
           Catchment land use in the Onepoto Arm is dominated by urban (residential and commercial) cover. In
           the steeper Pauatahanui Arm catchment, grazing dominates although urban (residential) development is
           significant in some areas. A recent report (Gibb and Cox 2009) identifies sedimentation as a major prob-
           lem in the estuary and indicates that both estuary arms are highly likely to rapidly infill and change from
           tidal estuaries to brackish swamps within 145-195 years. The dominant sources contributing to increas-
           ing sedimentation rates in the estuary were identified as discharges of both bedload and suspended
           load from the various input streams. Elevated nutrient inputs are also causing moderate eutrophication
           symptoms (i.e. poor sediment oxygenation and moderate nuisance macroalgal cover) in the estuary.

                                                                                        Wriggle     coastalmanagement   1
Table 1. Summary of the major environmental issues affecting most New Zealand estuaries. 1. Sedimentation Because estuaries are a sink for sediments, their natural cycle is to slowly infill with fine muds and clays (Black et al. 2013). Prior to European set- tlement they were dominated by sandy sediments and had low sedimentation rates (
Table 1. Summary of major environmental issues affecting New Zealand estuaries (Continued).

3. Disease Risk
  Runoff from farmland and human wastewater often carries a variety of disease-causing organisms or pathogens (including viruses, bacteria and
  protozoans) that, once discharged into the estuarine environment, can survive for some time (e.g. Stewart et al. 2008). Every time humans come
  into contact with seawater that has been contaminated with human and animal faeces, we expose ourselves to these organisms and risk getting
  sick. Human diseases linked to such organisms include gastroenteritis, salmonellosis and hepatitis A (Wade et al. 2003). Aside from serious health
  risks posed to humans through recreational contact and shellfish consumption, pathogen contamination can also cause economic losses due to
  closed commercial shellfish beds.
  Recommended Key Indicators:
    Issue             Recommended Indicators                 Method
    Disease Risk      Shellfish and Bathing Water faecal     Bathing water and shellfish disease risk monitoring (Council or industry driven).
                      coliforms, viruses, protozoa etc.

4. Toxic Contamination
  In the last 60 years, NZ has seen a huge range of synthetic chemicals introduced to the coastal environment through urban and agricultural storm-
  water runoff, groundwater contamination, industrial discharges, oil spills, antifouling agents, leaching from boat hulls, and air pollution. Many
  of them are toxic even in minute concentrations, and of particular concern are polycyclic aromatic hydrocarbons (PAHs), heavy metals, polychlo-
  rinated biphenyls (PCBs), endocrine disrupting compounds, and pesticides. When they enter estuaries these chemicals collect in sediments and
  bio-accumulate in fish and shellfish, causing health risks to marine life and humans. In addition, natural toxins can be released by macroalgae and
  phytoplankton, often causing mass closures of shellfish beds, potentially hindering the supply of food resources, as well as introducing economic
  implications for people depending on various shellfish stocks for their income. For example, in 1993, a nationwide closure of shellfish harvesting
  was instigated in NZ after 180 cases of human illness following the consumption of various shellfish contaminated by a toxic dinoflagellate, which
  also lead to wide-spread fish and shellfish deaths (de Salas et al. 2005). Decay of organic matter in estuaries (e.g. macroalgal blooms) can also cause
  the production of sulphides and ammonia at concentrations exceeding ecotoxicity thresholds.
   Recommended Key Indicators:
    Issue             Recommended Indicators                 Method
    Toxins            Sediment Contaminants                  Chemical analysis of heavy metals (total recoverable cadmium, chromium, copper, nickel, lead and
                                                             zinc) and any other suspected contaminants in sediment samples.
                      Biota Contaminants                     Chemical analysis of suspected contaminants in body of at-risk biota (e.g. fish, shellfish).
                      Biodiversity of Bottom Dwelling        Type and number of animals living in the upper 15cm of sediments (infauna in 0.0133m2 replicate
                      Animals                                cores), and on the sediment surface (epifauna in 0.25m2 replicate quadrats).

5. Habitat Loss
  Estuaries have many different types of high value habitats including shellfish beds, seagrass meadows, saltmarshes (rushlands, herbfields,
  reedlands etc.), tidal flats, forested wetlands, beaches, river deltas, and rocky shores. The continued health and biodiversity of estuarine systems
  depends on the maintenance of high-quality habitat. Loss of such habitat negatively affects fisheries, animal populations, filtering of water pollut-
  ants, and the ability of shorelines to resist storm-related erosion. Within New Zealand, habitat degradation or loss is common-place with the major
  causes being sea level rise, population pressures on margins, dredging, drainage, reclamation, pest and weed invasion, reduced flows (damming
  and irrigation), over-fishing, polluted runoff, and wastewater discharges (IPCC 2007 and 2013, Kennish 2002).
  Recommended Key Indicators:
    Issue             Recommended Indicators                 Method
    Habitat Loss      Saltmarsh Area                         Broad scale mapping - estimates the area and change in saltmarsh habitat over time.
                      Seagrass Area                          Broad scale mapping - estimates the area and change in seagrass habitat over time.
                      Vegetated Terrestrial Buffer           Broad scale mapping - estimates the area and change in buffer habitat over time.
                      Shellfish Area                         Broad scale mapping - estimates the area and change in shellfish habitat over time.
                      Unvegetated Habitat Area               Broad scale mapping - estimates the area and change in unvegetated habitat over time, broken
                                                             down into the different substrate types.
                      Sea level                              Measure sea level change.
                      Others e.g. Freshwater Inflows, Fish   Various survey types.
                      Surveys, Floodgates, Wastewater
                      Discharges

                                                                                                                            Wriggle         coastalmanagement   3
2 . E s t ua ry r i s k I n d i c ato r r at i n gs
The estuary monitoring approach used by Wriggle has been established to provide a
defensible, cost-effective way to help quickly identify the likely presence of the pre-
dominant issues affecting NZ estuaries (i.e. eutrophication, sedimentation, disease
risk, toxicity, and habitat change; Table 1), and to assess changes in the long term
condition of estuarine systems. The design is based on the use of primary indicators
that have a documented strong relationship with water or sediment quality.
In order to facilitate this assessment process, “risk indicator ratings” have also been
proposed that assign a relative level of risk (e.g. very low, low, moderate, high, very
high) of specific indicators adversely affecting intertidal estuary condition (see Table
2 below). Each risk indicator rating is designed to be used in combination with
relevant information and other risk indicator ratings, and under expert guidance,
to assess overall estuarine condition in relation to key issues, and make monitoring
and management recommendations. When interpreting risk indicator results we
emphasise:
• The importance of taking into account other relevant information and/or indicator results before making
management decisions regarding the presence or significance of any estuary issue.
• That rating and ranking systems can easily mask or oversimplify results. For instance, large changes can
occur within the same risk category, but small changes near the edge of one risk category may shift the
rating to the next risk level.
• Most issues will have a mix of primary and secondary ratings, primary ratings being given more weight in
assessing the significance of indicator results. It is noted that many secondary estuary indicators will be
monitored under other programmes and can be used if primary indicators reflect a significant risk exists, or
if risk profiles have changed over time.
• Ratings have been established in many cases using statistical measures based on NZ estuary data. Howev-
er, where such data is lacking, or has yet to be processed, ratings have been established using professional
judgement, based on our experience from monitoring numerous NZ estuaries. Our hope is that where a
high level of risk is identified, the following steps are taken:
1. Statistical measures be used to refine indicator ratings where information is lacking.
2. Issues identified as having a high likelihood of causing a significant change in ecological condition
(either positive or negative), trigger intensive, targeted investigations to appropriately characterise
the extent of the issue.
3. The outputs stimulate discussion regarding what an acceptable level of risk is, and how it should best
be managed.
The indicators and interim risk ratings used for the Porirua Harbour fine scale
monitoring programme are summarised in Table 2, and detailed background notes
explaining the use and justifications for each indicator are presented in Appendix
4. The basis underpinning most of the ratings is the observed correlation between
an indicator and the presence of degraded estuary conditions from a range of tidal
lagoon estuaries throughout NZ. Work to refine and document these relationships is
ongoing.
Table 2. Summary of estuary condition risk indicator ratings used in the present report.
RISK RATING
INDICATOR
Very Low Low Moderate High Very High
Apparent Redox Potential >10cm depth below 3-10cm depth below 1-25%
0-1.0 >1.0-2.5 >2.5-4.0 >4.0
Macroinvertebrate Enrichment None to minor stress Minor to moderate Moderate to high Persistent, high stress on benthic fauna.
Index (WEBI) on benthic fauna. stress on fauna. stress on fauna.
Total Organic Carbon (TOC) 500-1000mg/kg >1000mg/kg
0.2 x ISQG Low to >0.5 x ISQG Low to >ISQG Low to
Metals ISQG High
0.5 x ISQG Low ISQG Low ISQG High
Wriggle coastalmanagement 43. Methods
Fine scale monitoring
Fine scale monitoring is based on the methods described in the National Estuary Monitoring Protocol
(NEMP; Robertson et al. 2002) and provides detailed information on indicators of chemical and biologi-
cal condition of the dominant habitat type in the estuary. This is most commonly unvegetated intertidal
mudflats at low-mid water (avoiding areas of significant vegetation and channels). Using the outputs of the
broad scale habitat mapping, representative sampling sites (usually two per estuary, but varies with estuary
size) are selected and samples collected and analysed for the following variables.
• Salinity, Oxygenation (apparent Redox Potential Discontinuity - aRPD), Grain size (% mud, sand, gravel).
• Organic Matter and Nutrients: Total organic carbon (TOC), Total nitrogen (TN), Total phosphorus (TP).
• Heavy metals and metalloids: Cadmium (Cd), Chromium (Cr), Copper (Cu), Lead (Pb), Nickel (Ni), and Zinc (Zn) plus mercury (Hg) and
arsenic (As).
• Macroinvertebrate abundance and diversity (infauna and epifauna).
• Other potentially toxic contaminants: these are measured in certain estuaries where a risk has been identified.
For the Porirua Harbour, four fine scale sampling sites (Figure 1), were selected in unvegetated, mid-low wa-
ter habitat of the dominant substrate type (avoiding areas of significant vegetation and channels). At each
site, a 60m x 30m area in the lower intertidal was marked out and divided into 12 equal sized plots. Within
each area, ten plots were selected, a random position defined within each, and the following sampling
undertaken:
Physical and chemical analyses.
• Within each plot, one random core was collected to a depth of at least 100mm and photographed
alongside a ruler and a corresponding label. Colour and texture were described and average apparent
Redox Potential Discontinuity depth recorded.
• At each site, three samples (two a composite from four plots and one a composite from two plots) of the
top 20mm of sediment (each approx. 250gms) were collected adjacent to each core. All samples were
kept in a chilly bin in the field.
• Chilled samples were sent to R.J. Hill Laboratories for analysis of the following (details of lab methods
and detection limits in Appendix 1):
* Grain size/Particle size distribution (% mud, sand, gravel).
* Nutrients - total nitrogen (TN), total phosphorus (TP), and total organic carbon (TOC).
* Trace metals (Cd, Cr, Cu, Ni, Pb, Zn, Hg), arsenic. Analyses were based on whole sample fractions which
are not normalised to allow direct comparison with the Australian and New Zealand Guidelines for
Fresh and Marine Water Quality (ANZECC 2000).
• Samples were tracked using standard Chain of Custody forms and results were checked and transferred
electronically to avoid transcription errors.
• Photographs were taken to record the general site appearance.
• Salinity of the overlying water was measured at low tide.
Epifauna (surface-dwelling animals).
Visually conspicuous epifauna were assessed from one random 0.25m2 quadrat within each of ten plots. All
animals observed on the sediment surface were identified and counted, and any visible microalgal mat de-
velopment or macroalgal growth noted. The species, abundance and related descriptive information were
recorded on specifically designed waterproof field sheets containing a checklist of expected species.
Infauna (animals within sediments).
• One randomly placed sediment core (130mm diameter (area = 0.0133m2 ) PVC tube) was taken from each of ten
plots.
• The core tube was manually driven 150mm into the sediments, removed with the core intact and inverted into a
labelled plastic bag.
• Once all replicates had been collected at a site, the plastic bags were transported to a nearby source of seawater
and the contents of the core were washed through a 0.5mm nylon mesh bag. The infauna remaining were care-
fully emptied into a plastic container with a waterproof label and preserved in 70% isopropyl alcohol - seawater
solution.
• The samples were then transported to a commercial laboratory for counting and identification (Gary Stephen-
son, Coastal Marine Ecology Consultants, Appendix 1).
Wriggle coastalmanagement 52 . Me tho d s (Co nt i nued )
Inter- Sub- Monitoring Year
tidal tidal Type Established
- Fine Scale 2008, 2004
Sediment 2008 Kakaho
- Sediment 2012
Sediment 2013 7
S1
Horokiri
Pauatahanui
6 8
5 S2
Paua A Paua B
Mana 9
S5
S4 S3 10
1 Ivey 11
Browns
Railway Bay Bay Bradeys Duck
Te Onepoto Por A Bay Creek
Por C
Onepoto 4 S9
S7 Papakowhai
S6
Titahi
Onepoto
S8
2
3
Aotea
Polytech
Por B
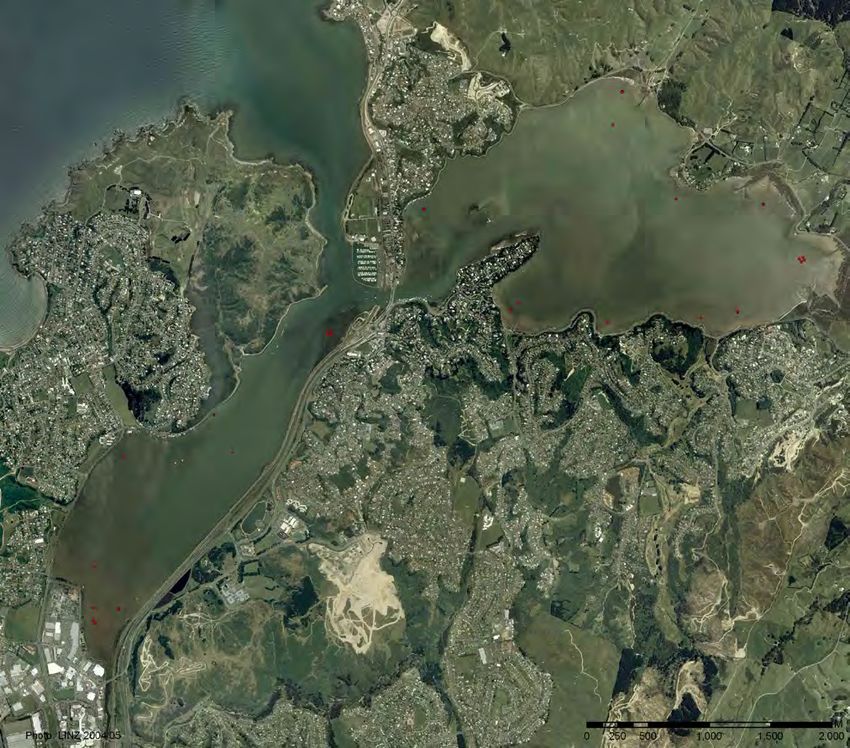
Figure 1. Porirua Harbour showing the location of fine scale sites and buried sediment plates established in
2007/8, 2012, and 2013.
Pauatahanui Inlet - View across Mana intertidal flats to Ivey Bay.
Wriggle coastalmanagement 64 . R es u lt s a n d D i sc u ss i o n
A summary of the results of the 20-21 January 2015 fine scale intertidal monitoring of Porirua Harbour,
together with the 2008-10 results, is presented in Table 3, with detailed results in Appendices 2 and 3. Analy-
sis and discussion of the results is presented as two main steps; firstly, exploring the primary environmental
variables that are most likely to be driving the ecological response in relation to the key issues of sedimentation,
eutrophication, and toxicity, and secondly, investigating the biological response using the macroinvertebrate
community.
Table 3. Summary of physical, chemicala and macrofauna results (means) for 4 fine scale sites (2008-10 and
2015) in Porirua Harbour.
Site Reps RPD Salinity TOC Mud Sand Gravel Cd Cr Cu Ni Pb Zn TN TP Abundance No. of Species
cm ppt % mg/kg No./m 2
No./core
Por A 3 2-3 30 1.33 9.96 88.13 1.90 0.028 11.3 5.1 6.1 8.4 39.4 685 442 9833 20.5
Por B 3 5 27 0.60 4.03 94.42 1.57 0.041 5.1 3.6 9.5 3.6 59.9 504 158 10410 17.7
2008
Pau A 3 4 30 1.32 12.23 81.60 6.20 0.029 10.7 4.9 6.5 8.8 36.7 823 447 8175 18.8
Pau B 3 3 30 0.58 4.50 90.17 5.33 0.020 4.7 2.3 4.7 3.9 23.0 546 150 9405 21.6
Por A 3 2-3 30 0.39 9.23 89.30 1.47 0.034 12.3 5.0 8.5 6.7 41.0 643 397 10103 22.1
Por B 3 2 28 0.21 5.73 85.80 8.43 0.046 5.6 3.9 3.7 8.9 57.74 . Resu lt s and D i s c u s s i on (Cont i nued )
Table 4. Summary of one way ANOVA (p=0.05) and Tukey post hoc tests for physical and chemical data
for 4 fine scale sites (2008-10 and 2015) in Porirua Harbour.
ANOVA F and P value. Post hoc test (Tukey P=0.05).
Is there a significant difference Is there a significant difference between 2015 data and all of the baseline years
Site Variable
between at least two of the 2008-2010? Also is 2015 data outside of the baseline data range?
years means? (p=0.05)
TOC F = 111.5, P < 0.001. Significant Significant, but still within the range of baseline data.
Mud F = 3.75, P = 0.019. Significant Not Significant
Cadmium F =7.25, P = 0.001. Significant Not Significant
Chromium F =5.42, P = 0.004. Significant Not Significant
Copper F =76.98, P < 0.001. Significant Significant, but still within the range of baseline data.
Por A Nickel F =75.337, P < 0.001. Significant Significant, but still within the range of baseline data.
Lead F =10.34, P < 0.001. Significant Not Significant
Zinc F =37.96, P < 0.001. Significant Significant, but still within the range of baseline data.
RPD F = 63.85, P < 0.001. Significant Significant.
TN F =1 3.77, P < 0.001. Significant Not Significant
TP F = 13.50, P < 0.001. Significant Not Significant
TOC F = 88.79, P < 0.001. Significant Not Significant
Mud F = 22.02, P < 0.001. Significant Not Significant
Cadmium F = 147.96, P < 0.001. Significant Not Significant
Chromium F =3 0.94, P < 0.001. Significant Significant (small increase)
Copper F = 119.09, P < 0.001. Significant Not Significant
Por B Nickel F = 28.56, P < 0.001. Significant Significant (small increase)
Lead F = 79.73, P < 0.001. Significant Not Significant
Zinc F = 1018.58, P < 0.001. Significant Significant (small increase)
RPD F = 193.89, P < 0.001. Significant Not Significant
TN F =10.42, P < 0.001. Significant Not Significant
TP F = 63.51, P < 0.001. Significant Significant (small increase)
TOC F = 978.53, P < 0.001. Significant Significant, but still within the range of baseline data.
Mud F = 29.10, P < 0.001. Significant Not Significant
Cadmium F =86.86, P < 0.001. Significant Significant (small decrease)
Chromium F = 35.84, P < 0.001. Significant Not Significant
Copper F = 4.14, P = 0.013. Significant Not Significant
Pau A Nickel F = 48.01, P < 0.001. Significant Significant, but still within the range of baseline data.
Lead F = 0.613, P = 0.611. Not Significant Not Significant
Zinc F = 26.58, P < 0.001. Significant Not Significant
RPD F = 154.8, P < 0.001. Significant Not Significant
TN F =35.13, P < 0.001. Significant Not Significant
TP F = 35.90, P < 0.001. Significant Not Significant
TOC F = 35.33, P < 0.001. Significant Not Significant
Mud F = 42.32, P < 0.001. Significant Not Significant
Cadmium F = 184.11, P < 0.001. Significant Not Significant
Chromium F = 88.05, P < 0.001. Significant Not Significant
Copper F = 25.47, P < 0.001. Significant Not Significant
Pau B Nickel F = 65.32, P < 0.001. Significant Significant, but still within the range of baseline data.
Lead F = 474.95, P < 0.001. Significant Not Significant
Zinc F = 753.69, P < 0.001. Significant Not Significant
RPD F = 106.8, P < 0.001. Significant Not Significant
TN F = 13.82, P < 0.001. Significant Not Significant
TP F = 14.85, P < 0.001. Significant Not Significant
Wriggle coastalmanagement 84 . Resu lt s and D i s c u s s i on (Cont i nued )
SEDIMENT INDICATORS
Sediment Mud Content
Sediment mud content (i.e. % grain size 25% mud) in the primary sediment settlement areas e.g. where salinity driven flocculation occurs, or
in areas that experience low energy tidal currents and waves (i.e. upper estuary intertidal margins and deeper
subtidal basins). Well flushed channels or intertidal flats exposed to regular wind-wave disturbance generally
have sandy sediments with a relatively low mud content (e.g. 2-10% mud).
The 2015 monitoring results for sediment mud content (Table 3, Figure 2) were at relatively low levels (3.3 to
9.2% mud). The data for all years (i.e. 2008-10 and 2015) showed that mean mud content differed between at
least two years at all sites (Table 4 ANOVA results), but the Tukey post-hoc test (p=0.05) indicated no significant
difference between the “post baseline” 2015 data and all of the “baseline” 2008-10 data. These results indicate
no significantly increased muddiness at the fine scale sites and, as such, adverse impacts to benthic macroinver-
tebrates from increased muddiness are unlikely.
Por Site A Por Site B Paua Site A Paua Site B
35 Very High
High
Moderate
30
Low
Sediment mud content (%)
Very Low
25
20
15
10
5
0
2008 2009 2010 2015 2008 2009 2010 2015 2008 2009 2010 2015 2008 2009 2010 2015
Figure 2. Mean sediment mud content (±SE, n=3), Porirua Harbour, 2008, 2009, 2010 and 2015.
Eutrophication INDICATORS
The primary variables indicating eutrophication impacts are sediment mud content, aRPD depth, sediment or-
ganic matter, nitrogen and phosphorus concentrations, and macroalgal cover. The former are discussed below,
with macroalgal cover assessed previously in the broad scale report (see Stevens and Robertson 2014).
Sediment Grain Size (% Mud)
This indicator has been discussed in the sediment section above and is not repeated here. However, in rela-
tion to eutrophication, the low mud contents at all sites indicate sediment oxygenation is likely to be relatively
good.
Apparent Redox Potential Discontinuity (aRPD)
The depth of the aRPD boundary indicates the extent of oxygenation within sediments. Figure 3 shows the
aRPD depths for the four Porirua sampling sites. In 2015, the aRPD depth was shallow (1cm) at all sites, indicat-
ing a “high” risk of ecological impacts. The data for all years (i.e. 2008-10 and 2015) showed that aRPD differed
between at least two years for all sites (Table 4 ANOVA results), but the Tukey post-hoc test (p=0.05) indicated
no significant difference between the “post baseline” 2015 data and all of the “baseline” 2008-2010 data, except
for site Por A. However, these results must be considered as very preliminary in nature given the semi-quantita-
tive nature of the method. In future, it is envisaged that more quantitative assessments of sediment oxygena-
tion in relation to ecological change will be undertaken using more robust indicators (e.g. redox potential, pres-
ence of sulphides and bacterial status). Currently, this data is being collected, and assessed for use in estuary
long term monitoring programmes, as part of a GWRC and Wriggle funded PhD at Otago University.
Wriggle coastalmanagement 94 . Resu lt s and D i s c u s s i on (Cont i nued )
Por Site A Por Site B Paua Site A Paua Site B
14 Very High
High
12 Moderate
Depth of Apparent RPD (cm)
Low
Very Low
10
8
6
4
2
0
2008 2009 2010 2015 2008 2009 2010 2015 2008 2009 2010 2015 2008 2009 2010 2015
Figure 3. Mean apparent Redox Potential Discontinuity (aRPD) depth, (±SE, n=3), Porirua Harbour, 2008,
2009, 2010 and 2015.
Total Organic Carbon and Nutrients
The concentrations of sediment organic matter (TOC) and nutrients (TN and TP) provide valuable trophic state
information. In particular, if concentrations are elevated, and eutrophication symptoms are present (i.e. shallow
aRPD, excessive algal growth, high WEBI biotic coefficient (see the following macroinvertebrate condition sec-
tion), then TN, TP and TOC concentrations provide a good indication that loadings are exceeding the assimila-
tive capacity of the estuary. However, a low TOC, TN, or TP concentration does not in itself indicate an absence
of eutrophication symptoms. It may be that the estuary, or part of an estuary, may have reached a eutrophic
condition and simply exhausted the available nutrient supply. Obviously, the latter case is likely to better re-
spond to input load reduction than the former.
The 2008-2015 results showed TOC (4 . Resu lt s and D i s c u s s i on (Cont i nued )
Por Site A Por Site B Pau Site A Pau Site B
6 Very High
High
Moderate
Total Organic Carbon (%) 5 Low
Very Low
4
3
2
1
0
2008 2009 2010 2015 2008 2009 2010 2015 2008 2009 2010 2015 2008 2009 2010 2015
Figure 4. Mean total organic carbon (±SE, n=3), Porirua Harbour, 2008, 2009, 2010 and 2015.
Por Site A Por Site B Pau Site A Pau Site B
6000 Very High
High
Moderate
5000 Low
Very Low
Total Nitrogen (mg/kg)
4000
3000
2000
1000
0
2008 2009 2010 2015 2008 2009 2010 2015 2008 2009 2010 2015 2008 2009 2010 2015
Figure 5. Mean total nitrogen (±SE, n=3), Porirua Harbour, 2008, 2009, 2010 and 2015.
Por Site A Por Site B Pau Site A Pau Site B
2000 Very High
High
Moderate
Low
1600
Total Phosphorus (mg/kg)
Very Low
1200
800
400
0
2008 2009 2010 2015 2008 2009 2010 2015 2008 2009 2010 2015 2008 2009 2010 2015
Figure 6. Mean total phosphorus (±SE, n=3), Porirua Harbour, 2008, 2009, 2010 and 2015.
Wriggle coastalmanagement 114 . Resu lt s and D i s c u s s i on (Cont i nued )
Por Site A Por Site B Pau Site A Pau Site B
1.8 High
Moderate
1.6 Low
ANZECC ISQG Low Trigger Guideline Very Low
1.4
1.2
Cadmium (mg/kg)
1.0
0.8
0.6
0.4
0.2
0.0
2008 2009 2010 2015 2008 2009 2010 2015 2008 2009 2010 2015 2008 2009 2010 2015
Por Site A Por Site B Pau Site A Pau Site B
100 High
Moderate
Low
80 ANZECC ISQG Low Trigger Guideline
Very Low
Chromium (mg/kg)
60
40
20
0
2008 2009 2010 2015 2008 2009 2010 2015 2008 2009 2010 2015 2008 2009 2010 2015
Por Site A Por Site B Pau Site A Pau Site B
80 High
Moderate
Low
Very Low
ANZECC ISQG Low Trigger Guideline
60
Copper (mg/kg)
40
20
0
2008 2009 2010 2015 2008 2009 2010 2015 2008 2009 2010 2015 2008 2009 2010 2015
Figure 7. Mean sediment cadmium, chromium and copper concentrations (±SE, n=3), Porirua Harbour, 2008,
2009, 2010 and 2015.
Wriggle coastalmanagement 124 . Resu lt s and D i s c u s s i on (Cont i nued )
Por Site A Por Site B Pau Site A Pau Site B
40 High
Moderate
Low
Very Low
30
Nickel (mg/kg)
20 ANZECC ISQG Low Trigger Guideline
10
0
2008 2009 2010 2015 2008 2009 2010 2015 2008 2009 2010 2015 2008 2009 2010 2015
Por Site A Por Site B Pau Site A Pau Site B
60 High
Moderate
Low
50 ANZECC ISQG Low Trigger Guideline Very Low
40
Lead (mg/kg)
30
20
10
0
2008 2009 2010 2015 2008 2009 2010 2015 2008 2009 2010 2015 2008 2009 2010 2015
Por Site A Por Site B Pau Site A Pau Site B
250 High
Moderate
Low
200 ANZECC ISQG Low Trigger Guideline
Very Low
150
Zinc (mg/kg)
100
50
0
2008 2009 2010 2015 2008 2009 2010 2015 2008 2009 2010 2015 2008 2009 2010 2015
Figure 8. Mean sediment nickel, lead and zinc concentrations (±SE, n=3), Porirua Harbour, 2008, 2009, 2010
and 2015.
Wriggle coastalmanagement 134 . Resu lt s and D i s c u s s i on (Cont i nued )
Benthic Macroinvertebrate Community
Benthic macroinvertebrate communities are considered good indicators of ecosystem health in shallow estuaries be-
cause of their strong primary linkage to sediments and, secondary linkage to the water column (Dauer et al. 2000, Thrush
et al. 2003, Warwick and Pearson 1987, Robertson et al. 2015 in press). Because they integrate recent pollution history in
the sediment, macroinvertebrate communities are therefore very effective in showing the combined effects of pollutants
or stressors.
The response of macroinvertebrates to stressors in Porirua Harbour has been examined in four steps:
1. Ordination plots to enable an initial visual overview (in 2-dimensions) of the spatial and temporal structure of the macroinver-
tebrate community among fine scale sites sampled in 2008, 2009, 2010 and 2015.
2. The BIO-ENV program in the PRIMER (v.6) package was used to evaluate and compare the relative importance of different envi-
ronmental factors and their influence on the identified macrobenthic communities.
3. Assessment of species richness, abundance, diversity and major infauna groups.
4. Assessment of the response of the macroinvertebrate community to increasing mud and organic matter among fine scale
sites sampled in 2008, 2009, 2010 and 2015, based on identified tolerance thresholds for NZ taxa (Robertson 2013, Robertson
et al. 2015 in press).
Macroinvertebrate Community Ordination
Principle Coordinates Analysis (PCO), based on between-year species abundance data collected in 2008-10 and 2015,
showed that the invertebrate community at the four sites (Por A, Por B, Pau A and Pau B) in 2015 were significantly
different from 2008, 2009 and 2010 (i.e. PERMANOVA P4 . Resu lt s and D i s c u s s i on (Cont i nued )
40 40
Por A Key
Por B
2008
30 2009
30
2010 Cu
PCO2 (19% of total variation)
PCO2 (14% of total variation)
Zn Pb
20 2015 20 Ni Cr Cd
TOC
10 10
Pb Cu
0 Ni TOC 0
Cr
Mud
-10 Zn
-10 Key Mud
Cd 2008
2009
-20 -20
2010
2015
-30 -30
PERMANOVA: P = 0.0002) structural
changes over the sampling period 2008, 2009, 2010 and 2015.
The environmental vector overlays, based on Pearson correlations, show preliminary exploratory information on the strength of environmental relationships
with their length in relation to the circle boundary indicating the magnitude of the strength. In this case, the results indicate that the 2015 communities were
likely separated from the 2008-2010 at each of the sites by the following: Por A by factors other than those measured; Por B partially by increased metal concen-
trations; Pau B partially by decreased metal, TOC and mud concentrations and Pau B partially by decreased metal and mud concentrations.
Wriggle coastalmanagement 154 . Resu lt s and D i s c u s s i on (Cont i nued )
Table 5. Combinations of factors with highest Spearman correlation coefficients between mean faunal
and sediment similarity matrices (Primer’s BIOENV routine) for each of four Porirua harbour sites (2008-
10 and 2015).
Site Variables Best Combination 2nd Combination 3rd Combination 4th Combination 5th Combination
1 Cr 0.313 Cd 0.144 Cu 0.130
Por A
2 Cr, Zn 0.118 Cu, Ni 0.113 Cd, Pb 0.109 Cr, Cu 0.108 Cd, Cr 0.101
2 TOC, Ni 0.480 TOC, Zn 0.475
Por B 3 TOC, Ni, Zn 0.514 TOC, Cu, Ni 0.499 TOC, Cd, Ni 0.472 TOC, Ni, Pb 0.467
4 TOC, Cu, Ni, Zn 0.484 TOC, Cr, Ni, Zn 0.477 TOC, Cu, Ni, Pb 0.467
1 TOC 0.724
2 TOC, Cu 0.649 TOC, Pb 0.608 TOC, Ni 0.550 TOC, Cd 0.544
Pau A
3 TOC, Cu, Pb 0.613 TOC Cu, Ni 0.547
4 TOC, Cu, Ni, Pb 0.559 TOC, Mud, Cu, Pb 0.548
1 Mud 0.422
2 Mud, Cr 0.398 Mud, Pb 0.386 Mud, Zn 0.374 Mud, Ni 0.349
Pau B
3 Mud, Cr, Pb 0.371 Mud, Cr, Zn 0.358 Mud, Cr, Ni 0.353
4 Mud, Cr, Ni, Pb 0.344
Por A 2008
Por A 2009
Por A 2010
Por A 2015
Por B 2008
Por B 2009
Por B 2010
Por B 2015
Pau A 2008
Pau A 2009
Pau A 2010
Pau A 2015
Pau B 2008
Pau B 2009
Pau B 2010
Pau B 2015
0 10 20 30 40 50 0 50 100 150 200 250 300 0.0 0.5 1.0 1.5 2.0 2.5 3.0
Mean number of species (per core) Mean abundance (per core) Mean Shannon Wiener H (per core)
Figure 10. Mean number of species, abundance per core, and Shannon diversity index (±SE, n=10), Porirua Har-
bour, 2008, 2009, 2010 and 2015.
Wriggle coastalmanagement 164 . Resu lt s and D i s c u s s i on (Cont i nued )
Table 6. Summary of one way ANOVA (p=0.05) and Tukey post hoc tests for macroinvertebrate data for 4 fine
scale sites (2008-10 and 2015) in Porirua Harbour.
ANOVA F and P value. Post hoc test (Tukey P=0.05).
Is there a significant difference Is there a significant difference between 2015 data and all of the baseline
Site Variable
between at least two of the years 2008-2010? Also is 2015 data outside of the baseline data range?
years means? (p=0.05)
Mean No Species F = 9.28, P < 0.001. Significant Significant, decline in species number
Por A Mean Abundance F = 4.61, P = 0.008. Significant Significant, decline in species abundance
Shannon Wiener (H) F = 1.02, P = 0.394. Not Significant Not Significant
Mean No Species F = 11.85, P < 0.001. Significant Not Significant
Por B Mean Abundance F = 15.99, P < 0.001. Significant Significant, increase in species abundance
Shannon Wiener (H) F = 16.27, P < 0.001. Significant Not Significant
Mean No Species F = 5.56, P = 0.003. Significant Not Significant
Pau A Mean Abundance F = 4.63, P = 0.008. Significant Not Significant
Shannon Wiener (H) F = 4.62, P = 0.007. Significant Not Significant
Mean No Species F = 14.46, P < 0.001. Significant Not Significant
Pau B Mean Abundance F = 7.5, P = 0.001. Significant Not Significant
Shannon Wiener (H) F = 10.71, P < 0.001. Significant Not Significant
Por A 2008
Por A 2009
Por A 2010
Por A 2015
Por B 2008
Por B 2009
Por B 2010
Insecta
Por B 2015
Crustacea
Pau A 2008
Bivalvia
Pau A 2009 Gastropoda
Polyplacophora
Pau A 2010
Oligochatea
Pau A 2015 Polychaeta
Nematoda
Pau B 2008
Nemertea
Pau B 2009
Anthozoa
Pau B 2010 Porifera
Pau B 2015
0 50 100 150 200 250
Mean abundance (per core)
Figure 11. Mean abundance of major infauna groups (n=10), Porirua Harbour, 2008, 2009, 2010 and 2015.
Wriggle coastalmanagement 174 . Resu lt s and D i s c u s s i on (Cont i nued )
Macroinvertebrate Community in Relation to Mud and Organic Enrichment
Organic matter and mud are major determinants of the structure of the benthic invertebrate community. The
previous section has already established the following:
• For the two Pauatahanui Arm sites (Pau A and Pau B) there were no clear trends in the change in species
abundance, richness or diversity between the baseline years (2008-10) and post baseline 2015, despite
obvious differences between whole communities over this time.
• For the lower Porirua Arm site (Por A) there was a significant small decline in species richness and abun-
dance (but no significant change in species diversity) between the baseline years (2008-10) and post base-
line 2015, which may partially explain differences between whole communities over this time.
• For the upper Porirua Arm site (Por B) there was a significant small increase in species abundance (but no
significant change in species richness or diversity) between the baseline years (2008-10) and post baseline
2015, which may partially explain differences between whole communities over this time.
The following analyses explore the macrofaunal results in greater detail using two steps as follows:
1. Modified AMBI Mud and Organic Enrichment Index (WEBI)
The first approach is undertaken by using the WEBI mud/organic enrichment rating (Appendix 4), which is
basically the international AMBI approach (Borja at al. 2000) modified by using mud (and because of its co-
variation with mud, TOC) sensitivity ratings for NZ macrofauna (Robertson 2013, Robertson et al. 2015 in press).
The WEBI is clearly an improvement on the AMBI approach for NZ estuary macrofauna, but because it still
relies on the AMBI formula, which does not directly account for species richness and diversity (i.e. conditioned
on abundance only), its results must be considered alongside a range of other relevant indicators to ensure a
reliable conclusion is reached. Currently, PhD research is being undertaken by Ben Robertson at University of
Otago to develop a more robust NZ biotic index for addressing the primary issues of estuary sedimentation
and eutrophication, thereby improving robustness and cost effectiveness of long term estuary monitoring
programmes.
WEBI biotic coefficients, and mud and organic enrichment tolerance ratings, for the Porirua intertidal fine scale
sites are presented in Figure 12. Coefficients ranged from 0.8-2.4, and were all in the “low” to “low-moderate”
risk indicator category (i.e. a transitional type community indicative of low levels of organic enrichment and
low-moderate mud concentrations). The data for all years (i.e. 2008-10 and 2015) showed that the WEBI coef-
ficient significantly differed between at least two years for all sites (Table 7 ANOVA results), but the Tukey
post-hoc test (p=0.05) indicated no significant difference between the “post baseline” 2015 data and all of the
“baseline” 2008-10 data. These results indicate that the difference between the macroinvertebrate community
at each site in 2015, compared with the baseline years, was unlikely to be a result of changes in mud content or
organic enrichment.
The WEBI findings were therefore consistent with results showing significant differences in the macroinver-
tebrate community between post baseline and baseline years (PCO/PERMANOVA, P4 . Resu lt s and D i s c u s s i on (Cont i nued )
Por A Por B Pau A Pau B
7
High to Very High
6 Moderate to High
Low to Moderate
WEBI Biotic Coefficient 5
Low
4
3
2
1
0
2010
2010
2010
2009
2009
2009
2010
2008
2015
2008
2015
2008
2015
2009
2008
2015
Figure 12. Benthic invertebrate WEBI mud/organic enrichment tolerance rating (±SE, n=10), Porirua Harbour,
2008-10 and 2015.
2. Individual Species Changes
To further explore possible reasons for why the community analysis shows differences at each site between the
baseline and post baseline years, it is appropriate to look at changes in abundance of individual species over
time using:
• Univariate SIMPER (PRIMER-e) analysis (Table 8 and details in Appendix 2).
• Comparing direct plots of mean abundances of the 5 major mud/enrichment tolerance groupings (i.e. “very
sensitive to organic enrichment” group through to “1st-order opportunistic species“ group) (Figures 13 and 14).
The SIMPER analysis (summarised in Table 8) shows what taxa are causing the greatest contribution (including
the magnitude of each taxon - see Appendix 2 for details) to the difference between macroinvertebrate commu-
nity structure between baseline years 2008-10 and post baseline 2015 changes. The results indicate that a range
of taxa was responsible for the greatest differences, but perhaps the most significant point is that these changes
were generally relatively small (i.e.Por A Por B
2008 2009 2010 2015 2008 2009 2010 2015
Aonides trifida
Hesionidae sp. 1
Hesionidae sp. 2 I. Very sensitive to mud and organic enrichment I. Very sensitive to mud and organic enrichment
Microspio maori (initial state) (initial state)
Orbinia papillosa
Platynereis spp.
Polynoidae sp. 1
Sabellidae
Scoloplos cylindrifer
Spirobranchus cariniferus
Eatoniella olivacea
Haminoea zelandiae
Xymene plebeius
Zeacumantus subcarinatus
Amphipoda sp. 3
Colurostylis lemurum
Mysidacea
Ostracoda sp. 1
Ostracoda sp. 2
Ostracoda sp. 3
Taeniogyrus dendyi
Anthozoa sp. 1
Edwardsia sp.
Edwardsia sp. 1 2. Indifferent to mud and organic enichment 2. Indifferent to mud and organic enichment
Nematoda
Aglaophamus macroura
Armandia maculata
Axiothella serrata
Boccardia sp.
Boccardia acus
Boccardia syrtis
Dorvilleidae
Eteone platycephala
Glyceridae
Goniada sp.
Owenia petersenae
Perinereis vallata
Phyllodocidae sp. 2
Prionospio aucklandica
Syllidae
Syllidae sp. 2
Terebellidae
Diloma subrostrata
Notoacmea spp.
Zeacumantus lutulentus
Austrovenus stutchburyi
Cyclomactra ovata
Tellina liliana
Linucula hartvigiana
Paphies australis
Amphipoda sp. 4
Copepoda sp. 1
Copepoda sp. 2
Phoxocephalidae sp. 1
Phoxocephalidae sp. 2
Sphaeroma quoianum
Nemertea sp. 1
Nemertea sp. 2 3. Tolerant to excess mud and organic 3. Tolerant to excess mud and organic
Nemertea sp. 3 enrichment (slight unbalanced situations) enrichment (slight unbalanced situations)
Nemertea sp. 4
Cirratulidae
Heteromastus filiformis
Nereidae
Nicon aestuariensis
Paraonidae
Paraonidae sp. 1
Pectinaria australis
Oligochaeta
Cominella glandiformis
Potamopyrgus antipodarum
Potamopyrgus estuarinus
Halicarcinus varius
Halicarcinus whitei
Capitella sp. 1
Capitella capitata 4. Tolerant to mud and organic enrichment 4. Tolerant to mud and organic enrichment
Scolecolepides benhami (slight to pronounced unbalanced situations) (slight to pronounced unbalanced situations)
Arthritica bifurca
Amphipoda sp. 2
Paracorophium excavatum
Amphipoda sp. 1
Austrohelice crassa 5. Very tolerant to mud and organic enrichment 5. Very tolerant to mud and organic enrichment
Hemiplax hirtipes
Porifera sp. 1
Polychaeta sp. 1
Sabellariidae sp. 1
Travisia olens
Chiton _Chiton_ glaucus
Gastropoda sp. 3 Uncertain mud and organic enrichment Uncertain mud and organic enrichment
Coelotrochus tiaratus preference preference
Solemya parkinsonii
Cephalocarida sp. 1
Hemigrapsus crenulatus
Chironomidae
0 20 40 60 80 100 120 140 0 50 100 150 200 250
Mean abundance per core Mean abundance per core
Figure 13. Mud and organic enrichment sensitivity of macroinvertebrates, Porirua Harbour (Onepoto Arm),
2008, 2009, 2010 and 2015 (see Appendix 4 for sensitivity details).Pau A Pau B
2008 2009 2010 2015 2008 2009 2010 2015
Aonides trifida
Hesionidae sp. 1
Hesionidae sp. 2 I. Very sensitive to mud and organic enrichment I. Very sensitive to mud and organic enrichment
Microspio maori (initial state) (initial state)
Orbinia papillosa
Platynereis spp.
Polynoidae sp. 1
Sabellidae
Scoloplos cylindrifer
Spirobranchus cariniferus
Eatoniella olivacea
Haminoea zelandiae
Xymene plebeius
Zeacumantus subcarinatus
Amphipoda sp. 3
Colurostylis lemurum
Mysidacea
Ostracoda sp. 1
Ostracoda sp. 2
Ostracoda sp. 3
Taeniogyrus dendyi
Anthozoa sp. 1
Edwardsia sp.
Edwardsia sp. 1 2. Indifferent to mud and organic enichment 2. Indifferent to mud and organic enichment
Nematoda
Aglaophamus macroura
Armandia maculata
Axiothella serrata
Boccardia sp.
Boccardia acus
Boccardia syrtis
Dorvilleidae
Eteone platycephala
Glyceridae
Goniada sp.
Owenia petersenae
Perinereis vallata
Phyllodocidae sp. 2
Prionospio aucklandica
Syllidae
Syllidae sp. 2
Terebellidae
Diloma subrostrata
Notoacmea spp.
Zeacumantus lutulentus
Austrovenus stutchburyi
Cyclomactra ovata
Tellina liliana
Linucula hartvigiana
Paphies australis
Amphipoda sp. 4
Copepoda sp. 1
Copepoda sp. 2
Phoxocephalidae sp. 1
Phoxocephalidae sp. 2
Sphaeroma quoianum
Nemertea sp. 1
Nemertea sp. 2 3. Tolerant to excess mud and organic 3. Tolerant to excess mud and organic
Nemertea sp. 3 enrichment (slight unbalanced situations) enrichment (slight unbalanced situations)
Nemertea sp. 4
Cirratulidae
Heteromastus filiformis
Nereidae
Nicon aestuariensis
Paraonidae
Paraonidae sp. 1
Pectinaria australis
Oligochaeta
Cominella glandiformis
Potamopyrgus antipodarum
Potamopyrgus estuarinus
Halicarcinus varius
Halicarcinus whitei
Capitella sp. 1
Capitella capitata 4. Tolerant to mud and organic enrichment 4. Tolerant to mud and organic enrichment
Scolecolepides benhami (slight to pronounced unbalanced situations) (slight to pronounced unbalanced situations)
Arthritica bifurca
Amphipoda sp. 2
Paracorophium excavatum
Amphipoda sp. 1
Austrohelice crassa
5. Very tolerant to mud and organic enrichment 5. Very tolerant to mud and organic enrichment
Hemiplax hirtipes
Porifera sp. 1
Polychaeta sp. 1
Sabellariidae sp. 1
Travisia olens
Chiton _Chiton_ glaucus
Gastropoda sp. 3 Uncertain mud and organic enrichment Uncertain mud and organic enrichment
Coelotrochus tiaratus preference preference
Solemya parkinsonii
Cephalocarida sp. 1
Hemigrapsus crenulatus
Chironomidae
0 20 40 60 80 100 120 140 0 50 100 150 200 250
Mean abundance per core Mean abundance per core
Figure 14. Mud and organic enrichment sensitivity of macroinvertebrates, Porirua Harbour (Pauatahanui
Arm), 2008, 2009, 2010 and 2015 (see Appendix 4 for sensitivity details).You can also read