International Journal of Disaster Risk Reduction
←
→
Page content transcription
If your browser does not render page correctly, please read the page content below

International Journal of Disaster Risk Reduction 50 (2020) 101811
Contents lists available at ScienceDirect
International Journal of Disaster Risk Reduction
journal homepage: http://www.elsevier.com/locate/ijdrr
Emergency flood bulletins for Cyclones Idai and Kenneth: A critical
evaluation of the use of global flood forecasts for international
humanitarian preparedness and response
Rebecca Emerton a, b, *, Hannah Cloke c, d, e, Andrea Ficchi c, b, Laurence Hawker f, Sara de Wit g,
Linda Speight c, Christel Prudhomme b, h, i, Philip Rundell j, Rosalind West j, Jeffrey Neal f, k,
Joaquim Cuna l, Shaun Harrigan b, Helen Titley m, c, Linus Magnusson b, Florian Pappenberger b,
Nicholas Klingaman a, Elisabeth Stephens c
a
National Centre for Atmospheric Science, University of Reading, UK
b
European Centre for Medium-Range Weather Forecasts, Reading, UK
c
University of Reading, UK
d
Uppsala University, Sweden
e
Centre of Natural Hazards and Disaster Science, Sweden
f
University of Bristol, UK
g
University of Oxford, UK
h
University of Loughborough, UK
i
Centre for Ecology and Hydrology, Wallingford, UK
j
Department for International Development, UK
k
Fathom, Bristol, UK
l
Technical University of Mozambique, Maputo, Mozambique
m
Met Office, Exeter, UK
A R T I C L E I N F O A B S T R A C T
Keywords: Humanitarian disasters such as Typhoon Haiyan (SE Asia, 2013) and the Horn of Africa drought (2011–2012) are
Tropical cyclone examples of natural hazards that were predicted, but where forecasts were not sufficiently acted upon, leading to
Flood considerable loss of life. These events, alongside international adoption of the Sendai Framework for Disaster
Forecasts
Risk Reduction, have motivated efforts to enable early action from early warnings. Through initiatives such as
Bulletins
Early action
Forecast-based Financing (FbF) and the Science for Humanitarian Emergencies and Resilience (SHEAR) pro
gramme, progress is being made towards the use of science and forecasts to support international humanitarian
organisations and governments in taking early action and improving disaster resilience. However, many chal
lenges remain in using forecasts systematically for preparedness and response. The research community in place
through SHEAR enabled the UK government’s Department for International Development to task a collaborative
group of scientists to produce probabilistic real-time flood forecast and risk bulletins, aimed at humanitarian
decision-makers, for Cyclones Idai and Kenneth, which impacted Mozambique in 2019.
The process of bulletin creation during Idai and Kenneth is reviewed and critically evaluated, including
evaluation of the forecast information alongside evidence for how useful the bulletins were. In this context, this
work seeks to navigate the “murky landscape” of national and international mandates, capacities, and collab
orations for forecasting, early warning and anticipatory action, with the ultimate aim of finding out what can be
done better in the future. Lessons learnt and future recommendations are discussed to enable better collaboration
between producers and users of forecast information.
* Corresponding author. European Centre for Medium-Range Weather Forecasts (ECMWF), Reading, UK.
E-mail address: rebecca.emerton@ecmwf.int (R. Emerton).
https://doi.org/10.1016/j.ijdrr.2020.101811
Received 20 March 2020; Received in revised form 17 July 2020; Accepted 10 August 2020
Available online 8 September 2020
2212-4209/© 2020 The Author(s). Published by Elsevier Ltd. This is an open access article under the CC BY license (http://creativecommons.org/licenses/by/4.0/).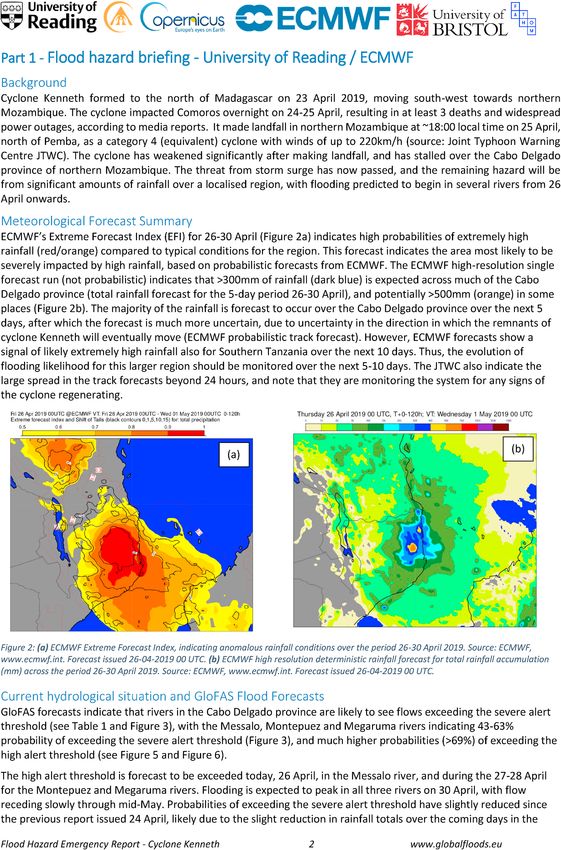
R. Emerton et al. International Journal of Disaster Risk Reduction 50 (2020) 101811
1. Introduction divides [11–13] that need to be taken into account in the long-term goal
towards DRR and building resilience. While the mandate for providing
In early 2019, two tropical cyclones (TCs) made landfall in warnings lies with the national authorities, and triggers for early hu
Mozambique with devastating impacts. Cyclone Idai made landfall in manitarian action must be based on these mandated forecasts, interna
central Mozambique in March and Cyclone Kenneth in northern tional organisations can provide key supporting information. In the case
Mozambique in April. Both were classified as intense TCs, with Kenneth of Mozambique, a WMO mission following Idai found that significant
the strongest cyclone to impact Mozambique in modern history (based gaps and weaknesses exist in terms of accuracy of the (flood) warnings,
on records from 1980 onwards); Idai resulted in more than 600 fatalities but also in terms of overall emergency preparedness, response and co
and left at least 1.85 million people in need of humanitarian assistance ordination. This includes a limited understanding of risk at institutional
[1] in Mozambique alone, with further fatalities and impacts in and individual levels, which might be due to the low frequency nature of
Zimbabwe and Malawi, while Kenneth caused 45 fatalities and displaced tropical cyclones [14].
thousands [2] in Mozambique. On 19th March 2019, 5 days following the landfall of Cyclone Idai,
Usually the first thing that comes to mind when we hear about TCs is the President of Mozambique declared a state of emergency, requesting
the destructive winds. However, in many cases the water can be much international assistance [15]. The research community in place through
more dangerous, as waves and storm surges flood the coasts and heavy the SHEAR research programme enabled the UK government’s Depart
rainfall causes riverine flooding further inland [3]. The impact of the ment for International Development (DFID)2 to task this team of authors,
rainfall has a longer timescale and can obstruct humanitarian aid during a collaborative group of scientists and model developers, to produce
the weeks and months after a cyclone. It is therefore essential for hu real-time flood forecast bulletins in order to support humanitarian
manitarian and civil protection agencies to have the right information decision-making during the flooding that followed Idai’s landfall.
on upcoming rainfall and flood risks. Since 1980, 18 tropical systems Less than 6 weeks after Cyclone Idai, when forecasts indicated a
have impacted Mozambique, affecting between 11,000 (Cyclone Hudah, second TC would impact Mozambique, the same team were able to
April 2000) and ~1.85 million (Cyclone Idai, March 2019) people, and provide these emergency flood bulletins ahead of Cyclone Kenneth’s
resulting in a total of more than 2000 fatalities. The most severe of these landfall, after a request for reactivation from the United Nations Office
were Cyclones Idai and Eline. Cyclone Eline made landfall on 22nd for the Coordination of Humanitarian Affairs (UN OCHA). The bulletins
February 2000, shortly after severe flooding in January 2000, and was were also shared by DFID with UN OCHA, INGC and humanitarian or
followed just a few days later by Cyclone Gloria, which made landfall on ganisations in real-time, and the team shared the information with
8th March. This combination of events affected ~650,000 people and research partners at the Red Cross in Mozambique. The bulletins were
resulted in ~750 fatalities [4]. While TC landfalls do not occur in not disseminated to the public. We used fluvial flood forecasts from the
Mozambique every year, cyclones with the intensity of Eline, Idai and Copernicus Emergency Management Service’s Global Flood Awareness
Kenneth are not unprecedented in the region. System (GloFAS), based on atmospheric forecasts from the European
While the Sendai Framework for Disaster Risk Reduction (SFDRR Centre for Medium-Range Weather Forecasts (ECMWF), and then un
[5]) recognizes member states’ primary responsibility to prevent and dertook detailed flood inundation estimation and impact risk assessment
reduce disaster risk in their own countries, it also articulates the need for for population exposure estimates, providing daily bulletins for ~2
strengthening of international cooperation and global partnership to weeks at a time for each cyclone. An example from the front page of one
allow high-risk countries to implement DRR programmes with the of these bulletins is shown in Fig. 1, and a full bulletin from Cyclone
overall goal to build resilience. It is not the case that national authorities Kenneth is provided in the Appendix. Fig. 2 details the daily timeline of
simply have either ‘capacity’ or ‘no capacity’ for using forecasts, the bulletin creation.
providing warnings and taking action. It is much more of a ‘murky Emergency briefings and bulletins are a way of communicating
landscape’ demanding “multi-level governance systems” [6] and a natural hazard forecast information to decision-makers and stakeholders
complex series of multisectoral, inclusive and accessible collaborations such as civil protection and humanitarian actors. They can be part of an
[5]. In addition to governments, humanitarian and development online decision support system (e.g. Ref. [16,17]) or stand-alone docu
agencies and other relevant stakeholders need to collaborate to prepare ments that can be emailed or downloaded [18] and can also feed into
for and respond to these types of events and are increasingly looking synthesis situation reports such as those produced by UN OCHA. How
towards using scientific forecasts to anticipate the impacts and act early. and when the forecast information is communicated is of critical
The basic rationale for using forecasts is to reshape humanitarian importance [19,20] and such bulletins must be able to rapidly convey
assistance through innovation that improves efficiency and prevents the upcoming danger, as well as the uncertainty in the forecasts, through
human suffering and losses [7]. images and clear textual guidance [21,22].
Through initiatives such as Forecast-based Financing (FbF) and the The series of events that led to the request for these emergency flood
UK’s Science for Humanitarian Emergencies and Resilience (SHEAR) bulletins suggests that, on an international scale, there are not yet
research programme,1 progress is being made towards the use of science adequate systems in place to make the best use of scientific forecasts of
and forecasts in taking early action ahead of a disaster. For example, the natural hazards. In addition, the rapidly increasing interest from hu
Red Cross took action based on forecasts of flooding in Uganda and Peru manitarian and development partners in using forecast information for
in 2016 [8]. However, many challenges remain for international orga real-time decision-making before (the impact of) a natural hazard event
nisations to use forecasts systematically to respond ahead of disasters. occurs, requires not only a critical assessment of whether the forecasts
These barriers involve technical, communication and infrastructural achieve an acceptable level of skill and accuracy for the intended pur
issues [9], but also relate to different institutional practices, expecta pose, but also of the ‘how’ and ‘when’ of the information provided by
tions, values and mandates, which further influences how success and emergency bulletins, and what the needs of the users are in this process
evidence is perceived and measured [10]. Moreover, who produces [23–25]. This paper contributes to this discussion by critically evalu
knowledge and where it will be implemented touch upon deeper ques ating this process of real-time bulletin creation for these two events, and
tions that revolve around history, epistemic politics and geographic makes an assessment of how the bulletins were used and how they could
be improved in the future. In doing so, this work seeks to navigate the
1
Science for Humanitarian Emergencies and Resilience (SHEAR) is an in
2
ternational research programme jointly funded by the UK’s Department for In September 2020, the UK government’s Department for International
International Development (DFID), Natural Environment Research Council Development merged with the Foreign and Commonwealth Office and is now
(NERC) and Economic & Social Research Council (ESRC) [www.shear.org.uk]. the Foreign, Commonwealth and Development Office (FCDO).
2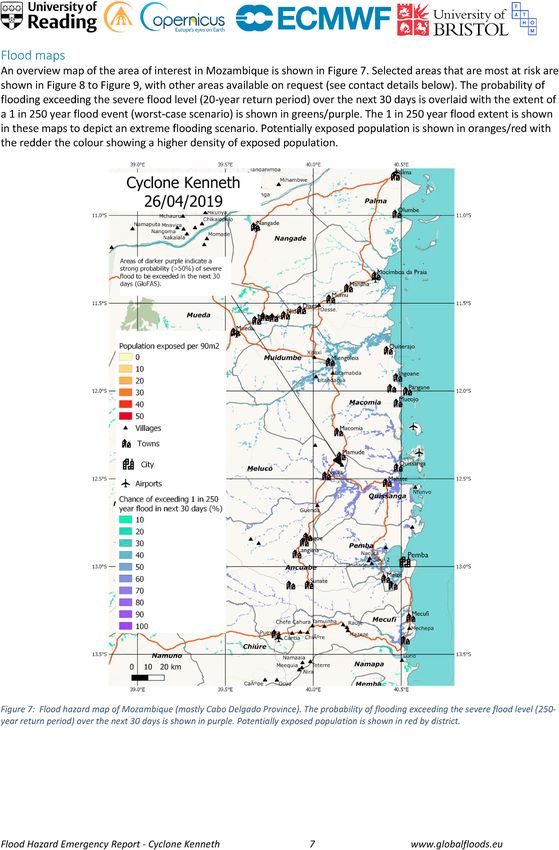
R. Emerton et al.                                                                                             International Journal of Disaster Risk Reduction 50 (2020) 101811

Fig. 1. Example front page from an emergency flood bulletin produced by the Universities of Reading and Bristol, and ECMWF, for DFID and the Mozambique Red
Cross on 26th April 2019 for Cyclone Kenneth, detailing the key points of each aspect of the forecast including an overview of the meteorology, flood hazard and
flood risk/impact. The full document is provided in the Appendix. (For interpretation of the references to colour in this figure legend, the reader is referred to the Web
version of this article.)

                                                                                    3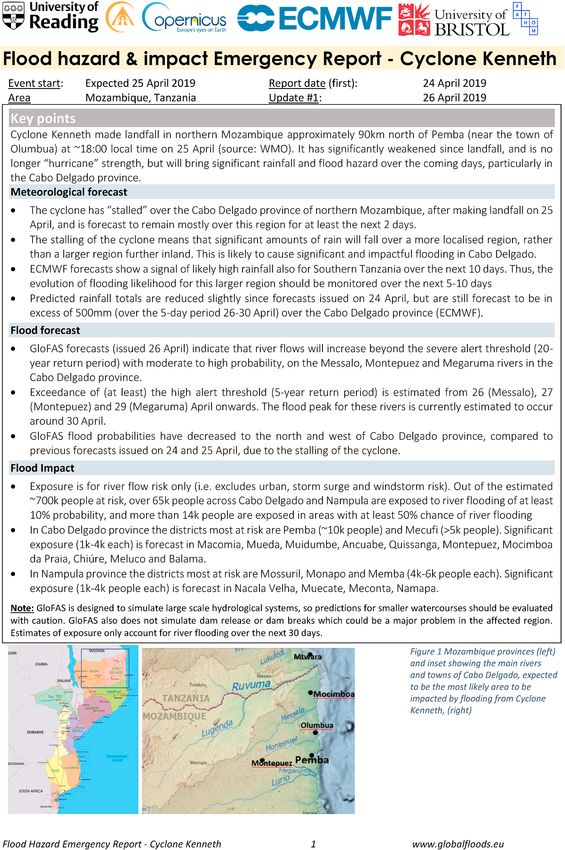
R. Emerton et al. International Journal of Disaster Risk Reduction 50 (2020) 101811
Fig. 2. Timeline of the daily emergency flood bulletin creation. Abbreviations: GloFAS: Global Flood Awareness System, ECMWF: European Centre for Medium-
Range Weather Forecasts, UoR: University of Reading, UoB: University of Bristol, NWP: Numerical Weather Prediction model, DFID: UK government’s Depart
ment for International Development.
“murky landscape” of national and international mandates, and capac lessons learnt and recommendations for the provision of such informa
ities and collaborations for forecasting, early warning and anticipatory tion for future events.
action, with the ultimate aim of discussing what can be done better in
the future, particularly to enable increased collaboration between pro 2. Hydro-meteorological summary of Cyclones Idai and Kenneth
ducers and users of forecast information.
The following sections provide a hydro-meteorological overview of The 2018–2019 south-west Indian Ocean (SWIO) cyclone season saw
the two cyclones and their impacts, an overview of the forecasts and the largest number of intense TCs recorded in one season (based on
warnings available from the national authorities in Mozambique, a records from 1980 onwards) in this ocean basin; of the 18 tropical sys
description of the forecasts and models used to produce the bulletins and tems, 11 were classified as intense TCs with wind speeds exceeding 165
an evaluation of the forecasts of the two cyclones, followed by a critical km/h. In the SWIO, the cyclone season typically runs from September
discussion on the use of and response to the flood bulletins alongside through to April, with the majority of systems occurring between
Fig. 3. Map of Mozambique, highlighting the regions affected by Cyclones Idai (grey shading) and Kenneth (purple shading), approximated by indicating the area
that received > 150 mm of rainfall during each cyclone. The main rivers and cities are also highlighted, and the tracks of Idai (grey) and Kenneth (purple) are shown.
(For interpretation of the references to colour in this figure legend, the reader is referred to the Web version of this article.)
4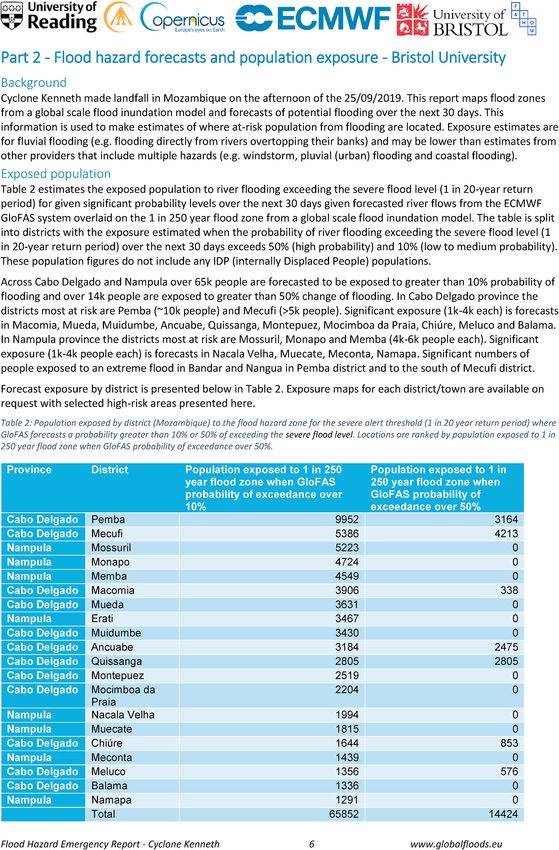
R. Emerton et al. International Journal of Disaster Risk Reduction 50 (2020) 101811
December and March. In the 2018–2019 season, the first system to 3. Forecasts, data & bulletin creation
impact Mozambique was tropical storm Desmond, which made landfall
~200 km north of Beira (see Fig. 3) on 19th January 2019. While the This section provides an overview of the forecast and warning infor
storm was short-lived and much weaker than Cyclones Idai and Kenneth, mation available from national authorities in Mozambique, followed by a
with maximum 10-min sustained wind speeds of 65 km/h [26], it discussion of the forecast models and data used to produce the flood
brought significant rainfall and some flooding to the region that would bulletins, alongside additional data and methods used for the forecast
later be impacted by Idai. evaluation undertaken as part of this study. We primarily made use of
The precursor of Cyclone Idai originated in the Mozambique Channel ensemble forecast products, which provide a range of possible forecast
(Fig. 4a) and first affected Mozambique as a tropical depression (with outcomes taking into account the various uncertainties associated with
wind speeds ≤ 62 km/h) on 4th March 2019. The rainfall from the first hydro-meteorological forecasting, and allowing the provision of proba
landfall led to significant flooding across central Mozambique and bilistic forecast information [31]. Sections 3.2 to 3.4 describe the chain of
southern Malawi from 5th March onwards, particularly in the Zambezi forecasts used to produce the bulletins in real-time during the two cy
River and its tributaries. Upstream within the affected area, the flood clones, from the meteorological forecasts that were discussed in the
peak on the Zambezi occurred on 8th March [27]. Further downstream, bulletins, and also as input to the flood forecasting system, through to the
the flooding from this first landfall peaked more than four days later, at population exposure estimates, which themselves make use of the flood
Mutarara on the 12th, Caia on the 14th and Marromeu on the 16th forecast data and additional flood inundation modelling. In the bulletins,
March (see Fig. 3a). Water levels in some locations, including Tete and forecast information was provided through a combination of maps and
Marromeu, reached up to 1.2 m above the flood alert levels [27]. figures directly from the forecasts and forecast data, alongside expert
On 9th March, the tropical depression moved back over the interpretation of the data to provide a written summary of each aspect of
Mozambique Channel, where it rapidly intensified. Idai was declared an the forecasts. The terminology used within these written summaries
intense TC on 12th March, with maximum 10-min sustained wind speeds made reference to the forecast uncertainty and probabilities based on the
of 195 km/h [26], before moving back towards the Mozambique coast ensemble forecasts. For this study, we have further evaluated the forecast
line. Cyclone Idai made landfall near Beira on 15th March, with 10-min accuracy through a retrospective analysis using the raw data from the
sustained wind speeds of 165 km/h and a storm surge of ~4.5 m [28], real-time forecasts that were used to produce the bulletins. The bulletins
which, combined with intense rainfall, led to further extensive flooding. were recommended for use by decision-makers alongside forecasts from
After landfall, Cyclone Idai quickly weakened, but continued to the national authorities, and were not publicly disseminated.
move slowly inland, resulting in continuous rainfall for several days that
led to widespread and devastating flooding in central Mozambique, 3.1. Forecasts and warnings from national authorities
especially on the Pungwe and Buzi rivers. The national hydrological
bulletins reported that river levels started to rise in the Pungwe and Buzi The institutions mandated to issue warnings for meteorological and
rivers on 15th March. However, due to a breakdown of communication hydrological hazards are the National Institute of Meteorology (INAM)
systems caused by the cyclone, there are no recorded observations of the and the National Directorate of Water Resources Management (DNGRH)
flood peak. Some discontinuous observations for the Pungwe river at in collaboration with regional operational water administrations
Mafambisse (45 km upstream of Beira) show two clear characteristics of (ARAs). The INGC (National Institute of Disaster Management) is
the event: (i) a fast, extreme increase in river levels between 14th and responsible for coordinating the response to warnings issued by INAM
19th March, from 4.63 m to 9.3 m, exceeding the flood alert level by and DNGRH. The disaster management structure in Mozambique is
more than 3 m, and (ii) a slow flood recession from 20th March to 6th shown in Fig. 5.
April at a rate of around 10 cm per day. INAM issue TC warnings detailing the severity of the storm (ranging
Beyond the hydro-meteorological hazards, flooding from TCs can from a warning for ‘heavy rain, severe thunderstorm and strong wind’
lead to outbreaks of disease, and a cholera outbreak was declared in through to ‘intense tropical cyclone’), the target area (regions likely to
Mozambique on 27th March. This outbreak affected more than 6700 be impacted), an alert colour code (indicating the number of hours
people in the flood-affected Sofala Province [29]. before a TC makes landfall; blue 24–48 h, yellow < 24 h, red < 6 h), and
Less than 6 weeks later, another tropical disturbance began to any available observed data for wind speeds and precipitation. These
organise to the northeast of Madagascar on 21st April and move west warnings are updated at least daily during an event.
ward towards Mozambique (Fig. 4b). This system became a tropical For TC forecasting and warnings, INAM make use of the TC forecasts
depression and later a tropical storm on 23rd April, at which point it was provided by the Regional Specialised Meteorological Centre (RSMC).
named Kenneth. Kenneth continued to rapidly intensify and was RSMCs have the WMO-mandated responsibility to monitor and name TCs
declared an intense TC on 24th April with maximum 10-min sustained in their region and provide forecasts to national hydromet services. In the
wind speeds of 215 km/h [26], before weakening slightly shortly before SWIO, the RSMC is Météo France La Réunion, who provide daily updates
making landfall on the evening of 25th April in northern Mozambique, on the meteorological situation and potential for cyclogenesis, and issue
near Pemba (Fig. 3b). In the period from 1950 onwards, just 12 TCs have technical bulletins and graphical warning products every 6 h during a TC.
reached intense TC status in the SWIO during the month of April, Ken The technical bulletins contain detailed information on the location, size
neth being the latest and strongest of these. and intensity of the tropical system, in text format designed for the use of
The rainfall from Cyclone Kenneth led to flooding that began on 26th operational forecasters at the national authorities. Graphical warnings
April in the Megaruma river, with a significant rise in river levels from products are issued through the Météo France website (www.mete
28th April in all major rivers in the region, including the Megaruma, ofrance.re/cyclone/). These provide maps of the predicted track of the
Messalo, Montepuez, Lurio, Meluli, Monapo and Ligonha rivers centre of the tropical system over the next 5 days, including a cone of
(Fig. 3b). Water levels remained above the flood alert levels until 2nd uncertainty or ‘potential track area’ based on forecasts from a range of
May [27]. This severe flooding across the Cabo Delgado province of models, alongside an indication of the expected intensity of the storm.
northern Mozambique during the days following Cyclone Kenneth’s The TC forecasts provided by the RSMC do not currently provide infor
landfall resulted in an estimated 45 deaths and the destruction of at least mation on rainfall or flooding; INAM’s operational forecasters use a va
2500 homes [1], alongside the loss of a significant number of crops, riety of rainfall forecast products produced by global forecasting centres,
fishing boats and fishing equipment [30]. to prepare rainfall forecasts based on their expert analysis.
During the two TCs, DNGRH also issued warnings for flooding, based
on observations of river levels, whether the river levels exhibited a rising
trend, and qualitative assessment of forecasts and observations of a
5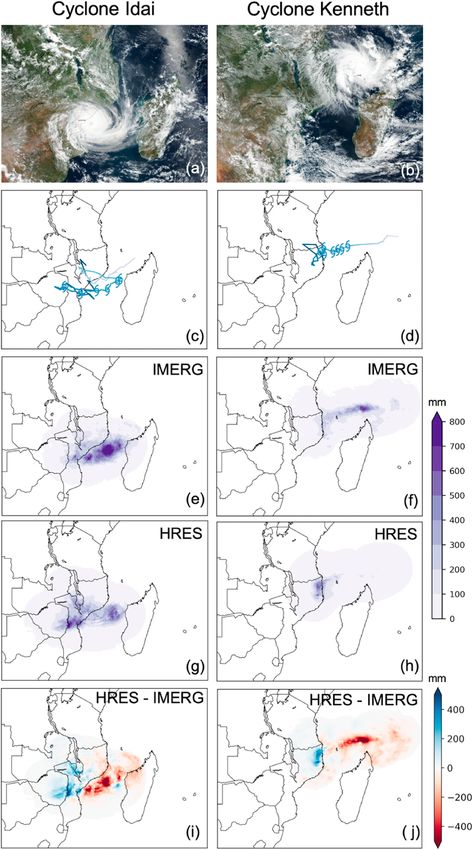
R. Emerton et al.                                                                                      International Journal of Disaster Risk Reduction 50 (2020) 101811

                                                                                                   Fig. 4. Observed tracks and rainfall analysis for Cyclones Idai
                                                                                                   and Kenneth. The top panels show satellite images (NASA
                                                                                                   Worldview, 2019) of (a) Cyclone Idai, taken on 14th March
                                                                                                   2019 and (b) Cyclone Kenneth, taken on 24th April 2019,
                                                                                                   followed by the tracks of (c) Cyclone Idai and (d) Cyclone
                                                                                                   Kenneth from genesis to dissipation, identified in the ECMWF
                                                                                                   operational analysis data using the methodology described in
                                                                                                   section 3.1. Tracks progress from light to dark shading, and
                                                                                                   cyclone symbols depict the portion of the track when the
                                                                                                   storms were classified as tropical cyclones. Total observed
                                                                                                   rainfall (mm) is shown for (e) Cyclone Idai, from 1 to 24
                                                                                                   March 2019, and (f) Cyclone Kenneth, from 21st to 28th April
                                                                                                   2019, using the IMERG satellite precipitation data (see section
                                                                                                   3.1). Also shown is the total forecast rainfall (mm) from the
                                                                                                   ECMWF HRES forecasts at 1 day lead time, for (g) Cyclone
                                                                                                   Idai and (h) Cyclone Kenneth. This is the sum of all 24-h
                                                                                                   rainfall accumulations from forecasts produced 1 day ahead
                                                                                                   (for example, a forecast produced at 00UTC on 12th March for
                                                                                                   the 24-h total rainfall accumulation on 13th March) for the
                                                                                                   duration of each storm. Finally, the mean error of the total
                                                                                                   rainfall forecast (mm) of the ECMWF HRES forecasts at 1
                                                                                                   day lead time is shown for (i) Cyclone Idai and (j) Cyclone
                                                                                                   Kenneth. Red indicates too little rainfall, and blue indicates
                                                                                                   too much rainfall in the forecasts. (For interpretation of the
                                                                                                   references to colour in this figure legend, the reader is
                                                                                                   referred to the Web version of this article.)

tropical cyclone and heavy rain. The warnings provided for Cyclone                     While INAM, DNGRH and INGC are continually working towards
Idai, after landfall, also noted the possibility of water release from a dam       improving the forecasts and warnings they provide, including through
in the region which could increase the risk of flooding. This knowledge            various research and operational collaborations (e.g. Ref. [14,33–35]) at
of the local context, and incorporating upstream observations of river             the time of Idai and Kenneth, there was limited capacity to provide
levels into warnings is key information that it would not be possible to           real-time forecasts of flood hazard and risk information for anticipatory
provide using a global flood forecasting system such as GloFAS. A WMO              action [14]. As such, the flood bulletins for Cyclones Idai and Kenneth
mission report ([14], p27-29) provides further details surrounding the             sought to provide complementary information on the hazards and risk
warnings from both INAM and DNGRH, and the forecasting capacity of                 associated with the cyclones based on real-time global scale
both institutions.                                                                 hydro-meteorological forecast models. The warnings issued by the RSMC

                                                                               6
R. Emerton et al. International Journal of Disaster Risk Reduction 50 (2020) 101811
Fig. 5. Disaster risk management structure in Mozambique. Adapted from INGC [14,32] (Presented at a FATHUM project meeting in Maputo, September 2019,
hosted by Universidade Tecnica de Mocambique (UDM) in collaboration with the Universities of Reading, Oxford and Bristol).
and used by INAM were considered during creation of the flood bulletins, 3.2.2. Forecast analysis
for comparison with the ENS forecasts (see section 3.2) and to ensure In this study, we identify the TC tracks in the ENS and HRES forecast
consistency of the information provided. The information provided by data using the tracking scheme of Hodges [37–39]. This method,
DNGRH regarding the potential for release of water from a dam was also described in detail by Hodges and Klingaman [40], locates vorticity
brought to the team’s attention by our Red Cross research partners, and maxima matching a set of criteria identifying them as TCs. The predicted
was cited in the flood bulletins. TC tracks are then verified against the observed tracks, obtained from
the International Best Track Archive for Climate Stewardship (IBTrACS
3.2. ECMWF meteorological forecasts [41]), which combines TC track data from weather centres worldwide,
providing a dataset of historical tracks. Operationally, the ECMWF TC
3.2.1. Flood bulletin creation track forecasts make use of a different tracking scheme [42,43] than we
For the bulletins, we made use of probabilistic meteorological fore use here. The tracking scheme used in this study is also currently being
casts from ECMWF’s Ensemble Prediction System (ENS). The ENS is part used to produce a long-term evaluation of TC forecast skill in the SWIO,
of the ECMWF Integrated Forecasting System (IFS, cycle 45r1) providing in collaboration with the Red Cross, to provide information that can be
twice-daily forecasts out to 15 days ahead, with 51 ensemble members at used towards forecast-based early action for cyclones in south-east Af
~18 km horizontal resolution. The ENS graphical forecast products were rica. We use it here for consistency, and to allow for further comparison
used to provide contextual information on the predicted track (path) of of the forecasts of these storms with a long-term analysis, as it is
the cyclones, alongside the amount and spatial extent of rainfall ex important not to make an assessment of the overall skill of the fore
pected from the cyclones. ENS forecasts are also used as input to the casting systems based on the forecasts of an individual event.
flood forecasts; more information is provided in section 3.2. ECMWF We further assess the accuracy of the rainfall forecasts for the two
also produce a high (9 km) resolution deterministic forecast (HRES), cyclones. Following the method of Peatman et al. [44] and Guo et al. [45],
which was used as supplementary information in the bulletins to provide we produce composites of the rainfall associated with each TC, whereby
rainfall maps. A recent study by Titley et al. [36] found that, based on rainfall within 5◦ of a track point is attributed to the cyclone. This is done
analysis of three ensemble forecasting systems from the UK Met Office, for both the HRES and ENS precipitation forecast data using the forecast
ECMWF and the National Centre for Atmospheric Prediction (NCEP), tracks, and for NASA’s Integrated Multi-SatellitE Retrievals for Global
ECMWF provided the most accurate TC forecasts in the SWIO, although Precipitation Measurement (IMERG V05B [46]) gridded satellite pre
a multi-model ensemble can provide improved skill. Forecast skill was cipitation data (0.1◦ resolution) using the observed tracks, in order to
also found to be worse in the SWIO than other ocean basins, for the UK verify the forecasts. Precipitation products based on satellite data provide
Met Office and ECMWF. valuable and consistent information, particularly in data-sparse regions,
ECMWF’s TC track forecast products become publicly available (via but it is important to note that while previous studies have found IMERG
www.ecmwf.int) once the system is declared a TC by the Regional to satisfactorily represent the spatiotemporal distribution of TC rainfall, it
Specialised Meteorological Centre (RSMC) responsible for the distribu has also been found to over-represent high-intensity rainfall, and in some
tion of warnings in the region. cases, under-estimate coastal rainfall over land [47–49].
7
R. Emerton et al. International Journal of Disaster Risk Reduction 50 (2020) 101811
3.3. GloFAS flood hazard forecasts flood inundation and population information. GloFAS’ ensemble river
flowforecasts were first downscaled to the ~90 m resolution of the flood
3.3.1. Flood bulletin creation inundation information, using inverse-distance-weighting. The exposure
The flood forecasts used were those of the Global Flood Awareness is calculated as the population exposed to a particular return period flood
System (GloFAS, v2.0, www.globalfloods.eu), an early warning inundation, multiplied by the probability of exceeding a return period
component of the European Commission Copernicus Emergency Man threshold according to GloFAS. The population is described by the High
agement Service (emergency.copernicus.eu). The system couples Resolution Settlement Layer (HRSL [56]) dataset, and the return period
ECMWF’s ENS forecasts of surface and sub-surface runoff [50] with a flood inundation is a binary yes/no (1/0 where wet = 1 and dry = 0) at
hydrological river routing model (Lisflood [51]), to produce ensemble each grid point of the global flood inundation model. The GloFAS prob
(probabilistic) forecasts of river flow for the global river network, at 0.1◦ ability of exceedance is calculated using the percentage of ensemble
(~10 km) resolution with 51 ensemble members. The initial conditions members that exceed the given return period threshold.
for the GloFAS model are generated by the state-of-the-art GloFAS-ERA5 To estimate the flood inundation, a global flood inundation model
river flow reanalysis [52,53]. GloFAS provides daily forecasts of flood framework [57] was used to delineate flood inundation zones across the
ing in major rivers around the globe, out to 30 days ahead [54], but does region at ~90 m resolution. Return periods ranging from 5- to
not currently provide forecasts for coastal flooding, which can be a 1000-years (20%–0.1% AEP) were calculated in order to provide a range
significant concern during tropical cyclones. Due to this limitation, of possible scenarios based on the forecasts. The model estimates
when available, we pointed to storm surge forecast information from riverine flooding for all basins with an upstream area >50km2using a
other sources, such as the European Emergency Response Coordination sub-grid hydrodynamic model within the LISFLOOD-FP code [58]; there
Centre, and the RSMC, in the bulletins. is no coastal flooding component. A regionalised flood frequency anal
While GloFAS v2.0 uses an updated version of Lisflood that has been ysis conducted at the global scale [59] provides model boundary con
calibrated using river flow observations at 1287 stations worldwide ditions by linking river discharge and rainfall measurements in gauged
[55], the model is not yet calibrated in the region affected by Idai and catchments to ungauged catchments, based on catchment characteristics
Kenneth, as no observed river flow data were available at the time the and climatological indicators. The modelling framework therefore al
model was calibrated. lows for estimation of riverine flooding at a global scale, including
Each new GloFAS forecast is compared against flood thresholds at data-sparse regions.
every grid point, providing a probability of exceeding three different Leyk et al. [60] describe the various available gridded population
flood severity thresholds. These thresholds are calculated from the datasets available and their differences. For the bulletins, we used the
GloFAS-ERA5 reanalysis for various return periods [54]; the medium, HRSL [56] dataset, based on data availability and the work of Smith
high and severe alert thresholds correspond to the 2-year, 5-year and et al. [61], who demonstrated that the method used by HRSL more
20-year return periods (50%, 20% and 5% annual exceedance proba accurately placed populations just outside of the most hazardous areas,
bilities3 (AEPs)), respectively. This approach limits the influence of resulting in a better estimate of exposure, especially in rural areas. To
systematic biases, which are expected in regions where the model re estimate population exposed to flooding during Cyclones Idai and
mains uncalibrated. The GloFAS user guide [53] suggests that Kenneth, the population data (~30 m) were aggregated to the resolution
decision-makers focus on the hydrological variability, trends, timing and of the flood inundation data (~90 m). In order to provide the total
relative magnitude of the flood hydrographs, rather than the exact population exposure per administrative unit, zonal statistics were used.
predicted magnitude of the river flow. This is a key aspect of the GloFAS Although GloFAS forecasts do not explicitly provide the probability of
user interface, and of the interpretation of GloFAS forecasts for use in the exceeding return periods greater than the severe (20-year/5% AEP) alert
emergency bulletins, but it should be noted that this is not simple to level, many ensemble members indicated that flooding may substan
carry through to the inundation and exposure estimates, which must tially exceed the severe alert level on some rivers. As such, we addi
make use of GloFAS river flow forecasts and thresholds in order to tionally calculated exposure to a range of more extreme flood return
provide estimates of populations exposed to flooding. periodsflood hazard, in order to report a range of exposure estimates.
Exposure information was provided in the bulletins through tables and
3.3.2. Forecast analysis maps (see Appendix, Table 2 and Figs. 7–9).
To evaluate the GloFAS forecasts for Cyclones Idai and Kenneth, we
extract and assess the predicted timing of the flood peak and recession, 4. Forecast analysis
and the probabilities of exceeding critical flood alert thresholds. These
characteristics are the key aspects of the forecast information used for 4.1. Cyclone Idai
decision-making purposes. We compare these aspects of the flood fore
cast with observations of flood peaks and timings in the affected region, Retrospective analysis of the raw ENS probabilistic forecast data
provided by DNGRH through their hydrological bulletins. indicates that the forecasting system first began to consistently pick up
the potential development of a tropical system in the Mozambique
Channel, from 26th February onwards. From 1st March, the GloFAS
3.4. Flood risk and impact estimation
flood forecasts indicated a 10–20% probability (based on the forecast
ensemble) of severe flooding (exceeding the 20-year return period/5%
3.4.1. Flood bulletin creation
AEP) across the region affected by Idai’s precursor, in southern Malawi
Population exposure due to flooding was estimated by combining
(the Shire River basin) and central Mozambique (the Zambezi River
GloFAS forecast probabilities of exceeding the flood alert thresholds, with
basin, including the Zambezi and Cuacua Rivers). At this point, the flood
peaks associated with this first landfall were predicted to occur on
3
9–10th March across the affected river network, which is consistent with
Annual exceedance probabilities (AEPs) are provided alongside return pe
the flood timing later reported by the national hydrological bulletins
riods throughout. While return periods currently represent commonly-used
[27]. From 4th March onwards, probabilities of severe flooding
terminology in hydrological applications, they can be misleading when
communicating potential risk to scientists, decision-makers and non-specialists increased, exceeding 80% in rivers across the affected region from 5th
from a variety of backgrounds. For example, it may unintentionally imply that if March, such as along the Cuacua river (see Fig. 6a). The expected
a 5-year return period flood occurs, it will not be observed again for 5 years, exposure also rapidly increased on 4th March (see Fig. 8), with a peak on
when in fact there is a 20% chance of a flood of that magnitude occurring in any 6th March of ~200,000 based on the 20-year return period (5% AEP),
given year (20% AEP). and a maximum exposure estimate of ~450,000 people (based on the
8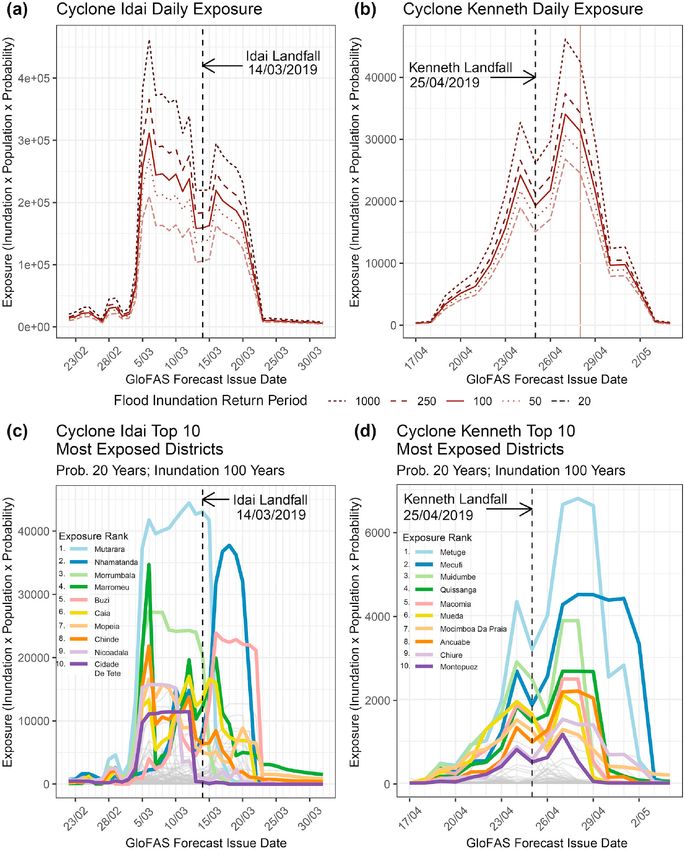
R. Emerton et al. International Journal of Disaster Risk Reduction 50 (2020) 101811
1000-year return period/0.1% AEP). of the TC, but the winds and rain associated with the storm can extend for
From 6th March, 9 days ahead of Cyclone Idai’s landfall near Beira hundreds of kilometres around this point (see Fig. 4a–d). This was a
on 15th March, the ENS track forecasts indicated a high probability consideration after the storm made landfall, when track forecasts pro
(~70%) of the system ‘looping around’ over the Channel and making duced on 13th to 15th March indicated that Idai was likely to continue
landfall as a TC in central Mozambique, although the precise landfall moving further west before dissipating. However, the cyclone stalled over
location remained uncertain. An example of the forecast and the central Mozambique rather than moving further west, resulting in sus
ensemble spread (i.e. forecast uncertainty) is shown in Fig. 7b and d, for tained periods of heavy rainfall over the same region; this stalling was
the forecast produced on 10th March, and the forecast progression picked up in the track forecasts with approximately 1 day’s lead time, on
throughout the storm’s lifecycle is shown in Animation 1 in the sup 16th March, and this resulted in uncertainty in the flood forecasts.
plementary material. This coincides with GloFAS forecasts beginning to This is shown in Fig. 6a, by a drop in the probability of severe
indicate the possibility of a second flood event, in the Pungwe and Buzi flooding, from ~40% to ~20% during the 13 - 15th March period when
River basins, with an expected peak ~18th-20th March in the two river forecasts were indicating the cyclone was likely to move further to the
basins, which is consistent with the available observations in the west. When the stalling was picked up in the track forecasts, the prob
Pungwe river. Fig. 6a shows the evolution of the probability of abilities of severe flooding increased rapidly, and remained consistently
exceeding the severe flood alert threshold for the two main rivers high throughout the affected river network (particularly the Pungwe,
affected by the flooding from Idai, the Pungwe and Buzi Rivers, and for Buzi and Save Rivers) after Idai made landfall.
two of the main rivers affected by the first flooding event from Idai’s Evaluation of the HRES rainfall forecasts using IMERG satellite
precursor (Zambezi and Cuacua Rivers). The evolution of the GloFAS rainfall data (Fig. 4e–j) indicates that, over land and at short lead times,
forecast probabilities, across the region, is shown in Animation 2 in the the ECMWF HRES forecasts for Cyclone Idai typically over-predicted the
supplementary material. rainfall totals across much of central Mozambique, and under-predicted
From 10th March, coinciding with the intensification of the storm the rainfall in northern Mozambique and over the Channel. At 0 days
and its upgrade to TC status by the RSMC, the ENS forecasts for the lead time (i.e. a forecast produced at 00UTC for the total rainfall over the
landfall location became much more confident, alongside forecasts of following 24 h) errors over land are equivalent to
R. Emerton et al. International Journal of Disaster Risk Reduction 50 (2020) 101811
Fig. 7. Track location errors with lead time for ECMWF forecasts of Cyclones (a) Idai and (c) Kenneth. Errors are the mean error across all forecasts (produced twice
daily at 00 and 12 UTC) for the tropical cyclone stages of each storm, for the high-resolution deterministic (red) and ensemble mean (dark blue) forecasts, and the
mean error across all 50 individual ensemble members (light blue). Forecast tracks are verified against the IBTrACS observed best tracks. An example forecast for
Cyclone Idai is shown in (b), issued on 10th March 2019 at 00 UTC, and for Cyclone Kenneth in (d), issued on 23rd April at 12UTC. These maps indicate the forecast
track for the deterministic (red)and all 50 individual ensemble members (light blue), alongside the track of the ensemble mean (dark blue). The observed tracks of
Cyclones Idai and Kenneth are shown in black, where tropical cyclones symbols denote the cyclone-strength stages of the storm, followed by a grey solid line
representing the post-cyclone stages. (For interpretation of the references to colour in this figure legend, the reader is referred to the Web version of this article.)
across much of the affected area of central and northern Mozambique. estimates of the number of people exposed were likely reasonable, as for
These errors in the rainfall can be tied to the forecasts of the cyclone’s the 20-year flood hazard (5% AEP) the total estimated exposure was
track, which predicted the storm to continue moving west rather than ~200,000 people. An assessment of 14 districts in the Sofala and Manica
the observed stalling over central Mozambique, and the impact of this is provinces estimated the total affected population to be ~1 million [2],
seen in the GloFAS flood forecasts as the aforementioned drop in the which is at the upper end of our estimates (see Fig. 9). However, the
probability of severe flooding before the stalling was picked up. authors of the report state “it is possible that there was some misun
The locations and rivers affected by the flooding were correctly derstanding around the terminology used in Portuguese, and that the
predicted by GloFAS with a 10-day lead time. However, for severe floods were understood as a synonym of rain”, suggesting a potential
flooding the probabilities were relatively low (R. Emerton et al. International Journal of Disaster Risk Reduction 50 (2020) 101811
Fig. 8. Daily total exposure estimates for Mozambique for (a) Cyclone Idai and (b) Cyclone Kenneth, for five different flood inundation return periods (20, 50, 100,
250 and 1000-year return periods, equivalent to 5%, 2%, 1%, 0.4% and 0.1% AEPs, respectively, indicated by different line styles), and exposure per district for (c)
Cyclone Idai and (d) Cyclone Kenneth. The ranking is based on the total number exposed during the period shown on the graph. The faded grey lines are other
districts in Mozambique, outside of the 10 districts with the highest exposure. The exposure per district is calculated based on the severe flood level of GloFAS (20-
year return period/5% AEP), the 100- year (1% AEP) inundation return period and the HRSL population dataset.
were much smaller for Kenneth, at ~100 km (compared to ~200 km for Kenneth, implying that Kenneth’s track was much more predictable.
Idai). This is also significantly smaller than typical location errors for Typically, forecast location errors are smaller where TCs tend to move
ECMWF forecasts in the SWIO, which are ~200 km at 3 days ahead, more zonally (such as was the case with Kenneth) compared to those
based on the average error across 35 recent TCs (2014–2018; not which meander or recurve [63,64].
shown). The errors increased more rapidly with lead time for Idai than This is reflected in the GloFAS flood forecasts, which, coinciding with
11R. Emerton et al. International Journal of Disaster Risk Reduction 50 (2020) 101811
Table 1 5. Were the emergency flood bulletins useful?
Overview of estimated population exposed to river flooding from Cyclone
Kenneth, from the bulletin produced on 26th April 2019 (see Appendix), for the In this section we use evidence from reports, interviews, conversa
Cabo Delgado province, alongside the total number of people reported affected tions, letters, emails and written commentary at post-event meetings,4 to
in each district [30]. It is important to note that the definition of affected also review the use, usefulness and the potential impact of the bulletins. We
covers many more aspects of the impacts than river flooding, such as extreme
critically assess to what extent we can be sure those receiving them
winds, food insecurity, previous heavy rains and other factors.
found them useful, and were able to take better decisions based on the
District Flood Bulletin Estimated Population Total Number of People forecast information, or whether they were just an addition to the
Exposed to River Flooding from Affected
overload of information for humanitarian actors and governments
Cyclone Kenneth
involved, distracting from the priorities on the ground.
(10% (50%
probability) probability)
Pemba 9952 3164 9366 5.1. Making the best use of scientific forecasts of natural hazards
Mecufi 5386 4213 1645
Macomia 3906 338 85225 Using science actively in planning and responding to natural hazards
Mueda 3631 2568
is the ‘holy grail’ of forecast development. The key is to be able to
Muidumbe 3430 16994
Ancuabe 3184 2475 7515 generate, disseminate and communicate the information in meaningful
Quissanga 2805 2805 21154 ways to different users who can actively use it early enough for decisions
Montepuez 2519 163 to be taken. In our case, this was a request from DFID following the
Chiure 1644 853 24435 declaration of a state of emergency in Mozambique and a request for
Meluco 1356 576 5451
international assistance, and therefore there was a lot of active discus
sion between the forecast producers and those responsible for passing on
the increasing confidence of the landfall location in the ENS forecasts,
the information to h umanitarians on the ground (see Figs. 2 and 5 for an
consistently indicated an increasing probability of severe flooding in the
overview of the bulletin production and feedback process with DFID,
Messalo, Montepuez and Megaruma Rivers, from 18th to 24th April
and the national disaster management structure in Mozambique,
(Fig. 6b). The expected exposure began to increase on 19th April (6 days
respectively).
before landfall), with the most rapid increase also occurring on 22nd
April. Similarly to the forecasts for Idai, a drop in the GloFAS probability “This is the first time we have been able to use science so early in
of severe flooding is seen on 25th– 26th April, due to the ENS track both planning for and responding to the devastating impact of cy
forecasts indicating the storm may continue to move west, rather than clones. Your expert analysis, collaborative effort across your orga
stalling over the Cabo Delgado province of northern Mozambique, as nisations and with DFID colleagues, and willingness to tailor and
was observed. The peak expected exposure occurred 2 days after landfall communicate the analysis to the needs of the humanitarian agency
and ranged from 25,000 people for the 20-year return period (5% AEP) end users was well received.” [Professor Charlotte Watts, Chief Sci
flood inundation to 45,000 for the most extreme 1000-year return entific Advisor for DFID]
period (0.1% AEP) flooding. Fig. 8d shows expected exposure per dis
“The real innovation of these bulletins lies in the fact that this in
trict for the severe flood (20-year return period/5% AEP) probability
formation has been produced in real-time, but of course many
and the 100-year (1% AEP) flood inundation. Unlike Cyclone Idai, the
challenges remain.” [DFID]
ranking of the most exposed district does not significantly alter during
the event, due to the more predictable track of Cyclone Kenneth. Feedback received from our international humanitarian partners
Comparing these estimates for population exposed per district, based noted that this was the first time that flood risk information had been
on the bulletin produced on 26th April (see Appendix, Table 2), with a provided in real-time to them, and that the type of information was
post-disaster assessment [30] from the Global Facility for Disaster perceived as extremely valuable, innovative and promising for future
Reduction and Recovery (GFDRR), indicates that these estimates interventions, particularly due to the move from weather forecasts to
correctly predicted which districts were at risk. The districts listed in the more impact-based forecasts. Access to the meteorological forecasts
bulletin with a probability of flooding (based on the 250-year flood used as input to GloFAS allowed the provision of the meteorological
inundation/0.4% AEP) exceeding 10% are the same districts that were context of the flood hazard and risk, and the inclusion of probabilistic
indeed affected by the cyclone, and the districts estimated to be at risk meteorological, hydrological and exposure information in one docu
with a higher (50%) probability of flooding generally correspond to ment was found to be extremely valuable and useful. Nevertheless,
those with the highest number of people affected [30]. Table 1 provides despite the novelty of the type of information that was produced, it is
a district-level comparison between the exposure estimates provided in clear from the series of events that led to the request for these emergency
the bulletin, and the number of people affected per district, in the Cabo
Delgado province. While the estimates in the bulletin are somewhat
lower than the total number of people affected, this is to be expected as 4
A Discussion Meeting on Cyclones Idai and Kenneth was organised by the
the definition of affected covers many more aspects of the impacts than Universities of Reading (Rebecca Emerton, Andrea Ficchi and Hannah Cloke),
river flooding, such as extreme winds, food insecurity and disease, and Bristol (Laurence Hawker) and Oxford (Sara de Wit), and hosted by the Uni
these numbers are also “superimposed on previous heavy rains at the versidade Técnica de Moçambique (Rui da Maia, Benedita Nhambiu and Joa
beginning of the year, the effects of Cyclone Idai in some districts, and quim Cuna) in Maputo, Mozambique. The meeting took place on 20th
vulnerable population groups that had been resettled as part of the September 2019 and brought together representatives from key national
conflict stabilisation efforts of the previous year” [30]. This poses a agencies (INAM, DNGRH, INGC and the Mozambique Red Cross) involved in
the forecasting and response to the cyclones, hydrologists from regional water
significant challenge in evaluating such exposure estimates, as even the
agencies, and academics from various institutions and scientific backgrounds,
best available data on the number of people affected have drawbacks,
to discuss their experiences during Cyclones Idai and Kenneth, barriers and
such as to what degree these data indicate impacts of the storm itself, challenges in forecasting and response, differences between the two events, the
and, for example, information may be provided in terms of the number use and usefulness of the flood bulletins, and ways to move forward through
of households affected, but it is not clear how many people are assumed new collaborations and strengthening existing collaborations. The meeting was
per household. followed by a GloFAS training workshop for a group of academics and tech
nicians in Mozambique, and FATHUM collaborators from Uganda and Mali,
from 23–25 September 2019.
12R. Emerton et al. International Journal of Disaster Risk Reduction 50 (2020) 101811
flood bulletins that we do not yet have adequate systems in place to and with relevant information and details. The reports were widely
make the best use of scientific forecasts of natural hazards for interna circulated here in Mozambique (by different UN organizations etc).”
tional humanitarian actions both in terms of their real time nature and [Hanne Roden, Programme Coordinator, FbF Project Delegate,
the content. German Red Cross – Mozambique]
5.2. Cascading information to decision makers 5.3. How were the bulletins used in taking decisions?
The information provided in the bulletins was cascaded to high-level A key objective of the bulletins was to facilitate decision-making and
international organisations, the government of Mozambique, and local increased understanding of the situation and nature of the risk.5 While
partners and emergency response coordination centres (but not the we learn from partners that the ground-breaking element of the bulletins
public), in a number of ways. The government of Mozambique declared was the fact that it was “produced, shared and it informed” in real-time,
a state of emergency and formally requested international support it is more challenging to find out how this type of information directly
shortly after Cyclone Idai’s landfall. The humanitarian response was led informed decision-making. It is not always easy for organisations to
by the Mozambique Disaster Management Agency (INGC), which articulate how the bulletins were helpful. In emergency situations,
worked closely with UN OCHA, and the UN clusters. The bulletins were decision-makers are required to consider numerous and varying pieces
provided as an additional information resource to inform situational of information in order to take a balanced decision, and as such, a
awareness, preparedness and response planning, initially through specific contribution to a complex decision will always be difficult to
OCHA, which is mandated to coordinate humanitarian assistance with convey. Discussing the use of big data (and the so-called four Vs: Vol
the consent of the national authorities (UN General Assembly Resolution ume, Variety, Velocity and Value), for emergency decision-making in
46/182 [65]). UN OCHA’s situational reports (SitReps) drew directly the context of natural disasters, Zhou et al. [66] state “one of the
from the bulletins. These SitReps are public documents (available via important contents of natural disaster emergency decision lies in the
reports.unocha.org) and shared with the Government. The INGC way to describe the data with different sources, data mapping and
initially received the bulletins indirectly from OCHA and subsequently fusion, feature extraction and classification, quick and accurate access to
directly from DFID who commissioned them and were responsible for valuable information and intelligent decision in emergency response”.
their dissemination. Through the provision of information to DFID and The bulletins were therefore one piece of information amidst an array of
onwards to the UN OCHA, who included key points from the bulletins in other types of information within a wider system and in a complex sit
their daily situation reports, the information was able to reach a wide uation. Some operating organisations incorporated the bulletins into
range of decision-makers at international and local levels, in both gov their existing knowledge dissemination products (UN OCHA), yet for
ernment and humanitarian organisations. This led to UN OCHA formally others it was the first time they had received real-time information and
requesting reactivation of the bulletin production when forecasts indi might simply not yet know what to do with it. Furthermore, it is difficult
cated a second TC would impact Mozambique, and the same team were to evaluate whether the use of the bulletins enabled organisations to
able to provide these emergency forecast bulletins before Cyclone take better decisions than if they hadn’t had the information.
Kenneth’s landfall. Feedback from partners, both directly and through DFID, indicates
“UN humanitarian response actors stated that the reports produced that a key contribution of the bulletins was to assist in creating an
were “tremendously helpful as we continue to analyse the risks in the overview of the situation; where and when flooding was likely to occur,
days ahead”. UN OCHA extracted the key analysis to include into where there were more people at risk, and when the floods were likely to
their daily sitreps, which all humanitarian actors and the GoM recede. This was best done using a range of information from both the
[Government of Mozambique] use as a key reference point.” [Pro bulletins and other sources of local data.
fessor Charlotte Watts, Chief Scientific Advisor for DFID] “Ahead of Cyclone Kenneth, WHH was present in Mozambique
“The information was presented to WHH’s Emergency Response di responding to Cyclone Idai in Beira & Nhamatanda. The […] flood
rector on the ground in Mozambique and to the “Emergency Decision risk analysis was used shared together with other data to understand
Panel” – senior Management in Bonn, Germany, to facilitate the the situation in Cabo Delgado and get a first idea of the potential
decision” (to send part of the team to conduct an assessment in/ flood impact.” [Welthungerhilfe (WHH) via DFID]
around Pemba) [Welthungerhilfe (WHH) via DFID] “The bulletins were very helpful. They gave us an overview of which
In addition to providing the information to DFID and UN OCHA, we rivers were at greatest risk of flooding, and this helped inform where
were able to share the bulletins with national humanitarian and gov we gave the greatest attention to. We used them to help inform our
ernment organisations directly, through SHEAR collaborations with in- daily briefings to partners, as well as in our public information
country partners. This provided the opportunity for decision-makers to products. All of this meant that the humanitarian community had far
ask questions directly to the team involved in producing the bulletins, greater information, in real-time, about flood risks, than we have
and to receive the information faster than may have been possible often had access to in the past.” [Gemma Connell, Head of Regional
through the information cascade from high-level organisations. Feed UN OCHA in Southern and Eastern Africa]
back received from decision-makers and operational organisations was “Whether they specifically ‘redirected’ measures, I don’t know, but I
also useful for the team producing the bulletins and allowed us to refine am fairly sure that they assisted in creating the overview [of the
the methodology and format with each new bulletin produced. Through situation].” [Hanne Roden, Programme Coordinator, FbF Project
this process, we were also made aware of some key aspects of the situ Delegate, German Red Cross – Mozambique]
ation on the ground, which could be further incorporated into the
following flood bulletins and passed on to DFID, such as knowledge of a Through personal communication with DFID, we were informed that
dam in the area that may be at risk. This was important information to
highlight in the bulletins, as not all reservoirs are represented in the
5
GloFAS hydrological model, resulting in uncertainty in the flood fore It is important to note that national authorities have the mandate for early
casts around this location. warning and civil protection. Triggers for taking early humanitarian action
should always be based on forecasts and warnings from mandated national
“We/I only started receiving the reports when Kenneth had made authorities. In practice, information from international organisations and global
landfall in Cabo Delgado. Personally I found them very informative forecasting systems can be used to support the decision-making process.
13You can also read