Waimea Inlet Fine Scale Monitoring 2013/14 - Wriggle - Tasman District ...

 
CONTINUE READING
Waimea Inlet Fine Scale Monitoring 2013/14 - Wriggle - Tasman District ...
Wriggle                    coastalmanagement

  Wai m e a Inl e t
  Fine Scale Monitoring 2013/14

Prepared
for

Tasman
District
Council
June
2014
Waimea Inlet Fine Scale Monitoring 2013/14 - Wriggle - Tasman District ...
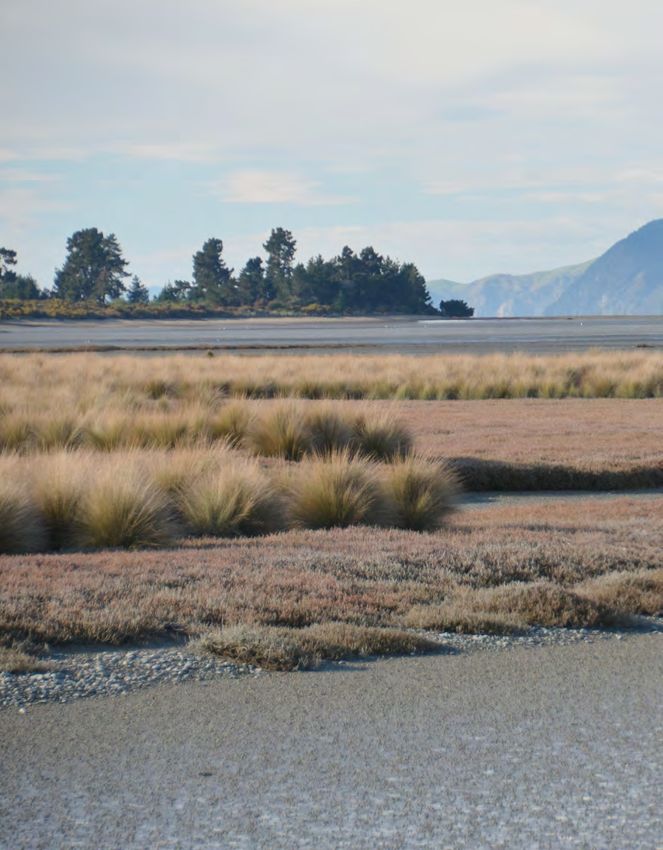
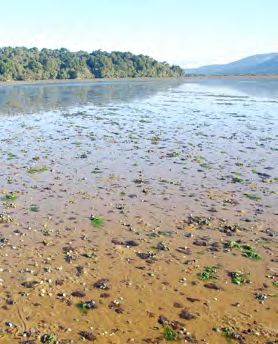
Cover Photo: Waimea Inlet.
Waimea Inlet Fine Scale Monitoring 2013/14 - Wriggle - Tasman District ...
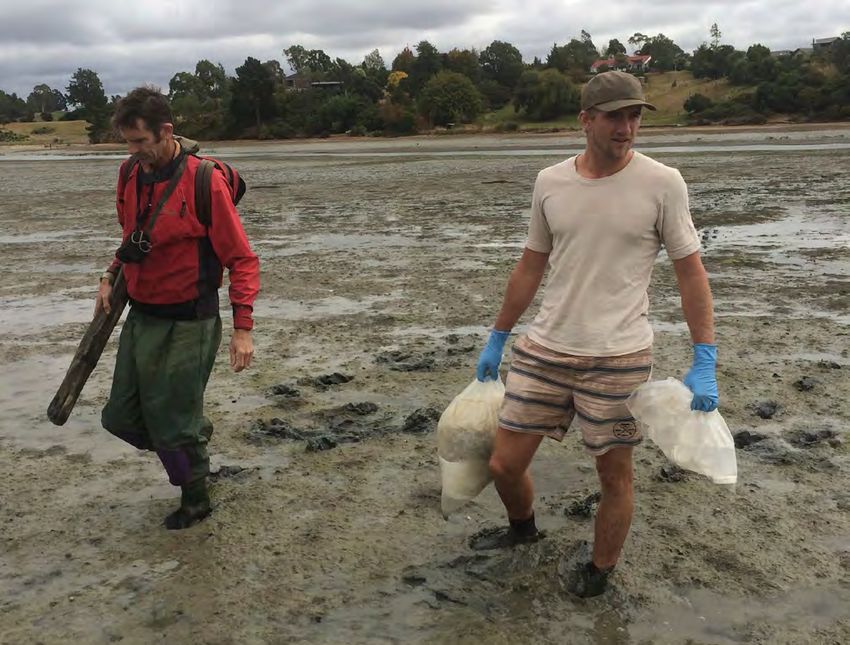
Waimea Inlet, Leigh Stevens and Ben Robertson near Site D, Hoddy Peninsula.

                                        Wai m e a Inl e t
                              Fine Scale Monitoring 2013/14

                                                 Prepared for
                                            Tasman District Council

                                                                By

                                 Ben Robertson and Barry Robertson

                       Wriggle Limited, PO Box 1622, Nelson 7040, Ph 03 540 3060, 021 417 936, www.wriggle.co.nz

                                                                                                     Wriggle       coastalmanagement   iii
Waimea Inlet Fine Scale Monitoring 2013/14 - Wriggle - Tasman District ...
Contents
Waimea Inlet - Executive Summary ���������������������������������������������������������������������������������������������������������������������������������������������� vii

1. Introduction �������������������������������������������������������������������������������������������������������������������������������������������������������������������������������������� 1

2. Estuary Risk Indicator Ratings������������������������������������������������������������������������������������������������������������������������������������������������������ 4

3. Methods���������������������������������������������������������������������������������������������������������������������������������������������������������������������������������������������� 5

4. Results and Discussion ������������������������������������������������������������������������������������������������������������������������������������������������������������������ 7

5. Summary and Conclusions ��������������������������������������������������������������������������������������������������������������������������������������������������������� 17

6. Monitoring���������������������������������������������������������������������������������������������������������������������������������������������������������������������������������������� 17

7. Management������������������������������������������������������������������������������������������������������������������������������������������������������������������������������������ 18

8. Acknowledgements���������������������������������������������������������������������������������������������������������������������������������������������������������������������� 18

9. References���������������������������������������������������������������������������������������������������������������������������������������������������������������������������������������� 18

Appendix 1. Details on Analytical Methods ������������������������������������������������������������������������������������������������������������������������������ 20

Appendix 2. 2014 Detailed Results ���������������������������������������������������������������������������������������������������������������������������������������������� 21

Appendix 3. Infauna Characteristics��������������������������������������������������������������������������������������������������������������������������������������������� 27

Appendix 4. Estuary Condition Risk Ratings����������������������������������������������������������������������������������������������������������������������������� 30

                                                                                      List of Tables
Table 1. Summary of the major environmental issues affecting most New Zealand estuaries. �������������������������������� 2

Table 2. Summary of estuary condition risk indicator ratings used in the present report. ���������������������������������������� 4

Table 3. Summary of physical, chemical and macrofauna results ��������������������������������������������������������������������������������������� 7

Table 4. Percent change in mean species numbers in each enrichment tolerance group, Waimea Inlet. ������������ 13

                                                                                     List of Figures
Figure 1. Waimea Inlet - location of fine scale monitoring sites.������������������������������������������������������������������������������������������ 6

Figure 2. Mean sediment mud content (±SE, n=3), Waimea Inlet, 2001-2014. ��������������������������������������������������������������� 8

Figure 3. Mean apparent Redox Potential Discontinuity (aRPD) depth at intertidal sites, 2001-2014. ������������������� 8

Figure 4. Mean total organic carbon (±SE, n=3) at intertidal sites, 2001-2014.���������������������������������������������������������������� 9

Figure 5. Mean total phosphorus (±SE, n=3) at intertidal sites, 2001-2014.���������������������������������������������������������������������� 9

Figure 6. Mean total nitrogen (±SE, n=3) at intertidal sites, 2001-2014. ���������������������������������������������������������������������������� 9

Figure 7. Principle coordinates analysis (PCO) ordination plots ���������������������������������������������������������������������������������������� 10

Figure 8. Mean number of species, abundance per core, and Shannon diversity index�������������������������������������������� 11

Figure 9. Mean abundance of major infauna groups, Waimea Inlet, 2001-2014.���������������������������������������������������������� 12

Figure 10. Benthic invertebrate mud/organic enrichment tolerance rating (±SE, n=3), 2001-2014.������������������������ 13

Figure 11. Mud and organic enrichment sensitivity of macro-invertebrates.���������������������������������������������������������������� 14

Figure 12. Sediment metal concentrations�������������������������������������������������������������������������������������������������������������������������������� 16

                                                                                                                                                           Wriggle            coastalmanagement          v
All photos by Wriggle except where noted otherwise.

                                                      Wriggle   coastalmanagement   vi
Wa im e a I N L E T - E x e c u ti v e S u mm a ry
   Waimea Inlet is one of the South Islands largest tidal lagoon estuaries (~3307ha intertidal area), located near Nelson
   City and Richmond in the Nelson/Tasman District. It is part of Tasman District Council’s (TDC’s) coastal State of the
   Environment (SOE) monitoring programme. This report summarises the results of four years of fine scale monitor-
   ing (2001, 2006, 2011, 2014) at four sites within Waimea Inlet. The monitoring results, risk indicator ratings, overall
   estuary condition, and monitoring and management recommendations are presented below.

   Fine Scale Results
    • Sediment mud content was relatively high, averaging 25-50%, and had increased by 23-176% from 2001.
    • Sediment oxygenation (aRPD depth) in 2014 was “moderate” (1cm) and had reduced since 2001 (2-3cm).
    • Although total organic carbon (TOC) was in the “low to very low” risk category in 2014, the results reflect a
      significant upward trend between 2001 and 2014 (range, 47-212% increase across all sites). Sediment nutrients,
      total nitrogen (TN) and total phosphorus (TP), were in the “low-moderate” risk categories and showed no sig-
      nificant trend of change at any site between 2001-2014.
    • Macro-invertebrates consisted of a mixed assemblage of species. Statistical analysis showed no significant differences
      at a community level between 2001-2014, but at a micro or individual species level, there were significant differences.
      In particular, a significant reduction in species that were highly sensitive to mud/organic enrichment (e.g. pipi).
    • Sediment toxicants (heavy metals (Cd, Cr, Cu, Hg, Ni, Pb, Zn), arsenic and semi-volatile organic compounds)
      were at concentrations that were not expected to pose toxicity threats to aquatic life.

                                                                                        Low                Moderate             Very High
   CONDITION RISK RATINGS                           Risk Ratings Key:
                                                                                        Very Low           High                 Not measured

                                 East Arm Site A              East Arm Site C             West Arm Site B        West Arm Site D
                                                                                                                                         2001-2014 Key Trends
                                      2006

                                                                   2006

                                                                                                   2006

                                                                                                                        2006
                               2001

                                                            2001

                                                                                           2001

                                                                                                                 2001
                                                    2014

                                                                                 2014

                                                                                                          2014

                                                                                                                                 2014
                                             2011

                                                                          2011

  Sediment Mud Content                                                                                                                          Increasing

  Sediment Oxygenation RPD                                                                                                                     Decreasing

  TOC (Total Organic Carbon)                                                                                                                   Increasing

  TN (Total Nitrogen)                                                                                                                          No trends

  TP (Total Phosphorus)                                                                                                                         No trends

  Toxicants                                                Very low-low risk across all sites and years                                        No trends

  Macro-invertebrates                                                                                                                          No trends

   ESTUARY CONDITION AND ISSUES
   Overall, these 2001-2014 results from each of the four sites indicate that the dominant unvegetated habitat in
   Waimea Inlet is very muddy, has got progressively muddier since 2001, and has low-moderate levels of organic
   enrichment and toxicity. Although the sites have not shown any broad trends of change in the macro-invertebrate
   community since 2001, losses in mud sensitive organisms (e.g. pipi) have occurred since that time. Given the mag-
   nitude of the muddiness between the 2001 and 2014, it is recommended that annual monitoring be undertaken
   for the next two years to establish whether the deteriorating results observed in 2014 are truly representative of
   current conditions. This recommendation is supported by the findings of the broad scale mapping of soft muddy
   sediments and nuisance macroalgae (Stevens and Robertson 2014).

   RECOMMENDED MONITORING AND MANAGEMENT
   In order to assess ongoing trends in the fine scale condition of the estuary it is recommended that sites A, C and D
   be monitored again (data collection only) in February 2015, and 2016 to establish a multi-year baseline, and under-
   take a full report of all data at the next scheduled 5 yearly monitoring interval (2020/21). Broad scale sedimenta-
   tion rate monitoring should continue at annual intervals, and broad scale mapping every 5 years (next due in 2019).
   Increased muddiness has been identified as a major issue in Waimea since at least 2010 (Stevens and Robertson
   2010). To identify the sources of this issue, it is recommended that catchment inputs be assessed through a combi-
   nation of modeling and monitoring and that a sediment reduction plan be instigated.
   Overall, if the estuary and its surroundings are managed to ensure that the assimilative capacity for muds is not
   breached, then the estuary will flourish and provide sustainable human use and ecological values in the long term.

                                                                                                                               Wriggle      coastalmanagement   vii
Wriggle   coastalmanagement   viii
1 . I ntr o d u cti o n
Overview   Developing an understanding of the condition and risks to coastal and estuarine habitats is
           critical to the management of biological resources. These objectives, along with understanding
           change in condition/trends, are key objectives of Tasman District Council’s State of the Environ-
           ment Estuary monitoring programme. Recently, Tasman District Council (TDC) undertook a
           vulnerability assessment of the region’s coastlines to establish priorities for a long-term monitor-
           ing programme (Robertson and Stevens 2012). The assessment identified the Waimea, Motueka
           Delta, Motupipi, Ruataniwha and Whanganui estuaries as priorities for monitoring.
           For Waimea Inlet, the monitoring and management process consists of three components devel-
           oped from the National Estuary Monitoring Protocol (NEMP) (Robertson et al. 2002) as follows:

           1. Ecological Vulnerability Assessment (EVA) of the estuary to major issues (see Table 1) and appro-
              priate monitoring design. Both estuary specific (Stevens and Robertson 2010) and region-wide EVAs have been
              undertaken (Robertson and Stevens 2012) providing specific recommendations for Waimea Inlet.
           2. Broad Scale Habitat Mapping (NEMP approach). This component (see Table 1) documents the key
              habitats within the estuary, and changes to these habitats over time. Broad scale mapping of Waimea Inlet was
              undertaken in 2001 (Robertson et al. 2002), and historical vegetation cover assessed from 1946 and 1985 aerial
              photographs (Tuckey and Robertson 2003). Broad scale habitat mapping was repeated in 2006 (Clarke et al.
              2008), and in 2014 (Stevens and Robertson 2014).
           3. Fine Scale Monitoring (NEMP approach). Monitoring of physical, chemical and biological indicators (see
              Table 1). This component, which provides detailed information on the condition of Waimea Inlet, was undertaken
              in 2001 (Robertson et al. 2002) and 2006 (Gillespie et al. 2007). Additionally, sedimentation rates in the estuary
              have been monitored annually by TDC at ten sites since 2008 and sites A and C monitored in 2011.
           In 2013, TDC commissioned Wriggle Coastal Management to undertake a repeat of the fine scale
           monitoring of Waimea Inlet previously undertaken in 2001(Robertson et al. 2002) and 2006
           (Gillespie et al. 2007). The current report describes the 2014 fine scale results and compares
           them to the previous findings.
           Waimea Inlet has been previously described as a relatively large-sized (~3,460ha), macrotidal (3.66m
           spring tidal range), shallow (mean depth ~1-2m at high water), well-flushed (residence time
Table 1. Summary of the major environmental issues affecting most New Zealand estuaries.

1. Sedimentation
  Because estuaries are a sink for sediments, their natural cycle is to slowly infill with fine muds and clays (Black et al. 2013). Prior to European set-
  tlement they were dominated by sandy sediments and had low sedimentation rates (
Table 1. Summary of major environmental issues affecting New Zealand estuaries (continued).

3. Disease Risk
  Runoff from farmland and human wastewater often carries a variety of disease-causing organisms or pathogens (including viruses, bacteria and
  protozoans) that, once discharged into the estuarine environment, can survive for some time (e.g. Stewart et al. 2008). Every time humans come
  into contact with seawater that has been contaminated with human and animal faeces, we expose ourselves to these organisms and risk getting
  sick. Human diseases linked to such organisms include gastroenteritis, salmonellosis and hepatitis A (Wade et al. 2003). Aside from serious health
  risks posed to humans through recreational contact and shellfish consumption, pathogen contamination can also cause economic losses due to
  closed commercial shellfish beds.
  Recommended Key Indicators:
    Issue             Recommended Indicators                 Method
    Disease Risk      Shellfish and Bathing Water faecal     Bathing water and shellfish disease risk monitoring (Council or industry driven).
                      coliforms, viruses, protozoa etc.

4. Toxic Contamination
  In the last 60 years, NZ has seen a huge range of synthetic chemicals introduced to the coastal environment through urban and agricultural storm-
  water runoff, groundwater contamination, industrial discharges, oil spills, antifouling agents, leaching from boat hulls, and air pollution. Many
  of them are toxic even in minute concentrations, and of particular concern are polycyclic aromatic hydrocarbons (PAHs), heavy metals, polychlo-
  rinated biphenyls (PCBs), endocrine disrupting compounds, and pesticides. When they enter estuaries these chemicals collect in sediments and
  bio-accumulate in fish and shellfish, causing health risks to marine life and humans. In addition, natural toxins can be released by macroalgae and
  phytoplankton, often causing mass closures of shellfish beds, potentially hindering the supply of food resources, as well as introducing economic
  implications for people depending on various shellfish stocks for their income. For example, in 1993, a nationwide closure of shellfish harvesting
  was instigated in NZ after 180 cases of human illness following the consumption of various shellfish contaminated by a toxic dinoflagellate, which
  also lead to wide-spread fish and shellfish deaths (de Salas et al. 2005). Decay of organic matter in estuaries (e.g. macroalgal blooms) can also cause
  the production of sulphides and ammonia at concentrations exceeding ecotoxicity thresholds.
   Recommended Key Indicators:
    Issue             Recommended Indicators                 Method
    Toxins            Sediment Contaminants                  Chemical analysis of heavy metals (total recoverable cadmium, chromium, copper, nickel, lead and
                                                             zinc) and any other suspected contaminants in sediment samples.
                      Biota Contaminants                     Chemical analysis of suspected contaminants in body of at-risk biota (e.g. fish, shellfish).
                      Biodiversity of Bottom Dwelling        Type and number of animals living in the upper 15cm of sediments (infauna in 0.0133m2 replicate
                      Animals                                cores), and on the sediment surface (epifauna in 0.25m2 replicate quadrats).

5. Habitat Loss
  Estuaries have many different types of high value habitats including shellfish beds, seagrass meadows, saltmarshes (rushlands, herbfields,
  reedlands etc.), tidal flats, forested wetlands, beaches, river deltas, and rocky shores. The continued health and biodiversity of estuarine systems
  depends on the maintenance of high-quality habitat. Loss of such habitat negatively affects fisheries, animal populations, filtering of water pollut-
  ants, and the ability of shorelines to resist storm-related erosion. Within New Zealand, habitat degradation or loss is common-place with the major
  causes being sea level rise, population pressures on margins, dredging, drainage, reclamation, pest and weed invasion, reduced flows (damming
  and irrigation), over-fishing, polluted runoff, and wastewater discharges (IPCC 2007 and 2013, Kennish 2002).
  Recommended Key Indicators:
    Issue             Recommended Indicators                 Method
    Habitat Loss      Saltmarsh Area                         Broad scale mapping - estimates the area and change in saltmarsh habitat over time.
                      Seagrass Area                          Broad scale mapping - estimates the area and change in seagrass habitat over time.
                      Vegetated Terrestrial Buffer           Broad scale mapping - estimates the area and change in buffer habitat over time.
                      Shellfish Area                         Broad scale mapping - estimates the area and change in shellfish habitat over time.
                      Unvegetated Habitat Area               Broad scale mapping - estimates the area and change in unvegetated habitat over time, broken
                                                             down into the different substrate types.
                      Sea level                              Measure sea level change.
                      Others e.g. Freshwater Inflows, Fish   Various survey types.
                      Surveys, Floodgates, Wastewater
                      Discharges

                                                                                                                            Wriggle         coastalmanagement   3
2 . Est ua ry ris k I ndic ato r r atin g s
                         The estuary monitoring approach used by Wriggle has been established to provide a defen-
                         sible, cost-effective way to help quickly identify the likely presence of the predominant issues
                         affecting NZ estuaries (i.e. eutrophication, sedimentation, disease risk, toxicity and habitat
                         change; Table 1), and to assess changes in the long term condition of estuarine systems. The
                         design is based on the use of primary indicators that have a documented strong relationship
                         with water or sediment quality.
                         In order to facilitate this assessment process, “risk indicator ratings” that assign a relative level
                         of risk (e.g. very low, low, moderate, high, very high) of specific indicators adversely affecting
                         intertidal estuary condition have been proposed (see Table 2 below). Each risk indicator rat-
                         ing is designed to be used in combination with relevant information and other risk indicator
                         ratings, and under expert guidance, to assess overall estuarine condition in relation to key
                         issues, and make monitoring and management recommendations. When interpreting risk
                         indicator results we emphasise:
                         •    The importance of taking into account other relevant information and/or indicator
                              results before making management decisions regarding the presence or significance of
                              any estuary issue.
                         •    That rating and ranking systems can easily mask or oversimplify results. For instance,
                              large changes can occur within a risk category, but small changes near the edge of one
                              risk category may shift the rating to the next risk level.
                         •    Most issues will have a mix of primary and secondary ratings, primary ratings being
                              given more weight in assessing the significance of indicator results. It is noted that many
                              secondary estuary indicators will be monitored under other programmes and can be
                              used if primary indicators reflect a significant risk exists, or if risk profiles have changed
                              over time.
                         •    Ratings have been established in many cases using statistical measures based on NZ es-
                              tuary data. However, where such data is lacking, or has yet to be processed, ratings have
                              been established using professional judgement, based on our experience from monitor-
                              ing numerous NZ estuaries. Our hope is that where a high level of risk is identified, the
                              following steps are taken:
                              1. Statistical measures be used to refine indicator ratings where information is lacking.
                              2. Issues identified as having a high likelihood of causing a significant change in eco-
                                 logical condition (either positive or negative), trigger intensive, targeted investiga-
                                 tions to appropriately characterise the extent of the issue.
                              3. The outputs stimulate discussion regarding what an acceptable level of risk is, and
                                 how it should best be managed.

                         The indicators and risk ratings used for the Waimea Inlet fine scale monitoring programme
                         are summarised in Table 2, and detailed background notes explaining the use and justifica-
                         tions for each indicator are presented in Appendix 4.
Table 2. Summary of estuary condition risk indicator ratings used in the present report.
                                                                                  RISK RATING
 INDICATOR
                                           Very Low               Low                 Moderate                High               Very High
 Apparent Redox Potential Disconti-   >10cm depth below    3-10cm depth below    1-25%
                                             0-1.2              >1.2-3.3               >3.3-5.0             >5.0-6.0               >6.0
 Macro-invertebrate Enrichment
                                       Intolerant of en-    Tolerant of slight   Tolerant of moderate    Tolerant of high     Azoic (devoid of
 Index (WEBI)
                                       riched conditions       enrichment             enrichment           enrichment        invertebrate life)
 Total Organic Carbon (TOC)                 500-1000mg/kg         >1000mg/kg
                                                             0.2 x ISQGLo to       >0.5 x ISQGLo to
 Metals                                 ISQGHi mg/kg
                                                              0.5 x ISQGLo             ISQGLo

                                                                                                                Wriggle      coastalmanagement     4
3 . M e t h o ds
 Fine scale monitoring
 Fine scale monitoring is based on the methods described in the National Estuary Monitoring Protocol (NEMP;
 Robertson et al. 2002) and provides detailed information on indicators of chemical and biological condition of
 the dominant habitat type in the estuary. This is most commonly unvegetated intertidal mudflats at low-mid
 water (avoiding areas of significant vegetation and channels). Using the outputs of the broad scale habitat
 mapping, representative sampling sites (usually two per estuary, but varies with estuary size) are selected and
 samples collected and analysed for the following variables.
    •   Salinity, Oxygenation (apparent Redox Potential Discontinuity - aRPD), Grain size (% mud, sand, gravel).
    •   Organic Matter: Total organic carbon (TOC).
    •   Nutrients: Total nitrogen (TN), Total phosphorus (TP).
    •   Heavy metals and metalloids: Cadmium (Cd), Chromium (Cr), Copper (Cu), Lead (Pb), Nickel (Ni), and Zinc (Zn).
    •   Macro-invertebrate abundance and diversity (infauna and epifauna).
    •   Other potentially toxic contaminants: these are measured in certain estuaries where a risk has been identified.
 For the Waimea Inlet, four fine scale sampling sites (Figure 3) were selected in unvegetated, mid-low water
 mudflats (Robertson et al. 2002) (note; in 2011 only sites A and C were sampled). At all sites, a 60m x 30m area in
 the lower intertidal was marked out and divided into 12 equal sized plots. Within each area, ten plots were se-
 lected, a random position defined within each (precise locations are in Appendix 1), and the following sampling
 undertaken:
Physical and chemical analyses.
 • Within each plot, one random core was collected to a depth of at least 100mm and photographed alongside
   a ruler and a corresponding label. Colour and texture were described and average apparent Redox Potential
   Discontinuity (aRPD) depth recorded.
 • At each site, three samples (two a composite from four plots and one a composite from two plots) of the top
   20mm of sediment (each approx. 250gms) were collected adjacent to each core. All samples were kept in
   a chillybin in the field. For semi-volatile organic contaminants (SVOCs), a composite sample was collected
   from each of the 4 sites (by subsampling each of the 10 replicates).
 • Chilled samples were sent to R.J. Hill Laboratories for analysis of the following (details of lab methods and
   detection limits in Appendix 1):
          *     Grain size/Particle size distribution (% mud, sand, gravel).
          *     Nutrients - total nitrogen (TN), total phosphorus (TP), and total organic carbon (TOC).
          *     Trace metals (Cd, Cr, Cu, Ni, Pb, Zn, Hg), arsenic, and semi-volatile organic compounds (SVOCs). Analyses
                were based on whole sample fractions which are not normalised to allow direct comparison with the Aus-
                tralian and New Zealand Guidelines for Fresh and Marine Water Quality (ANZECC 2000).
 • Samples were tracked using standard Chain of Custody forms and results were checked and transferred elec-
   tronically to avoid transcription errors.
 • Photographs were taken to record the general site appearance.
 • Salinity of the overlying water was measured at low tide.
Epifauna (surface-dwelling animals).
 Visually conspicuous epifauna within the 60m x 30m sampling area were semi-quantitatively assessed based on
 the UK MarClim approach (MNCR 1990, Hiscock 1996, 1998). Epifauna species were identified and allocated a
 SACFOR abundance category based on percentage cover (Appendix 1, Table A), or by counting individual organ-
 isms >5mm in size within quadrats placed in representative areas (Appendix 1, Table B). Species size determined
 both the quadrat size and SACFOR density rating applied, while photographs were taken and archived. This
 method is ideally suited to characterise often patchy intertidal epifauna, and macroalgal/microalgal cover.
Infauna (animals within sediments).
 • One randomly placed sediment core (130mm diameter (area = 0.0133m2 ) PVC tube) was taken from each of ten plots.
 • The core tube was manually driven 150mm into the sediments, and the core transferred to a labelled plastic bag.
 • Once all replicates had been collected at a site, the plastic bags were transported to a nearby source of seawater and
    the contents of the core were washed through a 0.5mm nylon mesh bag. The infauna remaining were carefully emp-
    tied into a plastic container with a waterproof label and preserved in 70% isopropyl alcohol - seawater solution.
 • The samples were then transported to a commercial laboratory for counting and identification (Gary Stephenson,
    Coastal Marine Ecology Consultants, Appendix 1).
 • Infauna data analysis is discussed in Section 4.

                                                                                                             Wriggle      coastalmanagement   5
3 . Me tho d s (Co nt i nued )
                                                                                              TDC NCC Boundary

                                                           Tasman Bay

                   MAPUA

                     Site B
                                                 Rabbit
                     Waimea Inlet                Island

                              Site D                                                                               Nelson
                                                                                                     TAHUNANUI

                                                                         Site C

                                                               Waimea Inlet
                                                                                             STOKE

                                                                              Site A

                                                                                  Richmond

Figure 1. Waimea Inlet - location of fine scale monitoring sites.

                                                                                             Wriggle        coastalmanagement   6
4 . R e s u lts a nd D isc u ssi o n
    A summary of the results of the 11-12 March 2014 fine scale monitoring of Waimea Inlet, together with the 2001,
    2006 fine scale results, is presented in Table 3, with detailed results in Appendices 2 and 3. Data collected from two
    of the fine scale sites in 2011 are also included.
Table 3. Summary of physical, chemicala and macrofauna results (means) for four fine scale sites (2001-2014).
                       aRPD Salinity       TOC b     Mud         Sand   Gravel      Cd        Cr        Cu        Ni        Pb        Zn       TN          TP    Abundance      Richness
          Site
                        cm        ppt                        %                                                         mg/kg                                      No./core    Species/core
        2001 A           3         -        0.27      28.2       69.2     2.6
4 . Resu lt s and D i s c u s s i on (Cont i nued )
                                                                                                                                                                                                 The trend analysis results show there has been
                                                                                                                                                                                                 a clear decline in substrate condition, and the
                                   60                Site A                                    Site B                         Site C                            Site D                           risk indicator ratings highlight that a likely
                                                                                                                                                                                     Very High
                                                                                                                                                                                                 consequence is adverse impacts to benthic
                                                                                                                                                                                     High
                                                                                                                                                               P = 0.612
                                                                                                                                                                                     Fair        macro-invertebrates (investigated further on
                                   50
                                                  P = 0.005*                                                                                                                         Low         pages 10-12).
        Sediment mud content (%)

                                                                                                                                                                                     Very Low
                                                                                                                                                                                                 The reason for this upward trend in mud
                                   40                                                                                                                                                            content is currently unclear but may possibly
                                                                                                                                                                                                 reflect an increase in the mud proportion of
                                   30                                                   P = 0.001*                    P
4 . Resu lt s and D i s c u s s i on (Cont i nued )
                                           Site A                     Site B                     Site C                     Site D
                                                                                                                                                        The primary driver of the decline in aRPD from
                              6                                                                                                                         2001 to 2014 is the increased mud content
                                                                                                                                            Very High
                                                                                                                                                        (Figure 2) at the sites, rather than macroalgal
                              5                                                                                                             High
                                                                                                                                                        enrichment due to the generally low macroalgal
Total Organic Carbon (%)

                                                                                                                                            Moderate    cover present at the fine scale sites.
                              4
                                                                                                                                            Low
                                                                                                                                                        Total Organic Carbon and Nutrients
                                                                                                                                            Very Low    The concentrations of sediment organic matter
                              3
                                                                                                                                                        (TOC) and to a limited extent, nutrients (TN and
                              2                                                                                                                         TP) provide valuable trophic state information.
                                                                                                                                                        In particular, if concentrations are elevated,
                              1                                                                                                                         and eutrophication symptoms are present (i.e.
                                                                                                                                                        shallow aRPD, excessive algal growth, high WEBI
                              0                                                                                                                         biotic coefficient - see the macro-invertebrate
                                                                                                       2011
                                                                                         2001

                                                                                                                     2001
                                                                                                2006

                                                                                                              2014

                                                                                                                                     2014
                                           2006

                                                           2014

                                                                           2006
                                                                                  2014

                                                                                                                             2006
                                                                   2001
                                   2001

                                                   2011

                                                                                                                                                        condition section below), then TN, TP and TOC
                                                                                                                                                        concentrations provide a good indication that
Figure 4. Mean total organic carbon (±SE, n=3) at intertidal sites,                                                                                     loadings are exceeding the assimilative capac-
2001-2014.                                                                                                                                              ity of the estuary. However, a low TOC, TN, or
                                                                                                                                                        TP concentration does not in itself indicate an
                                           Site A                         Site B                 Site C                     Site D
                            2000                                                                                                                        absence of eutrophication symptoms. It may be
                                                                                                                                            Very High
                                                                                                                                                        that the estuary, or part of an estuary, may have
Total Phosphorous (mg/kg)

                                                                                                                                            High        reached a eutrophic condition and exhausted
                            1600
                                                                                                                                            Moderate    the available nutrient supply. Obviously, the lat-
                                                                                                                                            Low         ter case is likely to better respond to input load
                            1200
                                                                                                                                            Very Low    reduction than the former.
                                                                                                                                                        The 2014 results showed TOC (~0.5%) and TN
                            800
                                                                                                                                                        (~500mg/kg) were in the “low” risk indicator
                                                                                                                                                        rating, while TP was rated “moderate” (Figures
                            400                                                                                                                         4, 5, and 6). The low TOC levels reflect the well-
                                                                                                                                                        flushed nature of much of the estuary, and a
                              0                                                                                                                         likely moderate load of organic matter, sourced
                                                                                                       2011
                                                                                         2001

                                                                                                                     2001
                                                                                                2006

                                                                                                              2014

                                                                                                                                    2014
                                            2006

                                                            2014

                                                                           2006
                                                                                  2014

                                                                                                                             2006
                                                                   2001
                                    2001

                                                    2011

                                                                                                                                                        primarily from the catchment. Although the
                                                                                                                                                        TOC results show a significant increase across
Figure 5. Mean total phosphorus (±SE, n=3) at intertidal sites,                                                                                         all sites between 2001 and 2014 (i.e. 100% for
2001-2014.                                                                                                                                              Site A, 81% for Site B, 212% for Site C, and 47%
                                                                                                                                                        for Site D; Man-Kendall P0.05 at all sites).
                                                                                                                                                        Overall, the physico-chemical results indicate
                               0                                                                                                                        that the substrate conditions at the sites were as
                                                                                                       2011
                                                                                         2001

                                                                                                                     2001
                                                                                                2006

                                                                                                              2014

                                                                                                                                    2014
                                            2006

                                                            2014

                                                                           2006
                                                                                  2014

                                                                                                                             2006
                                                                   2001
                                    2001

                                                    2011

                                                                                                                                                        follows:
Figure 6. Mean total nitrogen (±SE, n=3) at intertidal sites, 2001-
                                                                                                                                                        •     very muddy
2014.                                                                                                                                                   •     moderately oxygenated
                                                                                                                                                        •     low organic carbon concentrations
                                                                                                                                                        •     low-moderate nutrient concentrations

                                                                                                                                                                              Wriggle     coastalmanagement   9
4 . Resu lt s and D i s c u s s i on (Cont i nued )
Benthic Macro-invertebrate Community

Benthic macro-invertebrate communities are considered good indicators of ecosystem health in shallow estuar-
ies because of their strong linkage to sediments and, secondarily, to the water column (Dauer et al. 2000, Thrush
et al. 2003, Warwick and Pearson 1987). Because they integrate recent pollution history in the sediment, macro-
invertebrate communities are therefore very effective in showing the combined effects of pollutants or stressors.
The response of macro-invertebrates to stressors in Waimea Inlet has been examined in three steps:
1. Ordination plots to enable an initial visual overview (in 2-dimensions) of the spatial and temporal structure
     of the macro-invertebrate community among fine scale sites sampled between 2001-2014.
2. Assessment of species richness, abundance, diversity and major infauna groups.
3. Assessment of the response of the macro-invertebrate community to increasing mud and organic matter
     over the 13 years of monitoring based on identified tolerance thresholds for NZ taxa (Robertson 2013).

Macro-invertebrate Community Ordination
Principle Coordinates Analysis (PCO) shows that, based on between-year species abundance data collected
over the period 2001-2014, the invertebrate community at Sites B and D appeared somewhat distinct from one
another, while the community at Sites A and C appeared to maintain a similar structure (Figure 7). However, de-
spite these apparent differences, and the temporal trends in physico-chemical conditions, subsequent statistical
analyses revealed no significant differences at any site (i.e. PERMANOVA P>0.05 for all sites, for all between-year
comparisons), indicating negligible structural changes to the invertebrate community over this period.
Figure 7 shows the relationship
among samples in terms of similarity                                                40                                                                                                           60
                                                                                             Site A                                                                                                   Site B
                                                                                                                                            Key                                                                                                      Key
                                                                                                                                                  2001                                                                                                     2001
in macro-invertebrate community                                                     30                                                            2006                                                                                                     2006

composition at Sites A, B, C and D                                                                                                                2011                                                                                                     2014
                                                  PCO2 (23.2% of total variation)

                                                                                                                                                              PCO2 (34.1% of total variation)

                                                                                                                                                  2014                                           40
for the sampling period 2001-2014.                                                  20
The plot shows the means of the 3                                                   10
replicate samples for each site (1 rep                                                                                                                                                           20
for Sites A and C in 2011) and is based                                               0
on Bray Curtis dissimilarity and                                                                                                                                                                  0
                                                                                    -10
square root transformed data. The
approach involves an unconstrained                                                  -20
                                                                                                                                                                                           -20
multivariate data analysis method, in
                                                                                    -30
this case principle coordinates analy-                                                    PERMANOVA: P > 0.05 (for all inter-year comparisons)                                                        PERMANOVA: P > 0.05 (for all inter-year comparisons)
sis (PCO) using PERMANOVA version                                                   -40                                                                                                 -40
1.0.5 (PRIMER-e v6.1.15). The analysis                                                 -40      -25      -10     5     20     35     50     65           80                               -40                   -20             0            20                   40
                                                                                                         PCO1 (40.4% of total variation)                                                                        PCO1 (40.7% of total variation)
plots the site and abundance data
                                                                                    30                                                                                                           20
for each species as points on a dis-                                                         Site C
                                                                                                                                            Key
                                                                                                                                                  2001                                                Site D
                                                                                                                                                                                                                                                     Key
                                                                                                                                                                                                                                                           2001
tance-based matrix (a scatterplot or-                                                                                                            2006                                                                                                  2006
                                                                                    20
                                           PCO2 (25.2% of total variation)

                                                                                                                                                               PCO2 (21.2% of total variation)

                                                                                                                                                 2011                                                                                                  2014
dination diagram). Points clustered                                                                                                              2014

together are considered similar, with
                                                                                    10
the distance between points and
clusters reflecting the extent of the                                                                                                                                                             0
                                                                                     0
differences. The interpretation of
the ordination diagram(s) depends
on how good a representation it                                                     -10
is of actual dissimilarities (i.e. how
much of the variation in the data                                               -20
matrix is explained by the first two                                                         PERMANOVA: P > 0.05 (for all inter-year comparisons)                                                     PERMANOVA: P > 0.05 (for all inter-year comparisons)
PCO axis). For the present plots, the                                               -30                                                                                                  -20
                                                                                       -20         -10          0           10         20                30                                 -40                       -20               0                         20
cumulative variation explained was
                                                                                                         PCO1 (38.3% of total variation)                                                                        PCO1 (43.3% of total variation)
>60% for all sites, indicating a good
representation of the abundance
matrix. Finally, PERMANOVA tests
for statistical significant differences
                                          Figure 7. Principle coordinates analysis (PCO) ordination plots reflecting struc-
in the invertebrate communities           tural differences in the macro-invertebrate community at each site, Waimea
among samples, which, for all sites in    Inlet, 2001-2014.
the present dataset, reflected no sig-
nificant (P>0.05) structural changes
over the sampling period 2001-2014.

                                                                                                                                                                                                                  Wriggle           coastalmanagement             10
4 . Resu lt s and D i s c u s s i on (Cont i nued )
Species Richness, Abundance, Diversity and Infauna Groups
 Species richness (the mean number of species per core) in 2014 was 9.4 at Site A, 8 at Site B, 11.7 at Site C, and
 9.4 at Site D, while species abundance (the mean number of individuals per core) was 33.8 at Site A, 14.6 at Site
 B, 57.5 at Site C, and 32.4 at Site D (Table 3, Figure 8). The Shannon diversity index was similar for most sites and
 years and ranged from 1.74-2.09. Mann-Kendall analysis detected no clear directional trends for either species
 richness, abundance or Shannon diversity index across all sites between 2001-2014 (see Figure 8). The abun-
 dance of each of the major infauna groups are compared in Figure 9, and shows dominance by polychaetes,
 crustacea, bivalves and gastropods. The most notable difference between sites was that Site B had lower
 overall species richness and abundance compared to the other sites. This most likely reflects its relatively high
 position on the shore compared to the other sites, effectively increasing its natural stress exposure (i.e. salinity,
 wave exposure, temperature, desiccation). Consequently, analysis of Site B data should be considered sepa-
 rately or, if a more representative site can be identified, then relocation would be an option.

                2001                                                                       2001
                2006                                                                       2006
                                                 P = 0.75                    Site A                                            P = 0.75          Site A
                2011                                                                       2011
                2014                                                                       2014

                2001                                                                       2001
                2006                      P = 1.00                           Site B        2006             P = 0.33                             Site B
                2014                                                                       2014

                2001                                                                       2001
                2006                                                                       2006
                                                         P = 0.75            Site C                                                  P = 0.75    Site C
                2011                                                                       2011
                2014                                                                       2014

                2001                                                                       2001
                2006                            P = 0.33                     Site D        2006                           P = 1.00               Site D
                2014                                                                       2014

                       0    5      10        15         20                 25                     0   20   40 60 80 100 120 140 160
                           Mean number of species (per core)                                                Mean abundance (per core)

                                              2001
                                              2006
                                                                                      P = 0.75                   Site A
                                              2011
                                              2014

                                              2001
                                              2006                                    P = 1.00                   Site B
                                              2014

                                              2001
                                              2006                                                               Site C
                                                                                      P = 0.75
                                              2011
                                              2014

                                              2001
                                              2006                                     P = 0.33               Site D
                                              2014

                                                     0              1          2       3          4          5
                                                                        Mean Shannon diversity index (H)
Figure 8. Mean number of species, abundance per core, and Shannon diversity index (±SE, n=3), Waimea Inlet,
2001-2014. Note: Overlaid Mann-Kendall P>0.05 for all sites, indicate no significant differences in either species richness, abundance or
Shannon diversity index between 2001 and 2014.

                                                                                                                                       Wriggle   coastalmanagement   11
4 . Resu lt s and D i s c u s s i on (Cont i nued )
                                                            Site A                      Site B                  Site C                Site D

                                               120
                                                                                                                                                         Insecta

                                               100                                                                                                       Crustacea
                                                                                                                                                         Bivalvia
                                                                                                                                                         Gastropoda
                   Mean Abundance (per core)

                                                                                                                                                         Oligochaeta
                                               80

                                                                                                                                                         Polychaeta
                                                                                                                                                         Sipuncula
                                                                                                                                                         Nematoda
                                               60

                                                                                                                                                         Nemertea
                                                                                                                                                         Anthozoa
                                               40
                                               20
                                               0

                                                                                                                             2014

                                                                                                                                    2001
                                                                                                                                           2006
                                                     2001
                                                            2006
                                                                   2011
                                                                          2014

                                                                                 2001
                                                                                         2006
                                                                                                 2014

                                                                                                        2001
                                                                                                               2006
                                                                                                                      2011

                                                                                                                                                  2014
Figure 9. Mean abundance of major infauna groups (n=3), Waimea Inlet, 2001-2014.

Overall, the results using whole community, rather than species level approaches, indicates negligible changes to the
invertebrate community structure between 2001-2014. The following section explores the community composition
in more detail, specifically in relation to the observed elevated mud and TOC concentrations.

Macro-invertebrate Community in Relation to Mud and Organic Enrichment
Organic matter and mud are major determinants of the structure of the benthic invertebrate community. The previ-
ous section has already established that there were no clear trends of change in species abundance, richness or di-
versity between 2001 and 2014, despite an obvious increasing trend in mud and TOC contents and a decline in aRPD.
The following analyses explore the macrofaunal results in greater detail using two steps as follows:
1. WEBI Mud and Organic Enrichment Index
The first approach is undertaken by using the WEBI mud/organic enrichment rating (Appendix 4), which is basically
the AMBI (Borja at al. 2000) approach but modified by using the sensitivity ratings for NZ macrofauna (Robertson
2013). The WEBI approach is clearly is an improvement on the AMBI approach for NZ estuary macrofauna, but be-
cause it still relies on the AMBI formula, and therefore does not directly account for species richness, its results must
be considered alongside a range of other relevant indicators before a reliable conclusion is reached.
WEBI biotic coefficients, and mud and organic enrichment tolerance ratings, for the Waimea fine scale sites are pre-
sented in Figure 10. Coefficients ranged from 2-3, and were all in the “low” risk indicator category (i.e. a transitional
type community indicative of low levels of organic enrichment and moderate mud concentrations). The WEBI values
showed no clear trend of change between 2001-2014, despite a significant trend of increasing mud, and possibly TOC
at all sites over this period. The WEBI findings are consistent with statistical results showing no significant change in
the macro-invertebrate community between 2001 and 2014 (Mann-Kendall/PERMANOVA, P>0.05 for all sites).

2. Individual Species Changes
The most reliable approach at this stage is by assessing changes in abundance of individual species within each of
the 5 major mud/enrichment tolerance groupings (i.e. “very sensitive to organic enrichment” group through to “1st-
order opportunistic species“ group) (Robertson 2013). Although Figure 10 provides little support for mud/organic
enrichment changing the macroinvertebrate community, Figure 11 and Table 4 do. Table 4 shows major reductions
in the abundance of certain species in 4 major enrichment tolerance groupings between 2001 and 2014, particularly
Group 1 organisms (highly sensitive species), where there was an 85% reduction (8 species in 2001, to 1 in 2014).

                                                                                                                                                             Wriggle   coastalmanagement   12
4 . Resu lt s and D i s c u s s i on (Cont i nued )
                                                                  Site A                              Site B                        Site C                             Site D
                                                     7
                                                                                                                                                                                          Very High
                                                     6                                                                                                                                    High
                           WEBI Biotic Coefficient                                                                                                                                        Moderate
                                                     5
                                                                                                                                                                                          Low
                                                     4
                                                                                                                                                                                          Very Low
                                                     3

                                                     2

                                                     1

                                                     0
                                                         2001 A

                                                                                    2014 A

                                                                                                                                   2006 C
                                                                                             2001 B

                                                                                                                                                                        2006 D
                                                                  2006 A

                                                                           2011 A

                                                                                                                          2001 C

                                                                                                                                            2011 C

                                                                                                                                                     2014 C
                                                                                                        2006 B

                                                                                                                 2014 B

                                                                                                                                                              2001 D

                                                                                                                                                                                 2014 D
Figure 10. Benthic invertebrate mud/organic enrichment tolerance rating (±SE, n=3), 2001-2014.
 The identity of the individual species that have been lost over time can be assessed from Figure 11 and supported
 by a more detailed examination of the macro-invertebrate data using univariate SIMPER (PRIMER-e) analysis. They
 show for example, the following losses of highly sensitive species:
    •   Aonides sp., a small surface deposit-feeding, endemic, spionid polychaete that is not very mobile and prefers to live
        in fine sands. It has an important ecological role as a sediment bioturbator, effectively oxygenating sediments, but is
        very sensitive to changes in the silt/clay content of the sediment. The abundance of Aonides declined from a mean of
        2.7 across all sites in 2001, to 1 in 2006, and zero in 2011 and 2014.
    •   Soletellina sp., a brittle shelled, deposit-feeding, endemic, bivalve mollusc in the family Psammobiidae, known as
        sunset shells, that is intolerant of eutrophic or muddy conditions. The abundance of Soletellina declined from a mean
        of 1.2 across all sites in 2001, to 0.2 in 2006, and zero in 2011 and 2014.
    •   Paphies australis (pipi) is an endemic bivalve that is intolerant of mud, tolerant of moderate wave action, and com-
        monly inhabits coarse shell sand substrata in bays and at the mouths of estuaries where silt has been removed by
        waves and currents. The abundance of Paphies declined from a mean of 1 across all sites in 2001, to 0.2 in 2006, and
        zero in 2011 and 2014.

Table 4. Percent change in mean species numbers in each enrichment tolerance group, Waimea Inlet.
                                                                                                                                                                       % Change in Number of Species across
  Mud/Organic Enrichment Tolerance Group
                                                                                                                                                                          all sites between 2001 and 2014
  1. Very sensitive to mud/organic enrichment.                                                                                                                                             87.5% reduction
  2. Indifferent to mud/organic enrichment (slightly unbalanced).                                                                                                                          31.6% reduction
  3. Tolerant to excess mud/organic enrichment (unbalanced situations).                                                                                                                   33.3% reduction
  4. 2nd-order opportunistic species (slight to pronounced unbalanced).                                                                                                                   33.3% reduction
  5. 1st-order opportunistic species (pronounced unbalanced situations).                                                                                                                   0.0% reduction

These results emphasize the importance of using a multi-criteria approach rather than a single biotic index for
assessing estuary condition. They highlight the issue that the WEBI rating (which is based on the AMBI approach)
does not take species diversity into account and therefore likely underestimates mud/organic enrichment re-
sponse (e.g. six Group 1 species with an abundance of 4 individuals each, rates the same as a single Group 1 spe-
cies with an abundance of 24, effectively stating that one sensitive species is as good as six; refer to Appendix 3
for details on species tolerance groupings). Currently research is being undertaken at Otago University to address
this issue.
Overall, the findings indicate that the dominant unvegetated habitat in Waimea Inlet (i.e soft mud) has high mud
concentrations (20-55% mud and trending upward), low to moderate levels of the eutrophication indicators (TOC
2001                                                               2006
                                          Site A           B           C            D                         Site A           B            C            D
                    Aonides sp.                I. Very sensitive to mud and organic enrichment                    I. Very sensitive to mud and organic enrichment
             Orbinia papillosa                 (initial state)                                                    (initial state)
              Polynoidae sp. 1
          Scoloplos cylindrifer
         Haminoea zelandiae
    Micrelenchus tenebrosus
  Zeacumantus subcarinatus
                 Soletellina sp.
             Callianassa filholi
                      Cumacea
                    Mysidacea
                 Edwardsia sp.                 2. Indifferent to mud and organic enichment                        2. Indifferent to mud and organic enichment
                    Nematoda
                     Sipuncula
    Aglaophamus macroura
         Armandia maculata
                  Boccardia sp.
                Boccardia acus
               Boccardia syrtis
           Eulalia microphylla
Macroclymenella stewartensis
           Owenia petersenae
                 Prionospio sp.
      Prionospio aucklandica
            Sphaerosyllis sp. 1
           Diloma subrostrata
             Diloma zelandica
           Notoacmea helmsi
     Zeacumantus lutulentus
     Austrovenus stutchburyi
            Macomona liliana
          Nucula hartvigiana
              Paphies australis
                Amphipoda sp.
      Austrominius modestus
                    Copepoda
            Phoxocephalidae
       Phoxocephalidae sp. 2
               Spheromatidae
                  Diptera sp. 1
                  Diptera sp. 2
   Anthopleura aureoradiata                    3. Tolerant to excess mud and organic                              3. Tolerant to excess mud and organic
                     Nemertea                  enrichment (slight unbalanced situations)                          enrichment (slight unbalanced situations)
                    Glyceridae
      Heteromastus filiformis
      Magelona papillicornis
             Magelona dakini
                      Nereidae
           Nicon aestuariensis
                   Paraonidae
              Paraonidae sp. 1
           Pectinaria australis
                   Polydora sp.
                Spionidae sp. 1
                  Oligochaeta
           Amphibola crenata
      Cominella glandiformis
   Potamopyrgus estuarinus
    Macrophthalmus hirtipes
           Halicarcinus whitei
            Capitella capitata                 4. Tolerant to mud and organic enrichment                          4. Tolerant to mud and organic enrichment
     Scolecolepides benhami                    (slight to pronounced unbalanced situations)                       (slight to pronounced unbalanced situations)
            Scolecolepides sp.
             Arthritica bifurca
                  Helice crassa                5. Very tolerant to mud and organic enrichment                     5. Very tolerant to mud and organic enrichment
          Epitonium tenellum                   Uncertain mud and organic enrichment                               Uncertain mud and organic enrichment
             Crassostrea gigas                 preference                                                         preference
      Decapoda larvae unid.
                Natantia unid.
                Chironomidae
                                   0      10       20          30       40         50            60   0      10        20       30         40         50            60
                                  Mean abundance per core                                 Mean abundance per core
Figure 11. Mud and organic enrichment sensitivity of macro-invertebrates, Waimea Inlet, 2001-2014 (see Appendix 4
for sensitivity details).
2011                                                              2014
                                          Site A           B           C             D                      Site A           B            C            D
                    Aonides sp.               I. Very sensitive to mud and organic enrichment                    I. Very sensitive to mud and organic enrichment
                                              (initial state)                                                    (initial state)
             Orbinia papillosa
              Polynoidae sp. 1
          Scoloplos cylindrifer
         Haminoea zelandiae
    Micrelenchus tenebrosus
  Zeacumantus subcarinatus
                 Soletellina sp.
             Callianassa filholi
                      Cumacea
                    Mysidacea
                 Edwardsia sp.                2. Indifferent to mud and organic enichment                        2. Indifferent to mud and organic enichment
                    Nematoda
                     Sipuncula
    Aglaophamus macroura
         Armandia maculata
                  Boccardia sp.
                Boccardia acus
               Boccardia syrtis
           Eulalia microphylla
Macroclymenella stewartensis
           Owenia petersenae
                 Prionospio sp.
      Prionospio aucklandica
            Sphaerosyllis sp. 1
           Diloma subrostrata
             Diloma zelandica
           Notoacmea helmsi
     Zeacumantus lutulentus
     Austrovenus stutchburyi
            Macomona liliana
          Nucula hartvigiana
              Paphies australis
                Amphipoda sp.
      Austrominius modestus
                    Copepoda
            Phoxocephalidae
       Phoxocephalidae sp. 2
               Spheromatidae
                  Diptera sp. 1
                  Diptera sp. 2
                                              3. Tolerant to excess mud and organic                              3. Tolerant to excess mud and organic
   Anthopleura aureoradiata                   enrichment (slight unbalanced situations)                          enrichment (slight unbalanced situations)
                     Nemertea
                    Glyceridae
      Heteromastus filiformis
      Magelona papillicornis
             Magelona dakini
                      Nereidae
           Nicon aestuariensis
                   Paraonidae
              Paraonidae sp. 1
           Pectinaria australis
                   Polydora sp.
                Spionidae sp. 1
                  Oligochaeta
           Amphibola crenata
      Cominella glandiformis
   Potamopyrgus estuarinus
    Macrophthalmus hirtipes
           Halicarcinus whitei
            Capitella capitata                4. Tolerant to mud and organic enrichment                          4. Tolerant to mud and organic enrichment
                                              (slight to pronounced unbalanced situations)                       (slight to pronounced unbalanced situations)
     Scolecolepides benhami
            Scolecolepides sp.
             Arthritica bifurca
                  Helice crassa               5. Very tolerant to mud and organic enrichment                     5. Very tolerant to mud and organic enrichment
          Epitonium tenellum                  Uncertain mud and organic enrichment                               Uncertain mud and organic enrichment
             Crassostrea gigas                preference                                                         preference
      Decapoda larvae unid.
                Natantia unid.
                Chironomidae
                                   0   10          20       30         40         50            60   0      10       20          30       40         50            60
                                     Mean abundance per core                         Mean abundance per core
Figure 11(continued). Mud and organic enrichment sensitivity of macro-invertebrates, Waimea Inlet, 2001-2014 (see
Appendix 4 for sensitivity details).
4 . Resu lt s and D i s c u s s i on (Cont i nued )
Toxicity INDICATORS
In 2014, the heavy metals Cd, Cr, Cu, Pb, Zn, used as an indicator of potential toxicants, were present at “very low” to
“moderate” concentrations across all fine scale sites, with all non-normalised values below the ANZECC (2000) ISQG-
Low trigger values (Figure 12). Note that cadmium levels prior to 2014 reflect high detection limits rather than high
concentrations. The 2014 results also showed that concentrations of the heavy metal mercury and the metalloid arse-
nic were also well below the ANZECC (2000) ISQG Low limit (Appendix 2) and therefore, like most of the metal results,
posed no toxicity threat to aquatic life.
However, nickel was present across all sites at concentrations exceeding the ISQG High limits, and significant increases
at sites A and C were observed between 2001 and 2014. Chromium was also present at elevated concentrations. This
is likely attributable to elevated inputs in run-off from the geologically nickel and chromium enriched catchment
(Robinson et al. 1996, Rattenbury et al. 1998), and the high affinity of heavy metals for muds acting to transport and
sequester them into estuarine sediments (Whitehouse et al. 1999).
In such cases as this, where the ISQG high limit is exceeded and the likely cause is natural, the ANZECC (2000) guide-
lines recommend further investigation to examine factors controlling bioavailability.

                                 Site A                  Site B                    Site C                     Site D                                                    Site A                      Site B                 Site C                      Site D
                    1.8                                                                                                                                    100
                                                                                                                             High                                                                                                                                     High
                    1.5                                                                                                      Moderate                                                                                                                                 Moderate
                                                                                    ANZECC ISQG LOW Trigger Limit                                           80
                                                                                                                                        Chromium (mg/kg)

                                                                                                                             Low                                                                                            ANZECC ISQG LOW Trigger Limit             Low
  Cadmium (mg/kg)

                    1.3
                                                                                                                             Very Low                                                                                                                                 Very Low
                                                                                                                                                            60
                    1.0

                    0.8                                                                                                                                     40

                    0.5
                                                                                                                                                            20
                    0.2

                     0                                                                                                                                       0
                                                                                                                                                                                                                                  2011
                                                                                                                                                                                                                   2001

                                                                                                                                                                                                                                                2001
                                                                                         2011
                                                                           2001

                                                                                                       2001

                                                                                                                                                                                                                          2006

                                                                                                                                                                                                                                         2014

                                                                                                                                                                                                                                                               2014
                                                                                                                                                                        2006

                                                                                                                                                                                      2014

                                                                                                                                                                                                     2006
                                                                                                                                                                                                            2014

                                                                                                                                                                                                                                                        2006
                                                                                                                                                                                             2001
                                                                                  2006

                                                                                                2014

                                                                                                                      2014
                                 2006

                                               2014

                                                             2006
                                                                    2014

                                                                                                               2006
                                                      2001

                                                                                                                                                                 2001

                                                                                                                                                                               2011
                          2001

                                        2011

                                 Site A                  Site B                    Site C                     Site D                                                    Site A                  Site B                     Site C                      Site D
                    80                                                                                                                                     140
                                                                                                                             High                                                                                                                                     Very High
                                                                                                                             Moderate                      120                                                                                                        High
                    60                                                                                                       Low                           100                                                                                                        Moderate
                                                                                    ANZECC ISQG LOW Trigger Limit
  Copper (mg/kg)

                                                                                                                             Very Low
                                                                                                                                        Nickel (mg/kg)

                                                                                                                                                                                                                                                                      Low
                                                                                                                                                            80
                                                                                                                                                                                                                                                                      Very Low
                    40
                                                                                                                                                            60
                                                                                                                                                                                                                                 ANZECC ISQG HI Trigger Limit
                                                                                                                                                            40
                    20
                                                                                                                                                            20
                                                                                                                                                                                                                            ANZECC ISQG LOW Trigger Limit

                     0                                                                                                                                       0
                                                                                                                                                                                                                                  2011
                                                                                                                                                                                                                   2001

                                                                                                                                                                                                                                                2001
                                                                                         2011
                                                                           2001

                                                                                                       2001

                                                                                                                                                                                                                          2006

                                                                                                                                                                                                                                         2014

                                                                                                                                                                                                                                                               2014
                                                                                                                                                                        2006

                                                                                                                                                                                      2014

                                                                                                                                                                                                     2006
                                                                                                                                                                                                            2014

                                                                                                                                                                                                                                                        2006
                                                                                                                                                                                             2001
                                                                                  2006

                                                                                                2014

                                                                                                                      2014
                                 2006

                                               2014

                                                             2006
                                                                    2014

                                                                                                               2006
                                                      2001

                                                                                                                                                                 2001

                                                                                                                                                                               2011
                          2001

                                        2011

                                 Site A                  Site B                    Site C                     Site D                                                    Site A                  Site B                     Site C                      Site D
                    60                                                                                                                                250
                                                                                                                             High                                                                                                                                     High
                                                                                                                             Moderate                                                                                                                                 Moderate
                                                                                    ANZECC ISQG LOW Trigger Limit                                     200
                                                                                                                             Low                                                                                            ANZECC ISQG LOW Trigger Limit             Low
                    40                                                                                                       Very Low                                                                                                                                 Very Low
                                                                                                                                        Zinc (mg/kg)
  Lead (mg/kg)

                                                                                                                                                      150

                                                                                                                                                      100
                    20

                                                                                                                                                           50

                     0                                                                                                                                       0
                                                                                         2011

                                                                                                                                                                                                                                  2011
                                                                           2001

                                                                                                       2001

                                                                                                                                                                                                                   2001

                                                                                                                                                                                                                                                2001
                                                                                  2006

                                                                                                2014

                                                                                                                      2014

                                                                                                                                                                                                                          2006

                                                                                                                                                                                                                                         2014

                                                                                                                                                                                                                                                               2014
                                 2006

                                               2014

                                                             2006
                                                                    2014

                                                                                                               2006

                                                                                                                                                                        2006

                                                                                                                                                                                      2014

                                                                                                                                                                                                     2006
                                                                                                                                                                                                            2014

                                                                                                                                                                                                                                                        2006
                                                      2001

                                                                                                                                                                                             2001
                          2001

                                        2011

                                                                                                                                                                 2001

                                                                                                                                                                               2011

Figure 12. Sediment metal concentrations (±SE, n=3), Waimea Inlet (2001-2013).

                                                                                                                                                                                                                            Wriggle                    coastalmanagement     16
4 . Resu lt s and D i s c u s s i on (Cont i nued )
 Semi-volatile organic compounds (SVOCs) were also analysed to screen for key pollutants including organo-
 chlorine pesticides (OCPs), polycyclic aromatic hydrocarbons (PAHs), total petroleum hydrocarbons (TPHs), and
 pthalates (Appendix 1 describes the analytical methods and Appendix 2 presents the results in full).
 All analytes were found to be less than the analytical detection limits and the ANZECC (2000) ISQG Low or High
 trigger values, and therefore unlikely to cause toxicity to benthic macrofauna.

5 . S u mm a ry And C o nclu si o ns
 Fine scale monitoring results of estuary condition within Waimea Inlet in 2014, and supported by 2001, 2006 and
 2011 results, showed the following key findings:
     •   The sediment mud content in 2014 was relatively high at 25-50% mud, and had increased significantly by 23-176% at the four
         sites since 2001.
     •   Sediment oxygenation in 2014 was “moderate” as indicated by aRPD depth (1cm) but had declined since 2001 (2-3cm).
     •   Although TOC was in the “low to very low” risk category in 2014, the results reflect a significant upward trend across all
         sites between 2001 and 2014 (47-212% increase). Sediment nutrient concentrations, TN and TP, were in the “low-mod-
         erate” risk categories and showed no significant trend of change at any site.
     •   Macro-invertebrates consisted of a mixed assemblage of species, dominated by polychaetes, crustacea, bivalves and gas-
         tropods, spread across all sites between 2001-2014.
     •   Statistical analysis of the results showed no significant differences in the communities at each site at a macro or community
         level between 2001-2014 (as indicated by trend analysis of species abundance, richness and diversity data, PERMANOVA
         analysis, and WEBI mud/organic enrichment indices), but significant differences were present at a micro or individual species
         level. In particular, there was a large reduction in species that were highly sensitive to mud/organic enrichment (e.g.
         pipi) from 2001 to 2014.
     •   Sediment toxicants (heavy metals (Cd, Cr, Cu, Hg, Pb, Zn), arsenic and semi-volatile organic compounds) were at con-
         centrations that were not expected to pose toxicity threats to aquatic life. Nickel, while likely from a natural source,
         exceeded the ISQG high toxicity limit (ANZECC 2000) and therefore requires further investigation to examine factors
         controlling bioavailability.
 Overall, these 2001-2014 results from each of the four sites indicate that the dominant unvegetated habitat in
 Waimea Inlet is very muddy, has got progressively muddier since 2001, and has low-moderate levels of organic
 enrichment and toxicity. Although it has not show any broad trends of change in the macro-invertebrate com-
 munity since 2001, significant losses in mud sensitive organisms (e.g. pipi) have occurred since that time.

6 . M o nito rin g
 Waimea Inlet has been identified by TDC as a priority for monitoring, and is a key part of TDC’s coastal monitoring pro-
 gramme being undertaken in a staged manner throughout the Tasman district. Based on the 2014 monitoring results
 and risk indicator ratings, particularly related to fine sediment, it is recommended that monitoring continue as follows:
 •       Fine Scale Monitoring. Sampling of fine scale sites A, B, C and D have now been completed for 2001, 2006 and 2014). It
         is recommended that for the next two years TDC collect data only (no reporting), from sites A, C and D (excluding heavy
         metals, SVOCs, mercury and arsenic) to establish a multi-year baseline, and undertake a full report of all data at the next
         scheduled 5 yearly monitoring interval (2020/21).
 •       Broad Scale Habitat Mapping, Including Macroalgae. Continue with the programme of 5 yearly broad scale habitat
         mapping. Next monitoring due in February/March 2019. Undertake a rapid visual assessment of macroalgal growth an-
         nually, and initiate broad scale macroalgal mapping if conditions appear to be worsening over the 5 years before broad
         scale mapping is repeated.
 •       Sedimentation Rate Monitoring. Because sedimentation is a priority issue in the estuary it is recommended that sedi-
         ment plate depths be measured annually, and new plates be deployed in the highly eutrophic locations where sedi-
         ment is rapidly accumulating.
 •       Sediment Source Monitoring. Identify catchment sources of fine sediment to the estuary, using both modeling and
         monitoring methods.
 •       Sediment Transport and Deposition Monitoring Within Estuary. Monitor transport/deposition patterns of sediment
         within the estuary and losses to the ocean using modeling and monitoring methods, and use this and other appropriate
         monitoring data to identify appropriate sediment input load guideline criteria to reduce infilling to a more natural rate.

                                                                                                    Wriggle    coastalmanagement   17
7 . M a na g e m e nt
 The combined results from the 2014 fine scale and broad scale reports (Stevens and Robertson 2014) iden-
 tify sedimentation as a major issue in Waimea Inlet. To address this issue, it is recommended that a staged
 investigation be undertaken as follows, once initial monitoring results for sediment source identification
 and transport and deposition patterns within the estuary have been undertaken.
 1. Identify options for reducing existing areas of fine sediment within the estuary, particularly options that
      dramatically reduce resuspension and replace muddy areas with high ecological value habitat.
 2. Develop a sediment input load reduction plan to meet sedimentation targets for the estuary.

8 . Ac k n owl e d g e m e nts
 This survey and report has been undertaken with the support and assistance of Trevor James (Resource
 Scientist, TDC). His review of this report was much appreciated.

9 . R e f e r e nc e s
   Abrahim, G. 2005.  Holocene sediments of Tamaki Estuary: characterisation and impact of recent human activity on an
          urban estuary in Auckland, NZ. PhD Thesis, University of Auckland, Auckland, NZ, p 361.
   Anderson, D., Gilbert, P. and Burkholder, J. 2002.  Harmful algal blooms and eutrophication: nutrient sources, composition,
          and consequences. Estuaries 25, 704–726.
   ANZECC. 2000.  Australian and New Zealand guidelines for fresh and marine water quality. Australian and New Zealand
         Environment and Conservation Council, Agriculture and Resource Management Council of Australia and New
         Zealand.
   Black, K., Sloan, J. and Gries, T. 2013.  Everything goes somewhere; tracking the movement of contaminated sediments in an
            industrialised estuary using dual signature sediment tracers (A Haugan, Ed.). EPJ Web of Conferences 50, 1–7.
   Borja, A., Franco, J., and Perez, V. 2000.  A marine biotic index to establish the ecological quality of soft-bottom benthos
            within European estuarine and coastal environments. Marine Pollution Bulletin 40, 1100–1114.
   Clark, K., Gillespie, P., Forrest, R., Asher, R. 2008. State of the Environment Monitoring of Waimea Estuary: Broad Scale Habi-
            tat Mapping 2007. Cawthron Report No. 1473. Prepared for Tasman District Council and Nelson City Council. 24p.
   Dauer, D.M., Weisberg, B. and Ranasinghe, J.A. 2000. Relationships between benthic community condition, water quality,
           sediment quality, nutrient loads, and land use patterns in Chesapeake Bay. Estuaries 23, 80-96.
   Ferreira, J., Andersen, J. and Borja, A. 2011. Overview of eutrophication indicators to assess environmental status within the
            European Marine Strategy Framework Directive. Estuarine, Coastal and Shelf Science 93, 117–131.
   Gillespie, P., Clark, K., Conwell, C. 2007. Waimea Estuary State of the Environment Monitoring. Fine Scale Benthic Assess-
            ment, April 2006. Cawthron Report No. 1315. Prepared for Tasman District and Nelson City Councils. 27p.
   Hiscock, K. (ed.) 1996.  Marine Nature Conservation Review: rational and methods. Coasts and seas of the United Kingdom.
           MNCR Series. Joint Nature Conservation Committee, Peterborough.
   Hiscock, K. 1998.  In situ survey of subtidal (epibiota) biotopes using abundance scales and check lists at exact locations
           (ACE surveys). Version 1 of 23 March 1998. In: Biological monitoring of marine Special Areas of Conservation: a
           handbook of methods for detecting change. Part 2. Procedural guidelines (ed. K. Hiscock). Joint Nature Conserva-
           tion Committee, Peterborough.
   IPCC. 2007.  Intergovernmental Panel on Climate Change web site. https://www.ipcc.ch/publications_and_data/ar4/wg1/
           (accessed December 2009).
   IPCC. 2013.  Intergovernmental Panel on Climate Change web site. https://www.ipcc.ch/report/ar5/wg1/ (accessed March
           2014).
   Kennish, M.J. 2002.  Environmental threats and environmental future of estuaries. Environmental Conservation 29, 78–107.
   Magni, P., Tagliapietra, D., Lardicci, C. 2009 Animal-sediment relationships: evaluating the “Pearson-Rosenberg paradigm”
           in Mediterranean coastal lagoons. Marine pollution bulletin 58, 478–86.

                                                                                                    Wriggle     coastalmanagement    18
You can also read