Okiwa and Ngakuta Bays - Broad Scale Habitat Mapping 2018 Wriggle - Marlborough District Council
←
→
Page content transcription
If your browser does not render page correctly, please read the page content below
coastalmanagement
       Wriggle

  O k iwa an d N g a kut a B ays
  Broad Scale Habitat Mapping 2018

Prepared
for

Marlborough
District
Council
June
2018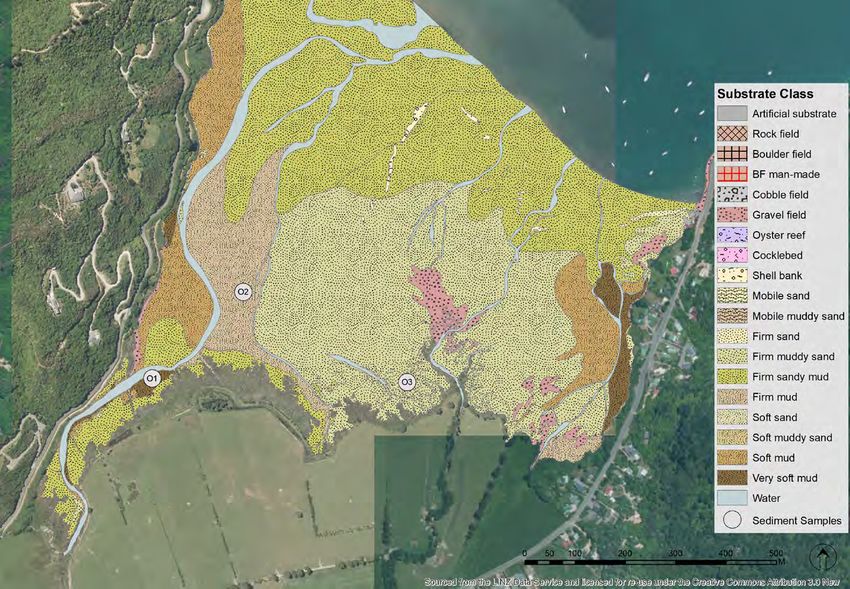
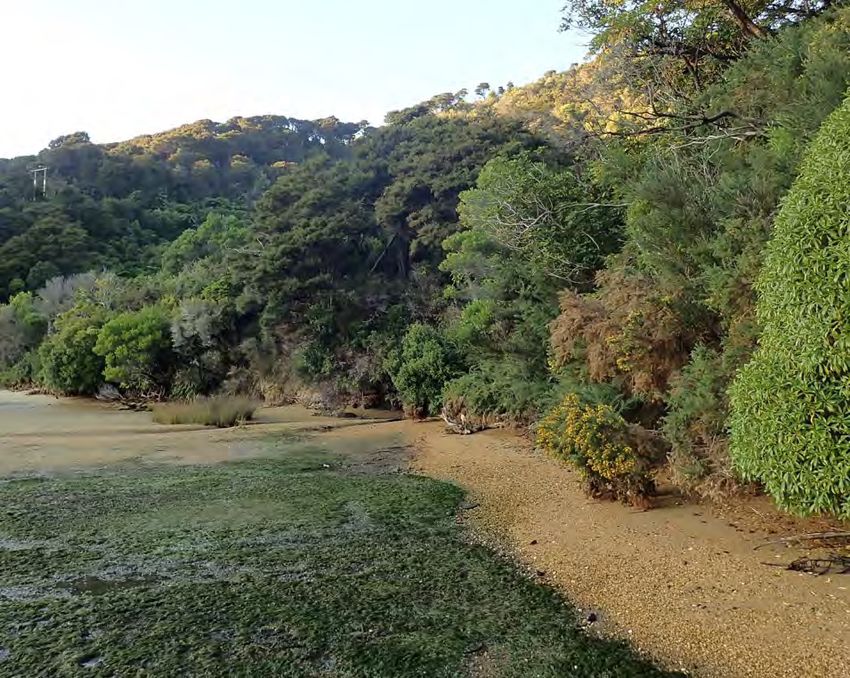
Cover Photo: Okiwa Bay, seagrass nestled within raised gravel beds in the lower intertidal zone, March 2018.
Intertidal rushland at the head of Okiwa Bay, March 2018

O k iwa an d N g a kut a B ays
  Broad Scale Habitat Mapping 2018

                  Prepared for
           Marlborough District Council

                                    by

                          Leigh Stevens

   Wriggle Limited, PO Box 1622, Nelson 7040, Ph 021 417 936, www.wriggle.co.nz

                                                                           Wriggle     coastalmanagement   iii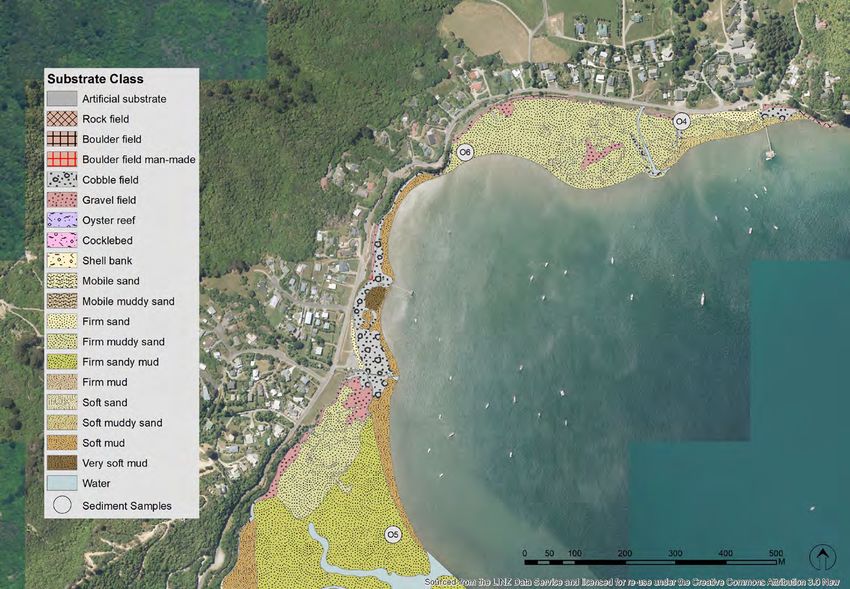
RECOMMENDED CITATION:
Stevens, L.M. 2018. Okiwa and Ngakuta Bays: Broad Scale Habitat Mapping 2018. Report prepared by Wriggle Coastal Management
    for Marlborough District Council. 45p.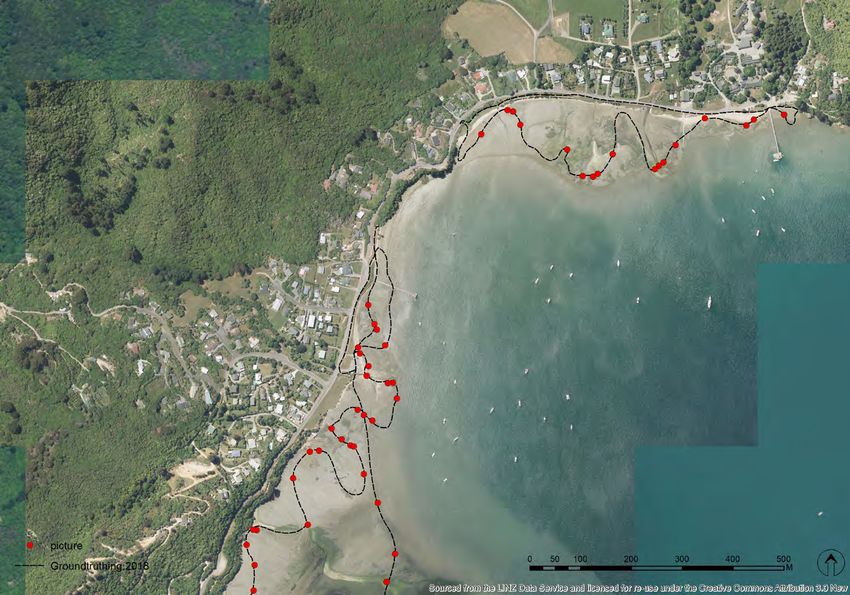
Contents
Executive Summary���������������������������������������������������������������������������������������������������������������������������������������������������������������������������� vii

1. Introduction �������������������������������������������������������������������������������������������������������������������������������������������������������������������������������������� 1

2. Methods���������������������������������������������������������������������������������������������������������������������������������������������������������������������������������������������� 4

3. Results and Discussion������������������������������������������������������������������������������������������������������������������������������������������������������������������� 6
     3.0. Broad Scale Mapping Summary. . . . . . . . . . . . . . . . . . . . . . . . . . . . . . . . . . . 6
     3.1. Intertidal Substrate .   .   .   .   .   .   .   .   .   .   .   .   .   .   .   .   .   .   .   .   .   .   .   .   .   .   .   .   .   .   .   .   .   .   .   .   .   .   .   . 10
     3.2. Extent of Soft Mud.   .   .   .   .   .   .   .   .   .   .   .   .   .   .   .   .   .   .   .   .   .   .   .   .   .   .   .   .   .   .   .   .   .   .   .   .   .   .   .   . 11
     3.3. Sediment Oxygenation. . . . . . . . . . . . . . . . . . . . . . . . . . . . . . . . . . . . . . 13
     3.4. Opportunistic Macroalgae.   .   .   .   .   .   .   .   .   .   .   .   .   .   .   .   .   .   .   .   .   .   .   .   .   .   .   .   .   .   .   .   .   .   .   .   . 13
     3.5. Seagrass.   .   .   .   .   .   .   .   .   .   .   .   .   .   .   .   .   .   .   .   .   .   .   .   .   .   .   .   .   .   .   .   .   .   .   .   .   .   .   .   .   .   .   .   .   . 16
     3.6. Saltmarsh .   .   .   .   .   .   .   .   .   .   .   .   .   .   .   .   .   .   .   .   .   .   .   .   .   .   .   .   .   .   .   .   .   .   .   .   .   .   .   .   .   .   .   .   . 20
     3.7. 200m Terrestrial Margin.  .  .  .  .  .  .  .  .  .  .  .  .  .  .  .  .  .  .  .  .  .  .  .  .  .  .  .  .  .  .  .  .  .  .  .  .  . 22
     3.8. NZ Estuary Trophic Index.   .   .   .   .   .   .   .   .   .   .   .   .   .   .   .   .   .   .   .   .   .   .   .   .   .   .   .   .   .   .   .   .   .   .   .   .   . 25
     3.9. Comparison with Other Estuaries.   .   .   .   .   .   .   .   .   .   .   .   .   .   .   .   .   .   .   .   .   .   .   .   .   .   .   .   .   .   .   .   .   . 26

4. Summary and Conclusion������������������������������������������������������������������������������������������������������������������������������������������������������������ 27

5. Recommended Monitoring �������������������������������������������������������������������������������������������������������������������������������������������������������� 28

6. Acknowledgements���������������������������������������������������������������������������������������������������������������������������������������������������������������������� 29

7. References���������������������������������������������������������������������������������������������������������������������������������������������������������������������������������������� 29

Appendix 1. Summary of the major environmental issues affecting most New Zealand estuaries.������������������������ 31
Appendix 2. Notes Supporting Indicator Ratings (Table 1) �������������������������������������������������������������������������������������������������� 33
Appendix 3. Broad Scale Habitat Classification Definitions. ������������������������������������������������������������������������������������������������ 35
Appendix 4. Notes on Sampling, Resolution and Accuracy�������������������������������������������������������������������������������������������������� 36
Appendix 5. Analytical Results�������������������������������������������������������������������������������������������������������������������������������������������������������� 37
Appendix 6. Ground Truthing��������������������������������������������������������������������������������������������������������������������������������������������������������� 38
Appendix 7. Opportunistic Macroalgal Blooming Tool ���������������������������������������������������������������������������������������������������������� 41
Appendix 8. Okiwa Bay Macroalgal Data������������������������������������������������������������������������������������������������������������������������������������ 45

                                                                                                                                                           Wriggle            coastalmanagement          v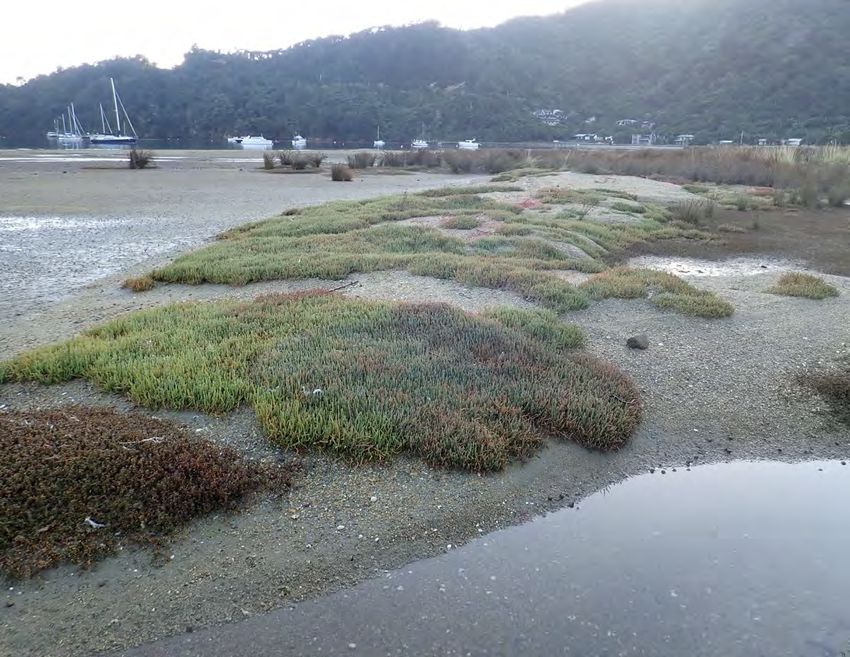
List of Tables
Table 1. Summary of estuary condition and risk indicator ratings used in the present report. �������������������������������� 5
Table 2. Summary of dominant broad scale features, Ngakuta and Okiwa Bays, March 2018.���������������������������������� 6
Table 3. Supporting data used to assess estuary ecological condition. ���������������������������������������������������������������������������� 6
Table 4. Summary of dominant intertidal substrate in Ngakuta and Okiwa Bays, March 2018.������������������������������ 10
Table 5. Summary of intertidal opportunistic macroalgal cover, Okiwa Bay south, March 2018. �������������������������� 14
Table 6. Summary of dominant saltmarsh cover, Ngakuta and Okiwa Bays, March 2018. �������������������������������������� 20
Table 7. Summary of 200m terrestrial margin land cover, Ngakuta and Okiwa Bays, March 2018. �������������������������� 22
Table 8. Primary and supporting indicator values used to calculate an ETI score for Ngakuta and Okiwa Bays.  25
Table 9. Percent of intertidal area of saltmarsh, seagrass, macroalgae and mud in Marlborough estuaries.������������26

                                                              List of Figures
Figure 1. Location of Okiwa Bay and Ngakuta Bay, Grove Arm, Marlborough. �������������������������������������������������������������� 2
Figure 2. Visual rating scale for percentage cover estimates of macroalgae (top) and seagrass (bottom). ����������� 4
Figure 3. Map of dominant intertidal substrate - Ngakuta Bay, March 2018.�����������������������������������������������������������������������7
Figure 4a. Map of dominant intertidal substrate - Thompson Bay and Okiwa Bay (north), March 2018.�������������������8
Figure 4b. Map of dominant intertidal substrate - Okiwa Bay (south), March 2018. ���������������������������������������������������������9
Figure 5. Percentage of intertidal estuary with soft mud for various NZ tidal lagoon and delta estuaries. �����������11
Figure 6. Map of intertidal opportunistic macroalgal biomass (g.m-2) - Okiwa Bay south, March 2018. �������������� 15
Figure 7. Map of intertidal saltmarsh and seagrass (Zostera muelleri) - Ngakuta Bay, March 2018.��������������������������17
Figure 8a. Map of intertidal saltmarsh and seagrass (Zostera muelleri) - Okiwa Bay (north), March 2018.�������������18
Figure 8b. Map of intertidal saltmarsh and seagrass (Zostera muelleri) - Okiwa Bay (south), March 2018.�������������19
Figure 9. Map of 200m Terrestrial Margin - Dominant Land Cover, Ngakuta Bay and Okiwa Bay , March 2018. 23
Figure 10. Summary of Catchment Land Cover (LCDB4 2012/13), Okiwa and Ngakuta Bays.������������������������������������ 24
Figure 11. Summary of key features (% of intertidal area) from estuaries in Marlborough. ������������������������������������� 26

All photos by Wriggle except where noted otherwise.

                                                                                                                  Wriggle      coastalmanagement   vi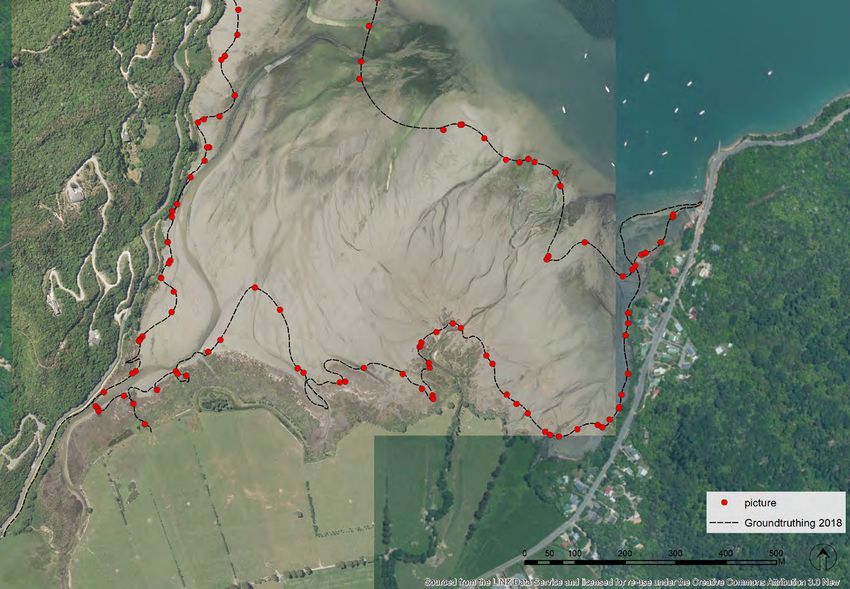
E x ec u t i v e S u mm a ry
Ngakuta and Okiwa Bays are located in Grove Arm at the south-western end of Queen Charlotte Sound/Tōtaranui,
west of Picton, Marlborough. They are modified, moderate sized (Ngakuta 12ha, Okiwa 85ha), mesotidal (50% cover)           0.0         0.0    Very Good       32.7        38.4    Moderate
Intertidal substrate (unvegetated)                9.9        82.2         -          39.9        47.0         -
Subtidal                                          0.2         1.6         -           4.6         5.4         -
Total Estuary                                    12.0        100                     85.0        100
Soft mud extent                                   0.2          2        Good          9.2         11     Moderate
Reduced sediment oxygenation                      0.2          2        Good          9.2         11        Poor
Gross Eutrophic Zones                              0           0     Very Good         0           0     Very Good
Vegetated 200m terrestrial margin                             62        Good                      46     Moderate
NZ Estuary Trophic Index (ETI) score                    0.15         Very Good              0.46         Moderate
ESTUARY CONDITION AND ISSUES
Broad scale habitat mapping undertaken in March 2018, combined with ecological risk indicator ratings in relation
to the key estuary stressors (i.e. muddiness, eutrophication and habitat modification), have been used to assess
overall estuary condition. Okiwa Bay substrate was dominated by firm sands and firm sandy muds, the latter with
a high mud content (~40%) but containing extensive cockle beds. On the lower intertidal edge of the delta there
were extensive beds of macroalgae, but conditions remained moderate due to limited entrainment in sediments
and underlying sediment oxygenation remaining good in those areas. There had been a large increase in reported
macroalgal expression since the previous monitoring undertaken in 2011. Soft mud habitat (11%) was rated poor for
sediment oxygenation. Seagrass was uncommon in mud habitats but was extensive in Thompson Bay to the north
and at the edges of Okiwa Bay. Saltmarsh, although significantly reduced in extent from historical cover, flanked
much of the upper estuary and appeared in healthy condition with relatively few weeds and introduced grasses in
the intertidal zone. Common catchment stressors of fine sediment and nutrients were considered moderate issues.
Ngakuta Bay substrate was dominated by firm muddy sands and gravels with only small areas of soft mud. It was
not expressing eutrophic symptoms (no significant macroalgal growth), had relatively large beds of seagrass,
healthy saltmarsh, and a native forest/scrub dominated catchment. Historical habitat loss and modification has
been limited in extent although much of the shoreline is now protected with seawalls. Commonly observed catch-
ment based stressors, particularly excessive inputs of fine sediment and nutrients, were not significant issues.
The results place Ngakuta Bay in a GOOD state, and Okiwa Bay in a MODERATE state in relation to ecological health.
RECOMMENDED MONITORING
The following monitoring recommendations are proposed for consideration by MDC:
Broad Scale Habitat Mapping. To characterise any issues of change in habitat (e.g. soft mud extent, saltmarsh
or seagrass area), unless obvious changes are observed in the interim, it is recommended that broad scale habitat
mapping be undertaken at ten yearly intervals for Ngakuta Bay (next scheduled for consideration in 2028), and at
five yearly intervals for Okiwa Bay (next scheduled for consideration in 2023).
Macroalgae. Because of the large reported increase in macroalgal cover from 2011 to 2018 it is recommended that
MDC consider collecting additional information from local residents to characterise the changes over the interim
years and consider the use of citizen based science approaches to maintain a watching brief on future changes.
Summarising any known changes within the catchment over the past five years that may help explain the increased
algal growth and reviewing available water quality data to indicate the likely influence of marine derived nutrient
inputs to the head of Grove Arm, and the 2018 summer marine “heat wave” is also recommended.
Fine Scale Monitoring. To provide detailed assessment of the sediment dwelling biological community, and to
characterise key estuary indicators such as sediment heavy metals and nutrients, it is recommended that two fine
scale intertidal monitoring sites be established in Okiwa Bay, one site located within the dominant firm sandy mud
habitat of the estuary, and one site in a deposition zone of soft muds (i.e. to reflect the worst 10% of the estuary).
Because concerns have been raised in relation to the potential impact of land disturbance contributing to in-
creased sediment deposition throughout the Marlborough Sounds, it is recommended that a series of sediment
plates be buried in deposition areas within Okiwa Bay to act both as a reference point and a site for measuring
potential impacts of sediment related changes in Queen Charlotte Sound.
                                                                                             Wriggle   coastalmanagement   vii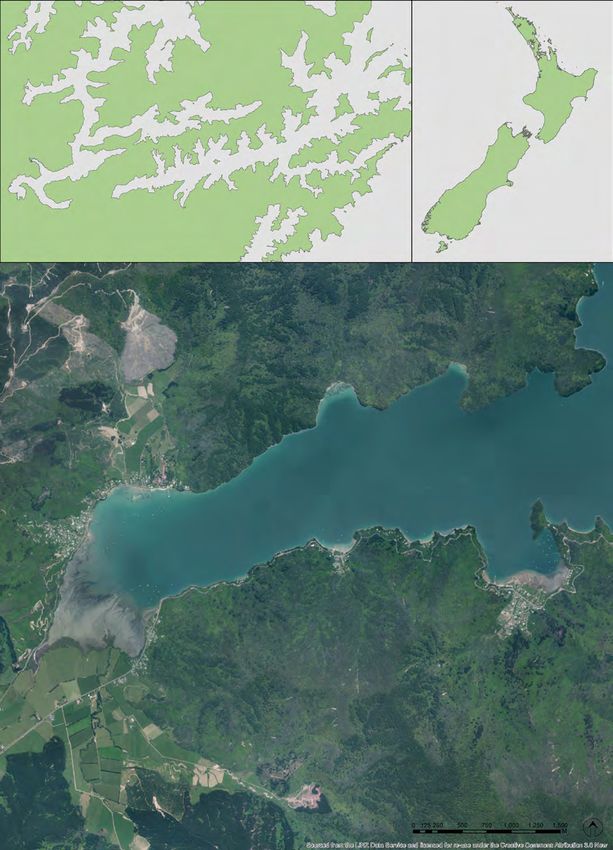
Wriggle coastalmanagement viii
1 . In t r od u c t i on
1.1 Project Brief
The Marlborough District Council (MDC) coastal monitoring strategy (Tiernan 2012) identifies pri-
orities for long-term coastal and estuarine monitoring in the region including broad scale habitat
mapping and fine scale monitoring of intertidal sediments in key estuaries. As part of this work, MDC
recently engaged Wriggle Coastal Management to map the broad scale intertidal habitat features of
Okiwa Bay and Ngakuta Bay, located in the Grove Arm of Queen Charlotte Sound/Tōtaranui, Marlbor-
ough (Figure 1). The purpose of the work was to provide MDC with baseline information on the eco-
logical condition of each site for state of the environment monitoring purposes and to help support
planning and resource consent decision-making. The following report describes the methods and
results of field sampling undertaken on 20-21 March 2018.
1.2 Background
Estuary monitoring in NZ generally comprises three components developed from the National Estu-
ary Monitoring Protocol (NEMP) (Robertson et al. 2002) to address major issues identified in NZ estuar-
ies (see Appendix 1). The tiered approach includes:
   i. Ecological Vulnerability Assessment (EVA) of estuaries to major issues and the design of pri-
   oritised and targeted monitoring programmes. This has been partially completed within the MDC
   coastal monitoring strategy (Tiernan 2012) and in reports documenting ecologically significant ma-
   rine sites in Marlborough (e.g. Davidson et al. 2011). The specific vulnerability of Okiwa and Ngakuta
   Bays to key issues has not yet been specifically assessed.
   ii. Broad Scale Habitat Mapping (NEMP approach). This component documents the key intertidal
   bio-physical features and habitats, enables changes to these habitats to be assessed over time,
   and is used to define fine scale monitoring needs and management priorities. Broad scale baseline
   mapping of both bays was first undertaken in 2011 (Gillespie et al. 2012).
   iii. Fine Scale Monitoring (NEMP approach). This component monitors physical, chemical and
   biological indicators within intertidal sediments to provide more detailed information on habitat
   condition, commonly within the dominant substrate type, as well as in the most susceptible part of
   each estuary (commonly upper estuary deposition zones).
The current report focuses on detailed broad scale habitat mapping undertaken in March 2018 to
characterise the current state of key habitat features and uses a range of established broad scale indi-
cators to assess ecological condition. Key indicators are described in Appendix 1 and include mapping
and assessment of:
• Substrate types
• Sediment oxygenation
• Macroalgal beds (i.e. Ulva (sea lettuce), Gracilaria)
• Seagrass (i.e. Zostera muelleri)
• Gross Eutrophic Zones (GEZs)
• Saltmarsh vegetation
• 200m terrestrial margin land cover
• Catchment land cover

Assessment of results uses a suite of indicator ratings developed for estuarine assessment (Table 1),
many of which are included in the recently developed NZ Estuary Trophic Index (ETI) (Robertson et
al. 2016a,b). The ETI is designed to enable the consistent assessment of estuary state in relation to
nutrient enrichment, and also includes assessment criteria for sediment muddiness.
1.3 Report Structure
The current report presents a brief introduction to the areas being assessed (Section 1.4), the sam-
pling methods, monitoring indicators and assessment criteria used (Section 2), and results and dis-
cussion of the field sampling (Section 3). To help the reader interpret the findings, results are related
to relevant condition or risk indicator ratings to facilitate the assessment of overall estuary condition
(summarised in Section 4), and to guide monitoring recommendations (Section 5).

                                                                                  Wriggle    coastalmanagement   1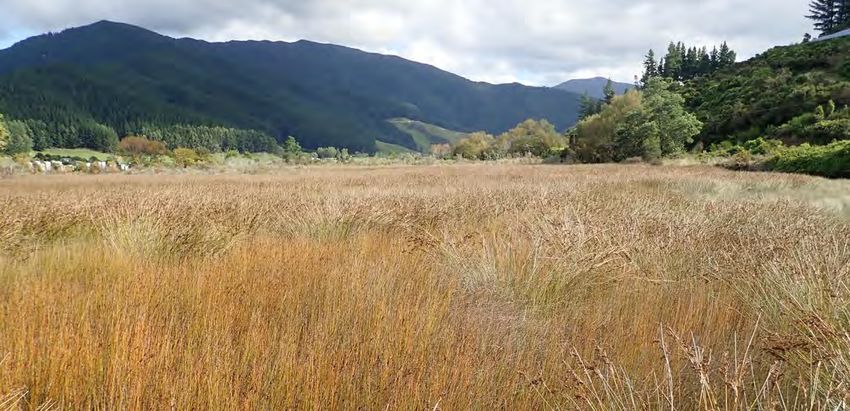
1 . In t r od u c t i on (C on t i n u ed )

             Pelorus
             Sound
                                               Queen Charlotte
                                               Sound/Tōtaranui

                                   Grove Arm         Tory Channel

  Havelock                        Picton

                                                                               Bottle
                                                                                Bay
                                                       Umungata
                                                         Bay

                       Anakiwa                                   Queen Charlotte Sound /Tōtaranui
                                                                          (Grove Arm)

    Tirimoana          Thompson
                          Bay                         Momorangi
                                                        Bay
                                                                                           Ngakuta
                                                                                             Bay

             Okiwa
              Bay
                              The
                             Grove

Figure 1. Location of Okiwa Bay and Ngakuta Bay, Grove Arm, Marlborough.

                                                                                        Wriggle     coastalmanagement   2
1 . In t r od u c t i on (C on t i n u ed )
1.4 Study sites
The study sites defined by MDC are located in Grove Arm at the south-western end of Queen Charlotte
Sound, west of Picton (Figure 1). Ngakuta Bay is situated midway along the southern shore of Grove Arm,
and Okiwa Bay is situated at the head of Grove Arm. To the north of Okiwa Bay at Anakiwa is Thompson
Bay. Although physically separated from Okiwa Bay by low cliffs north of Tirimoana and having different
physical characteristics, Thompson Bay was mapped and reported on by Gillespie et al. (2012) as a contig-
uous part of Okiwa Bay. This combined coverage has been continued in the current study for consistency
although there is merit in future assessments separating the two areas.
Like much of the Marlborough Sounds, Queen Charlotte Sound is a drowned valley system character-
ised by steep hillsides that slope directly to narrow rocky shorelines. Intertidal estuarine flats are largely
confined to the upper tidal reaches of the elongate and narrow arms and sheltered bays where sediment
deposition from catchment erosion contributes to the natural build up of river and stream deltas (Figure
1). Both bays are dominated by marine tidal flows with relatively small freshwater inflows, and have gently
sloping deltas that extend seawards until dropping off into the deeper waters of Grove Arm. The extent
and nature of the intertidal and estuarine deltas is determined largely by the combined influences of un-
derlying geology, the size and steepness of the catchment, and the volume of freshwater flowing to the
coast. The type of land cover also has a strong influence on substrate composition, particularly as rates of
sediment erosion (and subsequent deposition at the coast) are increased where land cover is disturbed ei-
ther through natural events such as landslides or fires, or more commonly through human activities such
as land clearance for farming or forestry. The drainage of wetland areas (which are very effective at trap-
ping terrestrial sediments) can also significantly increase the delivery of fine sediment to coastal areas.
Okiwa Bay at the head of Grove Arm has a 35.3km2 catchment fed via several small streams and tributaries
that discharge onto a moderately large (85ha) intertidal delta. The southern part of Okiwa Bay supports
the largest saltmarsh and wetland habitat in Queen Charlotte Sound, and is one of the larger wetland
areas in the whole of the Marlborough Sounds, providing important habitat for several species of water-
fowl (Davidson et al. 2011), as well as whitebait. Historically the lower valley at the head of Okiwa Bay is
also likely to have supported extensive wetland and saltmarsh features. Present day land cover comprises
57% native forest, 25% exotic plantation forest, 16% grassland (including dairy farms) and 1% residential
settlements at Tirimoana, Anakiwa and The Grove. Where valley floors have been developed into pasture
there has generally been historical modification of the estuary margins primarily from channelisation and
drainage, however saltmarsh is still relatively plentiful.
Ngakuta Bay has a much smaller catchment (6.8km2) with two small streams draining onto a 12ha intertid-
al delta. Land cover in the steep, erodible catchment is dominated by native forest and scrub (96.5%) with
small areas of exotic forest (0.7%), grassland (0.9%) and residential settlement (1.8%). The intertidal delta
is dominated by cobble and gravel substrates near the stream inputs, and sandy substrates elsewhere.
Due to the steep hillsides surrounding Ngakuta Bay, the natural extent of saltmarsh is relatively small.
Okiwa and Ngakuta Bays have relatively low nutrient loads - estimated catchment N areal loadings of ~58
and 41mg N.m-2.d-1 respectively which are below the proposed guideline of ~100mgN.m-2.d-1, for shallow
intertidally dominated estuaries (SIDEs) (Robertson et al. 2016b). Consequently both bays are predicted to
have low susceptibility to eutrophication.
The ratio of the estimated current suspended sediment load (CSSL) compared to the estimated natural
state sediment load (NSSL) is 1-1.1, an ETI rating of very good, reflecting the relatively high forest and
scrub cover in the Ngakuta catchments, as well as on the steeper slopes in the Okiwa catchment. The bays
are both rated as having low vulnerability to muddiness. However Okiwa Bay is vulnerable to increased
sediment inputs if exotic forest harvesting in the catchment is not managed appropriately.
Ecologically, both bays are important for freshwater fish and birds, and Okiwa Bay has the largest area of
intertidal flats in Queen Charlotte Sound. Grove Arm is reported to be subject to frequent toxic micro-
algal blooms (Mackenzie et al. 1998, 2004, cited in Gillespie et al. 2012).
Both Okiwa and Ngakuta bays have localised high use and are valued for their aesthetic appeal, bath-
ing, boating, fishing, whitebaiting and beach access. The Outward Bound Trust of NZ has been based at
Anakiwa since 1962, while historically Okiwa Bay and the surrounding lowlands were important areas for
native forest harvesting (kahikatea) and dairy farming.
Wriggle coastalmanagement 32 . M e t hods
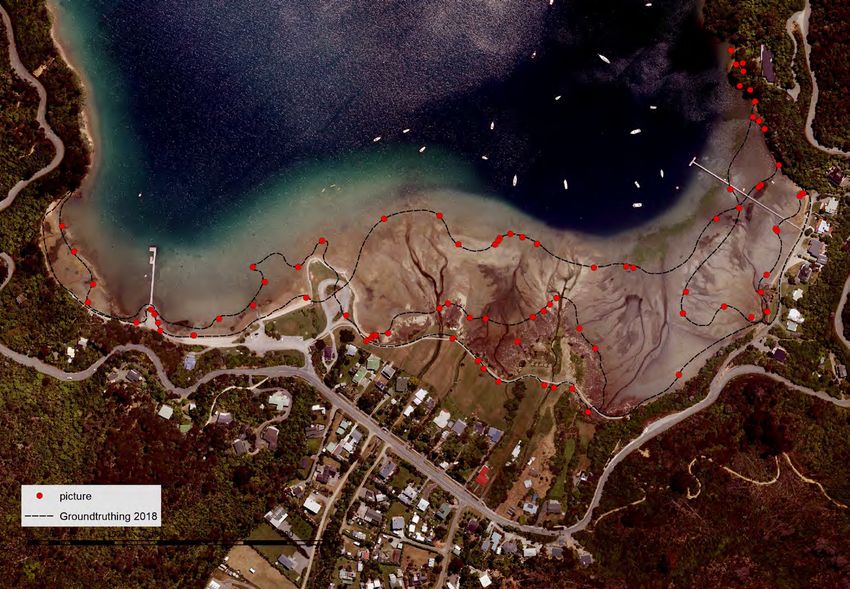
Broad-scale mapping is a method for describing habitat types based on the dominant surface fea-
tures present (e.g. substrate: mud, sand, cobble, rock; or vegetation: macrophyte, macroalgae, rush-
land, etc). It follows the NEMP approach originally described for use in NZ estuaries by Robertson
et al. (2002) with a combination of detailed ground truthing of aerial photography, and GIS-based
digital mapping from photography to record the primary habitat features present. Appendix 3 lists
the definitions used to classify substrate and saltmarsh vegetation. Very simply, the method involves:
• Obtaining aerial photos of the estuary for recording dominant habitat features.
• Carrying out field identification and mapping (i.e. ground truthing) using laminated aerial photos.
• Digitising ground truthed features evident on aerial photographs into GIS layers (e.g. ArcMap).
The georeferenced spatial habitat maps provide a robust baseline of key indicators that are used with
risk indicators to assess estuary condition in response to common stressors, and assess future change.
Site boundaries were set as the seaward edge of the tidal delta (as generally defined in the MDC work
brief) to the upper extent of saline intrusion (i.e. where ocean derived salts during average annual
low flow are2 . M e t hods (C on t i n u ed )
Table 1. Summary of estuary condition and risk indicator ratings used in the present report.
RISK INDICATOR RATINGS / ETI BANDS (indicate risk of adverse ecological impacts)
BROAD AND FINE SCALE ETI Condition Rating Very Good - Band A Good - Band B Moderate - Band C Poor - Band D
INDICATORS Risk Rating Very Low Risk Low Risk Moderate Risk High Risk
Soft mud (% of unvegetated intertidal substrate)* 5-15% >15%
Sediment Mud Content (%mud)* 10-25% >25%
Apparent Redox Potential Discontinuity (aRPD)** >2cm (Good or Very Good) 0.5-2cm 5-10% 0-5%
Supporting indicator Extent (% remaining from est. natural state) >80-100% >60-80% >40-60% 80-100% >50-80% >25-50% 20%
NZ ETI score* Band A (0-0.25) Band B (0.25-0.50) Band C (0.50-0.75) Band D (0.75-1.0)
* NZ ETI (Robertson et al. 2016b), ** Hargrave et al. (2008), Keeley et al. (2012), See NOTES in Appendix 2 for further information.
Herbfields on raised gravel beds in front of rushland in central Ngakuta Bay.
Wriggle coastalmanagement 53 . Res u lt s a nd D i sc u ss i on
3.0. Broad Scale Mapping Summary
The 2018 broad scale habitat mapping ground truthed and mapped intertidal estuary sub-
strate and vegetation as well as the dominant land cover of the 200m terrestrial margin. The
dominant estuary features are summarised in Tables 2 and shown in Figures 3-9.
Both bays are intertidally dominated deltas that drain almost completely on the low tide. Nga-
kuta Bay and Thompson Bay in the north of Okiwa Bay are relatively long and narrow whereas
Okiwa Bay proper has large and wide intertidal flats. Saltmarsh (6-7%) was located predomi-
nantly at the head of each bay where valley floors meet the sea. Saltmarsh is naturally limited
by the surrounding hillsides in Ngakuta Bay but was historically much more extensive in Okiwa
Bay. Intertidal seagrass was a relatively small but significant feature in each estuary (3-8%),
while dense beds of (>50% cover) opportunistic macroalgae were only recorded in Okiwa Bay.
No gross eutrophic zones were present. In Okiwa and Ngakuta Bays respectively, the 200m
wide terrestrial margin retained a high proportion of dense vegetation (46-62%), and native
forest cover in the surrounding catchments was also relatively high (57-96%).
In the following sections, various factors related to each of these key habitats (e.g. area of soft
mud) are used in conjunction with risk ratings to assess key estuary issues of sedimentation,
eutrophication, and habitat modification (Tables 2 & 3). In addition, the GIS files underpinning
this written report provide a more detailed spatial record of the key features present through-
out each estuary and are intended as the primary supporting tool to help the Council address a
suite of estuary issues and management needs, and to act as a baseline to assess future change.
Table 2. Summary of dominant broad scale features, Ngakuta and Okiwa Bays, March 2018.
Ngakuta Bay Okiwa Bay
Dominant Estuary Feature
ha % ha %
Intertidal saltmarsh 0.9 7.4 5.3 6.2
Intertidal seagrass (>20% cover) 1.1 8.8 2.5 3.0
Intertidal macroalgal beds (>50% cover) 0.0 0.0 32.7 38.4
Intertidal substrate (unvegetated) 9.9 82.2 39.9 47.0
Intertidal Total 11.8 98.4 80.4 94.6
Subtidal Total 0.2 1.6 4.6 5.4
Total Estuary 12.0 100 85.0 100
200m Terrestrial Margin (densely vegetated) 61.7 45.6
Catchment native forest cover 563 96.5 2024 57.3
Table 3. Supporting data used to assess estuary ecological condition.
Supporting Condition Measures Ngakuta Bay Okiwa Bay
Catchment Area (Ha)* 583 3532
Mean freshwater flow (m3/s)* 0.1 0.74
Catchment nitrogen load (TN/yr)* 1.80 17.96
Catchment phosphorus load (T/Pyr)* 0.25 3.89
Catchment sediment load (KT/yr)* 1.54 14.12
Estimated N areal load in estuary (mg/m2/d) 41.03 57.68
Estimated P areal load in estuary (mg/m2/d) 5.68 12.49
Intertidal soft mud extent (%) 21 55
Macroalgal OMBT EQR score 1 0.45
Saltmarsh (estimated natural % remaining) >803 . Res u lt s a nd D i sc u ss i on (con t i n u ed )
Figure 3. Map of dominant intertidal substrate - Ngakuta Bay, March 2018.
Wriggle coastalmanagement 73 . Res u lt s a nd D i sc u ss i on (con t i n u ed )
Anakiwa
Thompson
Bay
Okiwa
Bay
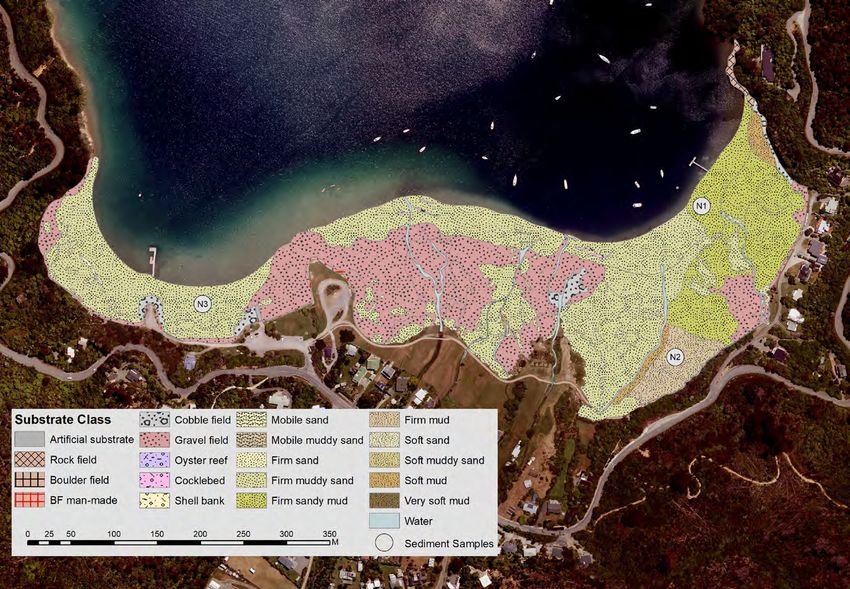
Figure 4a. Map of dominant intertidal substrate - Thompson Bay and Okiwa Bay (north), March 2018.
Wriggle coastalmanagement 83 . Res u lt s a nd D i sc u ss i on (con t i n u ed )
Okiwa
Bay
Figure 4b. Map of dominant intertidal substrate - Okiwa Bay (south), March 2018.
Wriggle coastalmanagement 93 . Res u lt s a nd D i sc u ss i on (con t i n u ed )
3.1. Intertidal Substrate
Results summarised in Table 4 and Figures 3 and 4 show intertidal substrate was dominated by
different features at each site. Ngakuta Bay had extensive perched, centrally located cobble/
gravel fields around mobile stream deltas, with firm muddy sands dominating the western end
of the bay, and firm sandy muds at the eastern end. A similar pattern was evident in Thomp-
son Bay at the north end of Okiwa Bay. In the main intertidal basin of Okiwa Bay to the south,
stream mouth cobble sand gravels were also evident but in a much smaller proportion, with
substrate dominated by large intertidal flats comprising firm muddy sand (35%), firm sandy
mud (34%), and firm, soft and very soft muds (18%). Firm sandy mud habitat in the lower third
of the estuary supported extensive beds of cockles, although because the beds were covered
in macroalgae as well as muds they are hard to distinguish visually using aerial photography.
Because of this they have been classified as firm sandy mud. Raised and defined beds of dead
cockle shells were classified as shell bank.
Within vegetated areas, substrate among herbfields was predominantly cobble and gravel
dominated, while substrate among rushland was dominated by firm mud or muddy sand. Sea-
grass beds (Section 3.4) were present in both bays growing in sand and mud substrates, often
located in small depressions among raised gravel beds. Hard substrates (e.g. rock, boulder and
cobble) were limited in extent and located mainly at the upper intertidal margins. No significant
beds of mussels or other biogenic features e.g. tube worm reefs, were recorded as dominated
habitats. Macroalgae was predominantly present on firm sandy muds and muddy sands in the
lower intertidal reaches of Okiwa Bay (see Section 3.4).
Table 4. Summary of dominant intertidal substrate in Ngakuta and Okiwa Bays, March 2018.
Ngakuta Bay Okiwa Bay
Dominant Estuary Feature
ha % ha %
Intertidal substrate within saltmarsh
Gravel field 0.3 2.8 0.4 0.5
Firm muddy sand 0.6 4.7 2.3 2.8
Firm mud/sandy mud 2.5 3.1
Soft mud 0.1 0.2
Intertidal substrate outside of saltmarsh
Artificial substrates 0.1 0.6 0.1 0.1
Rock field/Boulder field 0.1 0.4 0.1 0.1
Cobble field 0.2 1.8 1.5 1.8
Gravel field 3.0 25.7 2.5 3.1
Shell bank 0.04 0.3 0.3 0.3
Firm sand - - 0.4 0.5
Firm muddy sand 5.0 42.4 28.5 35.4
Soft muddy sand 0.5 0.6
Firm sandy mud 1.9 15.9 27.2 33.8
Firm mud 0.5 3.8 5.0 6.2
Soft mud 0.2 1.7 7.5 9.4
Very soft mud 1.7 2.1
Grand Total 11.8 100 80.4 100
Wriggle coastalmanagement 103 . Res u lt s a nd D i sc u ss i on (con t i n u ed )
3.2. Extent of Soft Mud
Adverse impacts are commonly encountered when estuaries receive excessive inputs of fine
sediment resulting in turbidity, shallowing, increased nutrients, increased organic matter deg-
radation by anoxic processes (e.g. sulphide production), increased contaminant concentrations
(where fine muds provide a sink for catchment contaminants like heavy metals), and alterations
to saltmarsh, seagrass, fish and invertebrate communities through declining sediment oxygena-
tion, smothering, and compromisation of feeding habits (e.g. see Mannino and Montagna 1997;
Rakocinski et al. 1997; Peeters et al. 2000; Norkko et al. 2002; Ellis et al. 2002; Thrush et al. 2003;
Lohrer et al. 2004; Sakamaki and Nishimura 2009; Wehkamp and Fischer 2012; Robertson 2013).
Because of such consequences, three key measures are commonly used to assess soft mud:
i. Horizontal extent (area of soft mud) - broad scale indicator (see rating in Table 1)
ii. Vertical buildup (sedimentation rate) - measured using buried sediment plates or retrospectively through histori-
cal coring. Ratings are currently under development as part of national ANZECC guidelines.
iii. Sediment mud content - fine scale indicator of the degree of muddiness within sediments from representative
habitat - recommended guideline is no increase from established baseline.
The area (horizontal extent) of intertidal soft mud is the primary sediment indicator used in the
current broad scale report, with sediment mud content a supporting indicator. Table 3 shows
that 21% and 55% of the habitat were classified as being dominated by muds in Ngakuta and
Okiwa Bays, although the extent of soft muds was lower, at 2% and 11% respectively, risk ratings
of LOW and MODERATE. This is relatively low compared to other estuaries in the Marlborough
Sounds (Figure 5). The largest soft mud deposition zones in both bays were along the eastern
edges of the bays in relatively low-lying quiescent zones. In the firm mud habitat along the
lower seaward edge of the bays, sediments were firm to walk on because of extensive beds of
cockles growing in the muds. Without the presence of cockles, sediment would be classified as
soft mud as the measured mud content in this habitat was ~40%, above the HIGH risk indicator
rating band (>25%). This result indicates that elevated fine sediment inputs to Okiwa Bay, and to
a lesser extent Ngakuta Bay, appear to accumulate in the lower (seaward) edge of the estuaries
and that biological communities in these areas are likely to be adversely impacted. Because of
the potential for increased sediment inputs to occur following future forest harvesting in the
Okiwa Bay catchment it is recommended that a series of sediment plates be buried in predicted
areas of deposition on the intertidal flats to track future sediment changes.
100
Ngakuta Okiwa
80
% of Intertidal Soft Mud
60
40
20
0
Tuna 2018
Ngakuta 2018
Ngakuta 2011
Punt Arm, Greville 2018
Shakespeare Bay 2016
Waikawa (Marlb) 2016
Duncan 2018
Whangarae 2016
Okiwa 2018
Okiwa 2011
Harvey 2018
Wairau Lagoon 2015
Smylies Arm, Greville 2018
Mill Arm, Greville 2018
Kaiuma Estuary 2017
Mahakipawa 2017
Havelock Delta Estuary 2001
Havelock Delta Estuary 2014
Nelson Haven 2009
Delaware Estuary 2009
Kokorua Estuary 2015
Waikato Estuary 2012
Anaweka 2012
Onekaka 2012
Onahau 2012
Otuwhero Inlet 2012
Wainui Inlet 2012
Port Puponga 2012
Pakawau Inlet 2012
Kaiteriteri Estuary 2012
Ruataniwha 2015
Motupipi River 2015
Parapara Inlet 2012
Waitapu 2012
Moutere Inlet 2013
Ligar Bay 2012
Waimea Inlet 2014
Westhaven Inlet 2016
Kaiwharawhara 2018
Korokoro 2018
Wainuiomata 2018
Hutt 2016
Porirua Harbour 2015
Makara Estuary 2018
Ohiwa Harbour 2002
Whangamata 2002
Whanganui River 2017
Rangitikei River 2018
Manawatu 2016
Avon-Heathcote River 2016
Kakanui 2009
Shag Estuary Dec 2016
Catlins Estuary Dec 2016
Waikouaiti River Dec 2016
Kaikorai Estuary 2018
Tokomairiro Estuary 2018
Avon-Heathcote River 2002
Awarua Bay 2002
Bluff Harbour 2002
Freshwater 2013
Haldane Estuary 2004
Haldane Estuary 2016
New River Estuary 2001
New River Estuary 2007
New River Estuary 2012
New River Estuary 2016
Jacobs River Estuary 2003
Jacobs River Estuary 2016
Waikawa Harbour 2016
Waikawa Harbour 2004
Marlborough Nelson Tasman Wellington BoP Manawatu Chch Otago Southland
Figure 5. Percentage of intertidal estuary with soft mud habitat for various NZ tidal lagoon and
delta estuaries (shallow, intertidal dominated, residence time3 . Res u lt s a nd D i sc u ss i on (con t i n u ed )
Ngakuta Bay: Dominant gravel habitat on the upper shore and by stream margins.
Okiwa Bay: Firm muddy sand (left) and firm mud habitat (right).
Thompson Bay: Raised gravel beds and seagrass. Okiwa Bay: soft poorly oxygenated muds.
Wriggle coastalmanagement 123 . Res u lt s a nd D i sc u ss i on (con t i n u ed )
3.3. Sediment Oxygenation
The primary indicator used to assess sediment oxygenation was the visually apparent aRPD
depth. This indicator was measured within representative intertidal sediments and results used
to assess which parts of the estuary had sediment oxygen depleted to the extent that adverse
impacts to macrofauna (sediment and surface dwelling animals) might be expected. Because
macrofauna are used as an indicator of ecological impacts to other taxa, it is expected that
reduced oxygen zones will also be exerting adverse impacts on associated higher trophic com-
munities including birds and fish.
The broad scale field measurements found sand and gravel sediments in the estuaries to be
generally well oxygenated with the average aRPD depth at ~2-5cm. This appears to be main-
tained largely as a consequence of open interstitial spaces within the sediment matrix allowing
for the free exchange of oxygen from either the atmosphere or from seawater. Included in this
was the large area of firm sandy mud habitat in Okiwa Bay where the presence of cockles, which
are very effective bioturbators of sediment, act to facilitate good oxygen exchange with underly-
ing sediments. The only areas indicating reduced sediment oxygenation were within relatively
small areas of soft or very soft muds (Figures 3 and 4). Where muds supported seagrass, oxygen
levels were good, but in unvegetated muds the average aRPD depth was ~0.5 to 1cm equating to
a measured RP of -50 to -150mV at 1cm. While this indicates stress to ecological communities liv-
ing in the sediments is likely, it is mitigated somewhat by only very soft mud-dominated habitat
appearing to have elevated levels of organic enrichment. As these areas are limited in extent (2%
of Okiwa Bay), and no gross eutrophic zones were present, a LOW risk rating for this indicator has
been applied.
3.4. Opportunistic Macroalgae
Opportunistic macroalgae are a primary symptom of estuary eutrophication. They are highly
effective at utilising excess nitrogen enabling them to out-compete other seaweed species and,
at nuisance levels, can form mats on the estuary surface which adversely impact underlying
sediments and fauna, other algae, fish, birds, seagrass, and saltmarsh. Macroalgae that becomes
detached can also accumulate and decay in subtidal areas and on shorelines causing oxygen
depletion and nuisance odours and conditions. The greater the density, persistence, and extent
of macroalgal entrainment within sediments, the greater the subsequent impacts.
Opportunistic macroalgal growth was assessed by mapping the spatial spread and density of
macroalgae in the Available Intertidal Habitat (AIH) (Figure 6), and calculating an “Ecological
Quality Rating” (EQR) using the Opportunistic Macroalgal Blooming Tool (OMBT). The EQR score
can range from zero (major disturbance) to one (reference/minimally disturbed) and relates to
a quality status threshold band (i.e. bad/low, poor, good, moderate, high - Section 2, Table 1,
Appendix 7). The individual metrics that are used to calculate the EQR (spatial extent, density,
biomass, and degree of sediment entrainment of macroalgae within the affected intertidal area)
are also scored and have quality status threshold bands to guide key drivers of change. If the
estuary supports3 . Res u lt s a nd D i sc u ss i on (con t i n u ed )
Much of the algae was attached to cockles in the lower estuary with underlying sediments not
showing evidence of oxygen depletion (Figure 6 - top left).
It was also evident that the shallow gradient of the intertidal flats was allowing shallow seawater
to pond at low tide enabling the algae to remain free floating (Figure 6 - top right). This ponding
is largely maintained by macroalgal growths limiting the free draining of the tidal flats but is also
important in maintaining relatively good underlying sediment conditions by preventing smother-
ing growths from depleting oxygen levels in underlying sediment.
Benthic microalgae were also present in the west of Okiwa Bay, evident by a rich green film coat-
ing mounds of sediment. These areas were limited to a few square metres and represent a rela-
tively minor component of the estuary.
In contrast to the above results, Gillespie et al. (2012) reported 0.5ha of macroalgae in Okiwa Bay
and 0.6ha in Ngakuta Bay. The very large increase in reported macroalgal growth in Okiwa Bay
from 2012 to 2018 indicates a significant increase in the expression of nutrient driven macroalgal
growth over the past 6 years. While the risk rating for current growth is MODERATE, the rapid
increase has a risk rating of HIGH and it is recommended that further assessment of changes in
macroalgal growth in Okiwa Bay be undertaken. Seeking knowledge of changes to the estuary
between 2012 and 2018 from local residents would provide a simple and low cost way to inform
the current situation, as would the use of citizen based science approaches to maintain a watch-
ing brief on future changes. It would also be valuable to summarise any known changes within
the catchment over the past 5 years, such as intensification or expansion of farming or land
disturbance, that may explain the increased algal growth. In tandem, a review of available water
quality data from Queen Charlotte Sound would provide an indication of the likely influence of
marine derived nutrient inputs to the head of Grove Arm.
Table 5. Summary of intertidal opportunistic macroalgal cover, Okiwa Bay south, March 2018.
Metric Face Value Final Equidistant Quality
AIH - Available Intertidal Habitat (ha) 71 Score (FEDS) Status
Percentage cover of AIH (%) = (Total % Cover / AIH} x 100 41.6 0.334 Poor
where Total % cover = Sum of {(patch size) / 100} x average % cover for patch
Biomass of AIH (g.m-2) = Total biomass / AIH
238.7 0.574 Moderate
where Total biomass = Sum of (patch size x average patch biomass)
Biomass of Affected Area (g.m-2) = Total biomass / AA
430.5 0.446 Moderate
where Total biomass = Sum of (>5% cover patch size x average patch biomass)
Presence of Entrained Algae = (No. quadrats or area (ha) with entrained 8.8 0.549 Moderate
algae / total no. of quadrats or area (ha)) x 100
Affected Area (use the lowest of the following two metrics) 0.356 Poor
Affected Area, AA (ha) = Sum of all patch sizes (with macroalgal cover >5%) 39.4 0.653 Good
Size of AA in relation to AIH (%) = (AA / AIH) x 100 55.4 0.356 Poor
Overall macroalgal Ecological Quality Rating - EQR (Average of FEDS) 0.45 MODERATE
Wriggle coastalmanagement 143 . Res u lt s a nd D i sc u ss i on (con t i n u ed )
Numbers indicate percent cover of algae, colours indicate biomass
Figure 6. Map of intertidal opportunistic macroalgal biomass (g.m-2) - Okiwa Bay south, March 2018.
Wriggle coastalmanagement 153 . Res u lt s a nd D i sc u ss i on (con t i n u ed )
3.5. Seagrass
Seagrass (Zostera muelleri) beds are important ecologically because they enhance primary
production and nutrient cycling, stabilise sediments, elevate biodiversity, and provide nursery
and feeding grounds for a range of invertebrates and fish. Though tolerant of a wide range of
conditions, seagrass is vulnerable to excessive nutrients, fine sediments in the water column,
and sediment quality (particularly if there is a lack of oxygen and production of sulphides).
Figure 6 shows intertidal seagrass beds were present in both bays. Seagrass was only recorded
in high density (80-100%) patches with strongly defined edges, often marked by a change in
substrate. Most beds were growing in sand and muddy sand nestled within depressions in
gravel habitat. Thompson Bay had the highest intertidal percentage cover of seagrass (21%),
Ngakuta (8.9%), and Okiwa the lowest (1.4%). This pattern correlates with sediment type, sea-
grass extent decreasing as the area of sediment dominated by muds increases.
In the absence of any comprehensive rating of seagrass extent within NZ estuaries, which can be
highly variable in the extent of seagrass that they support, changes from a documented base-
line currently represent the most reliable method for monitoring seagrass extent and assessing
change. The results of the current study were compared to baseline maps of seagrass extent
for this purpose and indicated an increase in seagrass at both bays. However this increase most
likely reflects much higher resolution photographs being available in 2018 that in 2011 and a
consequent improvement in mapping accuracy rather than an expansion in seagrass. Of most
significance was the continued presence of seagrass in areas it was previously recorded from,
indicating stable beds with no evidence of a decline in extent.
While not widespread there were a couple of seagrass patches in Thompson Bay where a uniden-
tified algal slime was present on seagrass fronds (see photos below). However most seagrass was
clean and free of algal growth.
Consistent with results previously reported by Gillespie et al. (2012), blackened seagrass leaves
symptomatic of a disease caused by the slime mould Labrynthula sp. (often referred to as the fun-
gal wasting disease) were evident in both Ngakuta and Thompson/Okiwa Bays (see photo below).
This feature, commonly observed on seagrass beds throughout NZ, does not appear to be having
a significant impact on seagrass health at this point in time.
Based on the presence of dense beds of healthy seagrass in each bay, the absence of significant
macroalgae growth among seagrass, and no evidence of a significant dieback in seagrass de-
spite fungal wasting disease symptoms since 2012, a condition rating of GOOD has been applied.
Wriggle coastalmanagement 163 . Res u lt s a nd D i sc u ss i on (con t i n u ed )
1.05ha
Seagrass % Cover
% intertidal 8.9%
80-100%
Figure 7. Map of intertidal saltmarsh and seagrass (Zostera muelleri) - Ngakuta Bay, March 2018.
Wriggle coastalmanagement 173 . Res u lt s a nd D i sc u ss i on (con t i n u ed )
Thompson
Bay
1.52ha
% intertidal 21.7%
Seagrass % Cover
Thompson Bay
Okiwa
Bay
80-100% 0.99ha
Seagrass % Cover
% intertidal 1.4%
Okiwa Bay
80-100%
Figure 8a. Map of intertidal saltmarsh and seagrass (Zostera muelleri) - Okiwa Bay (north), March
2018.
Wriggle coastalmanagement 183 . Res u lt s a nd D i sc u ss i on (con t i n u ed )
Thompson and Okiwa Bays
2.51ha
3.1%
Seagrass % Cover
% intertidal
80-100%
Okiwa
Bay
Figure 8b. Map of intertidal saltmarsh and seagrass (Zostera muelleri) - Okiwa Bay (south), March
2018.
Wriggle coastalmanagement 193 . Res u lt s a nd D i sc u ss i on (con t i n u ed )
3.6. Saltmarsh
Saltmarsh (vegetation able to tolerate saline conditions where terrestrial plants are unable to survive)
is important as it is highly productive, naturally filters and assimilates sediment and nutrients, acts
as a buffer that protects against introduced grasses and weeds, and provides an important habitat
for a variety of species including fish and birds. Saltmarsh generally has the most dense cover in the
sheltered and more strongly freshwater influenced upper estuary, and is relatively sparse in the lower
(more exposed and saltwater dominated) parts of the estuary, with the lower extent of saltmarsh
growth limited for most species to above the height of mean high water neap (MHWN).
The primary measure to assess saltmarsh condition is the percent cover of the intertidal area. Table 6
and Figures 7, 8a and 8b summarise the 2018 results. Saltmarsh areas were relatively small in relation
to overall estuary area (6-7%), a condition rating of MODERATE. Saltmarsh was dominated by rushland
comprising searush (with smaller areas of jointed wire rush near the terrestrial margin) in relatively
wide beds at the head of each estuary, and also in narrow strips and as isolated beds along the edges
of the bays. Herbfields were prominent in Ngakuta Bay growing seaward of the rushland beds and
were also common as a subdominant cover among rushland in both bays. Primrose and remuremu
were the dominant species, and formed a dense turf community among gravel beds. Saltmarsh rib-
bonwood was the other dominant saltmarsh class in the upper estuary, often with a mix of terrestrial
grasses and weeds and native shrubs at the terrestrial edge. The seaward edges of intertidal saltmarsh
were free of weeds and grasses and appeared in good condition. Page 21 presents photos of repre-
sentative saltmarsh growing throughout Okiwa Bay.
Gillespie et al. (2012) reported slightly more saltmarsh in both bays in 2012 but due to the quality of
aerial photos at that time, the boundary between saltmarsh and terrestrial areas was difficult to map
Table 6. Summary of dominant saltmarsh cover, Ngakuta and Okiwa
Bays, March 2018.
Ngakuta Bay Okiwa Bay
Saltmarsh Class, Dominant and subdominant species
ha % ha %
Estuarine Shrub 0.034 3.8 0.1 1.8
Plagianthus divaricatus (Saltmarsh ribbonwood)
Apodasmia similis (Jointed wirerush) 0.03
Juncus kraussii (Searush) 0.06
Leptospermum scoparium (Manuka) 0.04
Rushland 0.765 86.7 5.1 96.0
Apodasmia similis (Jointed wirerush) 0.003 0.04
Juncus kraussii (Searush) 0.24
Juncus gerardii (Saltmarsh rush) 0.003
Juncus kraussii (Searush) 0.24 1.59
Apodasmia similis (Jointed wirerush) 0.10 2.13
Festuca arundinacea (Tall fescue) 0.01
Juncus (gregiflorus) edgariae (Wiwi) 0.07
Plagianthus divaricatus (Saltmarsh ribbonwood) 0.05 0.92
Samolus repens (Primrose) 0.13 0.01
Sarcocornia quinqueflora (Glasswort) 0.03 0.08
Schoenoplectus pungens (Three-square) 0.04
Selliera radicans (Remuremu) 0.20 0.01
Reedland 0.0 0.2
Typha orientalis (Raupo) 0.01
Sedgeland 0.0 0.0
Schoenoplectus pungens (Three-square) 0.002
Herbfield 0.084 9.5 0.1 2.1
Samolus repens (Primrose) 0.03 0.07
Apodasmia similis (Jointed wirerush) 0.003
Isolepis cernua (Slender clubrush) 0.004
Juncus kraussii (Searush) 0.001
Sarcocornia quinqueflora (Glasswort) 0.04
Selliera radicans (Remuremu) 0.03
Samolus repens (Primrose) 0.01
Grand Total 0.88 100 5.3 100
Wriggle coastalmanagement 203 . Res u lt s a nd D i sc u ss i on (con t i n u ed )
accurately. As such the small decrease in saltmarsh recorded in the current study appears due to sam-
pling accuracy rather than meaningful changes in extent. The only area where recent changes were
apparent was the erosion of a small area of rushland in the western end of Thompson Bay.
A supporting measure for saltmarsh is estimated loss compared to expected natural state cover. While
assumptions need to be made regarding likely historical extent, the available habitat within Ngakuta
Bay is naturally restricted by the steep surrounding landforms and would not have been particularly
extensive. It is estimated that 40-60% of saltmarsh has been lost through drainage and conversion to
grassland, a supporting risk rating of MODERATE.
In Okiwa Bay, saltmarsh and wetland areas at the gently sloping head of the bay would have been
naturally extensive. These low lying flat areas, highly valued for pastoral farming, were traditionally
cleared and drained early after European settlement. The current state suggests losses of >60% of
saltmarsh are likely to have occurred in Okiwa Bay, a supporting risk rating of HIGH.
The combined overall risk rating for both Ngakuta and Okiwa Bays was assessed as MODERATE recog-
nising that while saltmarsh is not extensive, future losses from reclamation and drainage are unlikely
due to the increased understanding of their ecological importance.
Jointed wire rush, sea rush & saltmarsh ribbonwood on the western edge of Okiwa Bay.
Jointed wire rush (foreground) and searush. Juncus gerardii, sea rush & saltmarsh ribbonwood.
Rushland with herbfield in the sheltered upper tidal reaches of Okiwa Bay.
Wriggle coastalmanagement 213 . Res u lt s a nd D i sc u ss i on (con t i n u ed )
3.7. 200m Terrestrial Margin
Like saltmarsh, a densely vegetated terrestrial margin filters and assimi-
lates sediment and nutrients, acts as an important buffer that protects
against introduced grasses and weeds, is an important habitat for a
variety of species, provides shade to help moderate stream temperature
fluctuations, and improves estuary biodiversity. The results of the 200m
terrestrial margin mapping of the estuary are presented in Table 7 and
Figure 9 and show Ngakuta and Okiwa Bays had 62% and 46% of the
margin densely vegetated, risk indicator ratings of LOW and MODER-
ATE. The majority of the 200m margin was regenerating native species,
although exotic weeds like gorse and broom were common amongst
Native forest growing by the estuary scrub at Okiwa Bay. Residential development and roading were the
edge at The Grove, Okiwa Bay. other dominant features (32.2% and 25.8% in Ngakuta and Okiwa Bays
respectively), while pasture (26.5%) was also significant in Okiwa Bay.
The greatest area of margin modification was the valley floor of Okiwa
Bay where land was cleared over 100 years ago and converted largely
to pasture. Historically this area supported lowland wetlands which,
apart from their high ecological value, are also very effective at assimi-
lating catchment derived nutrient and sediment inputs. Drainage of
this land has resulted in reduced access for migratory species through
Flapgate and channelisation in habitat loss and the presence of low stopbanks and flap gates to mini-
Okiwa Bay. mise tidal inundation.
Seawalls and armouring were also present throughout much of the
upper reaches of Ngakuta Bay, near the Grove in Okiwa Bay, and in
Thompson Bay. Combined with the steep hillsides the presence of
these features breaks the natural connectivity between the land and
the sea and restricts the opportunities for the natural migration of
estuarine species in response to predicted sea level rise.
Table 7. Summary of 200m terrestrial margin land cover, Ngakuta and
Okiwa Bays, March 2018.
Class Ngakuta Bay Okiwa Bay
Indigenous Forest 6.9 3.7
Developed grassland and amenity Scrub/Forest 54.8 13.5
area in Ngakuta Bay. Scrub 24.8
Estuarine Shrub 3.7
High Producing Exotic Grassland 26.5
Low Producing Grassland 0.9
Park/amenity area 6.1 1.2
Built-up Area (settlement) 26.1 22.8
Road 6.1 3.0
Total 100 100
% Dense vegetated 200m margin 62 46
Restoration plantings in Ngakuta
Bay.
Right: seawall in Ngakuta Bay.
Wriggle coastalmanagement 223 . Res u lt s a nd D i sc u ss i on (con t i n u ed )
Figure 9. Map of 200m Terrestrial Margin - Dominant Land Cover, Ngakuta Bay (top) and Okiwa
Bay (bottom) , March 2018.
Wriggle coastalmanagement 233 . Res u lt s a nd D i sc u ss i on (con t i n u ed )
Dominant
Ngakuta
Land Cover (%)
Okiwa
LCDB4 (2012/13)
Indigenous Forest 28 24
Indig. Hardwoods 26 57
Manuka and/or Kanuka 3 10
Matagouri/Grey Scrub - 6
Gorse and Broom 1 -
Exotic Forest 25 0.7
Ngakuta High Prod. Grassland 16 0.6
Bay Low Prod. Grassland 0.5 0.3
Okiwa Built-up Area 1 1.8
Bay
Total 100 100
Figure 10. Summary of Catchment Land Cover (LCDB4 2012/13), Okiwa and Ngakuta Bays.
Land cover in the wider catchment is shown in Figure 10 highlighting that most native forest is gener-
ally located on the steeper upper catchment slopes, with scrub and exotic forestry on the intermedi-
ate slopes in the middle catchment, and pasture and settlements on the valley floors. The Ngakuta
catchment has 97% indigenous native forest and scrub,3 . Res u lt s a nd D i sc u ss i on (con t i n u ed )
3.8. NZ Estuary Trophic Index
The NZ ETI (Robertson et al. 2016a,b) is designed to enable the consistent assessment of estuary state
in relation to nutrient enrichment, and also includes assessment criteria for sediment muddiness. An
integrated online calculator is available [https://shiny.niwa.co.nz/Estuaries-Screening-Tool-1/] to cal-
culate estuary physical and nutrient load susceptibility (primarily based on catchment nutrient loads
combined with mixing and dilution in the estuary), as well as trophic expression based on key estuary
indicators [https://shiny.niwa.co.nz/Estuaries-Screening-Tool-2/]. The more indicators included, the
more robust the ETI score becomes. Where established ratings are not yet incorporated into the NIWA
ETI online calculator they are included via spreadsheet calculator.
The indicators used to derive an ETI scores for Ngakuta Bay Okiwa Bay are presented below using the
broad scale monitoring results presented in this report.
ETI Tool 1 rates the physical and nutrient load susceptibility of Ngakuta Bay and LOW and Okiwa Bay
as MODERATE.
ETI Tool 2 rates eutrophic symptom scores for Ngakuta Bay as VERY GOOD and Okiwa Bay as MODER-
ATE indicating that there are developing symptoms in response to nutrient enrichment and fine mud
deposition at Okiwa Bay.
Table 8. Primary and supporting indicator values used to calculate an ETI score for Ngakuta and
Okiwa Bays, 2018.
ETI scoring summary for Ngakuta and Okiwa Bays, March 2018. Ngakuta Okiwa
Primary Symptom Indicators for Shallow Intertidal Dominated estuaries
Primary Symptom Value
(At Least 1 Primary Symptom Indicator Required)
Opportunistic Macroalgae OMBT EQR 1 0.45
Required
shallow
Macroalgal GEZ % % Gross Eutrophic Zone (GEZ)/Estuary Area inter- 0 0
tidal
Macroalgal GEZ Ha Ha Gross Eutrophic Zone (GEZ) 0 0
Optional
Phytoplankton biomass Chl- a (summer 90 pctl, mg/m3) water - -
Cyanobacteria (if issue identified) NOTE ETI rating not yet developed column - -
Supporting Indicators for Shallow Intertidal Dominated estuaries
Supporting Indicator Value
(Must include a Minimum of 1 required Indicator)
Mean Redox Potential (mV) at 1cm depth in most impacted
sediments and representing at least 10% of estuary area
- -
Sediment Oxygenation % of estuary with Redox Potential3 . Res u lt s a nd D i sc u ss i on (con t i n u ed )
3.9. Comparison with Other Estuaries
A brief summary has been prepared of the key features within estuaries recently monitored by MDC
and is presented in Figure 11 and Table 9. Figure 11 summarises the intertidal percent of reported salt-
marsh, seagrass, macroalgae and mud, the latter measure including firm muds in Okiwa Bay.
Comparisons need to take into account the fact that the estuaries reflect a variety of sizes and types
and some are naturally limited in the extent of features like saltmarsh that they can support due to
surrounding landforms. However, it is considered worthwhile to report available data as they are
gathered to enable patterns and trends to be investigated. Notwithstanding, it is clear that the extent
of macroalgae in Okiwa Bay is large compared to the other estuaries, and there has been a large in-
crease since 2011. Seeking to understand the possible cause for such a change is important if effective
management is to be undertaken.
There is also a correlation between mud extent and seagrass, with seagrass extent being low where
mud is high, particularly in the larger estuaries e.g. Havelock, Mahakipawa, and Kaiuma.
As these factors are known to strongly relate to two of the most common stressors on estuarine
systems in NZ (fine sediment and nutrient inputs) it is likely that human activities have had, and will
continue to have, a strong influence on the ecological quality of estuaries, and are thus important
targets for policy and management initiatives.
Saltmarsh
Seagrass
Macroalgae
Mud
Okiwa 2018
Okiwa 2011
Ngakuta 2018
Ngakuta 2011
Tuna 2018
Harvey 2018
Duncan 2018
Shakespeare 2016
Waikawa 2016
Kaiuma 2017
Mahakipawa 2016
Havelock 2014
Whangarae 2016
0 10 20 30 40 0 10 20 30 40 0 10 20 30 40 0 20 40 60 80 100
Percent of Intertidal Percent of Intertidal Percent of Intertidal Percent of Intertidal
Figure 11. Summary of key features (% of intertidal area) from estuaries in Marlborough.
Table 9. Percent of intertidal area of saltmarsh, seagrass, macroalgae and mud in selected Marlbor-
ough estuaries.
Mahakipawa 4
Shakespeare7
Whangarae 2
Waikawa6
Havelock 3
Ngakuta1
Dominant Intertidal
Kaiuma5
Duncan8
Harvey8
Okiwa1
Tuna8
Estuary Feature (%)
2011 2018 2011 2018 2016 2014 2016 2017 2016 2016 2018 2018 2018
Saltmarsh 9.6 7.4 8.5 6.2 8.0 33.4 25.2 21.6 0.5 7.9 21.6 20.6 21.1
Seagrass (>20% cover) 7.6 8.8 2.3 3.0 1.7 2.5 0.0 0.0 26.4 31.2 17.0 6.9 24.2
Macroalgal beds (>50% cover) 6.4 0.0 0.7 38.4 0.0 4.5 0.1 0.0 0.0 0.0 0.0 0.0 0.0
Mud 3.9 21.0 37.2 55.0 9.5 76.7 78.7 72.0 7.5 9.8 14.8 19.4 0.0
1. Gillespie et al. (2012), 2. Stevens and Robertson (2016), 3. Stevens and Robertson (2014), 4. Skilton and Thompson (2017), 5. Stevens and
Robertson (2017), 6. Stevens and Robertson (2016a), 7. Berthelsen et al. (2016), 8. Stevens (2018).
Wriggle coastalmanagement 26You can also read