A CASE STUDY FOR MATO GROSSO, BRAZIL - INCREASING AGRICULTURAL OUTPUT WHILE AVOIDING DEFORESTATION
←
→
Page content transcription
If your browser does not render page correctly, please read the page content below
INCREASING AGRICULTURAL OUTPUT WHILE AVOIDING
               DEFORESTATION –
    A CASE STUDY FOR MATO GROSSO, BRAZIL

             BERNARDO STRASSBURG (COORD.) (IIS)

                    LAURENT MICOL (ICV)

                 FABIO RAMOS (AGROSUISSE)

               RONALDO SEROA DA MOTTA (IIS)

                  AGNIESZKA LATAWIEC (IIS)

                    FABIO LISAUSKAS (ICV)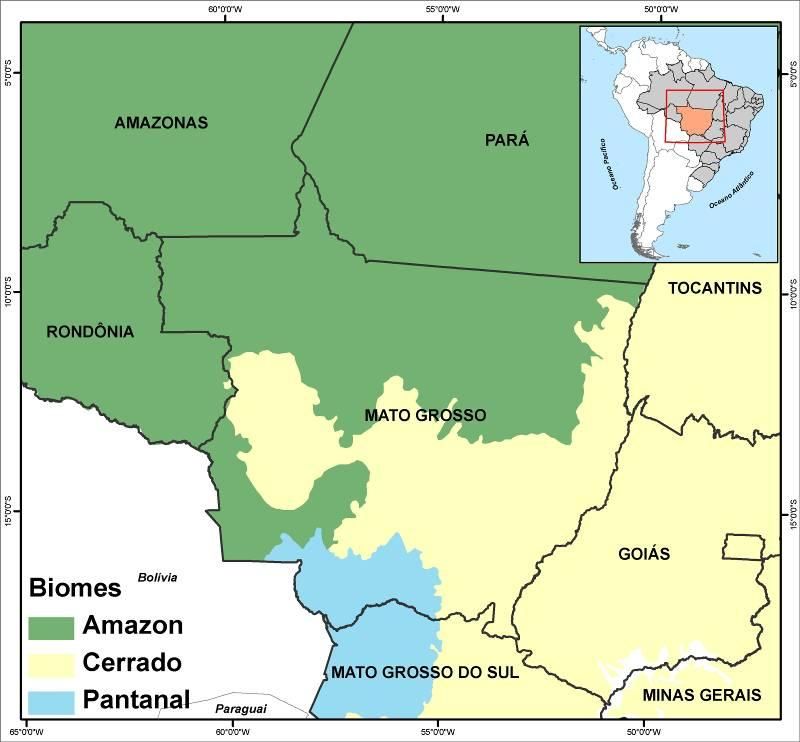
INCREASING AGRICULTURAL OUTPUT WHILE AVOIDING DEFORESTATION –
                                   A CASE STUDY FOR MATO GROSSO, BRAZIL

COORDINATION:

THE INTERNATIONAL INSTITUTE FOR SUSTAINABILITY

IN PARTNERSHIP WITH:

INSTITUTO CENTRO DE VIDA

AGROSUISSE

SUPPORTED BY

PRINCE’S RAINFORESTS PROJECT

PRINCE’S CHARITIES’ INTERNATIONAL SUSTAINABILITY UNIT

CLIMATEWORKS FOUNDATION

CORRESPONDENCE SHOULD BE ADDRESSED TO

B.STRASSBURG@IIS-RIO.ORG

INTERNATIONAL INSTITUTE FOR SUSTAINABILITY

ESTRADA DONA CASTORINA, 124 – HORTO

RIO DE JANEIRO – BRAZIL – 22460-320

TEL/FAX: +55-21-38756218

                                                                                       2
CHAPTER 1 - Introduction

Over millennia, agricultural practices have produced food and fodder for human population. Between 1940
and late 1970s the ‘Green Revolution’ allowed to avoid Malthusian’s gloomy forecasts that the Earth would
not be able to support its growing human population. ‘Green Revolution’ cased on a range of scientific
research and management solutions, such as development of high-yield varieties of cereal grains or
expansion of irrigation infrastructure, doubled global grain production, greatly reducing food shortages
(Tilman et al., 2001) and is believed to have saved millions of people from starvation. Notwithstanding, food
insecurity is currently a major global problem with millions still hungry throughout the planet (due to both
food accessibility and affordability) and the problem may escalate due to increasing population.

On the other hand, the conversion of natural environments into managed ones contributed to major
environmental problems, such as pollution, land degradation and biodiversity loss. Further, land use and
land use change combined contribute 31% of anthropogenic greenhouse gas emissions (IPCC, 2007).
Agriculture has historically been the greatest force of land transformation (Ramankutty et al. 2007), with
population growth and per capita consumption driving global land use change (Tilman et al. 2001). Global
cropland area expanded from 3-4 million km2 in 1700 to 15-18 million km2 in 1990, mostly at the expense of
forests (Goldewijk and Ramankutty, 2004). Similarly, Gibbs et al. (2010) showed that throughout the tropics,
between 1980 and 2000 more than 80% of new agricultural land resulted from deforestation (Gibbs et al.
2010).

According to future projections (Bruinsma, 2009) demand for new agricultural land fuelled by demand for
food, fodder and timber will continue over the next four decades at least, driven by population and per
capita consumption growth. Over the next decades, business as usual, extensive agriculture therefore has
the potential to cause irreversible environmental impacts, especially in tropical forest-countries.

The sustainable intensification of production in current agricultural lands has been suggested as a key
solution to the conflict between expanding agricultural production and conserving natural ecosystems
(Smith et al., 2010; Phalan et al., 2011). It has been shown (e.g. Smith et al., 2010; Herrero et al., 2010) that
it is possible to increase agricultural efficiency and mitigate greenhouse gases through resource conservation
and improvements in land management, which lead to increased yields without further deforestation.
Importantly, in addition to be technically feasible, to regenerate degraded lands and improve supply chain
efficiency, sustainable intensification can result in positive returns to landowners, smallholders, processors,
traders and ultimately governments through increased tax returns and multiplier effects on the economy.
On the other hand, it has been demonstrated (Lambin and Meyfroid, 2011) that increased productivity does
not necessarily lead to land sparing. In many cases, the opposite is true, with increased deforestation
following increases in productivity. This is mainly due to the ‘rebound-effect’, a classic economic effect
where increased productivity makes an activity more attractive, leading to an increase in demand for its
inputs (in this case, land). Further, some approaches to agricultural intensification by increasing use of on-
farm inputs may increase greenhouse gas emissions from use of fertilizers and machinery, and hence be may
not be sustainable over the long term. Moreover, increasing agricultural productivity should be associated
will all elements of the supply chain and linked to market demand. Otherwise, sudden increases in
productivity could lead to price crashes, reduced production and generate unemployment.

                                                                                                               3
In order to prevent deforestation a number of stakeholders should be involved, including private sector,
NGOs and government. Also, upfront investment is required to assist changes in agricultural practice that
will lead in the future to productivity increase. However, even if subsidies are provided, private sector should
be provided with risk reduction mechanism. Unless risk barriers are reduced or eliminated, a shift towards a
more productive agriculture may be heavily constrained.
The purpose of this study is to inform debates associated to Reducing Emissions from Deforestation and
Forest Degradation (REDD+) and sustainable supply chains strategies about the implementation gap and
practical on-the-ground solutions for conciliating agriculture productivity increase and avoided
deforestation. It focuses both at the producer level, investigating financial requirements, and at a broader
implementation level, discussing possible financing and deliverable mechanisms.
4Chapter 2 - Context setting
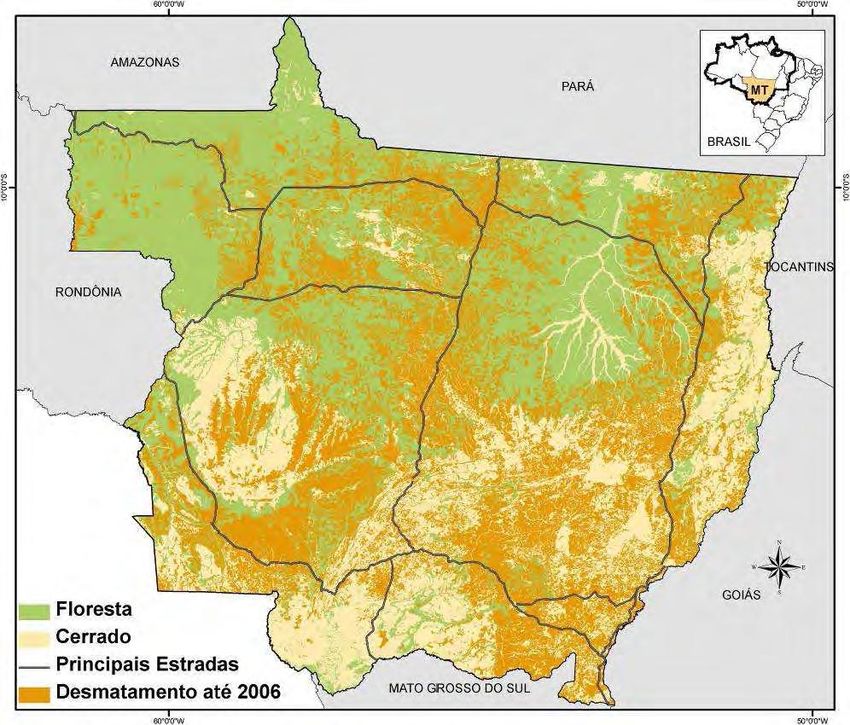
The State of Mato Grosso, located in the Centre-West Region of Brazil, has a total area of 903 thousand
square kilometres, composed of three main biomes: the Amazon forest, the Cerrado (savannah) and the
Pantanal wetlands (Figure 2.1). Its population totals 3.0 million people, with an urbanization rate of 82%.
Figure 2.1- Mato Grosso State, Brazil
Source: IBGE
Current profile of soya and beef production
During the last two decades Mato Grosso became Brazil’s largest producer of grains and livestock, though
with very different profiles in terms of productivity:
Soya production has grown at an average 9.5% per year since 1990 and reached 18.8 million tons in
2010 (27% of Brazil’s production and approximately 7% of the world’s total production); it occupies
6.2 million hectares, with stabilized average yields of 3.0 tons per hectare, slightly higher than the
Brazilian average (Table 4.4). Corn and cotton crops, most often planted in alternating or in double
cropping systems with soya, have also grown steadily since 1990: Mato Grosso’s corn production has
increased at an average 14% per year and reached 8.2 million tons in 2010 (15% of Brazil’s total),
while cotton production rose from 0 to 0.6 million tons, representing 49% of Brazil’s production
(IBGE, 2011a), and is expected to exceed 1 million tons in 2012 (IMEA, 2012). The total planted area
of seasonal crops (including soya, corn, cotton, rice, sugar cane and sorghum) in Mato Grosso was
9.2 million hectares in 2010 (IBGE, 2011a); considering that 30-32% of this area is under double
cropping system, the total area occupied by seasonal crops in the state is approximately 7 million
hectares.
5Table 2.1 - Mato Grosso and Brazil soya indicators, 2010
Mato Grosso /
Indicator Unit Mato Grosso Brazil
Brazil
Planted Area Million ha 6.2 23.3 27%
Production Million tons 18.8 68.8 27%
-1 -1
Productivity Tons.yr .ha 3.0 2.9
Sources: IBGE (2011a). Prepared by ICV
As for livestock, cattle herd grew by 7.5% annually from 1990 to 2005, when it reached 26 million
heads; it remained stable during 2005-2008 but started rising again in 2009 and reached 28.8 million
heads in 2010 (IBGE, 2011b). This herd occupies approximately 25.8 million hectares (IMEA, 2011,
from Acrimat/Sinoptica 2008 – unpublished) in the state, with an average pasture stocking of 1.1
head per hectare. Slaughter amounts to 4.3 million heads (IMEA, 2011, from INDEA, unpublished)
and production totals 1.1 million tons carcass weight per year, meaning an overall productivity of 42
kilograms carcass weight per hectare of pasture. Mato Grosso’s cattle herd, pasture area and
production account for 14%, 13% and 12% of Brazil’s, respectively. Its overall productivity is slightly
lower than the national average, due to a lower average off-take rate and despite a higher pasture
stocking and average carcass weight (Table 2.2). Livestock producers have invested in feedlot in the
last few years and the capacity of the 222 existing units in 2010 adds up to 0.8 million heads, though
still representing a small portion of the total herd (IMEA, 2010a).
Table 2.2 - Mato Grosso and Brazil livestock indicators, 2010
Mato Grosso /
Indicator Unit Mato Grosso Brazil
Brazil
Area of pasture Million ha 25.8 205 13%
Cattle herd Million heads 28.8 209 14%
Pasture stocking Head.ha-1 1.1 1.0
Slaughter Million heads 4.3 43.8 10%
Off-take Percent of herd 151 20
Production Million tons cw 1.1 9.2 12%
Carcass weight Kg per head 250 210
-1 -1
Productivity Kg.yr .ha 42 45
Sources: IBGE (2011b), IMEA (2011) and INDEA, MAPA (2011), Gouvello et al (2010). Prepared by ICV
Besides seasonal crops and livestock, forestry also represents a significant land use category in Mato Grosso.
Log consumption from native forests amounted to 4 million cubic meters in 2009, 28% of the total
consumption in the Brazilian Amazon (Pereira et al, 2010). However, forest management plans in the state
still occupy only 2.3 million hectares in 2010, approximately 6% of the total area of remaining forests in
private properties, where this activity can be legally carried out. Firewood and charcoal are also produced
from native forests, with a volume of 2.2 million cubic meters in 2010 (IBGE, 2011d). Planted forest, with an
1
This low average off-take rate is due to the fact that ranchers in the last 4 years have held more females, with an off-
take rate dropping to 8.2%, while it was higher and increasing for males, at 26.5%.
6extension of approximately 0.2 million hectares (Arefloresta), supplied a total of 0.6 million cubic meters of
firewood, coal and logs in 2010 (IBGE, 2011e).
Land tenure structure is highly concentrated in both seasonal crops and livestock activities in Mato Grosso.
In farms dedicated to seasonal crops, 87% of the area is concentrated in approximately 2,200 properties
larger than 1,000 hectares, which represent less than 14% of the total number of this group of farms. In
cattle ranches, 78% of the area lies in approximately 8,600 ranches larger than 1,000 hectares that represent
less than 8% of the total number of cattle ranches (IBGE, 2009).
Current profile of soya and beef supply chain to consumption
Most of Brazil’s soya production is for exports, although a growing part of it is processed in the domestic
industry. In 2011, 46% of the production was exported in grain and 52% was processed in Brazil to produce
meal for animal feeding (42%) and oil for the food industry or biodiesel (10%), while the remaining 7% was
stocked or directed to other uses. Approximately 44% of the processed meal and oil were exported and 56%
were consumed on the domestic market (ABIOVE, CONAB).
Since 2010 China became Brazil’s #1 buyer of soya products, with a participation of 46% of the total value of
Brazilian exports of soybean, meal and oil, vs. 33% for the EU. China consumes above all soybeans, while the
EU imports mainly meal (MDIC). The soya trading industry is highly concentrated and four companies
(Amaggi, Cargill, Bunge and ADM) hold most of the market in Mato Grosso.
As for beef, the domestic market accounts for most of the Brazilian production (79% in 2010), with an
average per capita consumption of 37 Kg cwe (25.2 Kg of meat) per year. Exports in 2010 represented 1.9
million tons cw, being 71% fresh beef, 17% processed and 11% others (MDIC, ABIEC, ABRAFRIGO). The main
buyers of Brazil’s fresh beef are Russia, Iran and Egypt, while the EU is the main buyer for processed meat
(ABIEC).
The beef supply chain is also highly concentrated with only 3 companies (JBS, Marfrig and Frialto) holding 15
of the 18 major slaughterhouses in Mato Grosso. The total number of slaughterhouses in the state is 55,
with a total industrial capacity of 40.5 heads/ day, which at full capacity represents 12.1 million heads/year.
This capacity was used at only 33% in 2010, as the industry was starting to recover from a financial crisis it
went through during 2008-09.
Agricultural production targets
Both seasonal crops and livestock production are expected to grow significantly during the next decade:
According to IMEA’s projections (IMEA, 2010a) soya yields will increase by 1.5% per year and planted
area by 2.5% per year by 2020, leading total planted area to increase by 1.7 million hectares and
production to increase by 8.9 million tons over the period. This projected area growth is consistent
with MAPA’s projection (MAPA, 2011), which forecasts an additional 1.8 million hectares of soya in
Mato Grosso by 2020. However, MAPA foresees stable yields during this period. Considering that
demand will continue to be strong, the main limitation to area growth is linked to transports
infrastructure and costs. IMEA considers that if the main infrastructure projects are carried out, area
growth could reach 2.5 million hectares, and if not, it could be limited to 1 million hectares. The
most recent figures and short-term projections indicate that the current trend of soya area growth is
higher than IMEA’s higher scenario, which makes it more plausible than the lower or even the
intermediary one. Area growth in other crops should be mostly linked to soya expansion, thus we
7consider that projected growth of soya area is equivalent to projected growth of seasonal crops area
as a whole.
As for livestock, also according to IMEA’s projections (IMEA, 2010a) cattle herd is expected to grow
at an average 2% per year in the next decade, due to improvements in pasture management
resulting in increased stocking capacity. It would then reach 35 million heads in 2020, without
change in the total area of pastures. Besides this, the average off-take rate is expected to grow at an
average 4% per year, due to the increase of feedlots and to the improvement of pasture,
reproductive and feeding management. Thus slaughter and overall production would grow by 6.9%
per year, meaning a 95% percent increase over the period, on the same area of pasture. The
corresponding increase in production would amount to 1 million tons cw, which represents half of
the total increase in beef production projected by MAPA for Brazil by 2020. The Mato Grosso
projections can be considered optimistic, especially considering that during the last five years
stocking increased by 1.5% per year (vs. 2% in the projection) and take-off rate for males grew at an
average 2.9% per year, while it dropped for females (vs. a 4% average in the projection).
Agriculture (soya crops) expansion should occur onto pasture areas. According to an estimate by
IMEA, approximately 35% of the existing pastures in Mato Grosso, representing 9.1 million hectares,
are located on latosoils and thus are supposed to be suitable for agriculture (IMEA, 2010b). One
third of the total potential areas lie in the northeast region of the state, where soya expansion
depends basically upon already planned investments in transport infrastructure (road paving and/or
railroad). The potential area for soya expansion on pastures largely exceeds the 1.7-1.8 million
hectares projected expansion of this crop’s planted area in the next decade. However, this means
that cattle ranching will have to grow on less area, not the same area, as it did during the last few
years.
Status of forest and deforestation
Originally, forests in Mato Grosso occupied 526,000 square kilometres while savannahs occupied 377,000
square kilometres. By 2010, approximately 204,000 square kilometres of forests and 157,000 square
kilometres of savannahs had been deforested, which represents 39% and 42% of their original areas,
respectively (Figure 2.2).
.
8Figure 2.2 – Deforested areas in Mato Grosso
Remaining forests
Remaining savannas
Main roads
Deforested areas
Sources: Prodes/ Inpe, SEMA-MT. Prepared by ICV.
For many years Mato Grosso has been the leading deforester among the Amazon states. During the peak
period of deforestation from 1996 to 2005, the state accounted for 39% of Amazon deforestation and lost
7,700 square kilometres of forests per year, an annual rate of 1.5% of the original forest area. Deforestation
rates reduced since then and went down to 871 square kilometres in 2010, when Mato Grosso accounted for
12% of Amazon deforestation. In 2011 deforestation increased again to 1,126 square kilometres, due to a
few large clearings for soya plantations in the centre-north region of the state (Prodes/INPE).
Mato Grosso was also the leading state in Brazil for deforestation of savannahs during 2002-2008,
representing 21% of the total. During this period it lost 3,000 square kilometres of savannahs per year, an
annual rate of 0.8% of the original area of savannahs. This rate also reduced strongly since 2005 and went
down to 769 square kilometres in 2010 (MMA-IBAMA). At this time still no data is available for 2011.
Climate change and deforestation reduction targets
The Brazilian Government has developed and successfully implemented since 2004 a Plan to prevent and
control deforestation in the Amazon (PPCDAM). The set of measures taken, including the creation of 25
million hectares in new reserves and ratification of 10 million hectares of indigenous lands, the
intensification of law enforcement operations, the creation of a list of critical municipalities and the
imposition of economic restrictions and sanctions on illegal deforesters, are believed to have contributed
significantly to the deforestation reduction that has occurred since 2005.
However, the original plan did not include quantitative targets for deforestation reduction, nor was it
explicitly linked to a climate change mitigation strategy. In 2009-2010 Brazil established its National Policy on
Climate Change (PNMC) and adopted a voluntary goal to reduce GHG emissions: to reduce total emissions by
36 to 39% by 2020 compared to a business-as-usual scenario, meaning an overall stabilization at the current
levels. This goal encompasses a target to reduce Amazon deforestation rates by 80% by 2020 compared to
the 1996-2005 average, and a target to reduce Cerrado (savannah) deforestation by 40% by 2020 compared
9to the 1999-2008 average2 (Brasil, 2010), as well as targets for other sectors, including agriculture. Thus, the
PPCDAM and its counterpart for savannahs, the PPCerrado, as well as the ABC Plan for agriculture, now
constitute NAMAs (Nationally Appropriate Mitigation Actions) as to the international climate change
negotiations.
Additionally, Brazil also created in 2008 the Amazon Fund, a financing mechanism for deforestation
reduction projects whose ceiling is related to the country’s results in terms of deforestation reduction. By
February 2012 the Amazon Fund had been granted R$ 860 million and had approved 26 projects totalling R$
265 million.
Following the national policies, Mato Grosso launched in November 2009 its own Plan to prevent and
control deforestation and fires and adopted a target to curb deforestation in its forest area by 89% by 2020
compared to 1996-2005 (Mato Grosso, 2009). The state still has no target for savannah deforestation
reduction.
Mato Grosso’s Plan to prevent and control deforestation and fires is composed of an integrated set of
programs organized in three areas: Land-use planning, Monitoring and control, and Incentive to sustainable
activities and economic instruments. Although many actions of the Plan were not implemented yet, there
has been progress one important aspect: the environmental registry of rural properties, a necessary step for
the environmental compliance of these properties and a condition for adequate law enforcement. The
registry is now covering 48% of the area of rural properties in the state (ICV analysis, SEMA-MT data).
Figure 2.3 – Deforestation reduction target - Mato Grosso’s forest area, 2006-2020 (km²)
14,000
Baseline
12,000 Actual (1996-2008)
Target (2009-2020)
10,000
8,000
6,000
4,000
2,000
0
96 97 98 99 00 01 02 03 04 05 06 07 08 09 10 11 12 13 14 15 16 17 18 19 20
Source: Mato Grosso’s state Plan to prevent and control deforestation and fires (PPCDQ-MT)
Status of REDD+ policy development
While specific and explicit REDD+ policy has not yet had significant developments at the national level,
besides the PNMC, PPCDAM and Amazon Fund mentioned above, a few Amazon states – especially Acre,
Amazonas and Mato Grosso – have developed their own frameworks and legislation for REDD+.
REDD+ policy development in Mato Grosso has been led by the State Environmental Agency (SEMA-MT) and
by the Mato Grosso State REDD Working Group (MT REDD WG), a technical, open working group established
2
The target for cerrado might be revised to a 60% reduction by 2020 vs. the 1999-2008 average.
10in 2010 within the Mato Grosso State Forum on Climate Change. SEMA-MT has manage the state’s
participation to the Governor’s Climate and Forests Task Force (GCF), where it shares experience with other
states in Brazil and abroad on REDD+ development, while the MT REDD WG has worked on the development
of a state REDD+ draft law.
The initial version of the draft law (MT REDD WG, 2010) that creates the State REDD+ System went through a
participatory construction process that included a wide public consultation, which resulted in many
contributions and changes. The MT REDD WG is currently finishing the final draft of the law project that will
then go through the regular State legislative process.
The proposed State REDD+ System intends to create a practical nested approach. It establishes emissions
reference levels, a monitoring system, a registry of emission reductions and a security reserve at the State
level, as well as a state fund for REDD readiness actions and a public-private financial mechanism for project
financing. These instruments are linked to the project or local level through sector, thematic or regional
programs, still to be developed. The priority sector programs to be developed are for the forestry,
agriculture and livestock, smallholder communities and indigenous people sectors.
Besides the REDD+ draft law, Mato Grosso also has a draft law for an overarching Climate Change Policy, also
developed by the Climate Change Forum, which is expected to go through the legislative process this year.
Other relevant policies and programmes
Brazil’s Low Carbon Agriculture (ABC) Plan, created in 2010 by the federal government, intends to reduce
agriculture emissions in countrywide by 134-163 million tons of CO2 by 2020 promoting a set of low-carbon
techniques (Table 2.3).
11Table 2.3 - ABC Plan’s targets
Area (million hectares) Emissions reduction
Action
Current Additional target (tCO2-e)
1. Expand use of no-till 25 8 16-20
2. Restore degraded 40 15 83-104
pasturelands
3. Promote integrated crop- 2 4 18-22
livestock-forest systems
4. Increase area of 6 3 -
commercial planted forests
5. Promote Biological 11 5.5 10
Nitrogen Fixation techniques
6. Treatment and energy use - 4.4 million 6.9
of animal manure cubic meters
Total 133-166
Source: MAPA (2010)
The plan lists a series of actions to be developed in order to achieve these targets, encompassing research,
capacity building and financing, among others. The total estimated cost for the plan’s implementation is R$
197 billion, out of which the major part (R$ 157 billion) is for rural credit (Brasil, 2011).
The plan’s main action to date was the creation, in 2010, of a new subsidized financing program, the ABC
Program, that received a R$ 2 billion allocation for the first year and R$ 3.15 billion for the second year 3. The
program offers loans with low interest rates (5.5% per year) and extended term (5 to up to 15 years
depending on the type of project) for investments in low carbon agriculture activities. Besides the actions
directly linked to the ABC Plan’s targets, the program also funds the regularization of properties to the
environmental legislation, especially the restoration of legal reserves and areas of permanent preservation
(APPs). The access to this credit was nearly zero in the first year but exceeded R$ 0.5 billion in the second
year – however still representing only 0.7% of the total rural credit.
In order to support the implementation of the ABC Plan, State action plans should be created in 13 priority
states. Among them, by the end of 2011 three states had already established a Management Committee and
developed their action plans, including Mato Grosso. The Mato Grosso action plan consists in 45 proposed
activities, organized around 7 expected results, directly related to the national plan’s targets. However,
these action plans have no budget of their own, which is a critical limitation to their potential effectiveness.
3
This amount represents 15% of credit for investment allocation and 3% of the total rural credit allocation for the 2011-
2012 crop year.
12Chapter 3 - Economic analysis for changes at
producer level
3.1) Description and Assumptions
Farm sizes
In order to investigate the effect of scale on cattle ranching economic performance, we selected three farm
sizes of 290, 1406 and 2558 hectares of pasture. All three farm sizes were modelled adopting an initial
stocking rate of 1.05 animal units per hectare, equal to the base carrying capacity.
Table 3.1 – Farm sizes
Small Medium Large
Total Area (ha) 290 1,406 2,558
Initial Herd 303 1,483 2,817
Systems:
i)Business as Usual (BAU)
Represents the baseline of the farm, keeping the general management based on conventional production
practices. The BAU scenario adopted here can be considered optimistic, as it assumes farmers will not
degrade their pasture areas (by keeping stocking rates at the carrying capacity of the farm and implementing
annual pasture maintenance on 10% of the pasture area) and are complying with labour laws. In addition,
their productivity is higher than the average productivity of the state. It also includes a timid program for
increasing pasture productivity, following the state baseline rate.
Ii) Improved Scenario – Assumes the adoption of a program that increases pasture productivity at a faster
rate, by implementing EMBRAPA’s good practice guidance (EMBRAPA, 2006). These include a more
ambitious program of increasing pastureland productivity by introducing intensive rotated pasture system
(PRI, from “Pastejo Rotacionado Intensivo”). PRI includes the improvement of pasture condition and the
subdivision of pastures with electric fences. In the scenario modelled here, this leads to a doubling of the
base carrying capacity in three years. The Improved Scenario also includes a minor improvement in fertility
rate and weight gains. These gains are on the lower bound of EMBRAPA’s projections, so it is likely that gains
would be higher if the system is properly implemented. We assume the investments lead to improvements
in results for 10 years, after which they are repeated.
13Table 3.2 – Selected Productivity Parameters for BAU and Improved Scenarios
System
Parameter
BAU Improved
Initial 1,05 1,05
Pasture Productivity
Final 1,33 2,10
(AU/Ha)
Average 1,28 2,00
Birth Rate (% / Year) 85 87
Bull 20 20
Pregnant cows 15 15
Non-pregnant cows 12 13
Female Calf 6 6
Animal Weight (@ /Head)
Heifer 11 12
Male Calf 7 8
Male Heifer 12 13
Fattened Cattle 18 19
Farm Productivity (Kg/Ha/Y) 82 154
14Figure 3.1. – Beef productivity over time in BAU and Improved Scenarios (Large Farm)
Beef Productivity
180.00
160.00
140.00
120.00
Kg / ha / year
100.00
BAU
80.00
Improved
60.00
40.00
20.00
0.00
1 2 3 4 5 6 7 8 9 10 11 12 13 14 15 16 17 18 19 20
iii)Silvipastoral Systems
Silvipastoral systems involve the joint management of pastoral and silvicultural activities. From the farmer
perspective, they contribute to increase the income per hectare and reduce the risk of the farm operation by
diversifying unrelated income sources. From the macro point of view, silvipastoral systems contribute to
alleviate the demand for additional land by providing more products from the same unit of area. Silvipastoral
systems increase animal wellbeing by providing shade. There are some evidence this improved animal
comfort can increase milk quality. Some Silvipastoral systems, such as the Intensive Silvipastoral System
(SSPi) being implemented by CIPAV in Colombia can substantially increase pasture productivity. In this
scenario, however, we simulate a simpler silvipastoral system consisting of the planting of 350 eucalyptus
trees per hectare. We do not include any productivity gain for the beef production.
Table 3.3 – Silvipastoral System Variables
Variable
Planting (cost Productivity Replanting (R$) Labour Costs Maintenance Harvesting Last year of Price of wood
in R$) (m3/ha/y) (R$/man/day) Labour Labour pruning (R$/m3)
Requirements Requirements
(man-days) (man-days)
3500 20 350 50 2 6 4 50
iv)Leasing
An increasingly common practice in Mato Grosso is the leasing of part of cattle farms for soybean
plantations. Such practice is constrained by demand for soybean lands, topography, infrastructure and
suitability. For the cattle ranchers such practice is attractive due to higher income. One hectare can be
leased for 20% of the soybean produced in that hectare (we used a value of R$ 320/ha/y). Cattle ranchers
15still use the fraction leased during the winter months for grazing. In this scenario, we assume that the cattle
rancher of medium and large farms will lease half of their farms and adopt the improved system in the
remaining area, guaranteeing that the total beef production will remain at least the same as in the BAU
scenario.
We modelled the performance of all three farms sizes in the “Business as Usual”, “Improved” and “Improved
+ Silvipastoral” systems. For the medium and large farms we also modelled the “Improved + Leasing”
scenario.
3.2) Results
Our results highlight three important aspects of the economics of cattle ranching. First, the business as usual
system presents negative returns in all three farm sizes. Net Present Values (calculated for 20 years using a
6.75% annual discount rate) vary between (R$ 1950) and (R$ 262) and tend to stay in the negative during all
years of the simulated 20 years cycle (Fig 2.1). Multiple explanations have been presented for the
persistence of cattle ranching activities under apparent negative results. These include i)land speculation,
where cattle ranching is a means to secure land ownership with an aim to sell the land when the cropland
frontier advance; ii)money laundering; iii)non-compliance with labour and environmental legislation, which
could lower costs in reality (e.g. in the BAU system modelled, all farmers collect all labour taxes, which add
to a considerable expense); iv)”irrational” behaviour, where losses in the cattle ranching operation are
masked by high gains in other operations of the same farm (such as timber extraction) and tolerated for the
pleasure or status gained; v)extractivism model, where stocking rates higher than carrying capacity are used
for a short period of time, followed by degradation and possible abandonment of the land.
The second aspect highlighted is a strong scale factor. Across all scenarios, larger farms lead to significantly
better results. For instance, in the improved scenario the IRR varies from 8% (small) to 24% (medium) to 31%
(large) as the scale of operations is increased. This effect is due to strong economies of scale in several
individual aspects of the operation, and to the dilution of fixed costs over a larger area.
Thirdly, we have found that the investing in improving productivity leads to very significant gains in cattle
ranching operations. In all farm sizes, the implementation of the Improved System turns a negative BAU
result into a positive one. In large farms, for example, implementing the improved system transform a
negative NPV of R$ 262 per hectare into a positive NPV of R$ 1336 per hectare, providing 170% ROI.
16Table 3.4 - Performance Indicators
Farm Size System Constant Price 10 % Meat Price Premium
EBITDA ROI NPV IRR EBITDA ROI NPV IRR
Small BAU -1580 - -1950 - -1292 -377% -1635 -
Improved 1989 104% 74 8% 2501 139% 704 20%
Improved+Silvipastoral 10474 104% 359 7% 10986 110% 990 9%
Medium BAU -226 - -572 - 69 20% -278 -
Improved 2778 147% 884 24% 3287 174% 1394 34%
Improved+Silvipastoral 11408 111% 1135 9% 11925 116% 1652 10%
Improved + Lease 1515 192% 727 39% 1783 226% 994 56%
Large BAU 116 31% -262 - 403 107% 25 9%
Improved 3234 170% 1336 31% 3747 197% 1849 41%
Improved+Silvipastoral 11705 116% 1621 10% 12217 121% 2134 11%
Improved + Lease 1689 215% 902 45% 1949 248% 1162 62%
An important aspect visible in the cash-flow graph (Fig. 3.2) is the need for finance. In order to make the
transition from the BAU to the improved scenario, farmers need to invest a considerable value upfront. As
can be seen clearly for the medium and large farms, results for the first three years are worse than in the
BAU scenario. The same occur over years 11 to 13 when pasture improvement investments need to be
repeated.
17Figure 3.2 – Cash Flow for 20 years cycle
The results also help to explain why the practice of leasing pasturelands for soybean expansion is becoming
more common. Results in the Lease scenario are the most attractive ones, suggesting cattle farmers would
continue to choose this option when available. This option also presents a practical alternative or at least
complement to regular financing, as the income from soybean can be used to partially finance pasture
improvements.
A potential price premium for beef produced from improved systems would represent a strong incentive for
the adoption of this system (Table 3.4). Questions remain if this incentive could be offered at large scale, but
they might be of great importance in the early stages, for example to finance demonstration projects.
The implementation of Silvipastoral systems greatly increases the NPV per hectare in all cases. As the
investment demanded are considerably high and offer a modest rate of return, however, the performance of
investment related indicators is worse than in systems without this complement. Silvipastoral systems seem
to be of special interest to small farm owners. The importance of Silvipastoral systems as hedge against price
fluctuations will be discussed below.
Table 3.5 – Silvipastoral Results
Silvipastoral Results
EBITDA ROI NPV IRR
8,470 109% 675 8%
18Figure 3.3 – Silvipastoral Cash-flow
Silvipastoral
8,000
6,000
4,000
2,000
R$ / ha
0
1 2 3 4 5 6 7 8 9 10 11 12 13 14 15 16 17 18 19 20
(2,000)
(4,000)
(6,000)
3.3) Risks Analysis
The potential risks associated with the alternative scenario would be the following ones:
i) Production risk – also called agricultural risks, it is related to variations in the expected productivity levels
and input parameters that are not fully known in practices that are not widespread yet. So the financial
analysis will adopt different parameter levels.
ii)Market risk – (i) Meat: although Brazil is the second major meat producer, it 25% share in the export
market is not enough to set prices in the international market. All projection, including FAO (2011), consider
that despite the high prices the market will continuous to prosper due to difficulties in several countries,
including Brazil, to rebuild herds. However, if OECD economic crisis end up also affecting emerging
economies, demand-driven factors may lead the market to stagnation; (ii) Soy: Brazil is also the second
major soy producer but soy is a commodity more sensitive to supply and demand fluctuations, resulting in
significant movements in prices. However, according to FAO (2011), oilseeds in general will benefit from the
worldwide expansion of biodiesel; and (iii) Wood: Brazil has only a dominant position in the international
market of the pulp and cellulose. Other wood and wood-related markets the country has no expressive
participation although with a great potential due to climate and land conditions (SAE, 2011). International
wood market is uncertainty considering wood fast substitution. However, expectations in the domestic are
high for with the actual implementation of the forest code and biodiesel programs. So the financial analysis
will adopt different output price levels also and a sensitivity analysis for the prices of the major cost items.
19iii)Disease risk – One of the major barriers for the export of meat in Brazil is the foot and mouth disease
(FMD). The combat to this disease has been very diligent in the last ten years with the National Program to
Eradicate and Prevent FMD (Programa Nacional de Erradicação e Prevenção da Febre Aftosa – PNEFA) under
the coordination of the Ministry of the Agricuture (MAPA)4. PNEFA has been already successful to eradicate
the disease from most of the country, including the states of Goiás, Mato Grosso, Mato Grosso do Sul and
the south of Pará that were infected until 2005. The Program seems to have reached its maturity with
regular financial flow of resources, stable extension services and increased farm’s awareness. However, the
disease control effectiveness has showed sensitive to rapid increases in the herd size; as it happens in 2005
when the disease was reintroduced in Paraná and Mato Grosso do Sul. It is also recognized that extension
services have failed to reach small farmers in remote areas, as it is the case of the Amazon region that is still
remains mostly as a PMD infected area. This risk should be addressed in the delivery mechanisms by
avoiding no free PMD areas and in free PMD areas enforcing PMD control practices as requisite to financing.
iv)Adoption risk - the adoption of new technologies and practices may generate inertia since it may require
high upfront payments while the return from savings coming over several years. If so, low-income framers
may lack of access to capital to make the investments. Even for major farmers, adoption costs include the
losses of network externalities or qualitative attributes associated with the substituted technology and costs
of learning how to manage the new practice and changing internal structures, cultures and strategies. (Ekins
et al., 2011). This risk should be addressed in the delivery mechanisms with strong extension incentives.
v)Default risk – Agricultural activities usually face high default on loans and lack of collateral. Rural insurance
mechanisms have been developed elsewhere but in Brazil are still incipient and the sector is often bailed
out. However, the National Program in Rural Insurance that gives subsidies to farmers in order to contract
out insurance at the finance system has attempted to reserve this trend and has a promising increase in
coverage (MAPA, 2011). This risk should be addressed in the delivery mechanisms that enable insurance
subsidies.
vi)Regulatory risks – (i) Forest Code: the current changes in discussion through the National Congress will
certainly reduce land restrictions but they can also increase the enforcement of the lax ones to be approved.
The final outcome of the current revision of the Code is not yet decided but it is possible to construct
potential scenarios for APP and legal reserve restrictions. So the good practices considered in the scenarios
of the financial analysis will consider distinct scenarios for land restrictions and its implementation scale; (ii)
Land law: there are recent restrictions on foreigners ownership on rural land in Brazil applying also to
Brazilian companies held by foreign investors, such as, previous approval by the Brazilian Agriculture State
Department (INCRA), rural land owned by foreigners in any Brazilian municipality may not exceed 25% of the
municipality’s total rural land area and foreigners of the same nationality cannot own rural land representing
more than 40% of the total rural land area in the municipality. This risk should be addressed in the delivery
mechanisms by considering leasing procedures whenever is possible; and (iii) The National Policy on Climate
4
http://www.agricultura.gov.br/arq_editor/file/Aniamal/programa%20nacional%20sanidade%20aftosa/evolucao%20ge
ografica.pdf
20Change is not specific on regulation principles for REDD mechanisms so the country has no clear regulatory
framework for REDD (Seroa da Motta, 2011). Several law bill initiatives are already in discussion in the
National Congress but it seems that the federal government is not willing to speed up the approval of any
framework on REDD before this mechanism is better designed within the UNFCC. So REDD market in Brazil
will have to move in the short-term on voluntary and bilateral basis what pushes downwards REDD prices. In
medium and long term, say, from 2020 on, a well established market regulated by the UNFCC and also
restricted control in GHG emission from global agreements will make REDD more attractive pushing up
prices. If so the carbon price that breaks even the financial analysis should be analyzed in accordance to
these possible temporal outcomes.
Table 3.6 Risk Summary
Risks Expected Level
Production Low-Moderate
Market
Meat Low
Soy Moderate
Wood Low
Disease Low-Moderate
Adoption Moderate-High
Default High
Regulatory
Forest Code Low-Moderate
Land Law High
Climate Law Low-Moderate
21Sensitivity Analysis for Market Risks
We simulated how each system would respond to both a decrease of 10% in beef prices and an increase of
10% in production and investment costs. As can be seen in Table 3.7, both changes would have a significant
impact in returns. The Improved system would cover the discount rate (6.75%) only for the large farms. NPV
values would be negative both for small and medium scale farms.
The importance of Silvipastoral systems as a hedge against market fluctuations is clearly demonstrated in
Table 2.7. For both small and medium scale farms, the Silvipastoral systems would help farmers stay at or
very close their breakeven situations.
Table 3.7 – Sensitivity Analysis for Market Risks
Farm Size System 10% drop Beef Price 10% Increase Costs
EBITDA ROI NPV IRR EBITDA ROI NPV IRR
Small BAU -2156 -629% -2498 - -2314 -614% -2691 -
Improved 965 54% -832 - 1164 59% -813 -
Improved+Silvipastoral 9450 95% -546 6% 9649 88% -1347 4%
Medium BAU -815 -235% -1162 - -837 -220% -1219 -
Improved 1758 93% -135 4% 2036 98% -46 6%
Improved+Silvipastoral 10373 101% 100 7% 10667 94% -633 5%
Improved + Lease 981 124% 192 15% 974 112% 107 11%
Large BAU 116 31% -262 - -445 -107% -860 -
Improved 2209 116% 311 12% 2532 121% 444 14%
Improved+Silvipastoral 10679 106% 596 8% 11003 99% -89 7%
Improved + Lease 1169 148% 381 21% 1179 136% 314 18%
3.4. Financing gap to go from BAU to Alternative
The investments required to move from the BAU to the improved scenario are summarized on Table 3.8. The
values are nearly constant per farm size, as we took the conservative assumption of not estimating
economies of scale in the pasture improvement and division item. As this item has been budget by
EMBRAPA for a 300 hectare farm, it is likely that the values presented here are conservative toward the
medium and large farms. Animal acquisitions costs were modelled and project planning costs assumed to be
5% of the financing costs for the first cycle. In the second cycle the pasture investments are repeated as we
assume the investments have a lifetime of 10 years.
22Table 3.8 – Financing Gap from BAU to Improved (20 years cycle)
Small Farm Medium Farm Large Farm
Total Total Total
Per ha Per ha Per ha
(R$ (R$ (R$
(R$) (R$) (R$)
1000) 1000) 1000)
Pasture Improvement and
329
Division 1,135 1,135 1,596 1,135 2,949
Animals Acquisition 97
335 334 469 338 877
First Cycle (Years 1-3)
Project Planning 21
74 73 103 74 191
Sub-Total 448
1,544 1,542 2,168 1,546 4,017
Pasture Improvement and
Second Cycle (Years 1,135 329 1,135 1,596 1,135 2,949
Division
11-13)
Sub-Total 1,135 329 1,135 1,596 1,135 2,949
TOTAL 777
2,679 2,677 3,764 2,681 6,966
23Chapter 4 - Delivery Mechanism
Conciliating the expansion of agriculture with the conservation and possibly restoration of forests in the
agricultural frontier is a complex task that requires a host of complementary activities. In this chapter we
present the components that should be part of such initiative at a statewide level. We then present some
initial insights for a mechanism that could address the core challenge described here (directly linking
increase in agricultural productivity to forest cover). Ideally, this would be part of a concerted statewide
effort including the activities described in the first part. In the absence of those, however, it could be
adopted at a project by project scale.
4.1. Components of a comprehensive REDD+ and agriculture initiative
The land-use challenge that has to be faced – to conserve and augment forest areas while strongly increasing
agricultural output – requires an integrated approach with three basic components:
1) Conservation of remaining forests, through tackling illegal deforestation, decreasing the benefits
from deforestation and increasing the value of standing forests;
2) Restoration of degraded forests, through promoting the restoration of APPs and Legal Reserves; and
3) Improved use of already deforested areas, through increasing productivity – with a focus on cattle
ranching, where most potential productivity increases lie, as well as increasing areas under multiple
uses and implementing land-use planning.
In this work we focused on specific strategies related to the third component.
24Figure 4.4 – Components of a comprehensive REDD+ and agriculture initiative
Challenge
Conciliate forest
conservation with
agriculture expansion
Components
Conservation of Restoration of degraded Improved use of already
remaining forests forests deforested areas
Tackle illegal Monitor and Increase productivity –
deforestation: law strengthen forest code focus on cattle ranching,
Strategies
enforcement enforcement promoting better pasture
& herd management
Use market pressure Provide technical
against deforestation: guidance, financing and
moratorium, sectoral incentives Increase areas under
pacts multiple uses, through
promoting crop-livestock-
forest integration,
Focus of this work
Create incentives for silvopastoral and
conservation and agroforestry systems
sustainable
management of Implement land-use
standing forests planning, directing
policies according to each
region’s potentialities
Source : authors
4.2. Financing mechanism options
The main financing option available for restoration of degraded forests and productivity increases and
implementation of multiple uses in cattle ranching operations is the subsidized loan of the ABC Program (and
other existing programs). However, this mechanism has limitations due to: i) the lack of capacity of local
public extension agents and private service providers to build adequate projects, both on the technical and
financial aspects; ii) the reimbursement period required by the program, especially for pasture reform, that
according to sector representatives should be extended to 12 years instead of 8 years; iii) the high costs of
inputs, especially for pasture reform in regions that are distant from lime stone-pits, which lowers potential
return on investment; iv) the lack of existing models of improved pasture and herd management showing
positive results to producers ; and v) the risk of default perceived as high by the producers, especially
considering their current financial situation. These limitations need to be addressed for the financing
mechanism to work at the necessary scale and time.
The Table 4.4 below discusses the applicability of the different financing mechanism options available.
25Table 4.4 – Financing mechanism options
Option Applicability Discussion
Regular capital Medium Most producers use preferably their own capital for
investment. However, the cattle ranching sector is
composed of family businesses without access to
capital investment from third parties, and the capital
availability of the own businesses to invest in
productivity increases and environmental compliance is
limited.
Grants Low-Medium The scale of the necessary changes in productive
systems greatly exceeds the capacity of grants.
However, these might be important to support pilots.
Loans High The ABC Program and other subsidized credit programs
provide financing for the restoration of degraded
forests for environmental compliance and for
productivity increases and implementation of multiple
uses in cattle ranching operations, although some
limitations have hindered the program’s
implementation.
Provision of Medium The direct provision of inputs can be important to
inputs compensate for the high costs of inputs, especially for
pasture reform and management. Preferably, it should
be used in the initial stages of a program, coupled with
the provision of free extension services, following
successful experiences already implemented in other
regions/contexts.
Provision of Medium The provision of free extension services can be
free extension fundamental at an initial stage, in order to compensate
services for the lack of technical capacity on restoration of
degraded forests, on pasture and herd management for
productivity increase and on implementation of
multiple uses in cattle ranching operations. It should be
coupled with the provision of inputs in pilot areas.
Risk guarantees Medium A risk guarantee provision for the loans would be
important for a larger number of producers to embrace
the program, since the risk (both technical and
financial) is considered a major limitation for them to
take the loans of the ABC Program. This risk guarantee
could be in the form of a risk pooling among loan
takers, intermediated by the state or by the
slaughterhouse companies.
Guarantees of Low Guarantees of purchase do not seem to be an adequate
purchase approach for beef production, since the market is not
26so volatile as for other agriculture commodities and
producers can decide when to sell their herds.
Differentiated Low The changes necessary in the cattle ranching sector are
pricing for the mainstream production and it seems unlikely
that differentiated pricing could apply to that.
Certification Medium Certification is important to encourage investments
schemes and reward the best producers, and could play a major
role. However producers currently consider the return
on investment of certification low.
Link to Medium Buyer companies’ commitments – such as the “legal
companies’ beef” commitment already signed by Mato Grosso’s
commitments main slaughterhouse companies – are a fundamental
strategy to minimize deforestation pressure. It is still
unclear if and how they could be applicable to promote
changes in non-compulsory management practices.
In any case, the involvement of the companies in the
program could be decisive, e.g. for the risk guarantee.
Direct High Direct payments for performance can be applied in this
incentives case – preferably in a second stage after the pilot
(payments for projects with direct provision of inputs and free
performance) extension services are in place. They can be linked to
results in the implementation of given practices, or to
an overall productivity improvement indicator. See
item 3.4 below.
Source: authors
4.3. General elements required to close implementation gap
The main elements necessary to close the implementation gap include shaping, managing and monitoring
the State REDD+ and low carbon agriculture program, implementing a network of demonstration projects in
the major cattle ranching poles throughout the State, providing facilitated access to the ABC program,
strengthening public and private extension services, and performing strategic research on the program’s
themes. The initial cost of this program was estimated to approximately R$ 22 million during the first five
years, not including research needs, monitoring and verification, and the operational costs of extension
services (
27Table 4.5).
Besides these elements, it will also be necessary to implement the State REDD+ System, since the proposed
program is part of this system. This will require an emissions measurement, reporting and verification
system and a registry of emissions reductions, among other necessary structures. The corresponding costs
were not yet estimated, and will be additional to the funds already requested by SEMA-MT to the Amazon
Fund (R$ 65 million) to support the implementation of the State Plan to control deforestation.
28Table 4.5 – Closing the implementation gap: needs, actions and costs
Need Actions Actors Cost estimate Financing options
(R$ ‘000)
Shape state Define program rules, design State Government, 600 (y1) + Grants,
REDD+ and low incentives, develop and Farmers 430/yr (y2-20) State REDD+ fund
carbon monitor action plan Associations, NGOs,
agriculture Research
program institutions
Network of Set up network of Farmers For each pole (10 Grants
demonstration demonstration projects of Associations, NGOs, projects each):
projects in 10 pasture and herd Research 1,300 (y1-2) +
cattle ranching management and multiple institutions 900 (y3-5)
poles throughout use systems, providing:
the State projects development; inputs
for implementation; and
extension services.
Facilitate access Capacity building for project Implementing 200 (y1-2) Own resources
to Low-Carbon developers (10 courses in the financial
Agriculture cattle ranching poles) institutions,
Finance Set up risk management (risk Farmers
To be estimated ?
pooling) mechanism Associations,
Slaughterhouse
companies
Provide Strengthen public extension State agriculture Training: 400 (y1-2) ABC Plan
extension services agency Operational costs: Public budget
services aprox. 15,000 /yr
Capacity-building for private Farmers 400 (y1-2) + 100 /yr Grants, ABC Plan;
service providers (10 courses Associations, Extension costs
in the cattle ranching poles) Research supported by
institutions, NGOs producers
Research Carry out applied research on Research To be estimated Grants, Public
technical, financial and social institutions, NGOs research finance
aspects of improved pasture
and herd management,
multiple use systems, and
forest restoration
Monitoring Implement independent State Government To be estimated
monitoring and verification of (responsibility)
the program, exploring
collaboration with existing
taxation, inspection and
traceability systems
Source: interviews, MAPA (2011), authors
294.4. Proposed mechanism of incentives linking agricultural performance more directly to forest cover
In additional to the general steps outlined above (which should spur significant positive behaviour change), a
complementary system linking direct performance-based changes to forest cover could be implemented. It
could be sub-program under a general REDD+ initiative, or in the absence of such initiative, an independent
program
The “Land-Neutral Agriculture Expansion” (LNAE) mechanism5
In a context of land-scarcity, the expansion of one additional unit of area of a given land-use can be
understood to generate pressure over natural ecosystems proportional to the production displaced by the
expansion. At a jurisdictional level (for example, the State of Mato Grosso), it is possible to identify the
sector or product that demanded additional land and relate this additional demand to the deforestation that
occurred in the same period. In the state, it has been well documented that most soybean expansion
occurred into pasturelands, whereas most newly deforested areas were occupied by pasturelands. This
“indirect deforestation” has been suggested as the main flaw of the soybean moratorium.
Here we reproduce the concept of “Land-Neutral Agriculture Expansion” (Strassburg, 2012) to allow farmers
to demonstrate that their agricultural expansion has not caused any direct or indirect impact over natural
environments. In a context of incentives related to avoided deforestation, this mechanism would allow the
ones who implement to claim avoided deforestation credits. In the absence of such mechanism, it can still be
used to demonstrate commitment to sustainability goals, be it in order to gain access to specific markets or
to meet their or their partners’ sustainability commitments.
The LNAE mechanism consists of a series of coordinated steps to link concerted efforts of expanding
agriculture into a certain area and mitigating or compensating the displacement of the original production in
the area. Such efforts can be understood as a closed system with zero land leakage. This closed system
would merit a very robust claim on avoiding deforestation proportional to the land leakage that would have
occurred in its absence.
The LNAE mechanism could be implemented following three main routes, or a combination of them. In the
first route, the displacement of the original production in the target area for agricultural expansion is
mitigated via the adoption of multiple land use system. In this option, the original production (e.g. beef)
shares the same area with the new production (e.g. soybean) and no displacement occurs.
In the second route, the farm targeted for the agricultural expansion is divided in two areas. In one occurs
the expansion of the new production (e.g. soybean), whereas in the other occurs the intensification of the
original production (e.g. cattle ranching). If the production in the second area is equal to the original
production of the farm, the displacement is mitigated and no leakage occurs.
In the third route, a consortium is formed with one or more additional farms capable of compensating for
the production displaced by the expansion in the target farm. If the total production of the original product
(e.g. beef) in the farms of the consortium is the same as before the expansion of the new product (e.g.
5
The International Institute for Sustainability retains the intellectual property rights over the Land Neutral Agricultural
Mechanism and associated concepts and processes. IIS welcome further correspondence with colleagues and
interested parties about the concept moving forward on research and implementation. For further detail,
correspondence with Dr. Bernardo Strassburg is encouraged: b.strassburg@iis-rio.org).
30You can also read