Viet Nam Case Study Prepared for FAO as part of the State of the World's Forests 2016 (SOFO)
←
→
Page content transcription
If your browser does not render page correctly, please read the page content below
Viet Nam Case Study
     Prepared for FAO as part of the
State of the World’s Forests 2016 (SOFO)

Written by Nguyen Quang Tan and Luong Quang Hung

   RECOFTC – The Center for People and Forests

             Ha Noi, November 2015

                                                   1
The designations employed and the presentation of material in this information product do
not imply the expression of any opinion whatsoever on the part of the Food and Agriculture
Organization of the United Nations (FAO) concerning the legal or development status of any
country, territory, city or area or of its authorities, or concerning the delimitation of its
frontiers or boundaries.
© FAO, 2016
FAO encourages the use, reproduction and dissemination of material in this information
product. Except where otherwise indicated, material may be copied, downloaded and printed
for private study, research and teaching purposes, or for use in non-commercial products or
services, provided that appropriate acknowledgement of FAO as the source and copyright
holder is given and that FAO’s endorsement of users’ views, products or services is not
implied in any way.
2All requests for translation and adaptation rights, and for resale and other commercial use
rights should be addressed to copyright@fao.org.
3Contents of the document
LIST OF FIGURES ................................................................................................................. 6
1 COUNTRY TREND OBSERVATION: FOREST CONDITION, AGRICULTURE
AND FOOD SECURITY.................................................................................................. 7
2 IN-DEPTH COUNTRY ASSESSMENT ........................................................................ 8
A. CONTEXT ASSESSMENT ...................................................................................................... 8
2.1 ECONOMIC DEVELOPMENT ...................................................................................... 8
2.2 DEMOGRAPHY....................................................................................................... 11
2.3 AGRICULTURAL TENURE, INVESTMENT, PRODUCTION, PRODUCTIVITY AND TRADE
............................................................................................................................ 11
2.3.1 Tenure ................................................................................................................... 11
2.3.2 Investment ............................................................................................................. 13
2.3.3 Land productivity .................................................................................................. 14
2.3.4 Trade ..................................................................................................................... 15
2.3.5 Food Assistance .................................................................................................... 17
2.4 FOREST TENURE, PRODUCTIVITY AND TRENDS ...................................................... 18
2.4.1 Forest tenure ......................................................................................................... 18
2.4.2 Investment in the forest sector .............................................................................. 19
2.4.3 Forest production and management ..................................................................... 22
2.4.4 Forest products import and export ....................................................................... 23
2.5 OTHER FACTORS ................................................................................................... 24
B. POLICIES AND INSTITUTIONS ............................................................................................. 25
2.6 POLICIES AND LEGAL ASPECTS .............................................................................. 25
2.7 INSTITUTIONAL FRAMEWORKS FOR LANDUSE CHANGE GOVERNANCE ................... 28
2.7.1 National level land use planning documents for the past 5-10 years ................... 28
2.7.2 Collect information on formal legal procedures and administrative practices of
deciding on or authorizing land use change from forestry to agriculture (and
vice-versa) ............................................................................................................. 29
2.7.3 Assess existence and type of land tenure information/ cadastre information /
registry system (agriculture and forests) that exists in country. ........................... 29
2.7.4 Assess institutions in charge of forests. ................................................................ 30
2.8 FINANCIAL STRATEGIES, PROGRAMMES AND INSTRUMENTS ................................ 32
2.8.1 A brief assessment of major agriculture subsidy policies and their specific
features .................................................................................................................. 32
2.8.2 A brief assessment of forestry subsidy policies that resulted in arresting
deforestation and or increased forest area during the last 25 years along with
their specific features ............................................................................................ 34
2.8.3 A brief assessment of any major change in financial incentives/disincentives for
import/export or trade of major agricultural or forest commodity products ....... 35
42.8.4 A brief assessment of the involvement of the country in international financial
mechanisms ........................................................................................................... 36
3 ANALYSIS OF POSITIVE TRENDS: KEY CONTRIBUTING FACTORS .......... 37
4 SUMMARY/CONCLUSION ......................................................................................... 40
LIST OF REFERENCES ...................................................................................................... 41
ANNEXES .............................................................................................................................. 44
ANNEX A. CHANGES IN QUANTITY AND VALUE OF FIVE TOP AGRICULTURE IMPORT
PRODUCTS, 1990-2012......................................................................................... 44
ANNEX B. CHANGES IN QUANTITY AND VALUE OF FIVE TOP AGRICULTURE EXPORT
PRODUCTS, 1990-2012......................................................................................... 44
ANNEX C. CHANGES IN QUANTITY AND VALUE OF FIVE TOP FOREST IMPORT PRODUCTS,
1990-2014 ........................................................................................................... 45
ANNEX D. CHANGES IN QUANTITY AND VALUE OF FIVE TOP FOREST EXPORT PRODUCTS,
1990-2014 ........................................................................................................... 46
ANNEX E. LIST OF KEY POLICY DOCUMENTS THAT DEFINE FOREST AND AGRICULTURAL LAND
USE ...................................................................................................................... 46
ANNEX F. LIST OF KEY LEGAL DOCUMENTS THAT REGULATE FOREST AND AGRICULTURAL
LAND USE AND CHANGE ....................................................................................... 48
ANNEX G. EXCERPT FROM 'COMPREHENSIVE STRATEGY FOR GROWTH AND POVERTY
REDUCTION TO 2005 AND TOWARD 2010 ............................................................ 49
ANNEX H. TARGETS IN FORESTRY DEVELOPMENT STRATEGIES ........................................... 49
ANNEX I. TARGETS FOR AGRICULTURAL CROP DEVELOPMENT ............................................. 50
ANNEX J. PROVISIONS ON FOREST LAND USE AND PLANNING IN 2004 FOREST PROTECTION
AND DEVELOPMENT LAW .................................................................................... 50
ANNEX K. PROVISIONS ON AGRICULTURAL LAND USE AND PLANNING IN 2013 LAND LAW .. 51
ANNEX L.PROVISIONS ON CONVERSION OF LAND IN 2013 LAND LAW .................................. 52
ANNEX M. LIST OF LAND USE PLANNING DOCUMENTS COLLECTED ..................................... 52
ANNEX N. FORMAL PROCEDURES ON CHANGE OF LAND USE PURPOSE .................................. 53
ANNEX O. CONDITIONS FOR CHANGE OF LAND USE PURPOSE................................................ 54
ANNEX P. KEY POLICY DOCUMENTS ON AGRICULTURAL SUBSIDY......................................... 55
ANNEX Q. KEY POLICY DOCUMENTS ON FORESTRY SUBSIDY ................................................ 56
5List of Figures
Figure 1: Changes in forest conditions, 1990-2010 ................................................................... 7
Figure 2: Evolution in value of agriculture and food production, 1997-2012 ........................... 8
Figure 3: Growth of gross domestic product and per-capita income, 1990-2013 ..................... 9
Figure 4: Changes in economic structure, 1990-2014 ............................................................. 10
Figure 5: Top ten public investments, 2005-2013 ................................................................... 10
Figure 6: Changes in population age structure, 1990-2014 ..................................................... 11
Figure 7: Agricultural land holdings by tenure groups, 2014 .................................................. 12
Figure 8: Changes in total arable land area and size per capita, 1990- 2012 ........................... 13
Figure 9: Trends in investments in agriculture sector, 1990- 2013 ......................................... 14
Figure 10: Trends in gross agricultural production value, 1990- 2013.................................... 14
Figure 11: Changes in agricultural production yields, 1990- 2013 ......................................... 15
Figure 12: Changes in food and cereal import dependency ratios, 1990- 2012 ...................... 16
Figure 13: Changes in share of food import and export in total trade, 1997- 2013 ................. 17
Figure 14: Food aid to Viet Nam, 1990- 2004 ......................................................................... 18
Figure 15: Forest tenure groups 2007- 2013 ............................................................................ 19
Figure 16: Changes in forest area 1990 - 2013 ........................................................................ 19
Figure 17: ODA and public investment in forestry sector 2005 - 2010................................... 20
Figure 18: Growth rates of natural and plantation forests, 1990 - 2013 .................................. 23
Figure 19: Production, import and export of chips and particles, 2000 - 2014 ....................... 24
Figure 20: Current structure of state administration of forestry .............................................. 31
61 Country trend observation: forest condition, agriculture and food
security
Over the last 25 years (1990-2015), Viet Nam has experienced drastic changes in forest
conditions. By early 1990s, Vietnam's forest area reached lowest in history. Yet, the two
decades later experienced significant increase of forest area in both plantation and natural
forests, from 9.14 million ha (28% forest cover) in 1990 to 13.95 million ha (40.96% forest
cover) in 2013, representing an increase of 4.8 million ha in 23 years or 210 thousand ha per
year (FAO 2014). Along with this line is the expansion of forest area through afforestation,
natural expansion of forest and reforestation (see Figure 1). At the same time, deforestation
continued to happen, though no time series data are available, a snap shot of 2010, for
example, indicates that almost four thousand ha of forest was lost. Most importantly, forest
degradation continued, particularly between 1990 and 2005, with the area of rich quality
forest going down from 384 thousand ha in 1990 to 187 thousand ha in 2000 and down to
only 85 thousand ha in 2005, and staying relatively stable since then. Plantation of tree crops,
such as rubber, has also been on the rise. Area under rubber has quadrupled from 221
thousand ha in 1990 to 911 thousand ha in 2012, at around 31 thousand ha per year for 22
years (FAO 2014).
Figure 1: Changes in forest conditions, 1990-2010
0.6
0.5
0.4
Forest area (million ha)
0.3
0.2
0.1
0
1990 2000 2005 2010
Afforestation Natural expansion of forests
Reforestation Rich quality forest area
Source: FAO 2014
In agriculture sector, the country has experienced a drastic shift from production for domestic
consumption to more cash oriented production over the last 25 years. Rapid growth in
production of cash/ tree crops has also been observed. The major ones include pepper
(growing area expanded 6.4 times between 1990-2013), coffee (growing area expanded 4.3
times between 1990-2013), and rubber (growing area expanded 3.3 times between 1990-
2013) (FAO 2015). The value of agriculture production has doubled between 1997 and 2012
(see Figure 2). Yet, the share of agriculture production in the country's gross domestic
product (GDP) has gone down from 38% in 1990 to 22.7% in 2000 and only 18% in 2014
(World Bank 2015).
7In food production, Viet Nam has achieved significant results. While Viet Nam was a net
importer of staple food during 80s, it has been among the top rice exporters in the world since
the end of 1990s, with the quantity of rice export going up from three million ton in 1996 to
over eight million tons in 2012. This is due to the growth of rice production from 26 million
ton to 43.7 million ton during the same period. Overall, the value of food production has
doubled between 1997 and 2012; and the food supply per capita has increased from 2,018 to
2,703 kcal per day in the same period. At the same time, malnutrition has gone down from
22% to 9% (FAO 2015).
Figure 2: Evolution in value of agriculture and food production, 1997-2012
35
30
25 Value of agriculture
Billion 2004-2006 $
20 production
15 Value of food
production
10
5
0
1997 2002 2007 2012
Source: FAO 2015
2 In-depth country assessment
A. Context Assessment
2.1 Economic development
Viet Nam has experienced radical changes in its economy since 1990s (Figure 3). Gross
Domestic Products (GDP) increased remarkably at the rate of 8.2% / year on average
between 1990 and 1995 (notably at 9.5% in 1995). Between 1996 and 2000, a slower growth
rate of 7.0%/ year on average. The pace gained again at the rate of 7.5%/ year on average
between 2001 and 2005, but then slowed down again at 7.0%/ year between 2006 and 2010,
and 5.6% between 2011 and 2013. Overall, GDP grows at the rate of 7.2%/ year on average
for the whole period from 1990 to 2013; and GDP in 2013 is almost fourfold of that in 1990
(World Bank 2015).
Along with the economic development is the growth in per-capita income (Figure 3). As of
1990, Viet Nam was among the poorest countries in world, with the per-capita income at
130US$ per person (versus 285US$ of the least developed countries). The situation changed
rapidly. In 1995 and 2000, per-capita income of Viet Nam is 260US$ and
400US$ respectively. In 2008, Viet Nam became a middle income country when its per-
8capita income reached 1,000US$. As of 2014, average income of a Vietnamese reached
1,890US$ and Viet Nam remains a lower middle income country (World Bank 2015).
Figure 3: Growth of gross domestic product and per-capita income, 1990-2013
100 2
90 1.8
80 1.6
GDP
70 1.4
Thousands US$
60 GNI per capita 1.2
Billion 2005 US$
50 1
40 0.8
30 0.6
20 0.4
10 0.2
0 0
1990
1992
1994
1996
1998
2000
2002
2004
2006
2008
2010
2012
Source: World Bank 2015
Along with the overall economic growth in the last 25 years is the development of various
sectors, particularly the development of processing/ manufacturing industries (Figure 4). In
1990, share of agriculture production in national GDP and service sectors were almost 40%
each. The structure of the economy has changed, with industry sector taking over the role that
agriculture used to play. For the past 10 years, despite of the growth in agriculture
production, the share of agriculture sector has shrunk down to around 18% of the GDP, at the
growth of industry sector (38.5%) and services (43.5%). Within agriculture sector, the share
of forestry has shrunk down even more drastically. While forestry contributed to 8.57% of
GDP in 1990, it made up only 5.5% of GDP in 1995. Since 2000, it has been around 1.7-
1.4% of the national GDP (World Bank 2015). It is however important to note here that
unlike other countries, wood and forest products processing and manufacturing are not
counted as forestry in Viet Nam. Instead, they are part of industrial/ service sector. This
necessarily means a significant loss of GDP from forestry sector to industrial and services
sector.
9Figure 4: Changes in economic structure, 1990-2014
100%
90%
80%
70%
60% Services
50%
Industry
40%
Agriculture
30%
20%
10%
0%
1990 1995 2000 2005 2010 2014
Source: World Bank 2015
In terms of public investment, around 50% often goes to top four sectors: transportation and
warehouse, processing and manufacturing industry, and public services (including state
administration, public security, social insurances and others) (see Figure 5). The other 30% of
the public investment is directed to six other sectors, namely construction, agriculture
(including forestry and fishery), education and training, mining, communication, and water
supply and waste treatment. In general, around 80% of the public investment goes to top ten
sectors, and the rest to other sectors, including but not limited to health care, recreation,
restaurants, support services (GSO 2015).
Figure 5: Top ten public investments, 2005-2013
90%
Water supply & waste treatment
80%
Communication
70%
Mining
60%
Education and training
50%
Agriculture, forestry and fishery
40%
Construction
30%
Public services
20%
Processing & manufacturing
10%
Energy
0%
Transportation and warehouse
2005 2007 2008 2009 2010 2011 2012 2013
Source: GSO 2015
Foreign remittances have been growing fast, from 1.34 billion US$ in 2000 (no data available
before this date) to 3.15 billion in 2005 and 8.6 billion in 2011. Yet, its share in GDP has
grown only from 3.98% to 5.47% and 6.35% in the respective years (World Bank 2015).
102.2 Demography
The population of Viet Nam has increased by 37% for the last 25 years, from 66 million in
1990 to 90.7 million in 2014. Most people still live in the rural area, though at declining
trend. That is, the rural population has been going down from 79.9% in 1990 to 67% in 2014,
but still remains high. Urban population has expanded from 20.1% in 1990 to 33% in 2014.
The net aggregated rate of migration from rural to urban area was 7.9% for the period of
2005-2009, and 8.2% between 2010-2013 (World Bank 2015).
In terms of growth, annual population growth is around 1.33% over the whole period 1990-
2014, with urban population of 3.36% per annual and rural population of 0.64% per annual
on average (World Bank 2015).
In term of age structure, the percentage of population in working ages (15-65 years) is
growing, from 57% of the total population in early 1990s to 70% in recent years, while the
percentage of population in the ages of 0-14 is shrinking, from 37% to 23% in the same
period (Figure 6). By contrasts, population over 65 remains relatively stable, at around 5.8-
6.5%. In terms of sex, the male-female ratio has been maintained at around 49.5:50.5 over the
last 25 years, with slight decrease in the gap between the two sexes (World Bank 2015).
Figure 6: Changes in population age structure, 1990-2014
100%
90%
Population ages
80%
65 and above
70%
60% Population ages
50% 15-64
40%
30% Population ages
0-14
20%
10%
0%
1990
1992
1994
1996
1998
2000
2002
2004
2006
2008
2010
2012
2014
Source: World Bank 2015
There is no official statistic data available on the number of people living near or in the forest
area in Viet Nam. Researchers estimated around 25 million people living near or in the forest.
2.3 Agricultural tenure, investment, production, productivity and trade
2.3.1 Tenure
The major shift in agricultural land tenure in Viet Nam started in mid-1980s, known as the
agricultural land tenure reform (giao đất nông nghiệp). The reform provided opportunity to
allocate legal rights to the land to individual farmers along with land use certificate (known
as the Red book). By 2009, almost all of the agriculture land has been allocated to land users
11(World Bank 2010). This is a significant change in landholding, compared to the situation
before the agriculture land reform where agricultural land was mostly under collectives.
In terms of land users, there are different tenure groups as defined by law, including (1)
domestic organizations (e.g., political organizations and units of the People’s Armed Forces),
(2) economic organizations, (3) communities, (4) households and individuals, (5) religious
establishments, (6) foreign organizations with diplomatic functions, (7) Vietnamese residing
overseas, and (8) foreign organizations and individuals investing in Viet Nam (MONRE
2014). Figure 7 presents the agricultural land holdings by tenure groups as of 2014. No time
series data is available to describe changes over time.
Figure 7: Agricultural land holdings by tenure groups, 2014
Joint ventures Foreign
Other domestic
0.01% organizations Communities
organizations
0.10% 1.21%
1.33%
State agencies
20.09%
Domestic
economic
organizations
10.98%
Communal Individuals and
People's households
Committees 53.46%
12.82%
Source: MONRE 2014
Although land was allocated at a relatively equitable share during the agricultural land
reform, landlessness and near-landlessness has been observed and on the rise during the past
25 years. Using Viet Nam living standard survey data of 2002 and 2004, Nguyen et al 2006
indicates that around 21% of the population reported reduction of their perennial cropping
land (while other land remain relatively the same), mainly due to conversion to non-
agricultural uses (expansion of industrial zones, urbanization, and public works), and to
certain extent the sale of land to pay off debt. Similarly, Ravallion and Walle (2006) confirm
that there was a rise in the landlessness rate in the decade following the reform, which
undermined the gains from the relatively equitable distribution of land achieved at the time of
de-collectivization. In terms of overall land area, the statistics on arable land indicates that
although arable land has been expanding, the arable land size per capita is now lower than
that in 1990. Yet, the trend has been unstable (see Figure 8) (World Bank 2015).
12Figure 8: Changes in total arable land area and size per capita, 1990- 2012
25 0.086
Arable land (% of total land) Arable land per capita 0.084
20 0.082
0.08
% of total land area
0.078
ha per capita
15
0.076
0.074
10
0.072
0.07
5 0.068
0.066
0 0.064
1990
1992
1994
1996
1998
2000
2002
2004
2006
2008
2010
2012
Source: World Bank 2015
Statistic data also indicate loss of forest due to land conversion since 2002 till date (no
statistics available before 2002), with the aggregated area of around 346 thousand ha over the
period of 11 years (between 2002 and 2013), or 31.4 thousand ha per year (FPD 2015).
2.3.2 Investment
In general, the have been growing trends in all aspects of investment in agriculture sector in
the past 25 years (see Figure 9). Domestic private investment made up the largest share of the
total investment in agricultural sector (around 73% in 2005, for example), its growth rate was
relatively modest, at around 5% per year on average for the period of 1990-2007 (where data
are available): at 6.09% per year between 1990-1995, 5.34% between 1996-2000, and down
to 4.7% in 2001-2005. Domestic government spending in agriculture increased from around
160 million US$ in 1990 to 440 million in 1995, 770 million in 2000, 960 million in 2005,
1.78 billion in 2010 and 1.68 billion in 2013, at the growth rate of 11% per year on average
between 1990-2013 (GSO 2015, IFPRI 2015).
Foreign direct investment also has an impressive increase from 243 million US$ in 1990 to
5.7 billion in 1995, 14.7 billion in 2000, 22.5 billion in 2005, 56.9 billion in 2010 and 81.7
billion in 2013, at the growth rate of 33% per year on average between 1990-2013.
Data for overseas development assistance and aids (ODA) are not available per year. Instead,
Annual ODA figures presented in Figure 9 are averages of data available for the respective
periods. Therefore it is not possible to calculated annual growth rate of ODA. Overall, ODA
are at around 261 million US$ per year for the period of 1993-2013 (FAO 2015, GSO 2015,
IFPRI 2015, MARD 2014, UNTACD 2015).
13Figure 9: Trends in investments in agriculture sector, 1990- 2013
100
90
Domestic private
80 investment
70
Billion US$
Domestic government
60 spending
50 Official development
40 assistances and aids
30 Foreign direct
20 investment
10
-
1990
1992
1994
1996
1998
2000
2002
2004
2006
2008
2010
2012
Note: data are not available for domestic private investment between 2008 till date, and for ODA
between 1990-1992.
Source: FAO 2015, GSO 2015, IFPRI 2015, MARD 2014, UNTACD 2015
2.3.3 Land productivity
Overall there is an increasing trend in agricultural production over the last 25 years in all
aspects. As presented in Figure 10, agricultural production has increased more than twofold
or 5% per year on average between 1990 and 2013. The fastest growing trend is found in
non-food production, with a growth of nine folds in total value or 11% per year in the same
period. Food and crop production values increase at the same rate, of 5% per annual whereas
livestock production increases at 6% per annual and cereals at 4% (FAO 2015).
Figure 10: Trends in gross agricultural production value, 1990- 2013
25
Billion 2004-2006 constant USD
Cereals (Total)
20
Crops (PIN)
15
Livestock (PIN)
10 Food (PIN)
5 Non Food (PIN)
Agriculture
0 (PIN)
1990 1992 1994 1996 1998 2000 2002 2004 2006 2008 2010 2012
Source: FAO 2015
14Agricultural productivity generally increases for the last 25 years, yet with different rates and
varies across different crops. Tree nuts increase at the highest rate, at an average of 11% per
annual or 265% overall between 1990 and 2013. Cereal ranks the second in growth rate, with
an increase of 6% per annual in the same period. Fibre crops and coarse grains rank third,
with an increase rate of 5% per year. Yields of other crops grow at the rate of 4% or less per
year, with fruit yield increasing the lowest, at only 1% per year Figure 11).
For each crop, the growth in yield also varies across years. Cereal yield appears to be the
most stable among all, with only two in 23 years (1990-2013) that the yield was lower than
that of the preceding year. Fruits again have the most unstable yield growth, with 15 times in
23 years the yield dropped compared to the preceding year. For other crops, the number of
years with yield fall is between 4 and 10 (FAO 2015).
The most plausible explanation for the variation of yields in crop production is from the
market/ demand side. Cereals are main staple food in Viet Nam whose demand is stable. By
contrast, fruits (and various other crops) are dependent on Chinese market where the demand
is highly unstable over the last decades. In addition to market/ demand, other factors also
influence the crop yields, including weather conditions/ climate change, and investment
(induced by market failure/ fluctuation).
Figure 11: Changes in agricultural production yields, 1990- 2013
18 Cereals
16 Roots and Tubers
Pulses
14
Treenuts
12
Yield (ton per ha)
Oilcrops Primary
10
Fibre Crops Primary
8 Vegetables & Melons
6 Fruit excl Melons
4 Citrus Fruit
Coarse Grain
2
Oilcakes Equivalent
0
1990 1992 1994 1996 1998 2000 2002 2004 2006 2008 2010 2012
Source: FAO 2015
2.3.4 Trade
Overall, there is a significant growth over the last 25 years in terms of volume (both quantity
and value in US$) of import products (see Annex A). Import of wheat, for example, has
increased from 27.5 thousand tonnes in 1990 to 540.8 thousand tonnes in 2000 and 2,406.6
thousand tonnes in 2012 – an incredible growth of over 86 folds in 23 years and more than 3
15folds between 2000-2012. Significant increase also observed in maize and cake (soybeans)
between 2000-2012 (FAO 2015).
The type of products in the top five import changed significantly between 1990-2000 but
more stable between 2000-2012. In quantity table, only wheat stayed from 1990 to 2000 (and
for all three years quoted), whereas four new items appeared on the top five import in 2000.
By contrast, there was only one change from malt to soybeans between 2000-2012. Similarly,
only cotton lint stayed in top five in value table from 1990 to 2000 (and 2012), whereas only
oil palm was replaced by beverages between 2000-2012 (FAO 2015).
In terms of export, there is a general trend of growth in both quantity and value (Annex B).
The quantity of most export products went up more than two folds every ten years. Most
prominently were cassava between 2000 and 2012 (more than 16 folds) and coffee between
1990 and 2000 (more than 7 folds). The growth in value was also very impressive, more than
two folds every ten years. Rubber export value made significant growth between 2000-2012,
at over 11 folds. Cashew and coffee export values also grew very fast between 2000-2012, at
over 6 folds (FAO 2015).
Export products remained rather stable over the three years quoted, with only one new
product appeared on top five list, except for export value between 1990-2000 where two new
products appeared. In general, the top three products were stable over the years, with changes
only in order within the three (FAO 2015).
Viet Nam has been a net food exporting country over the last 25 years, with a negative food
import dependency ratio growing in absolute term (Figure 12). On average, the ratio was at -
78% over the period of 1990-2012 (where the data are available), with the lowest at -18% in
1990 and 1992, and highest at -217% in 2010. Similarly, Viet Nam has experienced a
negative cereal import dependency ratio during the same period (Figure 12). The average
ratio was at -27%, lowest at -11% in 1997 and 1999, and highest in 2012 at -54% (FAO
2015).
Figure 12: Changes in food and cereal import dependency ratios, 1990- 2012
1990
1992
1994
1996
1998
2000
2002
2004
2006
2008
2010
2012
0%
Food import
-50% dependency ratio
-100%
Cereals import
dependency ratio
-150%
-200%
-250%
Source: FAO 2015
16Comparing to total trade, there has been a growing trend in food import. Between 1997 and
2013 (where data are available), the share of food import in total import merchandise was
6.69% on average, growing from 4.95% in 1997 to 6.43% in 2005 and to 8.26% in 2013. By
contrast, there has been a declining trend in share of food export in total export merchandise.
Between 1997 and 2013, the average share of food export was 22.34%, declining from
30.23% in 1997 to 22.23% in 2005 and down to only 14.45% in 2013 (FAO 2015).
Figure 13: Changes in share of food import and export in total trade, 1997- 2013
35
Food imports (% of merchandise imports)
30
% of total mechandise trade
Food exports (% of merchandise exports)
25
20
15
10
5
0
1997
1999
2001
2003
2005
2007
2009
2011
2013
Source: FAO 2015
2.3.5 Food Assistance
Despite of being a net food exporting country, Viet Nam received food aid during the past 25
years, though the trend was not stable (see Figure 14). The main products were cereals, wheat
& wheat flour, non-cereals, pulses, vegetable oils, milk, sugar, others (including editable fat,
rice, meat products, dairy products, blended and mix). The top two products (received
annually between 1990 and 2004 where data are available) were cereals and wheat /wheat
flour, with the average receipt of 48.2 and 47.6 thousand tonnes per annual, respectively
(FAO 2015).
17Figure 14: Food aid to Viet Nam, 1990- 2004
250
Others*
200 Sugar
Thousand tonnes
Milk
150
Vegetable Oils
100 Pulses
Non-Cereals
50
Wheat & Wheat Flour
Cereals
0
1990 1992 1994 1996 1998 2000 2002 2004
Source: FAO 2015
2.4 Forest tenure, productivity and trends
2.4.1 Forest tenure
For the last 25 years, there has been a major shift in forest tenure in the whole of Viet Nam.
The reforms in forest policies during the 1990s prompted a shift from state forestry to more
people-centered forestry. In early 90s, State forest enterprises (SFEs) were the major actors in
forest management. By early 1990s, Viet Nam started with a forest tenure reform process,
known as Forest Land Allocation (FLA) with the aim to involved different stakeholders in
forest tenure. By now, there are eight forest tenure groups, namely 1) households and
individuals, 2) communities, 3) Protection forest and special use forest management boards
(state bodies responsible for conservation of protection forests and special use forests,
respectively), 4) state-owned forest companies (SFC), 5) other economic entities, 6) the armed
forces, 7) communal people’s committees, 8) others (e.g. organizations involved in forestry-
related scientific research and technological development, and training). Communal People's
Committees (CPCs) are only temporarily taking care of the forests which have been given back
from SFEs/SFCs and are waiting to be allocated to other stakeholders.
The area of forest under SFEs (currently reformed into SFCs) has quickly gone down (to around
1.9 million ha in 2013), at the expansion of forest area under Management Boards (MB) and
particularly local people (including individuals, households and village communities) - see
Figure 15 for the structure of forest tenure in recent years (2007-2013), unfortunately, data of
earlier years are not available. By the end of 2013, over 28% of the forest area in Viet Nam
was under management of local people (FPD 2015). This is a significant shift in forest tenure
compared to the pre-1990 situation where SFEs / SFCs were the key players and no forest was
under management of local people. Yet, the situation is not the same across the country as some
provinces are more advanced than others in allocating forests to local people. For example,
while local people are managing most of the forest in Son La province, the area of forest
18allocated to local people accounts for less than 1% of the total forest area in Lam Dong province
(Nguyen et al 2014). Unfortunately, no data at the provincial level are available.
Figure 15: Forest tenure groups 2007- 2013
100%
90%
80% People's Committee
70% Others
60% Communities
50% Households
40% Armed force
30% Other economic entities
20% State Forest Companies
10% Management Boards
0%
2007 2008 2009 2010 2011 2012 2013
Source: FPD 2015
One success of forest tenure reform is its contribution to the increase of forest cover in the
past 25 years (see Figure 16). Vietnam’s forest cover has experienced a dramatic turn-around
from decline until early 1990s to growth afterwards: from 9.14 million ha (28% forest cover)
in 1990 to 13.95 million ha (40.96% forest cover) in 2013, representing an increase of 4.8
million ha or 43.44% of the forest area in 23 years (FAO 2014, FPD 2015).
Figure 16: Changes in forest area 1990 - 2013
16
14
12
10
Forest area (million ha)
8 Plantation forest
6 Natural forest
4
2
0
1990 1995 2000 2005 2010 2013
Year
Source: FAO 2014, FPD 2015
2.4.2 Investment in the forest sector
There is a general lack of data on investment in forest sector in Viet Nam (disaggregated
from agricultural investment), particularly on private investment (both from domestic and
19foreign sources). From what is available in terms of public investment and oversea
development assistance and aids, there is a general increase in public investment, though the
amount expressed in USD reflects a decline due to the devaluation of Vietnamese Dong
against the USD. ODA commitment in on the increased (MARD 2013) yet the actual
disbursement as illustrated in Figure 17 indicates a relatively unstable trend over the period of
2005-2010. Most importantly, ODA appears to play a very important role in forestry
investment as it surpasses the Government of Viet Nam's spending on forestry by far, for
example, 95 million US$ in ODA versus 225 thousand US$ in government spending in 2005,
and 85 million US$ versus 216 thousand US$, respectively, in 2010 (FAO 2014, MARD
2013). This mostly due to 1) Viet Nam's progressive reform in forestry sector since early
1990s, 2) pro-activeness of the forestry sector in approaching new initiatives on development
cooperation and climate change, and 3) Viet Nam's early engagement in regional and
international commitments, conventions, and treaties (MARD 2013).
Figure 17: ODA and public investment in forestry sector 2005 - 2010
100
0.23
0.22 Public
80 expenditure
60
Millions USD
Oversea
95 96 100 97 development
40 87 85 assistance and
aids
20
-
2005 2006 2007 2008 2009 2010
Note: Public expenditure data were available only for 2005 and 2010.
Source: FAO 2014, MARD 2013
Key external support programs to forest sector recently include:
The Trust Fund for Forests (TFF): established in 2004 as a financing mechanism for
pooling donor contributions and ensuring these are used effectively to address sector
priorities, with four bilateral donors (Finland, the Netherlands, Sweden and Switzerland)
committing to pool their ODA contributions in support of Vietnam’s forest sector. In
addition, Germany contributes technical assistance for development and operation of the
TFF. The TFF provides support in the form grants either as a sole donor or co-financier
to programs, projects and non-project activities. Between 2006-2013, 34 projects and
activities had been endorsed for support from the TFF with a total value of 33.89 million
EUR. In 2012, MARD decided to merge TFF into the Viet Nam Forest Protection and
Development Fund from 2013.
20 The Vietnamese-German Forestry Program: established in September 2005 for the
duration of nine years (till September 2014) with the aim to increase the efficiency and
sustainability of forest management and the forest industry in Viet Nam through 3
components: (i) sustainable natural forest management; (ii) processing, trade and
marketing of important forest products and (iii) forest policy advice.
The Vietnamese-German Biodiversity Program: the program was launched in 2014, after
the completion of the Vietnamese-German Forestry Program, and will run until 2017
with the goal to create important prerequisites for conservation and sustainable use of
biodiversity and ecosystem services of forests in Viet Nam at the central level. The
program focuses on three components: 1) Legal framework (advisory support for the
drafting of legal documents), 2) Development of institutional capacity (implementing the
National Capacity Development Plan for Protected Area Management), and Timber
legality (VPA FLEGT and TLAS). Total budget for the program between 2014 and 2017
from German side is 4.5 million EUR.
The UN-REDD Program: Phase I of the program took place between Aug 2009 and June
2012, with the objective to "assist the Government of Viet Nam in developing an
effective REDD+ regime in Viet Nam and to contribute to the reduction of regional
displacement of emissions”. Phase II of the program (2013-2017) aims to enhance Viet
Nam’s ability to benefit from future results-based payments for REDD+ and undertake
transformational changes in the forestry sector. It focuses in six provinces (Lao Cai, Bac
Kan, Ha Tinh, Binh Thuan, Lam Dong and Ca Mau) but also works in other forested
provinces. Key outcomes include 1) Capacities for an operational National REDD+
Action Programme (NRAP) are in place. 2)The six pilot provinces enabled to plan and
implement REDD+ actions. 3) National Forest Monitoring System (NFMS) for
Monitoring and Measurement, Reporting and Verification and National REDD+
Information System (NRIS) on Safeguards are operational. 4) Stakeholders at different
levels are able to receive positive incentives. 5) Mechanisms to address the social and
environmental safeguards under the Cancun Agreement are established. 6) Regional
cooperation enhances progress on REDD+ implementation in the Lower Mekong Sub-
Region.
In addition to the above mentioned program, there are projects from various multilateral and
bilateral donors, including JICA, World Bank, ADB, FAO, and various national and
international NGOs.
Key results/ impacts of forestry support program/ projects (MARD 2013):
International cooperation between Viet Nam forestry sector and international partners
strengthened and further developed:
o ODA and international assistance commitments for the forest sector continued
to increase in the period 2005-2010
o Viet Nam forestry deeply and widely integrated in regional and international
commitments, conventions and treaties
o Viet Nam forestry proactively approached new initiatives on development
cooperation and climate change
21 ODA providing additional funds for the forest sector to successful completion of the 5
Million Hectares Reforestation Project
ODA playing an important role in formulating and finalizing the system of sectoral
laws, polices and institutions, improving sectoral management and professional
capacity, resulting in provision of favorable conditions to enabling internal resource
enhancement and international integration
ODA contributing to capacity building for forestry officers at all levels
ODA supporting the development of forestry and mountainous rural infrastructure
2.4.3 Forest production and management
Over the last 25 years, Viet Nam has produced over 30 different forest products, of which 19
(groups of products) have been produced annually. The production of most products was
rather fluctuating, with 10 products (groups) having negative (less than 0%) average annual
growth rate over 24 years (1990-2014) or during the time of production, and 23 products/
groups having positive average annual growth rate. The three most growing products are
MDF (303% average annual growth rate), wood pellet (170%), paper + paperboard (72%),
unbleached sulphate pulp (66%), and particle board (40%). At the other extreme, the five
least growing products are sawn wood (-22% average annual growth rate), insulating board (-
13%) (FAO 2015).
The top three products in quantity of production are wood fuel (average production of 24
million tonnes per year between 1990-2014), sawn wood (average production of 3 million
tonnes per year), and saw logs + veneer logs (average production of 2.33 million tonnes per
year). Of the 14 (groups of) products that have not been produced annually, sawn wood and
wrapping papers have not been produced recently. By contrast, 12 new products have been
emerged, particularly 7 new since 2000, namely papers packaging, semi-chemical wood pulp,
dissolving wood pulp, wood pellets, wood residues, veneer sheets, and insulating board (FAO
2015).
In terms of forest management types, as discussed in Sub-section 2.4.1, there has been the
expansion of both natural and plantation forests in Viet Nam. Natural forest area has
expanded from 8.396 million ha in 1990 to 10.398 million ha in 2013 (with a decline between
1990-1995) – see Figure 18. Plantation forest has made much more impressive growth, with
the expansion from 0.745 million ha in 1990 to 3.556 million ha in 2013, almost fourfold in
23 years (FAO 2014).
22Figure 18: Growth rates of natural and plantation forests, 1990 - 2013
60%
Plantation forest
50%
Natural forest
40%
Growth rate (%)
30%
20%
10%
0%
1990-1995 1995-2000 2000-2005 2005-2010 2010-2013
-10%
Source: FAO 2014
2.4.4 Forest products import and export
Overall, the type of products in the top five import changed significantly throughout the
period (see Annex C). Almost a new set of products was observed in each quoted year, only
sawn wood (non-coniferous) stays in the top five for all the quoted years in import quality
table. Other products were present only for maximum two of the three quoted years (FAO
2015).
There is a significant growth in import products in both quantity and value in US$ over the
last 25 years. Import of sawn wood, for example, has increased from 9.8 thousand tonnes in
1990 (from non-coniferous wood) to 70.2 thousand tonnes in 2000 and 938.3 thousand tonnes
in 2014 –over 95 times in 24 years. The corresponding increase in the value of sawn wood
import is from 1.3 million US$ in 1990 to 697.4 million in 2014 (FAO 2015).
The changes in forest products and quantity and value of import reflect the changing demand
of the domestic market. As Viet Nam has become one of the top wood furniture
manufacturing and processing countries, with the export turn-over of 4.5 billion US$ in 2012
and average growth of around 25-30% per annual over the last decade. The demands for log
and sawn woods have been increasing over the last decades, around 75-80% of which are
imported (FAO 2015).
In terms of export, there is a general change in products for export (Annex D). Viet Nam has
moved from net exporter of sawn wood and round logs in 1990s to net importer of these
products in 2000 and 2014. Vice versa, Viet Nam has moved from net importer to exporter of
plywood in the same period. Export products have shifted to plywood, chips and particles,
which have increased at an impressive rate in both quantity and value since 2000 (FAO
2015).
The changes in export market have reflected the domestic production of forest products as
discussed in sub-section 2.4.3. Of the five products in top five export of 2014, veneer,
23plywood and wood pellets have a high ratio of export versus production, at 99% for veneer,
93% for wood pellets and 72% for plywood. By contrast, sawn wood export accounts only
for 6% of its domestic production, which can be explained by the development of wood
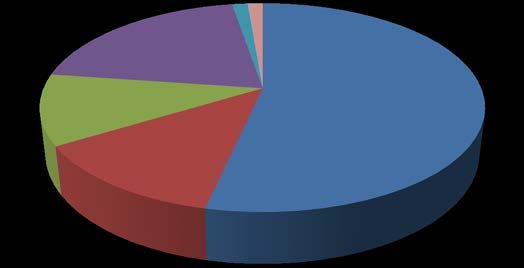
furniture manufacturing industry in Viet Nam as discussed earlier. Most interesting is with
chips and particles. Export volume in 2014 was 438% of the national production of 2014. In
fact, this trend has been observed since 2004, with the growing ratio of export over
production (FAO 2015). The import of chips and particles does not offer an explanation as
the volume of import of these products has been nominal during the same period (see Figure
19). A question is where the gap between export and production (and import) of chips and
particles for the last 10 years is from 1.
Figure 19: Production, import and export of chips and particles, 2000 - 2014
18 0.06 0.06
16 Import 3 3
0.06
Million tonnes
14 0.05
Production 3
12 3
Export 0.04
10
3
8
15 15
0.00 0.00
6 0.00 3 11
3 10
0.00 2
4 1 8
0.00
0.00 1
2 1 4 4
2 2 3 4
2 1 2 2
0 1 1 1
-
2000
2001
2002
2003
2004
2005
2006
2007
2008
2009
2010
2011
2012
2013
2014
Source: FAO 2015
2.5 Other factors
Viet Nam is considered one of the extremely climate change vulnerable countries in the
world. It ranked 13th in the 2011 Climate Change Vulnerability Index and 6th in the 2014
Global Climate Change Risk Index. The country has already experienced increases in
temperature, sea level rise, intensifying storms, and more frequent floods and droughts.
Between 1989-2010, for example, Viet Nam experience 1,469 natural disasters, including 8
cold wave, 61 cyclones, 106 flashfloods, 715 floods, 307 hailstorms, 60 landslides, 18
(heavy) rains, 185 storms, 6 surges, and 3 typhoons, affecting 8.24 million people, including
9.9 thousand death, 10 thousand injured, and 64.79 houses destroyed 2.
1
Participants of the validation workshop held in Hanoi 6 November 2015 indicated that this could be due to the
wrong export data from FAOstat. The export volume could be counted three or more times. Similarly, workshop
participants also questioned on the data from FAOstat on production, import and export of other forest products.
2
http://www.desinventar.net/DesInventar/profiletab.jsp?countrycode=vnm, accessed 2 October 2015.
24Like any other tropical countries, forests in Viet Nam play an important role in mitigating
climate change. Viet Nam was among the first countries that recognized the importance of
and supported the REDD+ (Reducing Emission from Deforestation and Forest Degradation)
mechanism as early as 2007 and soon became part of important international REDD+
Initiatives, such as Forest Carbon partnership Facility (FCPF) since July 2008 and UN-REDD
since March 2009.
Since then, significant attention has been given to forestry sector to enhance its forest
resilience, both from the Government as well as international community. REDD+ has been
one of the key important components in the National Target Program to Respond to Climate
Change and National Forest Development Strategy. National REDD+ Action Plan until 2020
was approved as of June 2012. From the international community, Viet Nam has received
over 73 million US$ in ODA for REDD+ related activities till end of 2013, including UN-
REDD Program for the period of 2009-2012 (phase 1), at 4 million US$, and 2013-2017
(phase 2) at 30 million US$, FCPF (2013-2015) at 3.8 million US$, Viet nam Forest and
Delta program (26.5 million US$), Dien Bien REDD+ Pilot project (2.25 million US$)
MARD 2013).
B. Policies and institutions
2.6 Policies and legal aspects
List of main policy documents that define forest and agricultural land use (e.g. national
development/poverty reduction, strategies, forest and agriculture policy documents/
statements, national programmes, multi-year programme of work, action plans, strategies
aimed at the development of forest plantations, regeneration, conservation; and strategies
aimed at the increase/intensification of land use for agricultural purposes, like crop production,
pastures development, etc.) is provided in Annex E.
List (and a set of /links to the texts of the relevant documents) of main legal documents (primary
and secondary levels: laws, decrees, acts etc) that regulate forest and agricultural land use and
land use change, including tenure aspects is provided in Annex F.
While the role of forest and agricultural development was not clearly stated in Socio-economic
development plans so far, agriculture (including forestry) has been identified as one of the key
areas for poverty reduction, as stated in the 'Comprehensive Strategy for Growth and Poverty
Reduction to 2005 and toward 2010" (Annex G). The Forestry Development Strategies (2001-
2010, and 2006-2020) of Viet Nam set clear targets for increasing forest area, as indicated in
Annex H. Similarly, agricultural policies also have clear targets of increasing areas for crop
production/pastures/hay-making, other agricultural uses (Annex I).
Land policy generally reflect agricultural and forestry priorities. Land Law 1993, for example,
stated that allocation of land must be based on approved land use planning (Article 19). In Land
Law 2013, it is stated that land uses must follow land use planning, master plan and approved
uses (Article 6).
In the current Forest Protection and Development Law (FPDL), which has been effect since
2004, there is no reference made to the objectives (specific targets) of the National Forestry
25Development Strategy (2001-2010). Yet, the 2004 FPDL provides provision for development
and conservation of country's forest resources, which support the general achievement of the
strategy's objectives in terms of forest coverage and quality growth.
The 2004 FPDL has altogether 15 articles, from Article 13 to Article 28 in two sections of
chapter two – on forest use/ development and planning – see Annex J. To monitor the
enforcement of these provisions (and of the FPDL in general), there is a forest ranger, known
as Forest Protection Department, with head office in Ha Noi and line agencies down to the
district level (and staff stationed at the commune level).
The main challenges in the enforcement of these provisions include (Sikor and Nguyen 2011):
(Some) regulations are hard to implement in the field: It is widely recognized that the
existing regulations on management planning and benefit-sharing have been virtually
impossible to implement in practice. For example, experience from community logging
pilots demonstrates the difficulties encountered by local communities when they want to
harvest and sell timber from forests allocated to them. More importantly, reliance on
uniform quotas ignores spatial and temporal variations in the significance of forests to
local communities and wider society. Forests are an important source of timber only in
some regions and at certain times. In others, they assume much more important functions
as sources of food.
Lack of power and opportunities to exercise tenure rights: Local people can receive
tenure rights to forests individually, in groups, and in village collectives. Yet they have
not been granted any governance powers to make their own rules and organizational
arrangements in forest management. The existing laws and regulations on tenure rights,
village forest protection and development regulations, forest management plans, etc.
provide very few opportunities for local communities to develop governance
arrangements which match local conditions, rules, and practices. Local forest governance
consequently is often ineffective or rife with conflicts between local communities and
authorities, between one village and another, or within villages.
Preference of forest contracting over the allocation of forest to local people: Although
around 28% of the total forest area has been allocated to local communities, including
households, household groups and village collectives (Figure 15), there is significant
scope for the expansion of forestland allocation. An obvious place to start is the forest
temporarily under the custody of Communal People’s Committees, which accounted for
around 18% of the forest area at the end of 2013. It remains unclear, however, how these
forest areas will be allocated to local communities. More importantly, forest contracting is
often preferred to the allocation of forest rights to local people as the rights to forests are
thereby still retained by the state actors and local people are just paid to protect the forest.
As local communities have no tenure rights to such forests under forest contracting, they
feel that they only perform their patrolling jobs “for the state”.
Weak participation: although achievements have been made in the involvement of non-
state actors (particularly local communities) in forest management, community members
are often insufficiently consulted, their participation remains nominal and their interests
26and needs are not addressed as the decision making is often done by the state actors
involved in the allocation of forest. Furthermore, the participation of civil society
organizations (CSOs) in (supporting local communities in) forest management is very poor.
No forests are under CSO management and the participation of CSOs in planning, decision
making, and implementation is limited.
Capacity to support local forest management and facilitate participation: This is also related
to the poor participation of local communities mentioned above. Concerned officials have
weak capacity to facilitate effective local participation. Although they are mandated to
implement grassroots democracy in forest management, the lack of facilitation skills makes
it impossible for them to plan and execute participatory processes. Officials at local levels
(district and commune) in upland areas also lack the capacity to support local people in
forest management. In addition, there is a general lack of capacity to deliver awareness-
raising and capacity development that meet the conditions of ethnic people living in the
forest upland areas, who may not be able to read and write in Vietnamese.
Similar to the FPDL, the Land Law does not make any reference to the specific priorities of
forest or agricultural policies. Nevertheless, Land Law generally supports general sectoral
development. Article 38, for example, states that "The national master plan on land use must
be formulated based on […] strategies and master plans for development of sectors, fields".
Similarly, Article 39 states that "A provincial-level master plan on land use must be formulated
based on […] the strategies and master plans on development of sectors and fields".
A note is made however with regard to allocation of natural forest land to local communities/
people. While community forest management (CFM) is one of the priorities of the Forestry
Development Strategy 2006-2020, no provision is made in the whole 2013 Land Law with
regard to allocation of natural forest to local people/ communities. This lack of provision will
certainly hinder the achievement of this priority as allocation of forest tenure rights is believed
to be the pre-condition for successful implementation of CFM.
The 2013 Land Law has 25 articles in two chapters dealing with land use, planning and
allocation – see Annex K. The Law also stipulates that the Ministry of Natural Resources and
Environment (MONRE) is in charge of state administration of land, including monitoring of
the enforcement of the Land Law (and related regulations). MONRE has line agencies down
to the district level, and (a) cadastral officer(s) stationed in each commune/ ward. In addition,
other ministries/ sectors are also in charge of supporting administration land within their scope
of responsibilities. The Land Law also regulates the conversion of other land into agricultural
and forest land and vice versa - Annex L.
Main challenges in the enforcement of provisions on land use include (based on Foerster et al.
2004, Nguyen et al. 2006, Nguyen et al. 2013):
Conflicts of land uses: as Viet Nam economy continues to grow along with increased land
use productivity, there is an increasing interest in land for different uses. In various cases,
farmers face a challenge to claim their land for agricultural purposes at the pressure of
conversion of land into national park, industrial zones, recreation areas. Coersion in land
recovery has resulted in a number of land use conflicts in reality.
27You can also read