Strategic Plan - Gauteng Provincial Government
←
→
Page content transcription
If your browser does not render page correctly, please read the page content below
Strategic Plan
 2015-2020

Strategic Plan 2015-2020

Gauteng Department
   of Education

   Strategic Plan
    2015 - 2020

                       Strategic Plan 2015 - 2020 | i
Strategic Plan 2015-2020

                                         Vision
                 Every learner feels valued and inspired
                    in our innovative education system

                                        Mission
            We are committed to provide functional and
        modern schools that enable quality teaching and
            learning to protect and promote the right of
                      every learner to quality, equitable
                                  and relevant education.

ii | Strategic Plan 2015 - 2020
Strategic Plan 2015-2020

                                             FOREWORD BY THE MEC

                                            It is indeed a great pleasure for me to be part of the 20th year
                                            of democratic education in South Africa. We are honoured
                                            to have made great strides in education and take immense
                                            pleasure in sharing the visible gains made in Education in
                                            Gauteng, especially, in closing the gap in quality education
                                            between the fee paying schools and the No Fee Schools as
                                            well as achieving universal access to schooling. However we
                                            are the Ärst to admit that substantial efforts are needed to
                                            improve speciÄc aspects in the Province’s education system
                                            for example issues relating to the quality of education in some
                                            schools, classroom space, information communication and
           Andrek P. LesuÄ                  technology (ICT) in schools and infrastructure development
            MEC for Education
                                            and maintenance.

Over the past 20 years in our democracy, we have come to realize that Education is not only about numbers
nor about Änancial resources, the millennium goal “Education for All” involves much more, including policy
intent, planning, implementation and monitoring. Education for all in Gauteng includes equality, equity and
mainly quality education for all learners in the province. This administration is guided by the principles of
Integrity, honest and trust and we have taken a stance as a province that education in Gauteng is about
collaboration, a dialogue with stakeholders and education partners where we combine all our skills and
experiences, hence, working together to achieve our common goal of “Quality Education” for all.

This 2015-2020 Strategic Plan will serve as our guiding document to realize the vision which encapsulated
Action Plan 2019, the National Development Plan (NDP), Gauteng Transformation, Modernisation and
Reindustrialisation (TMR) project. The modernization of the public service especially the modernization of
the public education system is central to the success of the TMR project and the manifesto of the Ruling
Party. The key objective of this document is to establish a common pathway for all stakeholders involved
in education to achieving our common goal. This Plan will encompass useful beacons that will guide the
Department to attaining its vision, mission and strategic pillars as set herein.

This Äve year plan is set around the ten key pillars that will guide the department in achieving the desired
improvement in education. In the next Äve years will be dedicated to lessening the constraints in the
province and strengthen the achievements and making Gauteng the lead province in the country, where
Education is paramount to success and towards a quality education in our lifetime.

-------------------------------------
Andrek P. LesuÄ
MEC for Education

                                                                            Strategic Plan 2015 - 2020 | iii
Strategic Plan 2015-2020

OFFICIAL SIGN-OFF

It is hereby certiÄed that this Strategic Plan was developed by the management of the Gauteng Department of
Education under the guidance of the Member of the Executive Committee (MEC) for education Mr Panyaza
LesuÄ. The strategic plan takes into account all the relevant policies, legislation and other mandates for
which the Gauteng Department of Education is responsible.

It accurately reÅects the strategic outcome oriented goals and objectives which the Gauteng Department
of Education will endeavour to achieve over the period 2014/15 to 2018/19.

Rannoi Sedumo
Chief Financial OfÄcer                                Signature: ___________________________

Albert Chanee
Deputy Director General:
Strategic Planning Management                         Signature: ___________________________

Boy Ngobeni
Head of Education                                     Signature: ___________________________

Approved by:

Andrek P. LesuÄ
Executive Authority                                   Signature: ___________________________

iv | Strategic Plan 2015 - 2020
Strategic Plan 2015-2020

 CONTENTS

FOREWORD BY THE MEC ................................................................................................................. iii
OFFICIAL SIGN-OFF ........................................................................................................................... iv
PART A: STRATEGIC OVERVIEW
1.      Vision ...........................................................................................................................................1
2.      Mission ........................................................................................................................................1
3.      Values ..........................................................................................................................................1
4.      Legislative and other mandates.................................................................................................2
5.      Situational Analysis ....................................................................................................................6
5.1     Performance Environment.............................................................................................................6
5.2     Organisational Environment ........................................................................................................24
5.3     Description of the Strategic Planning process .............................................................................27

6.      Strategic outcome oriented goals ...........................................................................................28
6.1     Strategic Goals, Pillars and Objectives ........................................................................................35

PART B: STRATEGIC OBJECTIVES
7.  Programme 1: Administration ..................................................................................................39
7.1 Programme Purpose...................................................................................................................39
7.2 Sub Programme Structure ..........................................................................................................39
7.3 Strategic Objectives ....................................................................................................................40
7.4 Resource Considerations ............................................................................................................44
7.5 Risk Management .......................................................................................................................45
8       Programme 2: Public Ordinary School Education ..................................................................51
8.1     Programme Purpose...................................................................................................................51
8.2     Sub Programme Structure ..........................................................................................................51
8.3     Strategic Objectives ....................................................................................................................53
8.4     Resource Considerations ............................................................................................................56
8.5     Risk Management .......................................................................................................................57

9.      Programme 3: Independent Schools Subsidy.........................................................................59
9.1     Programme Purpose...................................................................................................................59
9.2     Sub Programme Structure ..........................................................................................................59
9.3     Strategic Objectives ....................................................................................................................59
9.4     Resource Considerations ............................................................................................................60
9.5     Risk Management .......................................................................................................................61
10.     Programme 4: Public Special School Education ....................................................................62
10.1    Programme Purpose...................................................................................................................62
10.2    Sub Programme Structure ..........................................................................................................62
10.3    Strategic Objectives ....................................................................................................................63
10.4    Resource Considerations ............................................................................................................63
10.5    Risk Management .......................................................................................................................64
                                                                                                             Strategic Plan 2015 - 2020 | v
Strategic Plan 2015-2020

11.     Programme 5: Early Childhood Development .........................................................................65
11.1    Programme Purpose...................................................................................................................65
11.2    Sub Programme Structure ..........................................................................................................65
11.3    Strategic Objectives ....................................................................................................................66
11.4    Resource Considerations ............................................................................................................66
11.5    Risk Management .......................................................................................................................68

12.     Programme 6: Infrastructure Development .............................................................................69
12.1    Programme Purpose...................................................................................................................69
12.2    Sub Programme Structure ..........................................................................................................69
12.3    Strategic Objectives ....................................................................................................................70
12.4    Resource Considerations ............................................................................................................70
12.5    Risk Management .......................................................................................................................72

13.     Programme 7: Exam and Education Related Services ...........................................................74
13.1    Programme Purpose...................................................................................................................74
13.2    Sub Programme Structure ..........................................................................................................74
13.3    Strategic Objectives ....................................................................................................................75
13.4    Resource Considerations ............................................................................................................75
13.5    Risk Management .......................................................................................................................76

PART C: LINKS TO OTHER PLANS

14.     Links to the long-term infrastructure and other capital plans ................................................81

15.     Conditional Grants....................................................................................................................83

16.     Public entities ...........................................................................................................................85

17.     Public-private partnerships ......................................................................................................85

ACRONYMS .......................................................................................................................................86

vi | Strategic Plan 2015 - 2020

Strategic Plan 2015-2020

                                                                           “We are Africans.
                                                                  We are an African country.
                                                  We are part of our multinational country.
                                                 We are an essential part of our continent.
We feel loved, respected and cared for at home, in community and in public institutions.
                                                   We learn together……We love reading.
                                                                      Each community has:
                                                                                   A school,
                                                Teachers who love teaching and learning,
                                             A local library Älled with the wealth of books,
                                                                                  A librarian
                      All our citizens read, write, converse, and value idea and thought.
   We are fascinated by scientiÄc invention and its use in the enhancement of our lives.
                                            We live the joy of speaking many languages.”

                                            -   National Development Plan (Chapter 9).

                                                   PART A:
                                                   PART A:
                                     STRATEGIC  OVERVIEW
                                      GENERAL INFORMATION
                                                        Strategic Plan 2015 - 2020 | vii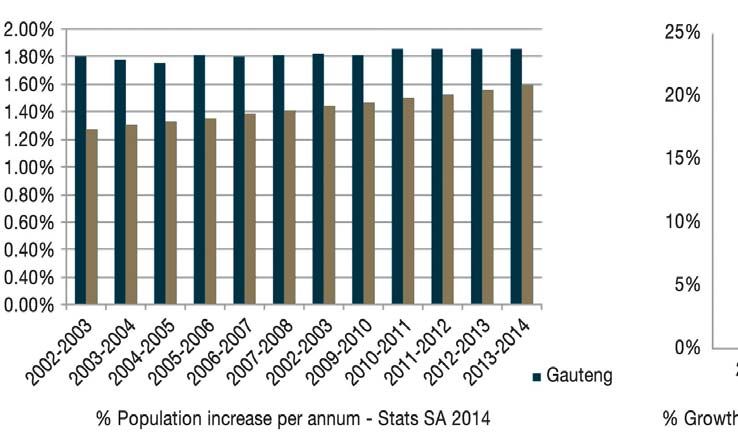
Strategic Plan 2015-2020

viii | Strategic Plan 2015 - 2020

Strategic
                        PART       Plan 2015-2020
                             A: STRATEGIC OVERVIEW

1.     Vision

Every learner feels valued and inspired in our innovative education system

2.     Mission

We are committed to provide functional and modern schools that enable quality teaching and learning to
protect and promote the right of every learner to quality, equitable and relevant education

3.     Values

We have the following values that are focused on Learner IMPACT:

• Learner focused
• Integrity (honesty and truth)
• Motivated
• Passionate
• Accountable
• Committed
• Truth

                                                                             Strategic Plan 2015 - 2020 | 1
Strategic Plan 2015-2020 4. Legislative and other mandates National Legislation • Constitution of the Republic of South Africa, 1996 (Act No. 108 of 1996), as amended. • National Education Policy Act, 1996 (Act No. 27 of 1996) (NEPA), as amended. • South African Schools Act, 1996 (Act No. 84 of 1996), as amended. • Employment of Educators Act, 1996 (Act No.76 of 1998) • Public Service Act , 1994 (Proclamation 103, Published in Government Gazette 15791 of 3 June 1994) • Further Education and Training Colleges Act, 2006 (Act No.16 of 2006), as amended. • Adult Education and Training Act, 2000 (Act No. 52 of 2000), as amended • South African Council for Educators Act, 2001 (Act No. 31 of 2001), as amended. Provincial Legislation • Gauteng Schools Education Act, 1995 (Act No. 6 of 1995), as amended • Gauteng Education Policy Act, 1998 (Act No. 12 of 1998), as amended. Good Governance Legislation • Public Finance Management Act, 1999 (Act No. 1 of 1999), as amended. • Skills Development Act, 1998 (Act No. 97 of 1998), as amended. • Promotion of Administrative Justice Act, 2000 (Act No. 3 of 2000). • Promotion of Access to Information Act, 2000 (Act No. 2 of 2000). Policy Mandates The Department will base its sector plan on: • The National Development Plan’s vision 2030 • The Basic Education Sector Plan, • The Action Plan 2014: Towards the realisation of Schooling 2025 Planned policy initiatives • Development of Regulations to govern the registration and the deregistration of the Grade R sites; • Development of Änancial management prescripts for sound management of school resources; • Amendment to the School Governing Body Regulations to improve school governance; • Amendment to the Admission Regulations to improve the management and administration of the admission process for learners. 2 | Strategic Plan 2015 - 2020
Strategic
                   PART       Plan 2015-2020
                        A: STRATEGIC OVERVIEW

Relevant Court Rulings

Names of parties   School Governing Body (SGB) Hoërskool Ermelo vs The Head of
involved           Departmental (HOD) of Education in Mpumalanga; 2012
                   The SGB took the Department to court after their functions were withdrawn for
Brief facts        refusing to admit English learners to their predominantly Afrikaans school and
                   would not revise their language policy.
                   The Constitutional Court held that the Schools Act does give the HOD the power
Judgement          to withdraw, on reasonable grounds, the function of the governing body to
                   determine the school’s language policy.
                   Where the Schools Act empowers a governing body to determine policy in relation
                   to a particular aspect of functioning, the HOD or other government functionary
                   cannot simply override the policy adopted or act contrary to it. However, this
Principle
                   does not mean that the governing body’s powers are unfettered, that the relevant
                   policy is immune to intervention, or that the policy inÅexibly binds other decision-
                   makers in all circumstances.

                   The Head of Department, Department of Education Free State v School
Names of parties
                   Governing Body Welkom High; 2013 (NB: This to be read with Harmony
involved
                   Girls High School)

                   The SGB removed pregnant learners from the school using its policy. The
Brief facts        Department intervened and declared this policy unlawful because it was not
                   certiÄed by the Department.

                   The HOD does not have the legal authority to take any action in contravention
                   of or contrary to the pregnancy policy of the school governing body or on the
Judgement
                   decision taken by the principal in accordance with the pregnancy policy duly
                   opted by the SGB.
                   The law requires an ofÄcial to exercise discretion in accordance with an existing
                   policy to be independently satisÄed that the policy is appropriate in particular
Principle          cases. An ofÄcial who elevates policy guidelines into hard and fast rules and
                   rigidly implements such policy guidelines as binding rules, declines to exercise
                   the discretion entrusted to him or her.
Names of parties   Member of the Executive Council for Education in Gauteng Province and
involved           others v SGB Rivonia; 2013
                   A learner was refused admission to the school and the Department intervened by
Brief facts        withdrawing the function from the Principal. The argument was that the SGB held
                   authority to admit learners in terms of their admission policy.

                                                                       Strategic Plan 2015 - 2020 | 3
Strategic Plan 2015-2020
The High Court ruled in favour of the Department and the SGB appealed to the
Supreme Court of Appeal. The SCA dismissed the ruling of the High Court and
held that the right to admit is a right of the SGB as per its admission policy. The
Judgement MEC appealed at the Constitutional Court, which held that in as far as the Änal
authority to admit the learners is concerned, the SGB has a right to make a policy
subject to the Schools Act and that the HOD has the authority to admit learners
at the school.
The Functionary may intervene in a SGB policy but only where the functionary
is entitled to do so in terms of the powers afforded to it by the Schools Act or
Principle other relevant legislation. The relevant functionary and the SGB are duty bound
to engage with each other in good faith on any dispute (including disputes over
policy adopted by the SGB).
Names of parties The SGB of the Juma Musjid Primary School & Others v Ahmed Asruff
involved Essay N.O. and Others; 2010
The Trust took the SGB to court after negotiations for the school to cease
Brief facts operation were not fruitful. An application for eviction was then made which was
challenged.
This was an appeal after the High Court ruled in favour of the Trust, thus evicting
the school. In amending the ruling of the High Court, the Supreme Court of
Judgement
Appeal held that the right to basic education is an inherent right. The MEC was
ordered to place the learners in neighbouring schools within a reasonable time.
The right to a basic education in section 29(1)(a) may be limited only in terms of
Principle a law of general application which is “reasonable and justiÄable in an open and
democratic society based on human dignity, equality and freedom”.
Names of parties Member of the Executive Council for Education in Gauteng Province v Dr
involved Mgijima; 2010
This was an application to review and set aside an arbitration award. Mgijima’s
Brief facts services were terminated after she failed to disclose her suspension at her former
employer when she was interviewed.
The arbitration award issued by the third respondent dated 24 May 2009 is
Judgement
reviewed and set aside.
The crucial issue before the arbitrator was Mgijima’s non-disclosure at the time of
her interview (and indeed during the subsequent period leading to the signing of
her contract) that she was on suspension and facing serious disciplinary charges.
Principle
What effect Mgijima’s conduct during the period of her employment by the DAC
may have had on her suitability for appointment to the GDE was a matter for the
GDE to determine.
4 | Strategic Plan 2015 - 2020Strategic
PART Plan 2015-2020
A: STRATEGIC OVERVIEW
Names of parties Member of the Executive Council for Education in Gauteng Province v
involved Msweli; 2012
The employee was dismissed in terms of section 17(5)(a)(i) and (b) of the Public
Service Act. The employee failed to come to work without authority for a period
Brief facts
exceeding one month. The application was made to the court to review the
award given by the commissioner reinstating the employee.
The arbitration award of the third respondent dated 20 July 2008 under case
number PGGA 1265-07/08 is reviewed and set aside. The award of the third
Judgement
respondent is substituted with an award that the dismissal of the Ärst respondent
by the applicant was procedurally fair.
In some instances, an unexplained absence for a reasonable period in relation
to the employer’s operational requirements, will establish the fact of desertion. In
the instance of an employee who remains away from the workplace and whose
Principle whereabouts are unknown and who is out of reach of the employer, it is plainly
impractical to impose upon an employer the obligation to convene a disciplinary
enquiry before reaching the conclusion that the fact of desertion has occurred
and the employer can terminate the employee’s contract.
Names of parties C P Rabie obo Christiaan v member of the Executive Council for
involved Education, Gauteng; 2013
The learner was injured on 31 July 2003 as a result of falling down a net which
other learners held as a swing. The incident occurred while playing at the cricket
Brief facts
Äelds. The learner was unconscious and was taken to hospital and never returned
to school for the rest of the school year.
The High Court found the Department to be liable in that its employees owed a
duty of care towards the learner and they failed to prevent him from being injured.
Judgement
The MEC appealed to the full bench of the High Court. The court then conÄrmed
the decision of the High Court. Damages awarded were in favour of the learner.
Questions of negligence and contributory negligence are judged objectively. The
Principle touchstone is the standard of care of the reasonable man in the circumstances,
not the standard of care to be expected of a reasonable child.
Strategic Plan 2015 - 2020 | 5Strategic Plan 2015-2020 5. Situational Analysis 5.1 Performance Environment Socio-Demographics in the Province The population of South Africa has increased to 54 million in 2014, with Gauteng as the most highly populated province in the country with 12.9 million people. The growth in the population is largely due to migration to the province and an improved life expectancy mainly due to the introduction of Antiretrovirals (ARV’s). Life expectancy has increased from 51.1 %in 2003 to 59.6 % in 2013. Figure 1: Population increase per annum Economy of the Province The Departments of Education, Health and Social Development receive on average 78% of the overall provincial budget as a result of government’s commitment to deliver quality education and health services. The budget for these departments grew from R62.4 billion in 2013/14 to R67.9 billion in the 2014/15 Änancial year. The equitable share amongst provinces is annually revised with new data to ensure that the formula is objective and redistributive. The total provincial equitable share weighted average for Gauteng was revised to 18% for the 2014/15 Änancial year. Education received 49% of the total equitable share based on the size of the school-age population (ages 5-7) and the number of learners (Grade R to 12) enrolled in public ordinary schools. In the education component, Gauteng’s weights are the third highest (15.7%) of all the provinces. The continued poor performance of the economy and various Äscal constraints may lead to reduced funding for education due to reduced tax collections as education cannot be funded through Government borrowings. 6 | Strategic Plan 2015 - 2020
Strategic
                                         PART       Plan 2015-2020
                                              A: STRATEGIC OVERVIEW

The Department plans to appoint approximately 1 834 ofÄcials over the Äve year term, consisting mainly
of educators to meet the learner educator ratio targets in public schools. The Department is the highest
contributor of the wage bill in the province with an average of R24.7 billion spent in the 2014/15 Änancial
year.

National government assigns conditional grants to provinces to pursue speciÄc national objectives and
targets aimed at enhancing the delivery of services. Conditional grants are also used to ensure that
the minimum nationwide standards for the provision of services of national concern are met across all
provinces. Conditional grants for the Department include the National School Nutrition Programme Grant,
which seeks to improve the nutrition of poor school children, enhance active learning capacity and improve
attendance in schools. The Dinaledi Schools Grant aims at enhancing the quality of Maths and Science in
Dinaledi schools by providing additional resources. The other grants are the Education Infrastructure Grant,
the Technical Secondary School Recapitalisation Grant, and the HIV and AIDS (life skills education) Grant;
all of which are administered by the National Department of Basic Education.

The Department of Education is projected to receive allocations of R2.2 billion in 2014/15, R2.4 billion in
2015/16 and R1.6 billion in 2016/17. In addition, the Department of Education has introduced a new grant
for the payment of OSD to therapists which will be allocated in 2014/15 and 2015/16, and will be phased
into equitable shares from 2016/17 onwards.

The method for allocating the infrastructure grant to Education was revised by National Treasury, as a result
of a two year bidding system. The outcome of the system resulted in the Education Infrastructure Grant
being reduced from R2.4 billion in 2015/16 to R1.6 billion in 2016/17.

Education demand and supply
Gauteng is on an upward movement in the attainment of the educational levels of its population. Learner
performance is improving and there is a decrease in the illiteracy rate in the Province. The 2011 census
highlighted and conÄrmed successes in the improvement of the education level of citizens of Gauteng,
the effects of some of the initiatives will be felt beyond 2019. The following diagrams reÅect the upward
movement:

Figure 2: Percentage of population with                                         Figure 3: Percentage of population with matric
no education
                                     No Education                                                                   More than matric
                    12                                                                              25

                    10
                                                                                                    20
Percentage Growth

                                                                                Percentage Growth

                     8                                                                                                                              20
                                                                                                    15
                          9.7
                     6                                                                                                                 18.1
                                   8.7                                                              10
                     4
                                                                                                                   12.3
                                                      3.7                                            5
                     2                                                                                    9.9
                                                                   2.8

                     0                                                                               0
                         Census   Census            Census   GCRO quality of                             Census   Census           Census     GCRO quality of
                          1995     2001              2011    Life Survey 2011                             1995     2001             2011      Life Survey 2011

                                                                                                                  Strategic Plan 2015 - 2020 | 7
Strategic Plan 2015-2020
The Province provides the following key educational facilities:
• 2 070 public ordinary schools in 2014/2015. This is an increase of 2.8% (57 schools) since 2010/2011;
• 202 Independent subsidised schools;
• 449 Independent non-subsidised schools;
• 137 Special Educational Needs (LSEN) Institutions of which 110 are public, four independent subsidised
and 23 independent non-subsidised schools.
What is evident is that with the commencement of Grade R and the migration of people to Gauteng there
has been a large increase of learners. These learners have started in the Foundation Phase and are now
moving through to the Intermediate Phase. This trend will continue through to the Senior and Further
Education and Training phases in due course.
The learner increase experienced in the Grade 1-12 is the highest in the country, with the second and third
highest increases in other provinces being only 5% in Northern Cape and Western Cape respectively.
The proÄle and trend of learners over the last Äve years in public ordinary schools are shown in the following
tables:
Growth from Average per
Grades 2010 2011 2012 2013 2014
2010 to 2014 annum
Pre-Primary 5,059 4,957 5,411 4,931, 4,780 -5.5% -1.4%
Grade R 66,403 75,150 83,325 91,669 97,240 46.4% 11.6%
Grade 1 166,060 176,573 185,550 190,51 195,660 17.8% 4.5%
Grade 2 152,205 156,751 167,614 177,064 182,250 19.7% 4.9%
Grade 3 147,476 149,265 154,026 162,872 171,329 16.2% 4.0%
Grade 4 144,766 145,119 147,187 151,481 164,011 13.3% 3.3%
Grade 5 142,045 142,786 143,527 144,600 148,193 4.3% 1.1%
Grade 6 143,324 140,714 141,516 141,683 141,456 -1.3% -0.3%
Grade 7 146,316 141,619 138,576 139,566 136,437 -6.8% -1.7%
Grade 8 149,891 148,352 143,979 142,741 142,693 -4.8% -1.2%
Grade 9 149,802 156,277 159,729 155,480 153,074 2.2% 0.5%
Grade 10 160,617 172,430 176,446 183,359 174,471 8.6% 2.2%
Grade 11 118,366 121,313 125,051 119,594 134,790 13.9% 3.5%
Grade 12 85,444 78,765 82,914 89,364 91,856 7.5% 1.9%
8 | Strategic Plan 2015 - 2020Strategic
PART Plan 2015-2020
A: STRATEGIC OVERVIEW
Growth from Average per
Phase 2010 2011 2012 2013 2014
2010 to 2014 annum
Foundation (Incl. Grade R) 532,144 557,739 590,515 622,120 646,479 21.5% 5.4%
Foundation (Excl. Grade R) 465,741 482,589 507,190 530,451 549,239 17.9% 4.5%
Intermediate 430,135 428,619 432,230 437,764 453,660 5.5% 1.4%
Senior 446,009 446,248 442,284 437,787 432,204 -3.1% -0.8%
FET 364,427 372,508 384,411 392,317 401,117 10.1% 2.5%
The following table indicates the estimated growth of learners in public ordinary schools over the next 10
years:
Movement
Grade between 2014 2015 2016 2017 2018 2019 2020 2021 2022 2023 2024
years
Grade R 97,240 105,019 113,421 122,494 132,294 142,877 154,308 166,652 179,984 194,383 209,934
Grade 1 195,660 201,530 207,576 213,803 220,217 226,824 233,628 240,637 247,856 255,292 262,951
Grade 2 4.9% 182,250 186,134 191,718 197,470 203,394 209,496 215,780 222,254 228,921 235,789 242,863
Grade 3 2.5% 171,329 177,759 181,547 186,994 192,603 198,381 204,333 210,463 216,777 223,280 229,978
Grade 4 0.9% 164,011 169,706 176,075 179,828 185,222 190,779 196,502 202,397 208,469 214,723 221,165
Grade 5 1.6% 148,193 161,390 166,995 173,262 176,954 182,263 187,731 193,363 199,164 205,139 211,293
Grade 6 1.3% 141,456 146,239 159,262 164,793 170,977 174,621 179,859 185,255 190,813 196,537 202,433
Grade 7 1.9% 136,437 138,790 143,483 156,261 161,687 167,755 171,330 176,470 181,764 187,217 192,833
Grade 8 -2.1% 142,693 139,280 141,682 146,472 159,516 165,055 171,250 174,899 180,146 185,551 191,117
Grade 9 -6.8% 153,074 152,371 148,726 151,291 156,407 170,335 176,250 182,865 186,762 192,365 198,136
Grade 10 -13.7% 174,471 173,981 173,182 169,039 171,954 177,768 193,600 200,322 207,840 212,269 218,638
Grade 11 27.7% 134,790 126,090 125,735 125,158 122,164 124,271 128,473 139,914 144,773 150,206 153,407
Grade 12 29.2% 91,856 95,425 89,265 89,014 88,606 86,486 87,978 90,952 99,052 102,492 106,338
1,933,460 1,973,713 2,018,667 2,075,878 2,141,995 2,216,911 2,301,021 2,386,444 2,472,321 2,555,242 2,641,085
YoY movement 2.1% 2.3% 2.8% 3.2% 3.5% 3.8% 3.7% 3.6% 3.4% 3.4%
% Grade 1’s
attending Grade R 48.3% 50.6% 53.0% 55.6% 58.3% 61.2% 64.1% 67.2% 70.5% 73.9%
Grade 1 - 12 1,836,220 1,868,694 1,905,246 1,953,383 2,009,701 2,074,034 2,146,714 2,219,791 2,292,337 2,360,859 2,431,152
Growth Excl.
Grade R 1.8% 2.0% 2.5% 2.9% 3.2% 3.5% 3.4% 3.3% 3.0% 3.0%
There are two other variables that impact on the number of learners in the education system, namely, the
repeat rate and the dropout date. A combination of all these factors could see the school population grow
to an estimated 2.6 million learners by 2024.
Strategic Plan 2015 - 2020 | 9Strategic Plan 2015-2020
The additional learners, educators and classrooms based on forecast growth rates are estimated in the
following table:
Additional
2015 2016 2017 2018 2019 2020 2021 2022 2023 2024
Learners
Grade R 7,779 8,402 9,074 9,800 10,584 11,430 12,345 13,332 14,399 15,551
Foundation 16,184 15,418 17,425 17,948 18,486 19,041 19,612 20,201 20,807 21,431
Intermediate 23,676 24,996 15,550 15,272 14,509 16,430 16,923 17,430 17,953 18,492
Senior -1,763 3,450 20,133 23,586 25,536 15,684 15,404 14,438 16,460 16,954
FET -5,622 -7,312 -4,971 -487 5,801 21,525 21,139 20,476 13,302 13,416
Total 40,253 44,954 57,211 66,118 74,916 84,110 85,422 85,878 82,921 85,843
YoY movement 2015 2016 2017 2018 2019 2020 2021 2022 2023 2024
Grade R 8.0% 8.0% 8.0% 8.0% 8.0% 8.0% 8.0% 8.0% 8.0% 8.0%
Foundation 2.9% 2.7% 3.0% 3.0% 3.0% 3.0% 3.0% 3.0% 3.0% 3.0%
Intermediate 5.2% 5.2% 3.1% 2.9% 2.7% 3.0% 3.0% 3.0% 3.0% 3.0%
Senior -0.4% 0.8% 4.6% 5.2% 5.3% 3.1% 3.0% 2.7% 3.0% 3.0%
FET -1.4% -1.8% -1.3% -0.1% 1.5% 5.5% 5.2% 4.7% 2.9% 2.9%
Additional
Educators and
2015 2016 2017 2018 2019 2020 2021 2022 2023 2024
Classrooms at
New LER
Grade R 194 210 227 245 265 286 309 333 360 389
Foundation 437 417 471 485 500 515 530 546 562 579
Intermediate 640 676 420 413 392 444 457 471 485 500
Senior -50 99 575 674 730 448 440 413 470 484
FET -161 -209 -142 -14 166 615 604 585 380 383
1,061 1,192 1,551 1,803 2,052 2,308 2,340 2,348 2,258 2,335
10 | Strategic Plan 2015 - 2020Strategic
PART Plan 2015-2020
A: STRATEGIC OVERVIEW
Despite Gauteng representing 16% of the countries learners enrolled in public ordinary schools, it only
holds 12% of the total educators in the country as seen in the following table:
Schools Reality Report 2014 – Public Ordinary Schools
Percentage of Percentage of Percentage of
Detail Total Educators Total Schools Total Learners
National Total National Total National Total
Gauteng 60,782 12% 2,070 9% 1 944,486 16%
South Africa 507,055 100% 24,060 100% 12,117,015 100%
The above table shows that the GDE is under resourced relative to the rest of the country. The accelerated
learner growth in the province will widen this gap if not addressed.
No-Fee paying schools
The Ägure below distinguishes learner enrolment in schools by No Fee vs. Fee Paying schools.
Figure 4: Number of learners by fee status Figure 5: Fee paying vs. No fee paying schools
q
FEE VERSUS NO FEE PAYING SCHOOLS
Number of learners by fee status
1800000
(
!
(!
!
1600000
(! (!
( ! (
!
(!(! (!
(!
((
(!
!
(
!
( (!
! ( (
(!
(
! (!
! (!
! (
!(!
! (!
!
(!
! ((!
! (! (! (!( (!
! (( ((
!
(
!
!
( (
! (!
! ( (
!(!
! (! (! ( ( !
!
( (
!
(
! ( !
! (! (! ((
!
((!
! (! (
!
((
!!
(!
! ((
!
(!
!
(!
! (!
! (! ( (!
! (
(
! (
!((
!
(
!
(
! (
!
(!
((!
! (!
! (
(
!(!
! (! (
!
((
!
(!
! ( (
!
(
!(!
! ( ( (
! (
!
(
!(
!
(!
! (
(! ( (! (!((
! (
! (!
! ( (
! (
! (
!
1400000
! (!(! ( (!
! (! ( (
! (
! (
!
Number of learner
(
!
(
!! ! (!
! (
! (
!
(! ((
! (
! (
!
(
! (!
! ((! ( (
!
(
!(
!(
! TT NN (
!
( !
! (! ((!
! (!
! (
(!
! (! (!
! (
(
!(!
!
(!
!
(!
(
(
((!
!
(
!
((
!
(
!
(!
!(
( W
!
TT W!(!( !( (
! (
! !!
((
( !
! (
! (
! (
!
(
!
( (
! (!
! (
!
(
! (
! G N
G!(N (
1200000
(! (! (! ( (
!
( !
! (!
! (! ((! ((!
! ((
! (
! (!
!
!
((
(!
! (!
(! (!( ((! (!
(
!
(
!
(
!(
!
(!
! (!
(( !
! (! (!
!(!(! (!((!
(! (
!
(!
(
!
((
!(
!(
!
(
!
(
!(
!
(
! (
!
(
!(
!(
!
!
((!
!( (
!
(
!
(
! (
(
!(
!(
!(!
! (! (!
! (!( (!
! (
!! (
!(
!
(
!(
!(
!(
!(
!(
!(
!
(
!(
!
(
!
(!
! (! (
(
! (
! !
(
(!
!( (!
!
(
! (!((
!(!
(
! (!
! ( ! (!
!
( (!
(!(!
(
!
(
(
! (!
! ( (
!
(!
! ( ( (!
! (!
(
!
! (! (
(!
(! ((
! (
! (
!
(!
! (
! ((!
! ( ! (
! (
!
(
! ( ! (! (! (!
! (!( ((
!
(
! (!
! (!(!( ! (!
(! (
(
!
(
!
(
!
(
!
(!
!
(!
! (
(
!
((
!(
! (
!(
!(
! (
!(!
! (
! (
!
( !
! (!
!(!
!
(
(! (
! !
(
(
!
(
!
(
! (
!
(
! (! (
!
(
! (!
(
!
( (
! (!
(
!
(!( ! ( (
! (
! (!
! (
!
(
1000000
( !
! (
(
! ( ! (!
(
! (!
! ( (
!
(
!
(
!
TT!(!(!(S !
S(!( !(!(!(!(
(! (
!
(
! (
! (!
!(
(
! (
!
!
( (!
! (! (
(
!
(!
!
(
!
(
(
!(!
! ( (
!
(
! (!
! (
! (
!
(
! (
! ((
!
(
!
(
! (
! (
! (
! (
!
800000
(
! (!
! (
(!
! (
! (
! (!
! ( (
!(
!
( (
! (
! (
!(
!
(!
! (
! (
!
(!
! (
! (
!
(
!(
!
(
!(
!(
!
(
! (
! (
!
(
! (
!
(
! (
! (!( ((
!(
!(
!(
!(
!
(
!
( (
! (
! (
! (!
(!((
!
(!( (
!
!
(
!
(
!
(!
!
(
!
( ( !
! ( ((
!
(!
! (
(
!! (!
! (
!(
!
(
!
(
!(!
! ( (
!
(
! (
! (!
! (
!
( ! (!
(!
(
! (
!
(
! (
!
(J
!
(
! JN N(
!
(!
! ( ! ( ! ( (!
! (!
! (!(!((
( J J!(!(E ( E (
!
E N
E ( N
(
!
(
! (
! (!
! (! (!
!(! !
(!
! (!
! (!
! ((
!(
! !
( (!
!( (!
((!
!
(
! (!( !
! (
!(
! ( !
! (! ( ! ( !
(!
(
! ( (!
!( (( !
! (!(
(
! (
! ( !
! (
!
(
( (
! (
! (
! (
! (
! (
! (
!
( !
! (!(!( ( (
! (! ( ! (! (! (!( (!
! (!
(! (! ( !
!
(( !( (!
!(!
(!
((
!(
!
(!
(
600000
(
! (
! ! (! (! (! ((! (! ( (! (!(
!
( ! ( ( !
(( !
! (!
! ((! (! (
! ((( !
! ((!
! ( ! (
! ( !
! ( ! ((!
!
(
! (!
!(
(!
! ( !
! (((!
!(!( ! (!(! (( !
! (!
!
(!
!( ( !
(! (
(
!
(!
! (!
! (! ( (
!(! (!
! (! (!
! (!
( (!
((!
!
(
!
(
!
(
!
(
!(!
!
(
!(
!
(
(
!(
!
(!
!(( ! (!
((
!(
!(!
!
(!
!((( ! (! (!
! ( (!
!
((!(!
(!(
(!
! (!((!
! ( ! ((
! ! ( (!
! ( (
! ! (
!
(
(
!
(!
!
(
!( ! (!
(!
! J!(J!(!(W!
W!(!(!(!(!(!(!(!(!(!(!(!(!(!(!(!(!(!(!(!(!(!(!(!( !(!(!(!(!(!(!(!(!(!(!(!(!(!(!(!(!(!(!(!(!(!(!(!(!(!(!(!(!(!(!(!(!(!(!(!( !(!( !( !(!(!(!(!(!( !( !( !(
( !
! (!
(!(! (!(
(
!
(
!
(!
! ((!
! (!(!
!
( ( !
(!
! ( (!
!( (
(
! (
!
(!
! (
!
(
(
!(
!
(
!(
!
(
!(!
!
(
!
(
!(
!(
! (!
! (! (! ((!
!
((
! (!
! ( ! (! (!(! (! ( ! (! (! (!
! ( !
( (! ( (!
!( (!
! (
(
! ( !
! (
!
(
!(!
!( (
! (!
!(
(!
! (! ((!
! ((
!
(
!(!
(
!
!(
(
!(
!
(
!(
!
(
!(
!
(
!(
(
!(
!
(
!
(
!(
!(
! (
! (!
! ( ( ! ((
!(!
! (
!! (!
!
(
!( (!
! (! (
(
!(
(
!
(
! (
!(
!(
! (
!(
! (
!
(!
! ((
!
(
!(!
((
!(
!
(
!(
!(
!(
!
(
!
(
!
(
! (
!
(
!
(
!(!
!((
!(
! (
! (!
! (!
! (
! ( (!
! ( !
! !( !
(!
( (!
!
(!
(
(!
!(!
( (
!(
! (
! (
! (
!(
! (
! (
!!(
!(
!
(!(!
!
(( (
! (
!(
!
(
!(
!
(
! (
! (
! (!(! ((!
! ((
! (!
! (! ( (
! ( (! (!( (! ((!
((
!(
!
GGW W (!
(!
(
(
!(
!
(
!(
!
(
!(
! (
! (
!
(
!
(
! (
! (
!
(
!
(
!(
!(
!(
!
(
!
!
(
!
(
! (
! (
!
(
!
(
!(!
!( (
!
(
!(
!
(
! (
! ( !
! (! (!(!(
(
!(!
(
!( (!
! (
! (
! (
! (!
! (
! (
! (! (! (!
! ( ! ( ! (
! (!
! (!
(! (
(!
! ! (
!(
!(
!
(!
! (
!
(
! (
!(
! (
! (
!(!
(!(!
!((
! (! (!
! (!
(! ( (! ( ( (!
400000
( (
! (!
! !
(
!
(
!
(
! ((!
! (! ( (
!(
(
!(
!(
!
(
! (
!
(
!
(
!
(
!(
!(
!
(
!
(
!
(
!
(
!
(
!(
!! (
!
(
!(
!(
!
(
! (!( ( (
! (
!
(
! (!
! ( (
!
(
!
(
!
(
!
(!
!(
J
J(!(C C(!
!(!
(
!
(
!
(
!
(!
((
!(!
!
(
!(
(!!
( (!
! ( (!
! (
! ( !
! ( ! (!
( (
!(
!
(
!(
!
(!
! (!
(
(
!
(
! (
!(
!
(
!(!
!
(
!(
!!
(
!
(
(
! ( !
!
(
!
((
!
(
!
(
!
E
(
!
(!
!
(
! E(!
! (
(!(
S
(
! S(!
! (!( ! ( (
!
(
!
(
!
(
!
(
!
(
! (
!( !
(
!
! (
(
!
(
!
(
!(
! (!
(
!
! (
(!
! ( (
!(
!(!
! (
! (
!(!
! ( (
!( !
! (
!
(
! (
!
(!
!
(
! ( ! (
!
(
!(
! (
! (
!
(
! ( !
! (
! (!
!( (
!(
!
!!
((
(
! (! (! (
(
!
( (
(
!(
!
(
! (!
!(!
(
! (
(
!
(!
!
(
! ( (
!
(
!
(!
(!
! (
(
!
(
(!
! (! (
!
(
!(!
!
(!
(!(
(
!(
!(
!
( !
! ( !
(
(!
!( !!
( (!
(
!( (!
! ( (
!(!
! ( (!
! ( (
!(
!(!(( ! ((
!
(
!(
!
(!
! (
!
(
!
(!(
!(
!
(
! ( !
! ( JJ!(!(!(S S (!
! (
!
(
!
(
! (
! (
!
(
!
(
!
(
!
(!
!
(
!
(
(!
! (!((!
! ( (!
!
(
! (!
( ! (!
! (!
((!
!((
!(
!
((
!
(
!
(
!
(
!(
!
(
! G
GE E
!
( (
! (
!
( !
! ((!
! ( (!
! (!
(! (
! ( !
! (
!( (
!
!!
(( (
!(
! ((!
!
(
!
( !
(!
!( ! (( ( !
((!
!
(
!(
!(
!(
! (!
! (!
! ( (! ( (
!
200000
( (!
!(!
(!
(!
(
(
! (
!
(
!(
!
!!
((
(
! (
!
(
! (
!(!
!
(
!
((!
! (
(
!(
! (
! (
! (
!
(
!(
!(
!
!!
(( (
!(!
! ( (
! (
!
(
! (
!(
! (
! (
!(
!
(!
! (
! (
!(
! (
! (
! (
! (
!
!
(((
! (
! (!
! (!
!
(!
(!
((!
(!
! (!
(
( ! ( (
!
(!
!( (!
!
( (
! (
!(!
!(((
!
(
!(!
!
(
! (!
!(
(!
! ( (!
! (
!
( (
!(
!(
!(
!(
! (!
! (
!
(!
! ((
!
(
! (
! (
! (
! ( (!
! (
! (
!
(
!(
!
(
!
(
! (
!(!
! (
!
( (
! (
! ( (
!
(!
! ( (
! (
!
0
(!
! (
!
(
!(
! (
!(
! (
!
(! (
!(
!
(!
(! ((!
!((
! (
! (
!
S
S !(WW (
! (
!(
! (
!
(
! (
! (
! SS EE
(
! (!
! ( (
! Legend
2008 2009 2010 2011 2012 2013
( ! ( ! (
!
2007
(
! ! ( (
(
! (
!
(
! (!
! (!
(! (!
! (! (! (
(
! (!
! (
!
(
!
((
!( !
! (
!
(
!
(
!(
!
(
!
(!
(! (!
!
( (!
! (( (
!
(!
! (
!
! ((
!
(!
!
((!
! (
Public Ordinary Schools
(
! (
! ((!
(! (!
(! (
!
(
! (
!(!
! (
!
(
(
!
(
!
(
!
Fee paying schools No fee paying schools
(
! Fee paying schools
Kilometers
0 12.5 25 50 (
! No fee paying schools
Copyright © 2013 Gauteng Department of Education: EMIS
The average annual movement in learners in the No-Fee category over the last three years is 6.7%. The large
increase in learners in the Foundation Phase has not yet transferred to secondary schools, as increased
learner numbers are now only coming through at the Intermediate School Phase. As a result, secondary
schools may experience an increase of 6% of learners in No-Fee Schools. When current learners graduate
to secondary schools there will be a similar movement in no-fee learners in secondary schools with an
associated impact on transfers to schools, school nutrition programmess and school transport.
Strategic Plan 2015 - 2020 | 11Strategic Plan 2015-2020
Special School Education
Figure 6: % growth in public LSN schools Figure 7: Learner enrolment in Special Schools
7 45000
40000
6
Percentage Growth
35000
Number of learner
5
30000
4 25000
3 20000
15000
2
10000
1
5000
0 0
2009 2010 2011 2012 2013 2009 2010 2011 2012 2013
0.01 4.9 2.5 3.3 6.1 35 854 37 715 38 995 40 491 42 615
The sector has experienced considerable growth in enrolment. In 2013, the recorded year-by-year
enrolment growth was at the highest for the past Äve years at 6.1%.
Learner numbers in LSN schools has shown a steady increase over the past Äve years with 35 854 learners
in 2009 increasing steadily to 42 615 in 2013. For public LSN the learner enrolment has increased from
34 334 in 2009 to 40 462 in 2013, the independent non-subsidised increased from 625 in 2009 to 1 633
in 2013 and the independent subsidised increased from 395 in 2009 to 520 in 2013. In 2013; a total of 27
774 (65%) of all LSN learners were male, while female learners comprised of 14 841 (35%).
Learners in LSN schools by disability
Figure 8: Learners in LSN schools by disability
12000
10000
Number of Learners
8000
6000
4000
2000
0
Partial Sightedness / Low Vision
Behavioural / Conduct Disorder
(including Severe Behavioural Problems)
Blindness
Cerebral Palsy
Deafness
Epilepsy
Mild to Moderate Intellectual Disability
Physical Disability
5RGEKƒE.GCTPKPI&KUCDKNKV[
Other
Autistic Spectrum Disorders
Severely Intellectually Disabled
Remedial / Aid (Aid-Classes)
Hard of Hearing
Public Schools Independent Schools
12 | Strategic Plan 2015 - 2020Strategic
PART Plan 2015-2020
A: STRATEGIC OVERVIEW
Early Childhood Development
The following diagram indicates the number of Grade R learners between 2009 and 2013:
Figure 9: Number of Grade R learners
140000
120000
Number of learners
100000
80000
60000
40000
20000
0
2009 2010 2011 2012 2013
Grade R 70 059 80 870 104 799 127 076 128 206
Another Grade R target is the National Development Plan (NDP) requirement for universal Grade R education
and all Grade 1’s should have a Grade R education. Over the last Äve years this has averaged 42% and
was 48.6% in the 2014 academic year.
The Department is in the process of registering all the centres offering Grade R including the community
and independent sites.
The EfÄciency of Education
In Education, efÄciency refers to the measure of learner performance (outputs) in relation to the inputs
(budget, educators) within the education system. The efÄciency will be measured through the analysis
of repetition rate and also the rate at which learners leave public ordinary schools. In 2013, the public
ordinary school sector constituted 90% of the learners in the ordinary school sector, and represented 80%
of all learners in the province across all the sectors, therefore the analysis concentrated on this sector.
This analysis calculates the Åow of learners through the educational cycle, from primary through to the
secondary level.
There has been a considerable improvement in education levels over the last decade and a half. In 1996
over 9 % of residents that were 20 years and older had no education; this had declined to just 3.7%
in 2011. In contrast, almost 10% had a post-matric education qualiÄcation in 1996, by 2011 this had
almost doubled to just over 18 %. In 2011, over 52 % of the population in Gauteng had a matric or higher
qualiÄcation.
Strategic Plan 2015 - 2020 | 13Strategic Plan 2015-2020
The Department will emphasise the sharing of resources amongst its institutions where necessary. The
Department will continue working with other government departments, SGBs, parents and community-
based organisations to improve the quality of education and improve learner performance.
Repetition Rate
The repetition rate refers to the rate at which learners repeat grades, and the rate of learners leaving public
ordinary schools refers to the number or percentage age of learners who have left the public ordinary
sector. These learners may have enrolled at another institution such as independent schools, LSN, FET or
Adult Education and training (AET) in Gauteng or other provinces in the country. The overall repetition rate
in the public ordinary school sector is 5% in primary schools and 14% at secondary school level.
Figure 10: Repetition Rate Figure 11: Learners leaving POS by schooling level
20
10
% Rate of learners leaving
15
Repetition Rate
8
6
10
4
5 2
0
0
2009 2010 2011 2012 2013
-2
Primary 3.6 3.9 3.9 3.3 5.2 2009 2010 2011 2012 2013
Secondary 13.0 14.9 16.3 15.8 14.3
Primary Secondary
The Department measured the rate of learners leaving public ordinary schools without completing a grade
in a given school year. This rate shows the extent to which learners leave public schools, however, it did
not preclude that learners might have moved to other sectors of the education system.
The rate of learners leaving the primary level grades has averaged below 2% for the past Äve years and
below 10% for secondary level grades. A decreasing trend in a number of grades was observed in 2013
and over the last four years.
The survival rate of learners for 2013 shows that, of the Grade 1 learners who started school in public
schools in 2002, 63% were registered in Grade 12 in 2013.
14 | Strategic Plan 2015 - 2020Strategic
PART Plan 2015-2020
A: STRATEGIC OVERVIEW
Learner Enrolment Age ProÄle
Figure 12: Percentage over aged learers Figure 13: Grade 12 learners by age
80
40
70
35
60
% of Learners
30
% Learners
50
25
40
20
30
15
20
10
5 10
0 0
Primary Secondary 2009 2010 2011 2012 2013
Over-aged in this analysis was construed as all learners outside the age-grade norm, e.g. all learners in
Grade 1 that were over seven years of age were regarded as over-aged. This calculation does not allow for
repetition even though the assessment policies do permit for repetition (failures).This may over exaggerate
the percentage of over-age learners.
The average percentage of over-aged learners in primary schools (Grade 1-7) has improved sligntly from an
average of 18% in the past Äve years to an average of 17% in 2013. The percentage of over-aged learners
amongst secondary school learners is higher compared to primary school learners around 40%.
Figure 14: Percentage of learners who were 18 Figure 15: Percentage of learners who were 18
years or younger in Grade 12 in independent years or younger in Grade 12 in public ordinary
ordinary schools schools by gender
80
80
70
70
60
60
% of Learners
% of Learners
50
50
40
40
30
30
20
20
10
10
0
0 2009 2010 2011 2012 2013
2009 2010 2011 2012 2013
Female Male
The average age of learners in Grade 12 is calculated at 18 years. The total percentage of learners who
were 18 years and younger in Grade 12 was at 63%. When this is disaggregated by public and independent
schools, the public ordinary schools Ägure remained constant at 62% whilst independent schools increased
to 70%.
It is noted that the percentage of female learners at the correct age in grade 12 has been consistently
higher than that of their male counterparts over the past Äve years.
Strategic Plan 2015 - 2020 | 15Strategic Plan 2015-2020
Equity in Education
Learner: Educator Ratio
The learner: educator (LE) ratio is one of the most common indicators that are used in planning. The LE
ratio of public ordinary schools has been constant at 33:1 over the past Äve years.
Figure 16: Learner- Educator ratio in Public Figure 17: Learner-Educator Ratio by Quintile
Ordinary Schools (the poverty rank of schools) for Public Ordinary
Schools
40 40
35
38
30
36
L/E Ratio
25
L/E Ratio
34 20
15
32
10
30
5
28 0
2009 2010 2011 2012 2013 SP ALL SP ALL SP ALL SP ALL SP ALL
Quintile 1 Quintile 2 Quintile 3 Quintile 4 Quintile 5
Primary Schools Secondary Schools
2009 2013
The Department is lagging behind in employing new educators to maintain the expected L:E ratio, this
is mostly due to budgetary constraints. The backlog in infrastructure also plays a pertinent role in the
overcrowding and lack of teaching space in the province. The LE ratio at provincial level meets statutory
requirements, however, in certain subjects and learning areas, the Department is experiencing overcrowding
and this could impact on the LE ratio. Currently the LE ratio in LSEN schools has been constant at 13:1 over
the past Äve years. The LE ratio in public AET centres has remained constant at 38:1, with primary school
having a ratio of 33:1 and secondary schools having an LE ratio of 27:1. When data is disaggregated into
primary and secondary phases, it emerges that the LE ratio for secondary schools is lower than that of the
primary schools.
Once again, the educator and classroom growth needs to be accelerated to catch up and keep up with
learner growth. If this is not addressed a spiralling LER may result in a lower quality of education being
delivered. In order to address the decline in LER, fee paying schools may increase schools fees. This could
result in more learners changing to non-fee paying schools as parents are unable to afford the additional
fees, or any fees, further increasing the burden on the province and non-fee paying schools.
Disparities are noted when disaggregating the LER data by poverty ranking of schools. Quintile 2 was the
only band with a reduction on LER from 2012, while all other Quintiles have an increased LER when looking
at state paid (SP) and total educators.
16 | Strategic Plan 2015 - 2020Strategic
PART Plan 2015-2020
A: STRATEGIC OVERVIEW
Gender Equity in Education
Learner enrolment
The overall gender split of learners in schools indicates that there were 49% and 51% females in primary
and secondary levels respectively. This ratio indicates that access to schooling in the ordinary sector is
almost equal for both male and female learners.
The Gender Parity Index (GPI) is used to measure whether access to schooling for female learners is
improving, or whether they are fully represented in the schooling system. A GPI of 1 indicates that, in
proportion to the appropriate school age population, there are more females than males in the school
system. The total number of learners in the ordinary school sector (including independent schools) was
used to derive the Gross Enrolment Ratio (GER) and hence the GPI.
In 2013 the GPI was 0.99 and 1.04 for primary and secondary levels respectively remaining constant. This
indicator illustrates that in 2013 there were 1% more male learners than female learners in the primary
school phase, and in secondary schools there were 4% more females than males.
Figure 18: Percentage enrolment by gender and Figure 19: Percentage of educators in
grade for 2013 management in Public Ordinary Schools
100
100
Percentage of learners
80
80
Percentage
60
60
40
40
20
20
0
GR G1 G2 G3 G4 G5 G6 G7 G8 G9 G10 G11 G12 GSP 0
2009 2010 2011 2012 2013
Female Male Female Management Male Management
From Grade R to Grade 10, there are an equitable number of females and males enrolled. This proportion
changes for Grade 11 and Grade 12 where female learners are slightly more than male learners. However,
for Grade SP (grade with special learners) there are almost 67% males and 33% females.
The gender equity levels amongst educators indicate that there are more male principals in the public
ordinary schooling system than females, although the sector has a female to male ratio of 71:29 for all
state paid educators (including heads of department, deputy principals and principals). However, when
analysing data by post levels, it is shown that 57% of management positions are held by females.
Strategic Plan 2015 - 2020 | 17Strategic Plan 2015-2020
Figure 20: Percentage of principals by gender Figure 21: Percentage of educators by gender
(POS) (POS)
100 100
80 80
Percentage
Percentage
60 60
40 40
20 20
0 0
2009 2010 2011 2012 2013 2009 2010 2011 2012 2013
Female Principal Male Principal Female Educator PL1 Male Educator PL1
When differentiated by post level, it is noted in the period 2009 to 2013 that 33% of principal posts were
held by females and 67% by males. In the period 2009 to 2013, 75% of PL1 educator posts were held by
females and 25% by males.
Educational Outcomes
Figure 22: Average Grade 12 provincial Figure 23: Performance by quality of pass
performance
45
90
40
85
Percentage Pass Rate
35
80
30
75
25
70 20
65 15
10
60 Bachelors Diploma Higher Certificate/NCS
02 03 04 05 06 07 08 09 10 11 12 13 14
2010 2011 2012 2013 2014
The Department has achieved a Grade 12 pass rate of 84.7% (84 247), making Gauteng one of the top
performing provinces in the country. This is mainly as a result of the the intervention strategies implemented
since 2010. The Grade 12 results improved steadily from 78.1% in 2010, 81.1% 2011, 83.9 % in 2012 and
87 % in 2013, with a slight drop to 84.7% in 2014. A total of 99 478 Grade 12 learners wrote the 2014
examinations.. The number of learners passing to enter bachelor programmes at universities increased
signiÄcantly to 37% of the number of learners that wrote the exit examination. A total of 35.2% of the
learners achieved a diploma pass in the 2014 exams. In total, 87.6% of the matric learners in Gauteng
qualiÄed to pursue further and higher educational studies. In addition, Gauteng learners achieved a total
of 34 998 distinctions with 1 976 distinctions in Mathematics and 1 472 in Physical Science. Learners in
township schools achieved a total of 9 824 distinctions.
The challenge is to maintain the quality results. The focus for the 2015 academic year is to strengthen
all our strategies and interventions in order to maintain and improve the quality of education across the
education spectrum.
18 | Strategic Plan 2015 - 2020Strategic
PART Plan 2015-2020
A: STRATEGIC OVERVIEW
Figure 24: Average performance in Grade 3 Figure 25: Average performance in Grade 6
achieving 50% or more achieving 50% or more
80 90
70 80
70
60
60
50
50
40
40
30
30
20 20
10 10
0 0
Numeracy Literacy Mathematics HL FAL
2012 2013 2014 2012 2013 2014
In the Annual National Assessment (ANA), the Grade 3 learners that achieved 50% or more in the literacy
examination equalled 70.8 %, exceeding the annual target of 60%, and 73.4 % in numeracy exceeding the
annual target of 60%.
In Grade 6 the learners; that achieved 50% or more in the Language examination equalled 79.8 % for Home
Language and 42.3 % for First Additional Language. The average obtained in Mathematics exceeding 50%
was 51.7 %. In 2014, an increase was clearly evident in English Home Language as well as in Mathematics
when compared to 2013.
Figure 26: Average performance in Grade 9 Figure 27: Learner Performance – Improvement in
achieving 50% or more TIMSS
60 400
350
50
300
40
250
30 200
150
20
100
10
50
0 0
Mathematics HL FAL Mathematics Science
2012 2013 2014 2002 2011
The percentage of learners in Grade 9 who achieved 50% or more equalled 48.3% for Home Language
and 25% for First Additional Language. Mathematics is a focal point for the coming academic year as less
that 5 % of learners in the Grade achieved 50% or more in the ANA examination in 2014.
South Africa participated in the Trends in International Mathematics and Science Study (TIMMS). In
South Africa the knowledge of Grade 9 learners were tested in 2002 and 2011. South Africa as a whole
showed a substantial improvement in the average scores for both subjects in the 2011 tests. There was an
improvement of 63 points from 285 to 348 for Mathematics and an increase of 60 points from 267 points
to an average score of 327. The three top performing provinces in both Mathematics and Science in TIMSS
2011 were the Western Cape, Gauteng and Northern Cape.
Strategic Plan 2015 - 2020 | 19You can also read