Thermokarst Lagoons: A Core-Based Assessment of Depositional Characteristics and an Estimate of Carbon Pools on the Bykovsky Peninsula - GFZpublic
←
→
Page content transcription
If your browser does not render page correctly, please read the page content below
ORIGINAL RESEARCH
                                                                                                                                                published: 23 July 2021
                                                                                                                                        doi: 10.3389/feart.2021.637899

                                            Thermokarst Lagoons: A Core-Based
                                            Assessment of Depositional
                                            Characteristics and an Estimate of
                                            Carbon Pools on the Bykovsky
                                            Peninsula
                                            Maren Jenrich 1,2*, Michael Angelopoulos 1,2, Guido Grosse 1,2, Pier Paul Overduin 1,
                                            Lutz Schirrmeister 1, Ingmar Nitze 1, Boris K. Biskaborn 3, Susanne Liebner 4,5,
                                            Mikhail Grigoriev 6, Andrew Murray 7, Loeka L. Jongejans 1,2 and Jens Strauss 1
                                            1
                                             Alfred Wegener Institute, Helmholtz Centre for Polar and Marine Research, Section of Permafrost Research, Potsdam, Germany,
                                            2
                                             University of Potsdam, Institute of Geosciences, Potsdam, Germany, 3Alfred Wegener Institute, Helmholtz Centre for Polar and
                                            Marine Research, Section of Polar Terrestrial Environmental Systems, Potsdam, Germany, 4GFZ German Research Centre for
                                            Geosciences, Section Geomicrobiology, Potsdam, Germany, 5Institute of Biochemistry and Biology, University of Potsdam,
                                            Potsdam, Germany, 6Melnikov Permafrost Institute, Russian Academy of Sciences, Siberian Branch, Yakutsk, Russia, 7Nordic
                                            Laboratory for Luminescence Dating, Department of Geoscience, Aarhus University and DTU Physics, Risø Campus, Roskilde,
                           Edited by:
                                            Denmark
                Alexandra V Turchyn,
             University of Cambridge,
                      United Kingdom        Permafrost region subsurface organic carbon (OC) pools are a major component of the
                      Reviewed by:          terrestrial carbon cycle and vulnerable to a warming climate. Thermokarst lagoons are an
                     Brendan O’Neill,
Geological Survey of Canada, Canada
                                            important transition stage with complex depositional histories during which permafrost and
                 Edward A. Johnson,         lacustrine carbon pools are transformed along eroding Arctic coasts. The effects of
       University of Calgary, Canada
                                            temperature and salinity changes during thermokarst lake to lagoon transitions on
                 *Correspondence:
                                            thaw history and lagoon deposits are understudied. We analyzed two 30-m-long
                       Maren Jenrich
                maren.jenrich@awi.de        sediment cores from two thermokarst lagoons on the Bykovsky Peninsula, Northeast
                                            Siberia, using sedimentological, geochronological, hydrochemical, and biogeochemical
                    Specialty section:      techniques. Using remote sensing we distinguished between a semi-closed and a nearly
         This article was submitted to
                        Biogeoscience,
                                            closed lagoon. We (1) characterized the depositional history, (2) studied the impact of
               a section of the journal     marine inundation on ice-bearing permafrost and taliks, and (3) quantified the OC pools for
            Frontiers in Earth Science
                                            different stages of thermokarst lagoons. Fluvial and former Yedoma deposits were found at
           Received: 05 March 2021
                                            depth between 30 and 8.5 m, while lake and lagoon deposits formed the upper layers. The
            Accepted: 15 June 2021
            Published: 23 July 2021         electrical conductivity of the pore water indicated hypersaline conditions for the semi-
                              Citation:     closed lagoon (max: 108 mS/cm), while fresh to brackish conditions were observed
Jenrich M, Angelopoulos M, Grosse G,        beneath a 5 m-thick surface saline layer at the nearly closed lagoon. The deposits had
 Overduin PP, Schirrmeister L, Nitze I,
Biskaborn BK, Liebner S, Grigoriev M,
                                            a mean OC content of 15 ± 2 kg/m3, with higher values in the semi-closed lagoon. Based
Murray A, Jongejans LL and Strauss J        on the cores we estimated a total OC pool of 5.7 Mt-C for the first 30 m of sediment below
(2021) Thermokarst Lagoons: A Core-
                                            five mapped lagoons on the Bykovsky Peninsula. Our results suggest that paleo river
   Based Assessment of Depositional
   Characteristics and an Estimate of       branches shaped the middle Pleistocene landscape followed by late Pleistocene Yedoma
                  Carbon Pools on the       permafrost accumulation and early Holocene lake development. Afterward, lake drainage,
                  Bykovsky Peninsula.
           Front. Earth Sci. 9:637899.
                                            marine flooding, and bedfast ice formation caused the saline enrichment of pore water,
      doi: 10.3389/feart.2021.637899        which led to cryotic talik development. We find that the OC-pool of Arctic lagoons may

Frontiers in Earth Science | www.frontiersin.org                                    1                                             July 2021 | Volume 9 | Article 637899
Jenrich et al.                                                                                                    Thermokarst Lagoons on Bykovsky Peninsula

                                            comprise a substantial inventory of partially thawed and partially refrozen OC, which is
                                            available for microbial degradation processes at the Arctic terrestrial-marine interface.
                                            Climate change in the Arctic leading to sea level rise, permafrost thaw, coastal erosion, and
                                            sea ice loss may increase the rate of thermokarst lagoon formation and thus increase the
                                            importance of lagoons as biogeochemical processors of former permafrost OC.
                                            Keywords: talik, Arctic Siberia, Yedoma, inundation, permafrost carbon, OSL (optically stimulated luminescence),
                                            coastal erosion

INTRODUCTION                                                                       acceleration of erosion of permafrost coasts and in particular
                                                                                   lagoon formation. Incubation experiments performed by Tanski
Over the last 2 decades, the Arctic has been warming more than                     et al. (2019) indicate that along eroding permafrost coastlines,
twice as fast as the global average (Johannessen et al., 2004;                     large amounts of carbon dioxide can be produced. Therefore,
Berner et al., 2005; Notz and Stroeve 2016). This amplified                         thermokarst lagoon formation is an important process affecting
warming has led to rapid surface warming in Siberia with                           permafrost carbon pools along rapidly changing permafrost
modeled temperature rise of up to 4°C over the last 5 decades                      coasts. In addition, marine inundation affects the
(Romanovsky et al., 2010; Biskaborn et al., 2019; Lenssen et al.,                  temperature and salinity of taliks formerly beneath
2019; GISTEMP Team, 2020). As a consequence, permafrost is                         thermokarst lakes during their transition to the marine
thawing in many regions, mobilizing large amounts of                               environment (Angelopoulos et al., 2020a). The formation of
sediments including organic carbon and allowing microbial                          hypersaline, unfrozen ground beneath thermokarst lagoons may
decomposition of previously frozen organic matter (Strauss                         preserve existing thermokarst lake taliks, forming migration
et al., 2013; Strauss et al. 2021; Schuur et al., 2015). Arctic                    pathways for methane (Shakhova et al., 2019; Angelopoulos
coastal systems are especially affected by rapid permafrost thaw                   et al., 2020a). However, lagoon formation can also cause taliks to
and mobilization of organic matter by erosion and marine                           partially refreeze, provided that heat loss is faster than salt
inundation (Fritz et al., 2017). Lagoons, a frontier                               diffusion (Angelopoulos et al., 2020a). Ascending gas can get
environment between land and ocean, are transitional and                           trapped below low-permeability sediment layers (Ruppel and
dynamic coastal landforms combining characteristics of both                        Kessler, 2017) and be released when conditions warm up. These
terrestrial and marine systems (Kjerfve, 1994; Tagliapietra et al.,                pathways, which may contain low-permeability ice-saturated
2009; Harris et al., 2017). Globally, coastal lagoons are defined as                zones, become part of the offshore environment with sufficient
shallow coastal water bodies separated from the sea by a barrier,                  coastal erosion and so become potential sources of gas release in
connected at least intermittently to the ocean by one or more                      subsea permafrost areas (Frederick and Buffett, 2014; Shakhova
restricted inlets, and usually have a shore-parallel orientation                   et al., 2017).
(Kjerfve, 1994). As lagoons are complex and diverse systems,                           Although thermokarst lagoons are widespread along the pan-
there are many different approaches to classify them, for                          Arctic coast (Jenrich, 2020), there is still no qualitative or
example based on geomorphological and geological origin,                           quantitative assessment of their distribution or of the size of
their morphological properties such as size and water depth                        the total carbon reservoir they represent. Until now, Arctic
(Kosyan, 2016), the degree of isolation from the sea (Kjerfve,                     thermokarst lagoon research has concentrated on the
1994), their physicochemical state (for example, salinity, ionic                   Mackenzie Delta region in Northwest Canada (Hill, 1990; Ruz
composition, temperature, turbidity, nutrients) (Tagliapietra                      et al., 1992; Héquette et al., 1995; Campeau et al., 2000; Solomon
et al., 2009), or the degree of influence by living organisms                       et al., 2000) and the Bykovsky Peninsula in Northeast Siberia. On
such as corals and humans (Brovko 1990).                                           the Bykovsky Peninsula, several lagoons have evolved from
    Permafrost thaw results in landscape change as melting                         thermokarst lake basins in ice-rich Yedoma Ice Complex
excess ground ice causes surface subsidence, eventually                            permafrost, and these are now actively developing in different
forming thermokarst lakes (Osterkamp et al., 2009; Jones                           stages (Romanovskii et al., 2000; Romanovskii et al., 2004;
et al., 2011; Lenz et al., 2016). Along eroding sections of                        Ulyantsev et al., 2017; Schirrmeister et al., 2018). Still, little is
Arctic coasts, lowered thermokarst terrain is affected by                          known of the sedimentary history of thermokarst lagoons, the
flooding of nearshore thermokarst lakes and basins with                             impact of marine inundation, and the amount and quality of
seawater, transforming them into thermokarst lagoons (Ruz                          carbon stored in greater depths.
et al., 1992; Romanovskii et al., 2000). Thermokarst lagoons are                       To address these research gaps, we applied a multidisciplinary
also formed by natural thermokarst lake dynamics in the course                     approach to characterize the sedimentological, geochronological,
of lake drainage at coasts (Arp et al., 2010). However, rates of                   hydrochemical, and biogeochemical properties of two
formation are expected to intensify as a result of ongoing climate                 approximately 30 m deep (below lagoon ice surface level in
change in the Arctic. Increasing coastal erosion (Günther et al.,                  spring) sediment cores from two typical thermokarst lagoons
2015; Jones et al., 2018), sea-level rise (Proshutinsky et al., 2001;              on the Bykovsky Peninsula (Figure 1). We paired this with
Watson et al., 2015; Nerem et al., 2018), and higher sea water                     remote sensing observations to identify, map, and characterize
temperatures (Bindoff et al., 2007) are likely to result in an                     thermokarst lagoons in a regional context along the coast of the

Frontiers in Earth Science | www.frontiersin.org                               2                                         July 2021 | Volume 9 | Article 637899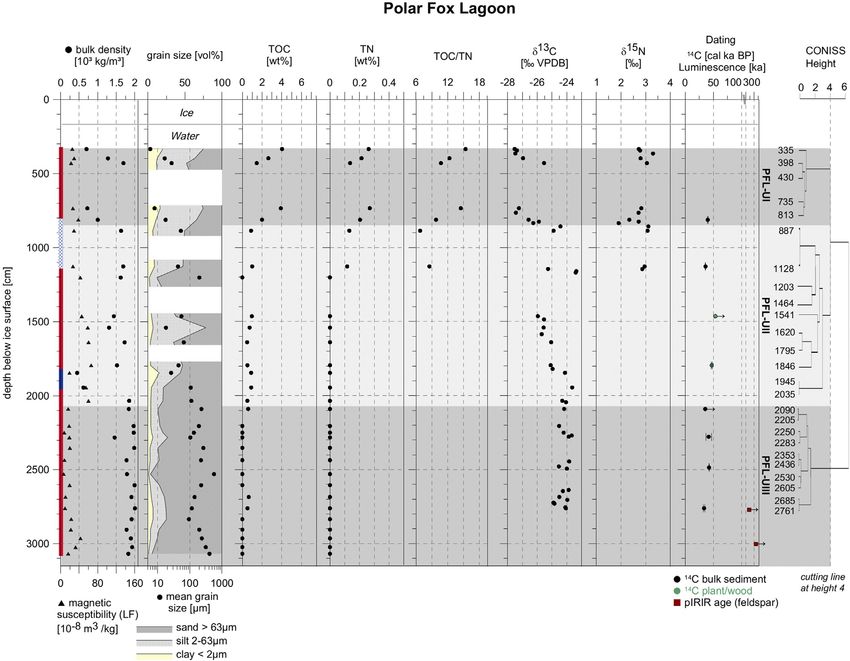
Jenrich et al.                                                                                                                  Thermokarst Lagoons on Bykovsky Peninsula

  FIGURE 1 | Bykovsky Peninsula in Northeast Siberia, south of Lena Delta (A, B). Both the Stepanenko ① and Safroneeva ② lagoons (C) as well as the Uomullyakh,
  Polar Fox, and Ivashkina lagoons are located at the southern coast of the Bykovsky Peninsula (D). The drilling locations in the lagoon centers of Uomullyakh and Polar Fox
  lagoons are indicated by yellow dots (D). Source imagery: (A, C): ESRI Satellite World Imagery b: Permafrost extent regions based on Brown et al. (1997) (D) WorldView3
  false colour satellite image (8-5-3), acquired 2016-09-02.

Bykovsky Peninsula. The specific aims of this paper are to                                  The hinterland of the Bykovsky Peninsula is the Kharaulakh
characterize (1) the sediments and (2) pore water below the                                Range with elevations up to 500 m above sea level (asl), which is
lagoons and (3) to quantify the regional carbon inventory based                            part of the northern foothills of the Verkhoyansk Mountains. The
on spatially explicit lagoon areas in the region.                                          peninsula consists of the remains of a former late Pleistocene
                                                                                           sediment accumulation plain with elevations of up to 45 m asl
Study Area                                                                                 (Schirrmeister et al., 2002; Schirrmeister et al., 2018). It lies within
The lagoons investigated here are the semi-closed Uomullyakh                               the continuous permafrost zone and is characterized by thick, ice-
Lagoon (UoL) and the nearly closed Polar Fox Lagoon (PFL)                                  rich Yedoma Ice Complex deposits (Grosse et al., 2007).
(Table 1), located on the southern coast of the Bykovsky                                   Postglacial sea level rise during the Lateglacial interstadial and
Peninsula (71°51′ N, 129°19′ E) (Strauss et al., 2018,                                     the early Holocene inundated the shallow Laptev Sea shelf and
Figure 1D). The peninsula is located in Northeast Siberia                                  transformed terrestrial permafrost into subsea permafrost
(Figure 1B), at the mouth of the Bykovskaya Channel, one of                                (Romanovskii et al., 1998; Lantuit et al., 2011). Cliffs and
the main outflow channels of the Lena River Delta (Figure 1A).                              thermokarst basins are the typical backshore coastal

Frontiers in Earth Science | www.frontiersin.org                                       3                                                July 2021 | Volume 9 | Article 637899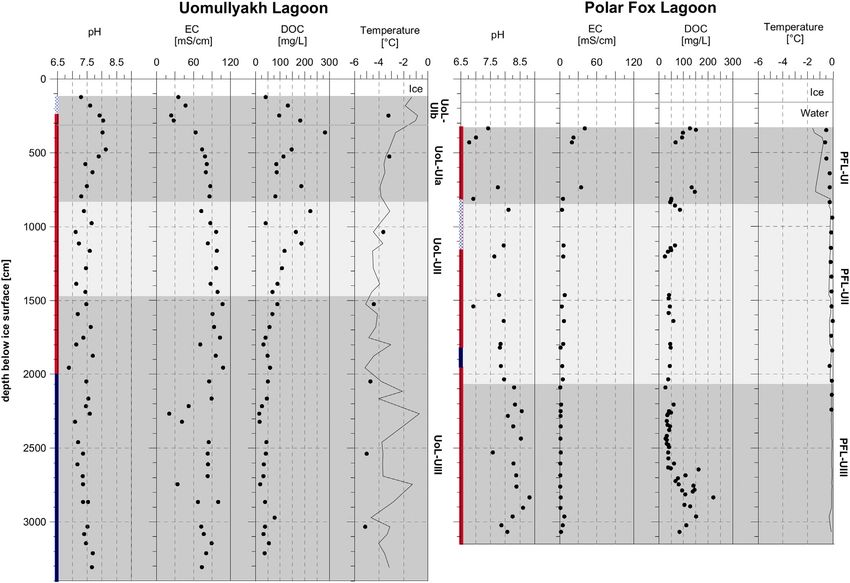
Jenrich et al.                                                                                                                 Thermokarst Lagoons on Bykovsky Peninsula

TABLE 1 | Classification of lagoons into “open”, “semi-closed” and “nearly closed” lagoon systems which occur along a gradient of coastal erosion.

Lagoon                                Connectivity                                        Impact                                           Examples
class                                 with the sea                                   of coastal erosion

Open             Full and broad exchange with the sea                        Fully affected and far ahead in the    Stepanenko and Safroneeva lagoons (Figure 1), many in
                                                                             transition to an open marine system    the northern Lena Delta, and on the Cape Halkett coast of
                                                                                                                    Beaufort Sea
Semi-            Barrier islands or sand spits partially block exchange      Moderately to substantially affected   Uomullyakh Lagoon (Figure 1), many on Tuktoyaktuk
closed           with the sea either temporally or spatially                                                        Peninsula, eastern Alaskan Beaufort Sea (Harris et al.,
                                                                                                                    2017)
Nearly           Narrow outlet/inlet channel connecting lagoon and sea,      Not yet affected                       Polar Fox Lagoon (Figure 1), and other lagoons connected
closed           with the possibility of having lake character temporarily                                          through small channels

landforms. Sixteen large thermokarst depressions are found on                                water body (water depth 3.30 m in the lagoon center) formed
the peninsula (Grosse et al., 2005; Fuchs et al., 2018). In total,                           after partial lake drainage. This nearly closed lagoon is located in
more than 50% of the Bykovsky Peninsula is strongly influenced                                a partially drained thermokarst basin (Alas in Figure 1D) and is
by thermokarst and thermo-erosion landforms (Grosse et al.,                                  connected to the sea only during the open water season via an 800 m
2005; Lantuit et al., 2011).                                                                 long and roughly 50 m wide outlet channel. The water level in the
    According to the Köppen–Geiger world climate classification                               lagoon is at about sea level and water flow occurs in both directions
(Peel et al., 2007), the peninsula is located in the polar tundra                            depending on wind, wave, and tide conditions. Ice thickness
climate zone (ET). Despite the coastal location, the climate is                              measurements from April 2017 and bathymetry from July 2017
strongly continental with long, cold winters (September–May)                                 suggest that the lagoon was 75% covered with bedfast ice
and short, cool summers. In January, the mean air temperature is                             (Angelopoulos et al., 2020a). In the center of the lagoon, at the
−30.0°C and rises to +8.5°C in July (1987–2016). The mean                                    borehole location (71°44′58″N, 129°20′30″E), a 175 cm salty water
annual precipitation does not exceed 350 mm (Tiksi                                           layer was present underneath the 155 cm thick seasonal ice layer in
Hydrometeorological Observatory, WMO 218240). The open-                                      April 2017 (Strauss et al., 2018).
water season in the southern Laptev Sea starts on average in mid-                                Both lagoons are strongly impacted by warm freshwater
June and extends to mid-October (Lantuit et al., 2011).                                      discharge from the Lena River into the Buor Khaya and Tiksi
    During drilling campaigns within the Russian-German science                              bays (Juhls et al., 2019). This discharge causes large seasonal and
cooperation Lena Expedition in 2017, deep sediment cores from                                interannual variations in temperature and salinity
two thermokarst lagoons (UoL and PFL) and one thermokarst                                    (Supplementary Table S1). For example, Polar Fox Lagoon
lake (Goltsovoye Lake (GoL)) were drilled on the Bykovsky                                    had a salinity of 13 psu (practical salinity unit) and 44 psu
Peninsula (Figure 1D). Furthermore, sediment characteristics                                 below the ice cover in April 2017 and April 2019, respectively.
of a 6.2 m deep core from the Ivashkina Lagoon (IvL) drilled in                              In July 2017, the salinity dropped to less than 1 psu.
1999 were published by Schirrmeister et al. (2018). The results
showed several stages of landscape development from the initial
Yedoma Ice Complex through thaw-induced lake development                                     METHODS
and eventually lagoon formation. In this study, we report on
results from the approximately 30 m deep cores from Polar Fox                                Field Work
and Uomullyakh lagoons.                                                                      Fieldwork on the Bykovsky Peninsula was carried out in April
    The Uomullyakh Lagoon (71°43′51″N, 129°16′21″E,                                          2017 (Strauss et al., 2018). Over eight days, a 33.5 m deep
Figure 1D) is a 2.1 km2 large, shallow lagoon (water depth                                   borehole was drilled from the ice surface on UoL (core
0.8 m at the borehole location) with underlying former                                       number PG2410) and a 31 m deep borehole was drilled from
Yedoma and Alas permafrost (Strauss et al., 2018). The lagoon                                the ice surface of neighboring PFL (PG2411) (Figure 1) using a
is well connected with the Tiksi Bay via a 90 m wide opening in                              URB2-4T drilling rig mounted on a tracked vehicle. The sediment
the center of the narrow and flat sand spit, which can be flooded                              core retrieved at UoL was 32.3 m long and at PFL 27.7 m long.
by storm surges. In April 2017, test hole drilling (17 locations)                            Immediately after recovery, the cryolithology of the sediment
with a Kovacs 5 cm diameter ice auger revealed bedfast ice at all                            cores was visually described and the cores were packed and
locations. However, bathymetry surveys in summer 2017 (Strauss                               transported frozen to AWI Potsdam. GeoPrecision
et al., 2018) suggest that small isolated water pockets might have                           temperature chains were installed in both boreholes, each with
existed in April 2017. We recorded 40 cm of compacted snow on                                an accuracy of ± 0.1°C at 0°C and a resolution of 0.01°C. The
top of 80 cm ice, which was overlying the frozen lagoon bed at the                           thermistors had been calibrated in a MilliQ water-ice bath to
drilling location (71°43′51″N, 129°16′29″E). In the west, the                                measure their offset from 0°C prior to deployment. The chains
lagoon is connected to two drained thermokarst lakes basins                                  remained in the boreholes for 5 days at Polar Fox Lagoon and
by a former drainage channel.                                                                11 days at Uomullyakh Lagoon. To account for drilling heat
    The Polar Fox Lagoon (71°44′35″N, 129°20′16″E;                                           effects, the observed temperature drift for each thermistor was
Figure 1D) is a smaller sized (0.6 km2), brackish to salty                                   analyzed following Lachenbruch et al. (1982) to estimate the

Frontiers in Earth Science | www.frontiersin.org                                         4                                             July 2021 | Volume 9 | Article 637899
Jenrich et al.                                                                                            Thermokarst Lagoons on Bykovsky Peninsula

undisturbed temperature. Both sediment cores were mostly                    the biogeochemical parameters total nitrogen (TN), total carbon
unfrozen but had some partially frozen layers. The heat                     (TC) and total organic carbon content (TOC), and their stable
generated during the drilling of the cores caused the cores to              isotopes (δ13C and δ15N) were measured and the TOC/TN ratio
partially thaw, so that the on-site haptic observation of the frozen        determined. The parameters TOC/TN and δ13C are widely used as a
state included some uncertainty. The PFL raw temperature data is            broad indicator for the degree of decomposition and source of
available from Angelopoulos et al. (2020a) and the UoL                      organic matter (OM) (e.g. Mary et al., 1992; Meyers 1994; Meyers,
temperature data and processing are described in the                        1997; Gundelwein et al., 2007; Andersson et al., 2012; Strauss et al.,
supporting information (Supplementary Figure A4).                           2015). Generally, a lower TOC/TN ratio and higher δ13C indicate
                                                                            more decomposed organic material (Schirrmeister et al., 2011;
Laboratory Analyses                                                         Strauss et al., 2015). Since microorganisms prefer easily accessible
In the cold lab (−9°C), the sediment cores were opened, cleaned             carbon compounds, the organic carbon quality decreases with
and split, and the cryolithology was described in more detail.              increasing organic matter decomposition (Schowalter, 2016).
Furthermore, the core halves were photographed and subsamples               Using δ13C and TOC/TN, it is possible to distinguish between
were taken approximately every 50 cm for laboratory analyses.               land plants and marine, brackish and freshwater algae
For the Polar Fox core, a higher sampling resolution of about               (decreasing δ13C is associated with decreasingly saline
every 10 cm was used for pore water extraction.                             environment) (Meyers et al., 1994) (Supplementary Table S2).
                                                                                To determine TC and TN content, the homogenized, freeze
Hydrochemical Analyses                                                      dried and ground samples were measured with a
                                                             ™
Pore water was extracted from thawed samples using Rhizons with
a membrane pore size of 0.15 µm and analyzed for pH, electrical
                                                                            carbon–nitrogen–sulfur analyzer (Vario EL III, Elementar).
                                                                            TOC was measured with a TOC analyser (Vario Max C,
conductivity (EC, mS/cm), DOC (mg/L) and stable water isotopes              Elementar). We measured two replicates of each sample and
(δD, δ18O (‰ vs. VSMOW)). The pH and EC values were measured                accepted only 25 (Walhert et al., 2004).
Sedimentology Analyses                                                          The volumetric TOC content (carbon density, kg TOC/m3)
Grain size measurements were conducted to gain information                  was calculated following Strauss et al. (2013) according to Eq. 1:
about the transportation medium and the level of sediment
                                                                                                                               TOCwt%
accumulation at the study areas. Mass specific magnetic                                organic carbon content  Vref · BD ·            ,           (1)
susceptibility, describing the ability of a material to be                                                                      100
magnetized, gives an indication of the amount of ferri- and                 where Vref is the reference volume of 1 m3, BD in kg/m3 and TOC
ferromagnetic minerals in a sample. Differences in mineral                  in wt%.
composition between samples usually indicate sediment sources                  The stable carbon and nitrogen isotopic composition was
and changes in stratification (Liu et al., 2010). For both                   measured for all samples with TOC or TN values above the
measurements the samples were pre-weighed and freeze-dried.                 detection limit (0.1 wt%) with a ThermoFisher Scientific Delta-V-
The absolute ice or water content was determined based on the               Advantage gas mass spectrometer equipped with an organic
difference in weight before thawing and after freeze drying related         elemental analyser Carlo-Erba NC2500 (accuracy: < 0.2‰).
to the wet weight (Phillips et al., 2015). The bulk density (BD in          Measured δ13C and δ15N was compared to the standardized
kg/m3) was calculated from the ice content according to Strauss             Vienna Pee Dee Belemnite (VPDB) and expressed in per mille
et al. (2012). The grain size distributions of 74 samples from both         (‰ vs. VPDB). TOC and TN values below the detection limit
cores were measured with a Malvern Mastersizer 3000 laser particle          were neglected in further calculations.
size analyser with a measuring range of 0.01–1000 µm. Additional
details on BD calculation and grain size measurement can be                 Geochronology
found in the supplementary material. Mass-specific magnetic                  For radiocarbon dating, we chose samples about every 3 m (n  19
susceptibility (MS in 10–8 m3/kg) was measured with a                       for both cores). When present, macroplant remains were hand-
Magnetic Susceptibility Meter (Model MS2, Sensor Type MS                    picked under a stereomicroscope, otherwise bulk sediment was
2B, Bartington Instruments) on the freeze-dried, but not                    selected and dated using Accelerator Mass Spectrometry in the
homogenized samples at a frequency of 0.465 kHz (low frequency).            AWI MICADAS (MIni radioCArbon DAting System)
                                                                            Laboratory in Bremerhaven. Radiocarbon dates were calibrated
Bulk Biogeochemistry                                                        using Calib 7.04 software after (Reimer et al., 2013) and the
To gain information about changes in the nutrient cycle during the          IntCal13 calibration curve (Stuiver et al., 2020) to calculate
transformation of terrestrial permafrost into sub-aquatic permafrost,       calibrated years before present (cal. years BP).

Frontiers in Earth Science | www.frontiersin.org                        5                                        July 2021 | Volume 9 | Article 637899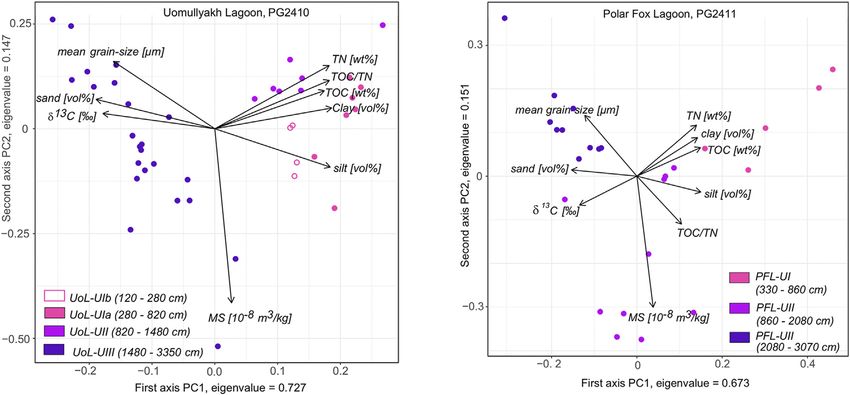
Jenrich et al.                                                                                           Thermokarst Lagoons on Bykovsky Peninsula

    For optically stimulated luminescence (OSL) dating, three core          occurrence threshold of >75% over this time period. The
segments were selected in the field from the Uomullyakh core,                raster dataset was vectorized and smaller geometric errors,
and two from the Polar Fox core. The core segments were frozen              which occurred during vectorization, were solved with the Fix
in their original state, wrapped in black foil, and delivered frozen        Geometry function in QGIS3.6. The five Bykovsky Peninsula
to Aarhus University’s Nordic Laboratory for Luminescence                   lagoon polygons were selected manually and these water bodies
Dating (Roskilde, Denmark). The core segments were then                     were split from the ocean by using the function “split by line”. The
thawed in a controlled-light environment and the outer                      resulting lagoon polygons were re-projected in UTM Zone 52N
∼5 mm removed to minimize the effects of smearing, and to                   (EPSG:32652) to calculate the polygon area in km2.
ensure that the material used for OSL measurements had not been
exposed to daylight during or after retrieval. Luminescence                 Upscaling Carbon Pools
measurements were made using a Risø TL/OSL reader, model                    The organic carbon pools of Uomullyakh and Polar Fox lagoons
TLDA 20. A standard SAR protocol based on Murray and Wintle                 were estimated after Jongejans et al. (2018) using Equation 3,
(2000; 2003) was used for quartz dose estimation, and a                     based on a deposit thickness of 30 m, the lagoon size, bulk density,
comparison with feldspar data was used to investigate the                   and TOC content. We assume that there is no form of massive ice
degree of bleaching at deposition (e.g. Möller and Murray,                  in the thermokarst lagoon sediments, so that the TOC pool can be
2015). Radionuclide concentrations were measured using high                 calculated as:
resolution gamma spectrometry (Murray et al., 1987; Murray
et al., 2018), calibrated using Certified Reference Materials                                          thickness · coverage · BD ·     TOC
                                                                                     TOCpool (Mt)                                    100
                                                                                                                                                 (3)
produced by Natural Resources Canada (NRCAN). For                                                                   106
detailed information see supplementary material.
                                                                            with thickness and coverage in m, BD in kg/m3 and TOC in wt%.
                                                                            For further calculations, we assumed a TOC of 0.05 wt% for the
Borehole Temperature Measurements and                                       samples with TOC below the detection limit (n  21). To
                                                                            compensate for data gaps caused by core loss or larger
Calculation of Freezing Conditions
                                                                            sampling distances, the BD and TOC values were first
Ground temperature was recorded for 11 days in the Uomullyakh
                                                                            multiplied, and the depth interval given as the difference of
borehole and for 5 days in the Polar Fox borehole in April 2017.
                                                                            two adjoining depths was calculated. For core loss sections,
The freezing point depression ΔTf of the sediment was calculated
                                                                            this interval was accordingly higher. The product of BD and
from the molality of dissolved ions estimated from the measured
                                                                            TOC was weighted and replicated for each depth interval. To
pore water electrical conductivity according to Eq. 2 (Atkins,
                                                                            interpolate the carbon content of point measurements to greater
2018) and then compared with the measured borehole
                                                                            areas, the data was resampled using the bootstrapping method
temperatures.
                                                                            after Jongejans and Strauss (2020). Assuming that the deposition
                                                   2
                                    RTm,fw                                of organic material in the study area did not show significant
                              ΔTf            c                  (2)        differences, the calculated C-budgets of UoL and PFL were
                                       Lf
                                                                            averaged and upscaled on the three further lagoons on the
   This equation describes the lowering of the freezing point of            peninsula. Therefore, the size of each lagoon was multiplied
free water with the salt content c (mol/kg). R is the universal gas         with the mean of the TOC pool of UoL and PFL, and divided
constant 8.314 J/(K mol), Tm,fw is the freezing point of free water         by the mean size of UoL and PFL.
(273.15 K) and Lf is the latent heat of fusion of water
(334,000 J/kg). For the conversion of the measured EC to                    Statistics
molality (mol/kg) the MATLAB implementation of TEOS-10                      We used the R environment to perform various statistical
(McDougall and Barker 2011) was used. It has been demonstrated              analyses on 10 parameters (R Core Team (2016); R version
that TEOS-10 also performs well for hypersaline solutions                   3.6.3). In order to compare the differently scaled parameters,
(Pawlowicz, 2012). Further details can be found in the                      the data was normalized with the function "normalize". To
supplementary material.                                                     subdivide the cores into stratigraphic zones, the
                                                                            stratigraphically constrained, incremental sum of squares
Lagoon Mapping                                                              cluster analysis (CONISS) was applied. Thereby, only
Along the coast of the Bykovsky Peninsula six lagoons exist, five of         stratigraphically adjacent clusters are considered for merging.
them originated from thermokarst basins (Jenrich, 2020). All of             The CONISS clustering was performed in R with the ’chclust’
them are located in the southern part of the peninsula (Figure 1). We       function from the package ’rioja’. The used dissimilarity index
used a simple geomorphological approach to further differentiate            was ’bray’. In order to compare the properties at the time of
them based on their connectivity with the ocean into open, semi-            sediment      deposition,     only     sedimentological     and
closed and nearly closed thermokarst lagoons (Table 1).                     biogeochemical parameters were included in the calculation.
   The extent of each of the five lagoons was determined using               In total 10 parameters: mean depth, grain size (mean,
the Global Surface Water dataset which is based on Landsat-5, -7,           volumetric proportion of clay, silt and sand), mass specific
and -8 satellite images from 1984 to 2018 at 30 m resolution                magnetic susceptibility, TOC, TN, TOC/TN and δ13C.
(Pekel et al., 2016). Water bodies were defined by a water                   Hydrochemical parameters were not used as pore water in

Frontiers in Earth Science | www.frontiersin.org                        6                                       July 2021 | Volume 9 | Article 637899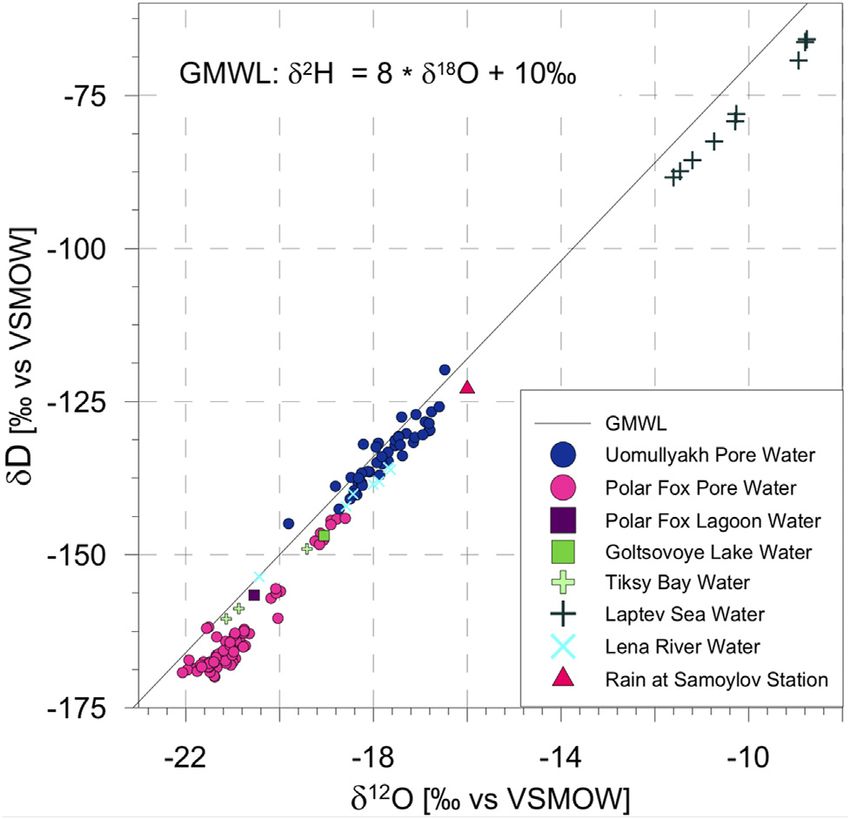
Jenrich et al.                                                                                                                     Thermokarst Lagoons on Bykovsky Peninsula

  FIGURE 2 | Summary of sedimentological, geochronological and biogeochemical parameters for the Uomullyakh Lagoon core: bulk density (upper axis), mass
  specific magnetic susceptibility (lower axis), grain size (upper axis: volumetric proportions, lower axis: mean grain size), total organic carbon content (TOC), total nitrogen
  content (TN), organic carbon and nitrogen ratio (TOC/TN), stable carbon and nitrogen isotope composition (δ13C, δ15N), radiocarbon dating (14C) and luminescence
  dating (pIRIR, OSL). The top 120 cm is the overlying ice cover. The core was divided into three stratigraphic units based on a CONISS analysis. Color bar at the
  y-axis indicates frozen (blue), unfrozen (red) and partially frozen (shaded) core segments. Note that “frozen” includes visibly frozen core sections and re-constructed
  frozen conditions. Arrows indicate non-finite ages.

unfrozen soil is flowing and mixing constantly and so does not                                RESULTS
represent the hydrochemical composition at the time of
sediment deposition. The results were visualized in a                                        The cores are described according to the depositional record from
dendrogram. The cutting point was selected based on visual                                   bottom to top. All depth specifications refer to the top of the ice
validation and dating results.                                                               cover (contains a compacted snow layer on top of lagoon ice)
   A principal component analysis (PCA) was performed on the                                 unless they are specifically stated as sediment depth, in which case
same parameters to reduce this high-dimensional data set to                                  we refer to the depth from the top of sediment. The units were
fewer dimensions and to detect patterns in the distribution of                               separated according to a vertical cut in the dissimilarity
sedimentological and biogeochemical parameters over depth. The                               dendrogram at height 7 for the Uomullyakh sediment core
results were visualized in a biplot. The arrows show the loading                             (Figure 2) and at height 4 for the Polar Fox sediment core
on each variable, with the length approximating the variance and                             (Figure 3). Therefore, the Uomullyakh core (PG2410, core
the angle between the arrows their correlation. Points close                                 recovery of 85%) was divided into three units, whereby Unit I
together correspond to depth that have similar scores on the                                 was divided into two subunits: UoL-UIII ranges from 3350 to
PCA components. PCA was performed using the ‘prcomp’                                         1480 cm, UoL-UII from 1480 to 820 cm, UoL-UIa from 820 to
function from the Package ‘stats’.                                                           320 cm and UoL-UIb from 320 to 120 cm depth. The Polar Fox

Frontiers in Earth Science | www.frontiersin.org                                         7                                                 July 2021 | Volume 9 | Article 637899
Jenrich et al. Thermokarst Lagoons on Bykovsky Peninsula
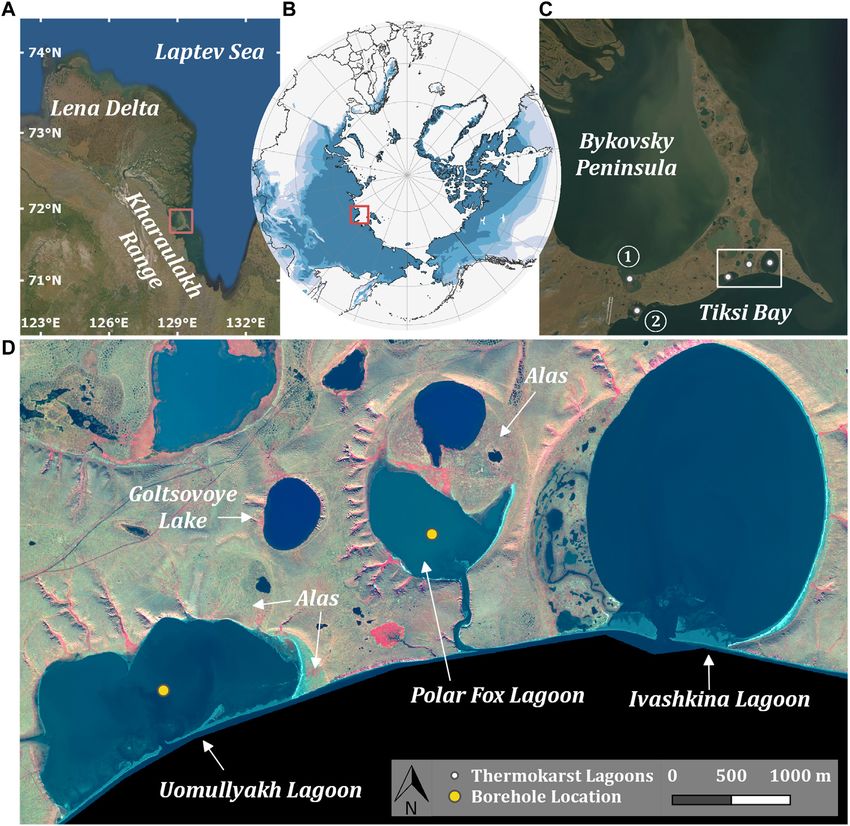
FIGURE 3 | Summary of sedimentological, geochronological and biogeochemical parameters for Polar Fox Lagoon core: bulk density (upper axis), mass specific
magnetic susceptibility (lower axis), grain size (upper axis: volumetric proportions, lower axis: mean grain size), total organic carbon content (TOC), total nitrogen content
(TN), organic carbon and nitrogen ratio (TOC/TN), stable carbon and nitrogen isotope composition (δ13C, δ15N), radiocarbon dating (14C) and luminescence dating
(pIRIR). The top 330 cm is the overlaying ice and water layer. The core is divided into three stratigraphic units based on a CONISS analysis. Color bar at the y-axis
indicates frozen (blue), unfrozen (red) and partially frozen (shaded) core segments. Arrows indicate non-finite ages.
sediment core (PG2411, core recovery of 70%) was also divided core. At 1530 cm, a layer of large wood pieces (up to 5 cm
into three units: PFL-UIII from 3070 to 2080 cm, PFL-UII from in size) was observed.
2080 to 860 cm and PFL-UI ranges from 860 to 330 cm depth. At PFL, the sediment gradually became finer upwards in the
core. From core end up to 860 cm (PFL-UIII & II), the sediment
Core Description was sandy with fine, medium and coarse sand alternating
At UoL, from core bottom up to 1480 cm depth (UoL-UIII), the frequently. Rounded pebbles up to 3 cm in diameter were
grain-size of the sediments alternated several times from silty found up to 1120 cm depth. Above 860 cm in PFL-Unit I, the
fine sand to coarse-grained sand. Rounded pebbles up to 2 cm in sediment was dark grey and increasingly silty. From 630 cm
diameter were found up to 1030 cm depth. In UoL-UII, layers of onwards, shell and plant remains were encountered. Between
silty fine sand became thicker and coarse-grained layers thinner. 2245 cm and 2100 cm two 5–10 cm thick macro organic
From 820 cm to the top (UoL-UI), the sediment consisted of containing layers were observed. At 1810 cm, a 5 cm layer of
black to dark grey clayish to silty fine sand with parallel large wood pieces (up to 8 cm in size) similar to UoL was found.
sediment structures. UoL-UIb was partially frozen. From The upper 1500 cm of sediment contained only sparse organic
2100 cm downwards the sediment was rich in structureless remains. The core was mostly thawed and had only small frozen
ground-ice. Between the frozen parts the core was thawed. sections (1815–1855 cm, 2040–2050 cm and 2970–2985 cm, and
Several organic-bearing layers were encountered along the ground ice structures between 810 and 1160 cm).
Frontiers in Earth Science | www.frontiersin.org 8 July 2021 | Volume 9 | Article 637899Jenrich et al. Thermokarst Lagoons on Bykovsky Peninsula Geochronology < 1 mm fraction: 161 µm) and visually observed rounded pebbles Radiocarbon dates for the Uomullyakh Lagoon core ranged from up to 2 cm in size. The upper part of UoL-UIII was also >53.2 cal ka BP to 2.6 cal ka BP (Figure 2, Supplementary Table characterized by an alternation of coarser deposits (mean S3) and showed several age inversions from 1036 cm depth grain size: 193 µm) with low MS of 20 × 10–8 m3/kg and downwards. The upper two samples until 478 cm depth were fine deposits (mean grain size: 37 µm) with high MS values of early Holocene age. Both the oldest sample (>53 cal ka BP) at a of 59 × 10–8 m3/kg. At the lower end of UoL-UII, the TN content depth of 2049 cm, and the (even deeper) youngest sample decreased below the detection limit of 0.1 wt%. In UoL-UII, (2.6 cal ka BP) at 3033 cm, were from plant macrofossils. Bulk coarse sand layers with pebbles and silty fine sand layers organic samples also showed inversions although not so extreme, alternated. The sand fraction decreased (mean grain size: and varied between 18 and 34 cal ka BP. The luminescence ages of 24.3 µm). At 1110 cm, TOC (6.7 wt%) and TN (0.4 wt%) quartz (OSL) and feldspar (pIRIR) (Supplementary Table S4) values were at a maximum and were associated with low were similar in range to the radiocarbon dates at 1107 cm [37 ± δ13C (−27.5‰ VPDB) and low δ15N (1.3‰) values 2 ka (OSL), 29.9 ± 1.6 ka (pIRIR) and 43.0 ± 0.6 ka cal BP (Supplementary Table S3). In Unit Ia of UoL, poorly sorted (radiocarbon)] and 2108 cm depth [63 ± 3 ka (OSL), 59 ± 4 ka clay and silt deposits were predominant with a share of 16 and (pIRIR) and >53.2 ka cal BP (radiocarbon)]. Since quartz dose 73% respectively (mean grain size: 12.5 µm) (Figure 2). The recovery was satisfactory for these samples from UoL, the OSL TOC content ranged between 3.2 and 4.5 wt% and the TN ages are considered more reliable for these samples than the content between 0.2 and 0.3 wt%. UoL-UIb, containing the feldspar and radiocarbon ages. The lowermost luminescence age upper 200 cm, was distinguished from the lower unit UoL- at 2978 cm was non-finite for both quartz (>100 ka) and feldspar UIa by coarser grain size and lower TOC and TN content (>300 ka). Since feldspar provided the more limiting constraint, (1.9 wt% and 0.15 wt%, respectively). In samples with a mean the minimum feldspar age is shown in Figure 2. grain size below 63 µm (mainly Units I and II), the δ13C values Radiocarbon dates for Polar Fox Lagoon ranged from were mostly below −26‰ VPDB, whereas they were higher > 53.3 cal ka BP to 33.5 cal ka BP (Figure 3, in coarse-grained samples. The bulk density decreased from the Supplementary Table S3). For the uppermost sample, the core bottom to the top (1600–100 kg/m3, mean 1200 kg/m3). For radiocarbon dating failed due to insufficient organic carbon further details of the biogeochemical results see Supplementary content, so that available dates started at 480 cm sediment Table S6. The MS ranged from 5 to 154 × 10–8 m3/kg, with depth (corresponding to depth of 813 cm measured from ice variations mainly in areas of abrupt changes in grain size. Fine surface). As seen at UoL, the age dating revealed no linear trend deposits corresponded with high TOC content over the core over depth. The youngest age was found in the greatest depth length. (2761 cm), while the oldest sample was found at 1130 cm sediment depth. The luminescence ages included only non- Polar Fox Lagoon finite ages for quartz and feldspar of >100 ka and >300 ka at The lowermost Unit III (PFL-UIII) stretching up to 2080 cm 2771 cm and of >100 ka and >320 ka at 3002 cm depth depth was characterized by a large proportion of coarse material (Supplementary Figure S1, Table S4). Therefore, the feldspar (sand and gravel, measured mean grain size of the
Jenrich et al.                                                                                                                    Thermokarst Lagoons on Bykovsky Peninsula

  FIGURE 4 | Hydrochemical parameters of the pore water and borehole temperature of the Uomullyakh Lagoon (left) and the Polar Fox Lagoon cores (right): pH,
  electrical conductivity (EC), dissolved organic carbon concentration (DOC), measured borehole temperature (point) and freezing point (line) estimated from pore water
  salinity. Color bar at the y-axis indicates frozen (blue), unfrozen (red) and partially frozen (shaded) core segments. Note that at UoL “frozen” includes visibly frozen core
  sections and re-constructed frozen conditions.

in grain size (at 630 and 530 cm). MS ranged between 6 and 66 ×                              DOC concentration varied most in the uppermost unit and was
10–8 m3/kg, with particularly strong variation in the small frozen                           highest at 360 cm depth (282 mg/L), while in PFL the greatest
core sections.                                                                               variation was found in the lower 5 m with the highest DOC
                                                                                             concentration measured at 2835 cm depth (221 mg/L; Figure 4
                                                                                             and Supplementary Table S8).
Hydrochemistry and Reconstructed                                                                The stable water isotope composition was generally heavier in
Freezing Conditions                                                                          the pore water of the semi-closed Uomullyakh Lagoon (mean
Results of the hydrochemical analyses of pore water are shown                                δ18O/δD: −20.9‰/−163.4‰) (Supplementary Figure S2A) than
in Figure 4 and also in Supplementary Table S8. The pore                                     in the nearly closed Polar Fox Lagoon (mean δ18O/δD:
water pH of both lagoons was neutral to slightly alkaline with a                             −17.7‰/−133.7‰) (Supplementary Figure S3A). In the UoL
median of 7.5 for UoL and 8.0 for PFL. The EC was much higher                                core, the pore water of the upper sample had the lightest isotope
in the pore water of the UoL-core with a maximum of 108 mS/cm                                composition with δ18O of −19.8‰, which is comparable to the
at 1955 cm depth (median: 83.1 mS/cm) and showed higher                                      upper 5 m of PFL core pore water where its isotope composition
variations over depth. Relatively low EC values at 2267 and                                  was heaviest. There was no significant difference in isotopic
2745 cm depth were correlated with heavy stable water                                        composition between frozen and unfrozen samples
isotopes (Supplementary Figure S2A). The EC of the Polar                                     (Supplementary Figure S2B, S3B). For UoL, we found a
Fox core pore water was highest in the upper sediment layer                                  depletion of δ18O with increased salinity. This was not found
(max: 41 mS/cm) and showed freshwater to brackish conditions                                 in the mainly freshwater to brackish dominated PFL core.
from 800 cm depth downwards (median: 3.3 mS/cm). The DOC                                        High freezing point depressions were observed for hypersaline
distribution differed between the two lagoons, while the median                              samples (Figure 4) (e.g. for Uomullyakh at a depth of 1955 cm).
value was similar (UoL: 58 mg/L, PFL: 50 mg/L). In UoL, the                                  For UoL, the borehole temperature was below the calculated

Frontiers in Earth Science | www.frontiersin.org                                        10                                                July 2021 | Volume 9 | Article 637899
Jenrich et al. Thermokarst Lagoons on Bykovsky Peninsula
TABLE 2 | Calculated carbon pools for the upper 3 m and 30 m deposits below Uomullyakh and Polar Fox lagoons and estimated carbon pools below the three additional
thermokarst lagoons of the southern Bykovsky Peninsula. Calculation is based on the bootstrapping method. The C-density of Stepanenko, Ivashkina and Safroneeva
lagoons is the mean of the C-density calculated for Uomullyakh and Polar Fox lagoons.
Lagoon Lagoon size C-budget (Mt) C-density (kg/m3)
(km2)
3m 30 m Yedoma deposits 3m 30 m Yedoma deposits
Uomullyakh 2.10 0.15 ± 0.01 1.14 ± 0.20 0.42 ± 0.03 24.37 ± 2.09 18.03 ± 3.12 30.86 ± 1.91
Polar fox 0.64 0.05 ± 0.001 0.24 ± 0.04 0.13 ± 0.02 26.50 ± 0.57 12.55 ± 0.04 18.58 ± 2.95
Stepanenko 2.88 0.22 1.45 0.58
Ivashkina 3.87 0.29 1.95 0.78 25.44 15.29 24.72
Safroneeva 1.89 0.14 0.95 0.38
Total 11.39 0.85 ± 0.09 5.72 ± 0.63 2.29 ± 0.24 25.44 ± 0.75 15.29 ± 1.94 24.72 ± 4.34
FIGURE 5 | Principal component analysis of biogeochemical parameter (TN, TOC/TN, TOC and δ13C) and sedimentological parameter (volumetric and mean grain
size, MS) for Uomullyakh Lagoon (left) and Polar Fox Lagoon (right). Main variance in the data is explained by differences in grain size and organic matter content and
composition along the core.
freezing points in the lower core (1880 cm sediment depth and lagoons on the southern Bykovsky Peninsula using mean
deeper) and thus the sediment could have been frozen at the time values for C-budget and C-density of Uomullyakh and Polar
of drilling. In comparison to Uomullyakh, the Polar Fox borehole Fox lagoons. Below UoL, a carbon stock of 0.15 ± 0.01 Mt with a
temperatures were significantly warmer (up to 5.2°C warmer) and carbon density of 24.37 ± 2.09 kg/m3 for the upper 3 m and
significantly exceeded the calculated freezing point in the upper 1.14 ± 0.2 Mt with a carbon density of 18.03 ± 3.12 kg/m3 for
480 cm of sediment above the partially frozen layer. Within Unit 30 m thick deposits was calculated. The upper 3 m of PFL stored
II and III of PFL, the calculated freezing point was very close to 0.05 ± 0.001 Mt organic carbon with a density of 26.50 ±
the observed temperature, suggesting that the system was close to 0.57 kg/m3. The carbon stock amounts to 0.24 ± 0.04 Mt with a
equilibrium. This confirms the observations made in the field on carbon density of 12.55 ± 0.04 kg/m3 for 30 m thick deposits. The
the mostly thawed state of the core. total carbon pool of the thermokarst lagoons on the southern
Bykovsky Peninsula is 5.72 ± 0.63 Mt with an average carbon
Carbon Pool Calculation density of 15.29 ± 1.94 kg/m3 for the upper 30 m (for the upper
The surface areas for the Uomullyakh, Polar Fox, Ivashkina, 3 m: 0.85 ± 0.09 Mt, 25.44 ± 0.75 kg/m3).
Stepanenko, and Safroneeva lagoons were determined with remote
sensing to be 2.10, 0.64, 3.87, 2.88, and 1.89 km2, respectively. The total PCA
thermokarst lagoon area is 11.4 km2. Table 2 presents C-budgets and The first two PCA axes explained 88% of the variation in the data
C-density calculated for the upper 3 m and 30 m of the sediment for the Uomullyakh Lagoon core and 82% for PF Lagoon core
deposited in the Uomullyakh and Polar Fox lagoons. Results were (Figure 5). Though the variance is small, two groups were
extrapolated for the deposits below the other three thermokarst distinguished for both lagoon cores. Shallow depth correlated
Frontiers in Earth Science | www.frontiersin.org 11 July 2021 | Volume 9 | Article 637899Jenrich et al. Thermokarst Lagoons on Bykovsky Peninsula
TABLE 3 | Summary of stratigraphy, geochrononoly, sedimentology, biogeochemistry, facies, temperature, and pore water hydrochemistry deduced from multiproxy
records.
Stratigraphy Properties UoL-core PFL-core
Holocene lagoon deposition Unit Ib 320–120 cm
Age 7.4 cal ka BP (radiocarbon)
Sediment Dark gray clayish silt, fine sand layers → marine deposition
Carbon Low OC content, moderately mineralized
Pore water Lower salinity than UoL-UIa due to brine rejection from
seasonal freezing, high decrease in DOC content
Temperature −3.2°C, frozen due to bedfast ice
Holocene thermokarst lake Unit Ia 820–320 cm Unit I 860–330 cm
deposition Age 10.5 cal ka BP (radiocarbon) No clear radiocarbon data
Sediment Mostly clayish silt (grayish-black), two sandy layers → lake Overall sandy silt (dark grey), plant and shell remains, slightly
deposition and external sediment input layered, two patterns of decreasing grain size → lake
deposition, two phases of lake drainage or expansion
Carbon High OC content, moderately mineralized Increasing OC content and quality with deposition of fine
grained sediment
Pore water Hypersaline, ongoing depletion of stable water isotopes → Brackish to hypersaline conditions → less advanced salt
increasingly heavy isotope signature with increasing depth intrusion than UoL
suggest downward transport
Temperature −3.2°C, unfrozen 0 to −0.6°C, unfrozen
Late Weichelian (MIS 2) fluvial Unit II 1480–820 cm Unit II 1200 cm–860 cm
and Yedoma deposition Age 37 ± 2 ka (OSL) 43 ± 0.6–18.4 ± 0.3 ka cal BP (radiocarbon) 36.1 ka cal BP (radiocarbon)
Sediment Alternating, increasing thickness of silty layers (21–42% Medium to coarse sand with pebbles overlaid by sandy silt
sand) → change in river discharge or orientation (14–56% sand) → change in river orientation or dry up
Carbon Increasing OC content and quality Low OC content, highly degraded
Pore water Hypersaline, depletion of stable water isotopes Brackish conditions
Temperature −3.7 to −4.4°C, unfrozen → high freezing point depression −0.1°C, partly frozen
due to high salinity
(Middle)/Late Pleistocene Unit III 3350–1480 cm Unit III & II 3070–1200 cm
fluvial deposition Age >300 ka (pIRIR) – 63 ± 3 ka (OSL) >360 ka – > 320 ka (pIRIR)
Sediment Alternating coarse and fine grained layers with pebbles More continuous and coarser grained sediment with larger
(51–96% sand) → changing current conditions pebbles (67–96% sand) → fluvial current conditions
Carbon Generally low OC content, highly degraded Very low OC content, highly degraded
Pore water Hypersaline up to core end → was once completely thawed, Fresh water conditions, light isotopic composition in
isotopic composition similar to Tiksi Bay water comparison to UoL-UIII → different water sources of both
lagoons
Temperature Alternating between −4.4 and −5.1°C → still partly unfrozen, Uniform between −0.2 and 0.1°C → sediment completely
refrozen talik from bottom of core up to 2000 cm depth thawed
with fine deposits and high organic matter content and quality, (Table 3). It is very likely that only the top few meters were
while in the deeper core, the variables sand content and δ13C were accumulated since the previous interglacial. Based on
decisive. The main variance in the data was explained by stratigraphically constrained cluster analysis (CONISS) and
differences in grain size and organic matter contents and visual observation, we distinguished four main stages of the
composition along the core. late Quaternary history of the study area. The horizontal axis
of the dendrogram (heights) represents the distance and therefore
dissimilarity between clusters. The CONISS analysis of the 10
DISCUSSION sedimentological and biogeochemical parameters at UoL showed
a greater dissimilarity between clusters as for PFL. That hints to a
Depositional History and Sediment Facies more diverse depositional history for UoL. The cut of the
At both lagoons, we identified four phases of landscape dendrogram at height 7 for UoL (Figure 2) and height 4 for
development based on sedimentological and biogeochemical PFL (Figure 3), divided the cores into three main units, which is
parameters. These are: 1. Middle/Late Pleistocene fluvial supported by the results of the PCA (Figure 5).
deposition, 2. Late Weichelian (MIS 2) Yedoma deposition, 3. Radiocarbon ages out of stratigraphic order due to reworking
Holocene thermokarst lake formation and 4. Holocene lagoon of sediment as part of thawing and re-freezing processes are
formation. common for sedimentary deposits in thermokarst landscapes
The grain size distribution of sediments beneath Uomullyakh (Wetterich et al., 2009; Biskaborn et al., 2013; Schirrmeister
Lagoon and Polar Fox Lagoon indicates a changing depositional et al., 2017, 2018; Jongejans et al., 2018). In the case of UoL,
environment over time. In both lagoons, the sediments represent radiocarbon age reversals occur in Unit II (11–17 m) and Unit III
accumulation over the last glacial and interglacial cycles (below 17 m). Possible reasons for unexpected high radiocarbon
Frontiers in Earth Science | www.frontiersin.org 12 July 2021 | Volume 9 | Article 637899Jenrich et al. Thermokarst Lagoons on Bykovsky Peninsula
concentrations include processes associated with the melt of Unfortunately, the quartz luminescence signals from the
large ice wedges and subsequent mixing, which transport bottom Uomullyakh Lagoon sample, and both samples from
younger material into older layers. Also, possible the Polar Fox Lagoon, are saturated, and so all give minimum
contamination by younger material during the drilling quartz age estimates of >100 ka. Interestingly, the feldspar pIRIR
process and sample preparation have a larger effect when signals are also saturated, and since the dose range of the feldspar
sample TOC contents are very low and available material is signal is considerably larger than that for the quartz OSL signal,
limited and can lead to dating bias (Oswald et al., 2005; Vyse the implied minimum age is > 300 ka. At least for the two lagoons
et al., 2020). Unit II is characterized by thawed Yedoma Ice located in a similar morphological setting and with similar
Complex deposits (see chapter 5.1.2). Existing intact Yedoma sedimentology (see below) it is reasonable to assume that the
deposits, in north-east Siberian Arctic lowlands consist of bleaching history of the sediment entering the two water bodies is
massive syngenetic ice wedges several tens meters in height also similar. Luminescence dating from the adjoining Goltsovoye
(Schirrmeister et al., 2002, 2011, 2013; Wetterich et al., 2014; Lake supports this assumption (Supplementary Table S4). The
Strauss et al., 2017; Möller et al., 2019; Fuchs et al., 2020). quartz and feldspar signals of the bottom sample (fluvial deposits
On the Bykovsky Peninsula only 10 km northeast of the at 3513 cm depth) are also saturated and in the same age range as
lagoons, the Mamontovy Khayata Yedoma exposure is an for UoL and PFL (quartz age: >90 ka, feldspar age: >280 ka). The
example with syngenetic ice wedges up to 40 m high and implication of the broad agreement between the pIRIR and OSL
5–6 m wide (Schirrmeister et al., 2002). Likely, the same signals in the top two Uomullyakh samples is that both were well
deposits were present at our drilling sites before thermokarst bleached before deposition. If we extrapolate this observation to
degradation. To estimate total thaw subsidence for the sites the bottom-most Uomullyakh sample and the two Polar Fox
we measured the elevation difference of lagoon bottoms and samples, we may assume that the pIRIR minimum ages should
the surrounding Yedoma upland based on height information also be reliable, and since they are the most constraining, they are
of the ArcticDEM (Porter et al., 2018). The results suggest used in further discussion.
that Holocene permafrost degradation subsided the Yedoma
surface by up to 25 m for UoL and 27 m for PFL, potentially Middle/Late Pleistocene Fluvial Deposition – UoL-UIII
causing mass flux of sediment and its organic carbon. At (3350–1480 cm) and PFL-UIII + II (3070–1460 cm)
many locations across the landscape, large ice wedges thawed The first phase of landscape history at the study area is mainly
and the surface subsided, leaving ice wedge casts and water characterized by fluvial deposits. Under the Polar Fox Lagoon,
bodies, both of which infilled with local sediment. Where young they range in age from >360 to >320 ka (pIRIR) and include the
near-surface organic matter slumped, and mixed into lower, units PFL-UIII and the lower part of PFL-UII (in total 1590 cm).
older layers, age inversions as seen at UoL would have been Below Uomullakh Lagoon, these deposits (Uol-UIII) have an age
created. between >300 ka (pIRIR) to 63 ± 2 ka (OSL). This long time
Though sediment mixing in such thaw-affected aquatic period is represented by only about 9 m of sediment, indicating
environments challenges chronological interpretation, an overall low accumulation rate under a dynamic fluvial regime
comparison with deposits at other sites on the peninsula are with frequently alternating phases of accumulation and erosion in
consistent with our interpretation of the landscape development. Unit III.
In general, the radiocarbon age ranges of both cores correspond The presence of coarse sediments, rounded gravel and pebbles
to previous dating from Yedoma sequences of Mamontovy up to 2 cm, as well as driftwood indicates fluvial transportation
Khayata (58.4–12 ka BP), about 10 km northeast (Schirrmeister and deposition (Supplementary Figure S4). Several studies also
et al., 2002), of Cape Razdelny (core 103/81: 40.8–21.63 ka BP) found fluvial sediments in similar depth underneath the
about 10 km southwest (Slagoda, 1993; Grosse et al., 2016) and of neighboring Ivashkina Lagoon (Romankevich et al., 2017;
the Goltsovoye Lake (47.5–21.39 cal ka BP) less than 500 m north Schirrmeister et al., 2018) and underlying Yedoma deposits on
(Jongejans et al., 2020). Furthermore, the luminescence dating at the Bykovsky Peninsula (Slagoda 1993; Slagoda, 2004; Siegert
1107 cm and 2106 cm depth is consistent with the corresponding et al., 2002; Grosse et al., 2007; Jongejans et al., 2020). Kunitsky
radiocarbon ages, showing an overall chronological succession. (1989) and Wetterich et al. (2008) assumed that the paleo-Lena
This sequence comprises Pleistocene ages in deep fluvial deposits, River crossed the present Bykovsky Peninsula in an early
followed by late Weichelian ages in overlying Yedoma deposits. Weichselian period (MIS 4 and maybe older). Our
Therefore, the age range for the upper sections (UII, UI) appear luminescence ages suggest that river transport existed over a
reasonable. We correlate stratigraphic units between cores to long period from >360 ka (pIRIR) to 63 ± 2 ka (OSL).
assign the late Pleistocene ages of UoL-UII to the upper part of While in UoL-UIII, discontinuous grain sizes, very poor
PFL-UII. sorting and higher organic matter content reflect frequently
For deeper layers, especially Unit III of both cores, the results varying water runoff in a shallow river branch or near-shore
of the luminescence dating were used. The dose recovery ratios area, PFL-UIII is distinguished by very little organic material,
are satisfactory, and the comparison with the more-difficult-to- more continuous and coarser grain sizes, and a higher degree of
bleach feldspar IR50 and post-IRIR signals indicates that it is very sorting. Such properties reflect stable fluvial current conditions
likely that the quartz was well bleached at deposition (see (Wetterich et al., 2008). This could suggest that UoL core was
Supplementary Material Chapter 1.3 for a more detailed located in the near-shore area and PFL core closer to the center of
technical discussion of these issues). a paleo river. However, the large distance between both cores
Frontiers in Earth Science | www.frontiersin.org 13 July 2021 | Volume 9 | Article 637899You can also read