Histopathological Investigation of the Stomach of Rats Fed a 60% Genetically Modified Corn Diet
←
→
Page content transcription
If your browser does not render page correctly, please read the page content below
Food and Nutrition Sciences, 2018, 9, 763-796
                                                                                                  http://www.scirp.org/journal/fns
                                                                                                             ISSN Online: 2157-9458
                                                                                                               ISSN Print: 2157-944X

Histopathological Investigation of the
Stomach of Rats Fed a 60% Genetically
Modified Corn Diet

Irena M. Zdziarski1*, Judy A. Carman2,3, John W. Edwards3
1
 Discipline of Anatomy and Pathology, School of Medicine, University of Adelaide, Australia
2
 The Institute of Health and Environmental Research (IHER), Kensington Park, Australia
3
 Health and Environment, College of Science and Engineering, Flinders University, Bedford Park, Australia

How to cite this paper: Zdziarski, I.M.,        Abstract
Carman, J.A. and Edwards, J.W. (2018)
Histopathological Investigation of the Sto-     Genetic modification (GM) represents new opportunities for enhanced crop
mach of Rats Fed a 60% Genetically Mod-         features such as improved insect resistance and herbicide tolerance. The
ified Corn Diet. Food and Nutrition             technology allows for cross-species alterations, therefore potentially allowing a
Sciences, 9, 763-796.
                                                vast array of novel traits. Many GM crops have been developed and approved
https://doi.org/10.4236/fns.2018.96058
                                                for human and animal consumption. The present study investigated a
Received: April 28, 2018                        triple-stacked GM corn variety containing modifications for insect resistance
Accepted: June 26, 2018                         (via cry1Ab and cry3Bb1 genes) and herbicide tolerance (via an EPSPS gene),
Published: June 29, 2018                        which was fed to rats for six months. The study investigated the mucosa of the
Copyright © 2018 by authors and
                                                stomach. Alterations to tight junction apposition, gland dilatations with epi-
Scientific Research Publishing Inc.             thelial elongation and dysplasia in the GM-fed rats were observed. These re-
This work is licensed under the Creative        sults indicate that GM-corn may have an effect on rat stomach mucosa, which
Commons Attribution International               may have health implications.
License (CC BY 4.0).
http://creativecommons.org/licenses/by/4.0/
                                                Keywords
                Open Access
                                                Genetically Modified Corn, Rat Feeding Study, Long-Term Feeding Study,
                                                Histopathology, Stomach

                                              1. Introduction
                                              Genetically modified (GM; transgenic) crops have been grown for human and
                                              animal consumption since the 1990’s [1]. Most currently-grown crops have been
                                              developed through the transfer and incorporation of a gene cassette into the
                                              plants. This cassette contains inter alia plant, bacterial and/or viral genes [2] [3].
                                              In this way, traits have been generated that would not otherwise be achievable
                                              via conventional plant breeding, including cross-species alterations. The gene

DOI: 10.4236/fns.2018.96058        Jun. 29, 2018                   763                                   Food and Nutrition Sciences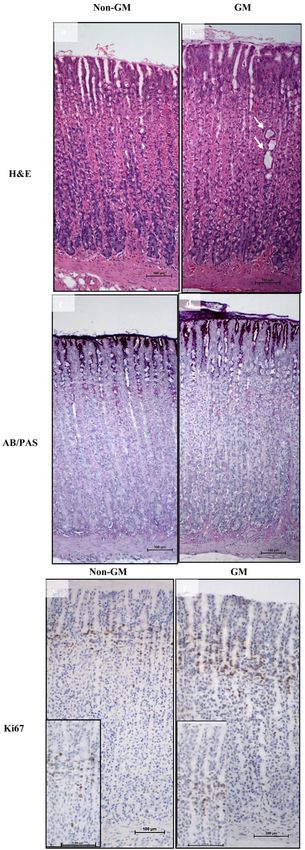
I. M. Zdziarski et al.

                              cassette contains the desired traits as well as other DNA needed for successful
                              transformation and identification of the transformed crop. The two most com-
                              mon traits thus produced are insect resistance and herbicide tolerance [2].
                              “Stacked” crops, which contain more than one trait, are becoming more preva-
                              lent [4]. In the United States of America in 2016, 76% of the cultivated corn con-
                              sisted of stacked GM varieties [5].
                                Food regulators, such as Food Standards Australia New Zealand (FSANZ),
                              have assessed numerous GM crops and concluded that they were substantially
                              equivalent to non-GM varieties, unless they were designed to be substantially
                              different, such as a GM plant that was designed to have a different fatty acid pro-
                              file [6] [7]. Animal feeding studies are often not performed or required [6] [7].
                              In addition, in many countries, crops containing several stacked genes are not
                              required to be safety assessed if all the genes in the stack have previously been
                              individually approved for use in the same kind of plant [8] [9]. In the European
                              Union recently, new legislative requirements have been put in place that require
                              additional safety assessments, which include mandatory rat feeding trials [10].
                              However, this is not retrospective and only applies to newly developed crops.
                                In contrast, numerous detailed and systematic investigations are required
                              prior to the approval of a new pharmaceutical drug. In particular, investigations
                              evaluate the safety of each component of the drug and the combined effect of
                              these components.
                                Thus far, few comprehensive investigations of the effect of GM crops on ani-
                              mal or human health have been published [11] [12] [13]. Furthermore, many of
                              these studies measured animal production outcomes in farmed animals that are
                              not physiologically comparable to humans and the measured variables were li-
                              mited to those such as body weight, meat yield or milk production [14] [15] [16]
                              [17]. These do not adequately reflect human or animal health outcomes [14].
                                Longer-term toxicological studies investigating histopathological effects of
                              GM crop consumption in animals that are physiologically similar to humans are
                              scarce [11] [12] [14]. We recently published a review of histopathological studies
                              investigating the digestive tract of rats fed a GM diet for 90 days or longer [13].
                              The purpose of the literature review was to examine the relationship between
                              GM crops and histopathological observations in rats, since the rat model is the
                              accepted OECD standard for toxicological studies of this type [18]. A considera-
                              tion of the digestive tract was deemed important since it is the first site of con-
                              tact for any ingested compound, and hence the first site of possible toxicological
                              or pathological changes that may arise due to a GM diet. The search was limited
                              to long-term rat feeding studies of no less than 90 days duration and crops pos-
                              sessing one or more of three specific traits which are commonly found in com-
                              mercialised GM crops: herbicide tolerance via an EPSPS gene, and insect resis-
                              tance via cry1Ab or cry3Bb1 genes [13]. Our study revealed that only 19% of the
                              GM crops, known to possess at least one of the traits of interest, had been inves-
                              tigated via long-term feeding trials. No published rat-feeding studies could be

DOI: 10.4236/fns.2018.96058                        764                                 Food and Nutrition Sciences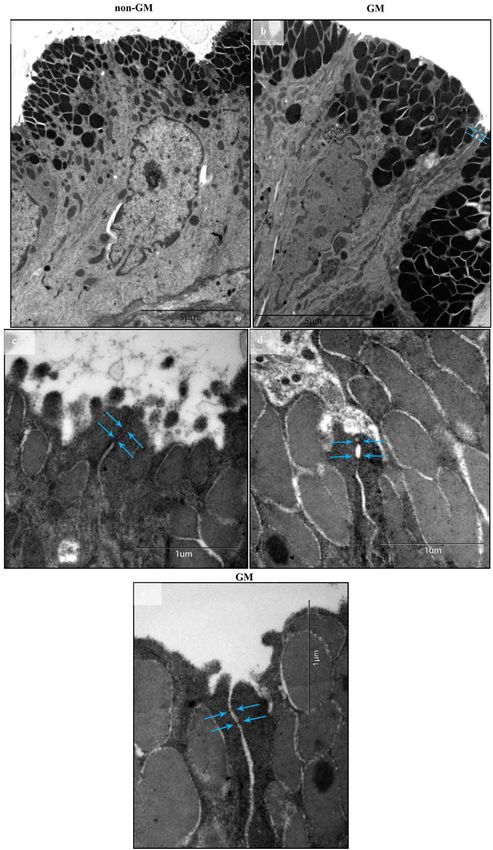
I. M. Zdziarski et al.

                              found for the remaining 81% of approved crops. Of all the published studies
                              found, only 57% performed an overall general health assessment of the
                              long-term effect of GM feed on rat health. However, these studies lacked defined
                              criteria for outcomes that would be considered toxicologically or pathologically
                              significant, and more importantly, they lacked transparency in their methods
                              and their results obtained. These omissions make it difficult to compare studies,
                              to perform further research, and to determine the safety of GM crops.
                                Furthermore, the previously published papers rarely utilised anything other
                              than the regular haematoxylin and eosin (H&E) staining. Haematoxylin and eo-
                              sin is a general stain that stains nucleic acids a deep blue-purple colour and
                              non-specifically stains proteins a pink colour. Therefore, it is commonly used for
                              identifying tissue structure and hence can help identify whether the tissue has
                              become morphologically abnormal [19]. There are, however, other stains that
                              can identify specific structures or cell properties, such as collagen (Masson’s
                              trichrome or picrosirius red) and mucins and glycogen (alcian blue and periodic
                              acid Schiff; AB/PAS). These can help quantitate the structural, physiological and
                              possible pathological properties of the tissue, such as an increase in collagen fi-
                              bres (which often follows mucosal injury) or the presence of intestinal-like cells
                              in the stomach (indicative of intestinal metaplasia). There are also more specific
                              histological methods, such as immunohistochemistry that use antibodies for
                              specific markers of change, for example apoptosis (caspase 3 antibody) or cell
                              division/proliferation (Ki67 antibody). Electron microscopy is yet another spe-
                              cific histological method that provides even more detailed morphological data at
                              an ultrastructural level. In other fields of study, at least one of these methods is
                              utilised to assess mammalian health [20] [21] [22] [23].
                                In 2013, our group published a long-term toxicology feeding study on pigs fed
                              a mixed diet of GM soy and GM corn containing three common traits via the
                              EPSPS gene, and cry1Ab or cry3Bb1 genes [24]. The authors reported that the
                              GM diet caused an increase in severe stomach inflammation, measured as sur-
                              face redness and swelling that was 2.2 times higher in female pigs and 4.0 times
                              higher in male pigs on the GM diet compared with pigs on the control diet. The
                              authors suggested that the inflammation may be due to the presence of the two
                              insecticidal proteins, Cry3Bb1 and Cry1Ab in the diet. In the insect gut, these
                              proteins are suggested to act on the gut according to two models. In the signal
                              transduction model, the toxin binds to cadherin (a cell membrane protein) [25],
                              which induces a cascade of events resulting in cell death [26] [27]. In the
                              pore-forming model, the toxin binds to cadherin, which initiates oligomerista-
                              tion and subsequent pore-formation in the apical membrane of the gut epithe-
                              lium [25] [28]. While it has been suggested that these proteins cannot harm the
                              gut of mammals because mammals lack the necessary gut environment and spe-
                              cific receptors [29], several studies indicate that this may not be the case. One in
                              vitro study found Cry proteins binding to the apical surface of mouse small in-
                              testine epithelial cells, as well as hyperpolarisation of the intestine, which is con-

DOI: 10.4236/fns.2018.96058                        765                                   Food and Nutrition Sciences
I. M. Zdziarski et al.
sistent with the pore-forming action of the Cry proteins [30]. Another study
found ultrastructural changes to enterocytes and hyperplasia in the ileum of
mice fed for two weeks on a diet containing a Cry protein-producing GM potato
or a non-GM potato diet which had the Cry protein added [31].
The present study aimed to investigate the effects of a triple-stacked GM corn
variety on the rat digestive tract. The GM corn contained modifications for her-
bicide tolerance via the EPSPS gene, and insect resistance via cry1Ab or cry3Bb,
the same genes investigated in our earlier pig toxicology study. Rats were chosen,
since they are the standard model for this kind of research [18] and their organs
are of a particularly suitable size for microscopic morphometric analyses. Male
rats were investigated, since this gender exhibited higher levels of stomach in-
flammation in pigs. We further ensured that our assessment contained wide-
ly-accepted criteria and reproducible materials and methods, which included a
range of microscopic and morphometric methods, in order to look for signs in-
dicating a pathological change. In particular, the presence of proliferation and
apoptosis in the mucosal tissue were investigated using antibodies for Ki67 and
active caspase 3 respectively. We did not, however, investigate neoplastic or
vascular changes.
The FAO/WHO recommend that long-term feeding studies be a minimum 90
days duration [6]. We doubled the minimum time, so as to better assess the ef-
fect of the long-term consumption of a GM crop on the gastrointestinal tract of
the rat. The FAO/WHO further recommend that animal feeding studies investi-
gating GM crop consumption should investigate the effects at a range of dose
levels. The highest dose is the maximum achievable dose that would not cause
nutritional imbalance in the test animal, and the lowest dose is the dose that
closely resembles the anticipated human intake [6]. We used the maximum
achievable dose of corn for semi-purified diets, which is 60% according to the
feed manufacturer.
2. Materials and Methods
All procedures were performed under ethics approval (project no. 646/07) from
the Animal Welfare Committee of Flinders University, South Australia. All ani-
mal work was performed in accordance with the South Australian Prevention of
Cruelty to Animals Act (1985) and with the Australian Code of Practice for the
Care and Use of Animals for Scientific Purposes (2004). All animal husbandry,
necropsy, and histopathological assessments were performed under blinded
conditions.
2.1. Diet
The triple-stacked GM corn variety, containing the MON863, MON810 and
NK603 genes, was obtained from a farmer who had grown it in the United States
(US).
It was not possible to obtain an isogenic or near-isogenic variety to use in a
DOI: 10.4236/fns.2018.96058 766 Food and Nutrition SciencesI. M. Zdziarski et al.
control corn diet. An isogenic variety is the specific parental (non-GM) corn va-
riety that is transformed to make the GM variety. As the GM corn used was
made by conventionally crossing several GM varieties, there is no isogenic or
parental non-GM variety available. Consequently, the control diet contained a
commercially-grown non-GM corn grown in Australia. The corn was not
sourced from the US due to the difficulties in finding a non-GM corn variety
from that country that would be completely uncontaminated, as our previous
study has shown [24]. In contrast, Australia does not grow any GM corn, either
commercially or in field trials [2] [4] [32], which should guarantee that the
non-GM diet contained no GM material.
The GM parental lines as well as the triple-stacked GM corn used in this study
have been determined to be compositionally equivalent to non-GM corn varie-
ties by various government regulators [16] [33] [34] [35] [36] [37]. Therefore,
according to these government regulators, there should be no phenotypical vari-
ation between the GM and non-GM varieties used that could influence the out-
comes measured in this study [35].
The two diets, containing either GM or non-GM corn at 60% of the diet, were
semi-purified diets, formulated by Specialty Feeds (Glen Forrest, Australia) to
meet the nutritional requirements for the growth and well-being of rats (i.e.
comparable with the standard rat diet, AIN-93G Growth Purified Diet) (Table
1). Other than the GM/non-GM nature of the corn, all other aspects of the diet
were the same between the two diets.
2.2. Animal Feeding and Necropsy
Twenty unweaned, male, outbred Sprague Dawley rats weighing 50 g ± 15 g
were obtained at 3 weeks of age and were weaned onto the non-GM control diet.
After a week, they were randomly placed into one of two groups, GM-fed (n =
10) and non-GM-fed (n = 10). Rats had ad libitum access to water and feed.
Animal rooms were maintained at 21˚C ± 2˚C temperature, 40% - 60% humidity
and a 12 h light/dark cycle. Rats were monitored daily and weighed weekly. After
26 weeks, rats were weighed, anaesthetised with isoflurane and euthanized via
the removal of the heart. The stomach was removed immediately post-mortem
by a certified veterinarian, an incision was made along the greater curvature, the
stomach contents were removed, and the inner surface was flushed with phos-
phate buffered saline (PBS). The stomachs were then weighed. One half was
fixed in 10% buffered formalin (pH 7.4) for 12 - 18 h (overnight) and routinely
processed for light microscopy. From the other half, 1 mm by 1mm sections of
the fundus wall were fixed in a solution containing 2% glutaraldehyde, 3% para-
formaldehyde in 0.1 M phosphate buffer (pH 7.4), and processed for electron
microscopy.
2.3. Light Microscopy
Fixed samples were processed, and embedded in paraffin wax. Sections (5 - 6 μm
DOI: 10.4236/fns.2018.96058 767 Food and Nutrition SciencesI. M. Zdziarski et al.
Table 1. Diet specifications as determined by specialty feeds (glen forrest, Australia),
comparable with the standard rat diet, AIN-93G growth purified diet.
Calculated Nutritional Parameters
Protein 18%
Total fat 6.0%
Crude fibre 6.1%
Acid detergent fibre 6.1
Digestible energy 15.0 MJ/kg
Ingredients
Casein (acid) 132 g/kg
Ground maize 600 g/kg
Canola oil 40 g/kg
DL methionine 3.0 g/kg
Wheat starch 140 g/kg
Cellulose 50 g/kg
Calcium carbonate 13 g/kg
Sodium chloride 2.6 g/kg
Potassium citrate 2.5 g/kg
Potassium dihydrogen phosphate 2.8 g/kg
Potassium sulphate 0.4 g/kg
AIN93G trace minerals 1.4 g/kg
Choline chloride (65%) 2.5 g/kg
AIN93G vitamins 10 g/kg
Calculated Amino Acids
Valine 1.1%
Leucine 1.8%
Isoleucine 0.7%
Threonine 0.7%
Methonine 0.7%
Cystine 0.2%
Lysine 1.1%
Phenylalanine 0.9%
Tyrosine 0.9%
Tryptophan 0.2%
Calculated Total Minerals
Calcium 0.46%
Phosphorous 0.33%
Magnesium 0.20%
Sodium 0.11%
Chloride 0.17%
Potassium 0.35%
Sulphur 0.2%
DOI: 10.4236/fns.2018.96058 768 Food and Nutrition SciencesI. M. Zdziarski et al.
Continued
Iron 100 mg/kg
Copper 10 mg/kg
Iodine 0.22 mg/kg
Manganese 20 mg/kg
Zinc 43 mg/kg
Selenium 0.25 mg/kg
Chromium 2.0 mg/kg
Lithium 0.1 mg/kg
Boron 0.7 mg/kg
Nickel 0.55 mg/kg
Vanadium 0.10 mg/kg
Calculated Total Vitamins
Vitamin A (Retinol) 8000 IU/kg
Vitamin D3 (Cholecalciferol) 1000 IU/kg
Vitamin E (Tocopherol acetate) 90 mg/kg
Vitamin K (Menadione) 1 mg/kg
Vitamin B1 (Thiamine) 8 mg/kg
Vitamin B2 (Riboflavin) 7 mg/kg
Niacin (Nicotinic acid) 43 mg/kg
Vitamin B6 (Pyridoxine) 11 mg/kg
Pantothenic acid 20 mg/kg
Biotin 240 μg/kg
Folic acid 2 mg/kg
Vitamin B12 (Cyanocobalamin) 100 mg/kg
Choline 2000 mg/kg
Calculated Fat Composition
Myristic acid 14:0 trace
Palmitic acid 16:0 0.4%
Stearic acid 18:0 0.1%
Palmitoleic acid 16:1 trace
Oleic acid 18:1 2.7%
Gadoleic acid 20:1 trace
Linoleic acid 18:2 n6 2.0%
α Linoleic acid 18:3 n3 0.6%
thick) were cut using a rotary microtome and mounted on glass slides with two
sections per slide. A second section of the stomach was taken at a minimum
depth of 300 μm from the first and mounted on a separate slide in order to ob-
tain a greater field of study. Slides were routinely stained with H&E and with
combined AB/PAS (pH 2.5). Sections were viewed under a light microscope and
morphometric analyses were performed using NIS-Elements BR (Nikon) soft-
DOI: 10.4236/fns.2018.96058 769 Food and Nutrition SciencesI. M. Zdziarski et al.
ware. A general assessment of the gastric mucosa was performed using the Up-
dated Sydney System (USS) [38]. When this System is applied to rats, it assesses
the degree of inflammation, gland or pit atrophy or hyperplasia, and the pres-
ence/degree of intestinal metaplasia. All observations and analyses were per-
formed under blinded conditions.
In the non-glandular stomach, the thickness of the keratinized and
non-keratinized epithelial layers was measured in areas of thinnest mucosal
thickness. In the glandular stomach (fundic region), the pit and gland depth and
mucosa thickness were obtained in at least 20 well-orientated areas. Granular
leukocytes (GL) were counted in the lamina propria below the gastric glands.
This was performed in areas where the muscularis mucosae and the base of the
mucosal glands were well defined. The procedure was as follows: Using
NIS-Elements BR (Nikon) software and a light microscope with a 20x objective
lens, an area of interest was outlined and the area recorded. Granular leukocytes,
found in the marked area, were counted and a percentage of GL per area was
obtained. Granular leukocytes were defined as those containing a bright pink
cytoplasm and a multi-lobed nucleus. This procedure was repeated randomly
along the length of the stomach. The total area measured per rat was an average
of 0.16 mm2.
2.4. Immunohistochemistry
Caspase 3 and Ki67
Caspase 3 is a cysteine protease primarily present in the cytoplasm and nucleus
of cells in the terminal effector phases of apoptosis [39]. Apoptosis is physiolog-
ical cell death, commonly termed as “programmed cell death”, that naturally
occurs during tissue remodelling, to maintain tissue homeostasis, to remove se-
nescent cells, and to delete cells with genetic damage [40] [41]. In the present
study, the antibody used to label caspase 3 was of the active form. In the stomach
section, using the peroxidase method, apoptotic cells appear brown, while
non-apoptotic cells appear clear with a blue nucleus.
Ki67 is a nuclear protein that is present throughout the active cell cycle of
proliferating cells (late G1, S, G2, and M phases), but is absent in quiescent (G0)
cells [42] [43]. Therefore, in the stomach section, using the peroxidase method,
nuclei of proliferative cells appears brown, while nuclei of non-proliferative cells
appear blue.
Sections were cut at 4 µm, mounted on DAKO slides and dried overnight at
30˚C. Slides were deparaffinised in histolene and rehydrated in graded ethanol
solutions to distilled water. Antigen retrieval was performed using high pH an-
tigen retrieval solution (DAKO) and set on a 20 min cycle at 100˚C (DAKO PT
Link). Using an automated cycle (DAKO Autostainer Plus), sections were first
quenched with 3% hydrogen peroxide (FLEX peroxidase blocker, DAKO) for 5
min and then immersed in Protein Block (DAKO) for 30 min, followed by a 60
min incubation in primary antibody, active caspase 3 (1:1000 dilution, abcam
ab4051) or Ki67 (1:1000 dilution, abcam ab16667). Sections were then labelled
DOI: 10.4236/fns.2018.96058 770 Food and Nutrition SciencesI. M. Zdziarski et al.
with anti-rabbit horseradish peroxidase (HRP) (30 min, DAKO) and developed
with 3,3-diaminobenzidine (DAB; DAKO) for 10 min, washed with distilled wa-
ter, manually counterstained with Harris haematoxylin (10 sec), blued in am-
monia solution (1 min), dehydrated in a graded series of ethanol and histolene,
and cover slipped with DPEX mounting medium.
In the stomach (fundus), cell counts were performed in well-orientated areas,
3 mm from the glandular/non-glandular stomach junction, and 100 μm from the
fundus/pylorus junction [44]. Using NIS-Elements BR (Nikon) software, a 100 -
300 μm-wide area was outlined perpendicular to the mucosa and comprising the
entire thickness of the mucosa. Within this area, all labelled and unlabelled epi-
thelial cells/nuclei were counted [44] [45]. This procedure was repeated one to
four times per rat. The results were expressed as the ratio of caspase 3- or
Ki67-labelled cells/nuclei to the total number of cells/nuclei counted [45] [46].
2.5. Electron Microscopy
Fixed sections of glandular stomach were secondarily fixed in 1% osmium te-
troxide, routinely processed for transmission electron microscopy (TEM) and
embedded in epoxy resin. Thin sections (70 - 90 nm) were cut with an ul-
tra-microtome, mounted on Cu/Pd grids and assessed for morphological
changes using a Phillips CM100 Transmission Electron Microscope.
Tight junction integrity between epithelial cells lining the surface of gastric
pits was assessed using the grading system reported by reference [47]. Tight
junctions were examined at a final magnification of 43,000. A tight junction was
assessed as either: open, closed, or cut obliquely. The latter were not counted
because the poor orientation of the section would have resulted in inaccurate
counts. A tight junction was considered closed if there was no gap between op-
posing cells at the luminal end and no gap between opposing leaflets of the tight
junction [47]. Tight junctions were assessed between well-orientated cells cut in
cross-section, which means the cells’ luminal surface had to be clearly defined
and their basal surface had to be sitting on a basement membrane. This pre-
vented false positive identification of tight junction poor apposition. A mini-
mum of 20 junctions were assessed per rat.
2.6. Severity Score
Observations or results that could be deemed adverse, irrespective of whether
they appeared in the GM-fed or non-GM-fed rat, such as poor tight junction
apposition or alterations to the staining properties of the epithelium, were tabu-
lated and added to give each rat a severity score.
2.7. Statistical Analysis
All statistical analyses were performed in accordance with the OECD Environ-
ment Directive on working with chemicals, pesticides and biotechnology [48].
Statistical analyses of continuous data were conducted using SPSS version 20
and 22. The results were averaged for each rat and then the results for all rats in
DOI: 10.4236/fns.2018.96058 771 Food and Nutrition SciencesI. M. Zdziarski et al.
the same dietary group were tested for normal distribution using the Shapi-
ro-Wilk test. If data for both groups were normally distributed, a t-test was per-
formed. Additionally, Levene’s test for equality of variances was performed and
the appropriate p value for the t-test was reported. If data for both groups were
not normally distributed, a Mann Whitney U test was used. A 2-tailed test was
used, unless otherwise stated and p < 0.050 was considered significant. In the
data set, while SPSS occasionally found outliers, none were extreme, thus no
outliers were removed.
Statistical analyses of categorical data were conducted using Epi Info™ version
7 (developed by the US Centres for Disease Control and Prevention). Results
were reported as a relative risk (also known as a risk ratio; RR) and associated
95% confidence interval. Fisher’s Exact p value was reported since sample sizes
were generally low and the expected numbers in the tables’ cells were often less
than five. A p < 0.050 was considered significant.
3. Results
3.1. Animal Feeding
After randomisation, there was no difference between the body weights of the
GM-fed and non-GM-fed groups. Over the next few weeks, it was noticed that
the dietary intake of both groups of rats was not as high as expected and that the
GM-fed rats were eating less than the non-GM-fed rats. Neither group of rats
lost weight. The diet manufacturer suggested that the moisture content of the
diets should be increased. The diets were therefore sent for repelleting, starting
with the GM diet, because they were the group with the lowest dietary intake.
The provision of moister diets resulted in a typical weight gain [49] for the re-
mainder of the study. Because the GM-fed rats were fed those diets a few weeks
before non-GM-fed rats, they weighed more at the end of the study compared to
non-GM-fed rats. Consequently, no conclusions can be drawn about the effect of
the GM diet on body weight. Furthermore, because larger animals could be ex-
pected to have larger stomachs, the stomach weight was expressed as a propor-
tion of body weight. The mean stomach weight to body weight ratio (and inter-
quartile range) were 0.46 (0.44 - 0.50) and 0.43 (0.40 - 0.49) for non-GM and
GM-fed rats respectively. The difference was not statistically significant.
Of importance, the total dietary intake over the course of the experiment in-
dicates that the study has become more conservative in its findings, that is, any
effects of the GM diet on the stomachs of rats has been underestimated. This is
clarified in the discussion.
3.2. Light Microscopy
3.2.1. Non-Glandular Stomach
One non-GM-fed animal had a grossly enlarged squamous cell cyst. No other
abnormal changes were observed in either the GM-fed or non-GM-fed groups.
Mucosal thickness measurements revealed no differences between the groups
(Table 2).
DOI: 10.4236/fns.2018.96058 772 Food and Nutrition SciencesI. M. Zdziarski et al.
Table 2. Morphometric analyses and cell counts from the stomach mucosa of rats fed a 60% GM or non-GM corn diet.
GM Non-GM Statistical
Percentage
Mean or Mean or Significance
SD or IQRa n SD or IQRa n Change (%)b
mediana mediana (p < 0.050)
Non-Glandular Stomach
Average mucosal thickness (µm) 57.41 6.15 5 59.80 8.90 5 NS −4.00
Average thickness of
8.13 7.40 - 8.23 5 8.53 7.65 - 8.75 5 NS −4.69
keratinized layer (µm)
% keratinized layer/mucosal
13.83 13.47 - 14.85 5 13.79 12.23 - 15.12 5 NS 0.29
thickness
Average thickness of
48.41 3.62 5 51.57 7.90 5 NS −6.13
non-keratinized layer (µm)
% non-keratinized
86.17 85.15 - 86.53 5 86.71 84.88 - 87.77 5 NS −0.62
layer/mucosal thickness
Glandular Stomach - Fundus
Average mucosal thickness (µm) 762.01 80.41 10 737.37 100.28 10 NS 3.34
Average pit depth (µm) 99.03 12.51 10 93.47 12.20 10 NS 5.95
% pit depth/mucosal thickness 13.13 2.14 10 12.94 2.82 10 NS 1.47
Average gland depth (µm) 622.18 76.95 10 609.32 95.30 10 NS 2.11
% gland depth/mucosal thickness 81.55 2.99 10 82.42 2.68 10 NS −1.06
Average pit + gland depth (µm) 721.20 75.54 10 702.79 93.22 10 NS 2.62
% pit + gland depth/mucosal
95.50 94.58 - 95.90 10 95.38 94.75 - 96.45 10 NS 0.13
thickness
Average thickness of lamina
40.81 16.70 10 34.58 11.40 10 NS 18.02
propria below glands (µm)
% lamina propria thickness below
4.50 4.10 - 5.42 10 4.62 3.55 - 5.25 10 NS −2.60
gland/mucosal thickness
% granular leukocyte
count/lamina 0.11 0.05 10 0.16 0.10 10 NS −31.25
propria area below gland
Gland dilatation severity score 2.50 0.00 - 3.00 10 0.00 0.00 - 1.00 10 NS Undefined
a
For non-normally distributed data, the median and interquartile range (IQR) are given. SD = standard deviation. The effect of the GM diet compared with
b
the non-GM diet as a Percentage Change. The means were compared, unless one or both variables were not normally distributed, when the medians were
compared. A negative sign before the number indicates that the GM diet decreased the variable. No sign indicates that the GM diet increased the value of the
variable.
3.2.2. Glandular Stomach
Morphometric analyses showed increases in mucosal thickness, and pit and
gland depth in the GM-fed compared with the non-GM-fed group. However,
these results were not statistically significant (Table 2; Figure 1). Mononuclear
inflammatory cells were rarely seen in the pit and glandular region of the muco-
sa. In most animals of both groups, granular leukocyte infiltration was mild as
defined by the USS [38] and was primarily located in the lamina propria of the
deep glandular region (Figure 2). In two non-GM-fed animals, the infiltration
was moderate according to USS. Furthermore, a count of granularleukocytes in
DOI: 10.4236/fns.2018.96058 773 Food and Nutrition SciencesI. M. Zdziarski et al.
Figure 1. Sections of the stomach (fundus) of rats fed a 60% GM or non-GM corn diet.
H&E stained sections of the stomach mucosa of: (a) a non-GM-fed rat, and (b) a GM-fed
rat. The section from the GM-fed animal clearly shows a thicker mucosa (not statistically
significant), as well as a gland dilatation lined with elongated epithelial cells (arrows) (p =
0.011). There does not appear to be any increase in connective tissue fibres in either of the
sections. AB/PAS stained sections of the stomach mucosa of: (c) a non-GM rat, and (d) a
GM-fed rat. The mucus-producing cells in the gastric pits stain dark purple indicative of
their neutral mucins. The glands of both sections appear to be uniformly stained. The
section from the GM-fed rat shows deeper pits and glands than the non-GM-fed rat (not
statistically significant). Nuclei of proliferating cells labelled with Ki67 antibody as seen in
the sections of the stomach mucosa of: (e) a non-GM rat, and (f) a GM-fed rat. Insets
show the pit and neck regions at higher magnification. Labelling is primarily seen in the
nuclei of epithelial cells of the neck region (between the gastric pits and glands). Scale
bars = 100 µm.
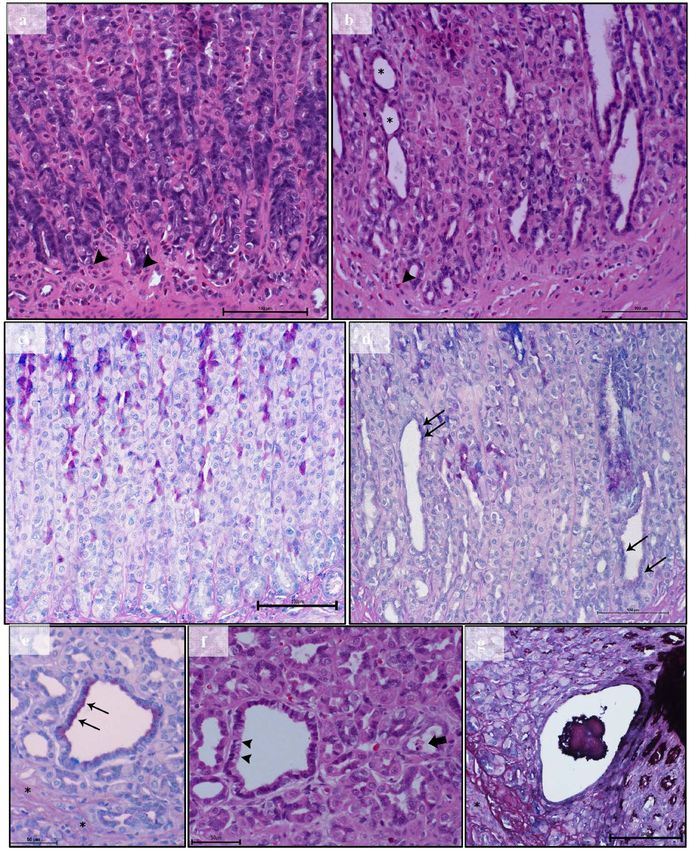
DOI: 10.4236/fns.2018.96058 774 Food and Nutrition SciencesI. M. Zdziarski et al. Figure 2. Gastric glands of the rat stomach (fundus) from rats fed a 60% GM or non-GM corn diet. Photomicrographs of H&E stained sections of the gastric glands: (a) from a non-GM-fed rat showing normal gland appearance, and (b) from a GM-fed rat showing large gland dilatations with epithelial cell elongation (*). In both sections, several granular leukocytes can be seen deep to the gastric glands (arrowheads). Photomicrographs of AB/PAS stained sections: (c) from a non-GM-fed rat showing normal gland appearance, and (d) from a GM-fed rat showing altered staining properties of the epithelium of the gland dilatations (arrows). Photomicrographs (b) and (d) are corresponding sections from the same GM-fed rat. Corresponding photomicrographs of gland dilatation in the same GM-fed rat stained with: (e) AB/PAS and (f) H&E. The AB/PAS-stained section shows PAS-positive stained cells in a deeply situated gland dilatation. Note the smooth muscle fibres (*) of the muscularis mucosa slightly deep to the gland. Cells with such intense PAS staining are characteristic of the mucus-producing cells of the gastric pits and not the deep gland region. The corresponding H&E-stained section of gland dilatations shows cuboidal cells with a lucid apical cytoplasm (arrowheads), as well as cellular debris in the lumen of another gland (thick arrow). Scale bar = 50 µm. (g) Photomicrograph of an AB/PAS stained section showing a grossly enlarged glandular cyst in the mucosa of a GM-fed rat. The dilatation nearly spans the full depth of the mucosa. Note the smooth muscle fibres (*) of the muscularis mucosa slightly deep to the gland and the intensely purple staining cells of the gastric pits (large arrowheads). The epithelium lining the dilated gland appears elongated and the gland contains PAS-positive debris or mucus. Image is a combined z-stack. Scale bar = 100 µm. DOI: 10.4236/fns.2018.96058 775 Food and Nutrition Sciences
I. M. Zdziarski et al.

                                                    the lamina propria below the glandular region showed no significant difference
                                                    between the two groups (Table 2).
                                                        Gland dilatations or cysts were seen in several animals of both groups (6/10 in
                                                    GM-fed rats; 4/10 non-GM-fed rats; Table 3). The dilatations were often ob-
                                                    served near the glandular/non-glandular stomach junction. In the non-GM-fed
                                                    rats, the gland dilatations were small and the lining cells were most often cu-
                                                    boidal or columnar in shape. In the GM-fed group, the dilatations were large,
                                                    with some of the lining cells elongated or stained intensely with PAS (dark pink)
                                                    or AB/PAS (dark purple). In some corresponding H&E-stained sections, these
                                                    cells had a lucid apical cytoplasm. The staining properties of these cells resemble
                                                    mucus-producing cells of the gastric pits, which suggest epithelial dysplasia and
                                                    not intestinal metaplasia (Figure 2). In some of the GM-fed rats, the gland dila-
                                                    tations contained cellular debris or mucus (Figure 2(f) and Figure 2(g)). One
                                                    GM-fed rat had a grossly enlarged glandular cyst that nearly spanned the full
                                                    depth of the mucosa (Figure 2(g)). The epithelium lining this enlarged gland
                                                    was attenuated and the gland lumen contained a large clump of PAS-positive
                                                    debris or mucus. These staining features were only seen in the gland dilatations
                                                    of the GM-fed rats, but this was not statistically significant in either the full-set
                                                    or subset analyses (Table 3).
                                                        The number of rats showing gland dilatations with elongated epithelium in
                                                    the GM-fed group was statistically significantly greater than rats fed the
                                                    non-GM diet (RR > 6.60, p = 0.011; Table 3; please note that since none of the
                                                    non-GM-fed rats exhibited this pathology, the 2 × 2 table had a zero in a cell.
                                                    This generated an undefined relative risk (RR). Placing a 1 in that cell provided

Table 3. Number of rats with gland dilatations in the gastric glands of the fundus of rats fed a 60% GM or non-GM corn diet.

                                                               GM                        Non-GM                                                   Statistical
                                                         Outcome of Interest         Outcome of Interest                    95% Confidence
                                                                                                            Relative Risk                        Significance
                                                                                                                               Interval
                                                          Present     Absent         Present    Absent                                           (p < 0.050)a

                                                Analysis of all rats studied (GM-fed n = 10; non-GM-fed n = 10)
           No. of rats with gland dilatations               6            4              4          6            1.50           0.60-3.74              NS

    No. of rats with gland dilatations that are lined                                                        Undefined         Undefined
                                                            4            6              0          10                                                 NS
     by cells exhibiting PAS or AB/PAS staining                                                               (>4.40)b       (0.59 - 33.07)b

        No. of rats with gland dilatations that                                                              Undefined         Undefined
                                                            6            4              0          10                                               0.011*
             are lined by elongated cells                                                                     (>6.60)b       (0.95 - 45.74)b

                                   Subset analysis of only rats with gland dilatations (GM-fed n = 6; non-GM-fed n = 4)

    No. of rats with gland dilatations that are lined                                                       Undefined.         Undefined
                                                            4            2              0          4                                                  NS
     by cells exhibiting PAS or AB/PAS staining                                                              (>3.33)b        (0.53 - 21.03)b

           No. of rats with gland dilatations                                                               Undefined.         Undefined
                                                            6            0              0          4                                               0.005**
           that are lined by elongated cells                                                                 (>4.29)b        (0.72 - 25.39)b

a
 Two-tailed Fisher’s exact test. Statistical significance: *p < 0.050 to 0.010, **p < 0.010 to 0.001, ***p < 0.001. bDue to the presence of a zero in a cell, the
relative risk and confidence intervals were calculated as being undefined. An approximation (underestimate) of these was obtained by putting “1” into the
cell with the zero. This was only done for the relative risk and confidence interval. The p-value was calculated using the original, non-approximated data.
Statistical significance: p < 0.050.

DOI: 10.4236/fns.2018.96058                                                    776                                            Food and Nutrition Sciences
I. M. Zdziarski et al.
an underestimate of the RR at 6.60, that is, the RR was greater than 6.60). A sub-
set analysis of the data from only the rats that exhibited gland dilatations con-
firmed that rats on the GM diet always had at least one enlarged gland exhibiting
an elongated epithelium, whilst the rats on the non-GM diet had none (p =
0.0048; Table 3).
A scale of severity of the gland dilatations was also generated where the pres-
ence of a gland dilatation in the section was given a 1 and any subsequent ob-
servation (epithelial dysplasia or elongation) was given an extra 1 for each ob-
servation. The maximum number any animal could score was 3. The results for
each dietary group were averaged and this provided a gland dilatation severity
score (Table 2). The severity score was higher in the GM-fed group (a median of
2.50) than in the non-GM-fed group (a median of 0.00), however this was not
statistically significant.
3.3. Immunohistochemistry
In the fundus of the stomach, caspase 3 positive cells were sporadic, with some
sections exhibiting only one or two cells labelled in the whole section, while oth-
ers had intermittent areas with many labelled cells. Therefore, an overall apop-
totic count was not possible to attain without sampling bias. As a result, a scale
of 0 - 4 was generated to assess the frequency of cells labelled: 0 = no cells la-
belled, 1 = one to a few cells labelled, 2 = few to several cells labelled, 3 = several
cells labelled, and 4 = many cells labelled in the whole section. Each animal was
given a score and an average was generated per feeding group (Table 4). Label-
ling for caspase 3 was rarely seen in any of the gland dilatations of either feeding
group.
The anti-Ki67 labelling was seen primarily at the base of the gastric pits of the
GM-fed and non-GM-fed groups. There was a significant 21% reduction (p =
0.028) in the proportion of nuclei that were labelled with Ki67 antibody in the
GM-fed group compared with the non-GM-fed group (Table 4). In addition, a
significant decrease of 31% (p = 0.033) was seen in the number of proliferating
cells per pit + gland depth in the GM-fed group (Table 4).
Some animals in both groups had a wider distribution of Ki67 labelling in the
distal pit and proximal glandular regions (Figure 1). A score to assess the spread
was generated: 1 = few cells labelled in the neck region; 2 = compact spread; 3 =
medium-compact spread; 4 = medium spread. A higher spread would indicate a
more actively dividing mucosal epithelium. Results showed that on average, both
groups had the same spread of dividing cells in the neck region (Table 4).
Some animals in both groups had sporadic labelling in the gastric glands.
These animals were given a score of 1 = present, and animals which had none or
hardly any labelling in the gastric glands were given a score of 0 = absent. Six out
of 10 non-GM-fed rats and nine out of 10 GM-fed rats had such labelling. One
non-GM-fed rat had many labelled nuclei in the gastric gland region. The score
for the presence of labelling in the gastric glands was added to the gland dilata-
tions severity score, which resulted in a 6 times higher score in the GM-fed
DOI: 10.4236/fns.2018.96058 777 Food and Nutrition SciencesI. M. Zdziarski et al.
Table 4. Apoptotic and dividing cells in the stomach (fundus) mucosa of rats fed a 60% GM or non-GM corn diet.
GM Non-GM Statistical
Percentage
Mean or Mean or Significance
SD or IQRa n SD or IQRa n Change (%)c
mediana mediana (p < 0.050)b
Frequency of apoptotic cells
1.00 1.00 - 2.25 8 1.50 1.00 - 2.25 8 NS −33.33
in the gastric mucosa
% dividing cells/total count 10.07 1.43 10 12.75 3.09 10 0.028* −21.02
Dividing cells/pit + gland depth 0.18 0.05 10 0.26 0.09 10 0.033* −30.77
Spread of dividing cells in the
3.00 2.25 - 3.00 10 3.00 2.00 - 3.00 10 NS 0
neck region
Presence of dividing cells in
gastric glands + gland dilatation 6.00 1.00 - 7.00 10 1.00 0.25 - 2.75 10 NS 600.00
severity score
a
For non-normally distributed data, the median and interquartile range (IQR) are given. SD = standard deviation. bStatistical significance: *p < 0.050 to
0.010, **p < 0.010 to 0.001, ***p < 0.001. cThe effect of the GM diet compared with the non-GM diet as a percentage change. The means were compared,
unless one or both variables were not normally distributed, when the medians were compared. A negative sign before the number indicates that the GM diet
decreased the variable. No sign indicates that the GM diet increased the value of the variable.
group than in the non-GM-fed group (Table 4); however, this was not statisti-
cally significant.
3.4. Electron Microscopy
Transmission electron microscopic investigations of the fundic region of the
stomach demonstrated a significant loss (p = 0.006) of tight junction apposition
between the mucus-producing cells of the gastric surface and pits of the GM-fed
animals (Table 5 and Table 6; Figure 3). The non-GM-fed rats commonly had
well-apposed tight junctions (44% of these rats). In contrast, the GM-fed rats
commonly had poorly-apposed tight junctions. The number of poorly-apposed
tight junctions per rat was 3.5 times higher in GM-fed rats (p = 0.006; Table 5).
When expressed as the percentage of poorly-apposed tight junctions per total
count, GM-fed rats were almost 5 times higher than non-GM fed rats (p = 0.004;
Table 5). Every GM-fed rat had at least one poorly-apposed tight junction and
the relative risk (RR) of a rat having at least one poorly-apposed tight junction
was almost twice as high in GM-fed rats compared with non-GM-fed rats (p =
0.033; Table 6).
Furthermore, 70% of GM-fed rats had more than 30% of their tight junctions
poorly-apposed (p = 0.003; Table 6) compared with none of the GM-fed rats.
The RR of a rat having 30% of its tight junctions poorly apposed was over 7
times higher in rats fed the GM-corn diet compared with rats fed the
non-GM-corn diet (p = 0.003; Table 6). Although not statistically significant,
20% of the GM-fed rats had more than 50% of their tight junctions poor-
ly-apposed compared with none in the non-GM-fed rats. The apposition loss
was seen as either a partial or a complete loss, or as blebbing (Figure 3(d) and
Figure 3(e)).
DOI: 10.4236/fns.2018.96058 778 Food and Nutrition SciencesI. M. Zdziarski et al.
Table 5. Transmission electron microscopic investigation of tight junctions in the stomachs of rats fed a 60% GM or non-GM
corn diet.
GM Non-GM Statistical
Percentage
Significance
Median IQRa
n Median IQR a
n Change (%)c
(p < 0.050)b
No. of poorly apposed
3.50 3.00 - 4.00 10 1.00 0.00 - 2.00 9 0.006** 350.00
tight junctions per rat
% poorly apposed tight
35.42 24.17 - 44.44 10 7.14 0.00 - 26.09 9 0.004** 496.08
junctions per total countd
a
IQR = interquartile range. bStatistical significance: *p < 0.050 to 0.010, **p < 0.010 to 0.001, ***p < 0.001. cCalculated Percentage Change of the effect of
eating the GM diet compared with the non-GM diet. dNumber of poorly apposed tight junctions as a percentage of the total number of tight junctions
counted.
Table 6. Number of rats with poorly-apposed tight junctions between the mucus-producing cells of the gastric surface and pits of
rats fed a 60% GM or non-GM corn diet.
GM Non-GM Statistical
Outcome of Interest Outcome of Interest Relative 95% Confidence
Significance
Risk Interval
Present Absent Present Absent (p < 0.050)a
No. of rats with poorly apposed tight junctions 10 0 5 4 1.80 1.00 - 3.23 0.033*
No. of rats with at least 30% of their Undefined Undefined
7 3 0 9 0.003**
tight junctions poorly apposed (>7.00)b (1.04 - 46.95)b
No. of rats with at least 50% of their Undefined Undefined
2 8 0 9 NS
tight junctions poorly apposed (>2.00)b (0.21 - 18.69)b
a
Statistical analysis by Fisher’s Exact test. Statistical significance: *p < 0.050 to 0.010, **p < 0.010 to 0.001, ***p < 0.001. bDue to the presence of a zero in a
cell, the relative risk and confidence intervals were calculated as being undefined. An approximation (underestimate) of these was obtained by putting “1”
into the cell with the zero. This was only done for the relative risk and confidence interval. The p-value was calculated using the original, non-approximated
data. Statistical significance: p < 0.050.
3.5. Severity Score
A severity score was developed that joined together all the adverse findings into
a single score for each rat. Observations that were considered to be adverse in-
cluded: the spread of Ki67 labelling in the neck region of the gastric mucosa (a 1 -
4 scale for neck region spread), the presence of Ki67 labelling in the gastric
glands (0 = absent; or 1 = present), the frequency of caspase 3 labelling in the
gastric mucosa of the whole tissue sample (a 0 - 4 scale for the presence of la-
belled cells), gland dilatations plus their staining properties and morphological
alterations to their lining epithelium (a 0 - 3 score of gland dilatation severity),
and whether a rat had 30% of their tight junctions poorly apposed (0 = no; or 1 =
yes). The highest severity score possible was 13, which would indicate that a rat
had been severely affected by the diet. Rats on the GM diet had a severity score
that was 33% higher than rats on the non-GM diet (7.30 ± 1.42 vs 5.50 ± 1.90 for
GM-fed and non-GM-fed respectively; p = 0.027).
4. Discussion
The present study assessed the effects of long term-feeding of a 60% corn diet on
the histopathology of the rat stomach.
DOI: 10.4236/fns.2018.96058 779 Food and Nutrition SciencesI. M. Zdziarski et al. Figure 3. Transmission electron micrographs of mucus-producing cells of the pit and surface of stomachs from rats fed a 60% GM or non-GM corn diet. Ultramicrographs of mucus-producing cells at low magnification in: (a) non-GM-fed rats, and (b) GM-fed rats. In the ultramicrograph of the GM-fed rat (b), poorly-apposed tight junctions are visible on either side of the epithelial cell. In particular, the tight junction on the right, which shows blebbing (arrows). Scale bar 5 μm. (c) At higher magnification, the well-apposed tight junction (arrows) in a non-GM-fed rat has clearly visible plaque and no gap between apposing leaflets, while the poorly apposed tight junctions in GM-fed rats are seen as: (d) blebbing or (e) complete loss of tight junction apposition (ar- rows). Scale bar 1 μm. DOI: 10.4236/fns.2018.96058 780 Food and Nutrition Sciences
I. M. Zdziarski et al.

                                Initially, the dietary intake of both groups of rats was not as high as expected
                              and GM-fed rats were eating less than non-GM-fed rats. Neither group of rats
                              lost weight. The diets were therefore sent for repelleting to increase the moisture
                              content slightly, starting with the GM diet, because they were the most affected
                              group. The provision of moister diets resulted in a typical weight gain [49] for
                              the remainder of the study. Because the GM-fed rats were fed moister diets a few
                              weeks before non-GM-fed rats, they weighed more at the end of the study than
                              non-GM-fed rats. As a result, it is important to note the following. First, histo-
                              logical investigation of the non-glandular stomach did not demonstrate any pa-
                              thognomonic sign of starvation, such as the thickening of the keratinized layer
                              (Table 2) [50], confirming dietary and body weight observations that rats were
                              not starved.
                                Second, due to the initial reduced dietary intake, GM-fed rats consumed less
                              GM corn over the course of the experiment than predicted. Consequently, any
                              adverse effects produced by GM corn on the stomach would have been lessened
                              in this study. Third, the GM-fed rats started to eat moister diets and started to
                              increase their dietary intake several weeks before the non-GM-fed rats. There-
                              fore, GM-fed rats weighed more (and hence may have been better nourished) at
                              the end of the study than non-GM-fed rats. This may have caused a confounder
                              which biased the results towards GM-fed rats having better stomach health and
                              fewer adverse findings than non-GM-fed rats.
                                As a result, the effects of the GM crop on the health of the rat stomach mucosa
                              are likely to be under-reported in this study, and statistical tests comparing the
                              GM-fed group to the non-GM-fed group are likely biased to find no difference
                              between the groups (often described as “a bias to the null”). The study is there-
                              fore conservative in its findings and a repeat of the study may find an increase in
                              adverse effects.

                              4.1. Tight Junction Apposition Loss
                              In the present study, the most striking difference was the loss in tight junction
                              apposition between mucus-producing cells of the fundus in the GM-fed group,
                              which was five times higher than in the non-GM-fed group (p = 0.004). Almost
                              twice as many GM-fed rats had poorly apposed tight junctions as non-GM-fed
                              rats (RR = 1.80; p = 0.033). Every GM-fed rat had at least one poorly-apposed
                              tight junction. The apposition loss was seen as a blebbing or a complete separa-
                              tion of the two leaflets (Figure 3). These structural changes are commonly asso-
                              ciated with chemical gastropathy or bacterial infection [51] [52] [53]. However,
                              bacterial infections are typically accompanied by inflammation, while chemical
                              gastropathy is limited to mild or no inflammation [54]. The lack of a severe in-
                              flammatory response in the current study therefore suggests that the observed
                              changes in the tight junctions in the GM-fed group may be a sign of chemical
                              gastropathy. Chemical gastropathy (or reactive gastritis) occurs when there are
                              surface-damaging agents such as chemical irritants or certain medications/drugs

DOI: 10.4236/fns.2018.96058                        781                                 Food and Nutrition Sciences
I. M. Zdziarski et al.
in the gastric lumen [38] [55]. In chemical gastropathy, the pathological changes
are subtle, but are characterised by pit hyperplasia, mucus depletion, superficial
oedema [38], with the absence of severe inflammation, atrophy, metaplasia, ulc-
ers and polyps [55]. In severe cases, it is characterised by an increase in glandu-
lar depth and pit coiling [38] [54]. Although not statistically significant, the
GM-fed group demonstrated a slight increase in mucosal thickness (3.34%
greater), particularly in the glandular depth (2.11% greater than the non-GM
group). Pit depth was also greater in the GM-fed group, but pit coiling was not
observed. The absence of pit coiling in GM-fed rats may indicate that the effect
is mild rather than severe. Alternatively, pit coiling may be a feature seen only in
human stomachs.
A loss of tight junction apposition may result in a compromised mucosal bar-
rier that may in turn result in the stomach wall becoming permeable to bacteria,
viruses or macromolecules such as allergy-inducing proteins. The absence of a
local inflammatory response in the stomach of these rats suggests that the loss of
tight junction apposition was not sufficient to allow pathogens through the mu-
cosal barrier to cause serious damage of underlying tissue and consequently
trigger a local inflammatory response [56]. The permeability of the mucosal bar-
rier is also determined by the presence of the basement membrane (which acts as
a selective chemical barrier) and the mucous layer protecting the mucosal sur-
face of the stomach [57]. Therefore any organism or substance would have to
also breach these barrier components [58]. Future studies could investigate
whether the stomach from a GM-fed rat has increased permeability by investi-
gating the transepithelial electrical resistance of the mucosa [59].
In addition, the observed ultrastructural changes to the tight junctions be-
tween the mucus-producing cells may not result in a change in tight junction
permeability. Tight junctions are composed of transmembrane proteins, occlu-
din, claudins, and junctional adhesion molecules (JAMs), which are anchored to
the cell cytoskeleton via cytosolic plaque proteins called the zonula occludens
proteins (ZO-1, ZO-2, and ZO-3) [60] [61]. Each tight junction protein has a
specific function or acts collectively with other tight junction proteins to regulate
paracellular permeability, transepithelial migration of leukocytes, and to keep
cells polar [62] [63] [64] [65]. The specific role of each individual tight junction
protein is still being elucidated and new proteins are still being discovered.
However, it is known that any change in the proteins of the tight junction may
alter one function leaving others unaffected. For example, in an in vitro study,
an induced mutation of one of the tight junction proteins (occludin) caused in-
hibition of neutrophil migration, but no change in the selective paracellular
permeability or transepithelial electrical resistance of the epithelium [59]. In
other words, the consequence of tight junction apposition loss observed in our
study is dependent on which protein is affected.
The reorganisation of the tight junction proteins has been reported to be trig-
gered by cytokines or apoptosis, through the reorganisation or contraction of the
DOI: 10.4236/fns.2018.96058 782 Food and Nutrition SciencesI. M. Zdziarski et al.
actin cytoskeleton [66] [67]. Apoptosis was scarcely seen in the gastric pits in
most of the rats in our study. Therefore, it is possible that cytokines may be the
cause.
4.2. Decrease in Proliferative Cells
An overall decrease in mitotic cells was seen in the stomach mucosa of GM-fed
animals (20.02% less than non-GM; p = 0.028). However, a semi-quantitative
analysis of proliferation in the neck region as well as the presence of labelling in
the gastric glands did not reveal any differences between groups. Therefore, the
potential role of this observation and the effect of the GM diet is unclear. An ad-
ditional measure of parietal and enterochromaffin-like cell (ECL) populations
may give a more complete interpretation [55].
4.3. The Cry Proteins as a Source of Rodent Toxicity
The action of the Cry proteins on gut tissue is claimed to be specific to certain
insects and safe for mammalian consumption [68]. However, histopathological
or immunotoxicological studies on the effects of the proteins on animal physi-
ology are scarce [30], particularly of the Cry proteins produced by GM crops
[13], which are encoded by cry genes that have been modified, enhanced or syn-
thetically produced [2]. The species-specific mode of action of Cry proteins are
believed to be based on three things: 1) the insects’ mid-gut proteases which
cleave the Cry proteins, consequently activating the proteins by exposing their
binding site [28]; 2) the activated proteins binding to the insects’ specific cadhe-
rin receptor [69]; and 3) the Cry proteins binding to the insects’ specific cell
membrane receptor(s) [70] [71]. It should, however, be noted that the genes en-
coding for the Cry proteins in GM crops have been changed, that is, they have
had alterations made to the nucleotide sequence and/or are truncated [2] [72],
which may have altered their species specificity.
The GM crops that express Cry proteins are commonly referred to as Bt crops.
In general, they contain truncated genes which encode for the active toxins ra-
ther than the inactivated crystalline protoxins produced by the bacterium, Bacil-
lus thuringiensis [2]. The reason for this is that the genes coding for the full tox-
in do not provide the plant with adequate insecticidal strength [72]. Therefore,
the Cry proteins produced by the Bt crops may have been changed in such a way
that impacts their specificity and thus makes them capable of interacting with
epithelial cells of the non-target mammalian gut.
An in vitro study on bovine intestinal cells [73] found that the Cry1Ab protein
binds to the apical surface of enterocytes. Specifically, the protein was bound to
actin, a major protein of the cytoskeleton. It has been shown that actin’s interac-
tion with tight junction proteins may have an effect on tight junction integrity
[66] [74]. Our present study reported ultrastructural changes to the tight junc-
tions in the form of blebbing or complete separation of the two leaflets (Figure
3). These could have occurred as a result of the binding of one or both of the Cry
DOI: 10.4236/fns.2018.96058 783 Food and Nutrition SciencesI. M. Zdziarski et al.
proteins to actin. While reference [73] proposed that the interaction of Cry1Ab
with actin would only occur in vitro because actin would not be exposed for
binding in vivo; other studies have demonstrated that Cry proteins do bind to
mammalian intestinal epithelium in in vivo and in situ [30] [75].
4.4. Other Observed Changes
One rat in the non-GM-fed group had a grossly enlarged squamous cyst in the
non-glandular stomach, which is a common and not clinically significant occur-
rence in this strain of rats [76].
In some of the GM-fed rats, gland dilatations with epithelial elongation were
observed in the glandular stomach (p = 0.011; Table 3). Gland dilatations are a
natural occurrence, particularly in aged rats [77]. However, they have also been
observed in association with certain diseases or pathological conditions [77] [78]
[79] [80]. In the current study, both the GM-fed rats and the non-GM-fed rats
had gland dilatations. However, in the GM-fed rats, some of the gland dilata-
tions were lined by attenuated epithelial cells or with an epithelium of altered
staining properties suggestive of epithelial dysplasia (Table 3 and Figure 2).
These observations were not found in any of the non-GM-fed rats. Therefore,
these changes to the epithelium of the gland dilatations are likely to be an effect
of the GM diet.
The gland dilatations were often seen at the junctional region between the
non-glandular and glandular stomach areas. The non-glandular stomach is a
compartment where ingested products reside for a longer period [81]. If the GM
diet has a toxic component, the effects are more likely to be observed in the
junctional region of the glandular stomach, because of the prolonged holding of
the feed in that compartment. In the non-glandular stomach, adverse changes
are not likely to be seen due to the protective function of the keratinized layer in
that part of the stomach.
The elongation of epithelial cells seen in the gland dilatations in GM-fed rats
could indicate either that the gland is congested or that the glandular epithelium
is undergoing repair. If glandular congestion was the cause of epithelial elonga-
tion, a high frequency of debris or mucus plugs would be expected in the glands.
However, only a few of the GM-fed rats had cellular debris or mucus in their
gland dilatations (Figure 2(f) and Figure 2(g)). Therefore, glandular congestion
is unlikely to be the cause of epithelial elongation in the dilated glands.
Alternatively, elongation of epithelial cells in the gut mucosa could reflect a
rapid repair mechanism called restitution, which occurs following an insult to
the mucosal surface epithelium [57]. The mechanism involves the elongation of
the remaining viable cells to cover the basal lamina to maintain mucosal barrier
integrity and continuity until other mechanisms ensue, such as cellular prolife-
ration and/or an extensive inflammatory response [58]. Restitution is most often
seen at the liminal surface and in the pits [82]. However, if the epithelium of the
gastric glands is damaged, this same mechanism of repair may occur to ensure
DOI: 10.4236/fns.2018.96058 784 Food and Nutrition SciencesYou can also read


