Acetylation of histone H3 at lysine 64 regulates nucleosome dynamics and facilitates transcription
←
→
Page content transcription
If your browser does not render page correctly, please read the page content below
RESEARCH ARTICLE
           elifesciences.org

                                     Acetylation of histone H3 at lysine
                                     64 regulates nucleosome dynamics and
                                     facilitates transcription
                                     Vincenzo Di Cerbo1,2, Fabio Mohn3†, Daniel P Ryan4†‡, Emilie Montellier5,6,
                                     Salim Kacem7, Philipp Tropberger1,2, Eleni Kallis8, Monika Holzner8, Leslie Hoerner9,
                                     Angelika Feldmann9, Florian Martin Richter10, Andrew J Bannister11,12,
                                     Gerhard Mittler13, Jens Michaelis8, Saadi Khochbin5,6, Robert Feil7, Dirk Schuebeler9,
                                     Tom Owen-Hughes4, Sylvain Daujat1*, Robert Schneider1*
                                     1
                                      Department of Functional Genomics, Institut de Génétique et de Biologie
                                     Moléculaire et Cellulaire (IGBMC), CNRS UMR, Strasbourg, France; 2Max Planck
                                     Institute of Immunobiology and Epigenetics, Freiburg, Germany; 3Institute of
                                     Molecular Biotechnology, Vienna, Austria; 4Wellcome Trust Centre for Gene
                                     Regulation and Expression, College of Life Sciences, University of Dundee, Dundee,
                                     United Kingdom; 5INSERM U823, Université Joseph Fourier, Grenoble, France;
                                     6
                                      Faculté de Médecine, Institut Albert Bonniot, Grenoble, France; 7Institut de
                                     Génétique Moléculaire, CNRS UMR5535/Université de Montpellier I and II,
*For correspondence: daujat@         Montpellier, France; 8Institute for Biophysics, Ulm University, Ulm, Germany;
igbmc.fr (SD); schneidr@igbmc.fr
                                     9
                                      Friedrich Miescher Institute for Biomedical Research (FMI), Basel, Switzerland;
(RS)                                 10
                                       Cellular Immunobiology, Max Planck Institute of Immunobiology and Epigenetics,
†
 These authors contributed           Freiburg, Germany; 11Gurdon Institute, Cambridge, United Kingdom; 12Department
equally to this work                 of Pathology, University of Cambridge, Cambridge, United Kingdom; 13Max Planck
                                     Institute of Immunobiology and Epigenetics, Freiburg, Germany
Present address: ‡The John
Curtin School of Medical
Research, The Australian
National University, Canberra,
Australia                            Abstract Post-translational modifications of proteins have emerged as a major mechanism for
                                     regulating gene expression. However, our understanding of how histone modifications directly
Competing interests: The             affect chromatin function remains limited. In this study, we investigate acetylation of histone H3 at
authors declare that no
                                     lysine 64 (H3K64ac), a previously uncharacterized acetylation on the lateral surface of the histone
competing interests exist.
                                     octamer. We show that H3K64ac regulates nucleosome stability and facilitates nucleosome eviction
Funding: See page 20                 and hence gene expression in vivo. In line with this, we demonstrate that H3K64ac is enriched in
                                     vivo at the transcriptional start sites of active genes and it defines transcriptionally active chromatin.
Received: 02 October 2013
Accepted: 20 February 2014           Moreover, we find that the p300 co-activator acetylates H3K64, and consistent with a transcriptional
Published: 25 March 2014             activation function, H3K64ac opposes its repressive counterpart H3K64me3. Our findings reveal an
                                     important role for a histone modification within the nucleosome core as a regulator of chromatin
Reviewing editor: James T
                                     function and they demonstrate that lateral surface modifications can define functionally opposing
Kadonaga, University of
                                     chromatin states.
California, San Diego, United
                                     DOI: 10.7554/eLife.01632.001
States

    Copyright Di Cerbo et al. This
article is distributed under the
terms of the Creative Commons
Attribution License, which
                                     Introduction
permits unrestricted use and         Histone modifications are central to the regulation of all chromatin-based processes. Four core histones—
redistribution provided that the     H3, H4, H2A, and H2B—comprise the nucleosomal core particle, and each may be decorated with
original author and source are       multiple covalent modifications, including acetylation, methylation, phosphorylation, sumoylation, and
credited.                            ubiquitination (Kouzarides, 2007). To date, most attention has focused on modifications within the

Di Cerbo et al. eLife 2014;3:e01632. DOI: 10.7554/eLife.01632                                                                           1 of 23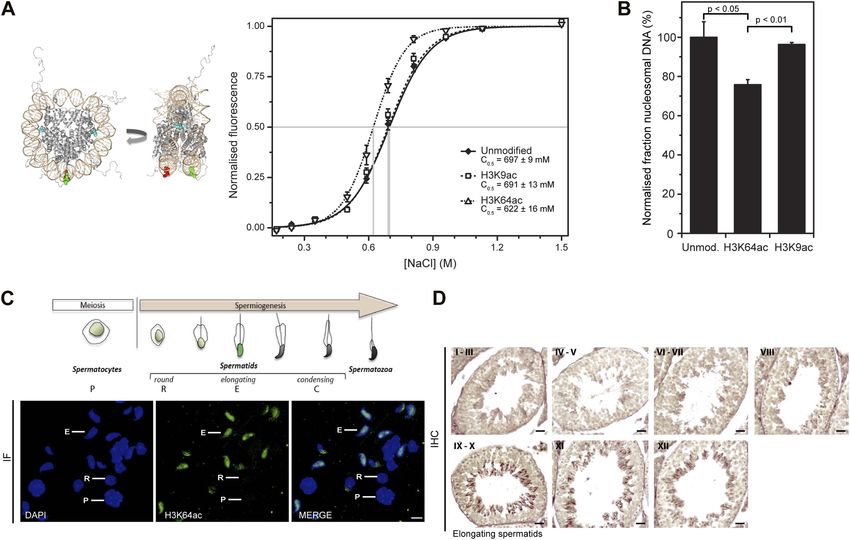
Research article                                                                                         Genes and chromosomes

                                   eLife digest DNA is a very long molecule, so it needs to be packaged carefully to fit into the
                                   nucleus of a cell. To achieve this, the DNA is wrapped around proteins called histones to form a
                                   structure termed a nucleosome, which is the building block of a more compacted substance called
                                   chromatin. However, to express the genes in the DNA it is necessary to open up parts of the
                                   chromatin to give various enzymes access to the DNA.
                                       Cells often chemically modify histones by adding acetyl or methyl groups, and these
                                   modifications are known to influence what proteins can bind to the nucleosomes, which ultimately
                                   influences what genes are expressed in the cell at a given time. It has been suspected for some time
                                   that histone modifications can also influence gene expression more directly, but there has been little
                                   evidence for this idea.
                                       Now Di Cerbo et al. have studied what happens when acetyl or methyl groups are added to a
                                   specific site within a histone called H3K64, which is close to where the DNA wraps around this
                                   histone. These experiments showed that this site tends to be acetylated when a nearby gene is
                                   active, and to be unmodified or methylated when this gene is not active. It appears that the
                                   addition of the acetyl group makes this region of the chromatin less stable: this, in turn, makes it
                                   easier for the chromatin to be unpacked, thus giving access to the enzymes that transcribe the DNA
                                   and allowing transcription to take place. The work of Di Cerbo et al. shows that methylation and
                                   acetylation at the same site within a histone can define two opposing states of chromatin and DNA:
                                   an active state and a repressive state.
                                   DOI: 10.7554/eLife.01632.002

                                   flexible N-terminal tails of histones, which extend from their own nucleosome. Due to their accessibility,
                                   ‘reader’ or effector proteins selectively bind to modified sites in the tails to mediate downstream
                                   effects. In this way ‘readers’ can provide a relatively simple mechanism enabling cells to decipher the
                                   so-called ‘histone-code’, to facilitate the regulation of biological processes such as transcription, DNA
                                   replication, and damage repair.
                                       Interestingly, covalent modifications also occur within the globular domain of histones (Garcia,
                                   2009), especially at positions that are in close contact with the nucleosomal DNA wrapped around
                                   each octamer. In particular, modifications on the outer surface of the histone octamer, the so-called
                                   lateral surface, have the potential to directly influence chromatin structure by altering histone–histone
                                   or histone–DNA interactions (Cosgrove, 2007; Tropberger and Schneider, 2010; Tropberger et al.,
                                   2013). Because of their structurally important position close to the DNA, one can directly address the
                                   mechanism(s) by which these lateral surface modifications impact on nucleosome dynamics and chromatin
                                   function. This is in contrast to tail modifications that play a mainly indirect role in chromatin regulation
                                   through recruitment of effector proteins.
                                       Understanding how histone modifications ultimately impact on chromatin function is still an open
                                   challenge and this has not been helped by the fact that the repertoire of known modifications is far from
                                   complete (Tan et al., 2011). Here, we have investigated the functional mechanism of an uncharacterized
                                   acetylation site, lysine 64 of histone H3 (H3K64ac), which lies within the H3 globular domain. We
                                   demonstrate that this lateral surface modification can directly influence nucleosomal stability and
                                   dynamics, which consequently affects transcriptional regulation.

                                   Results
                                   H3K64ac is a novel histone modification enriched in euchromatin
                                   We used mass spectrometry to identify novel histone modifications and found an uncharacterized
                                   acetylation site on histone H3 lysine 64 (H3K64ac) (Figure 1A, Figure 1—figure supplement 1A,B).
                                   H3K64 is the first amino acid of the H3 alpha1 helix, the first of three alpha helices in the histone fold.
                                   It is found on the lateral surface of the histone octamer in close proximity to the inner gyre of DNA
                                   (Davey et al., 2002; Figure 1B) at a location distinct from other potentially acetylated residues, such
                                   as H3K56.
                                       To study the biological function of H3K64ac, we first performed an exhaustive characterization of
                                   an antibody raised against this modification. This antibody specifically detects endogenous acetylated

Di Cerbo et al. eLife 2014;3:e01632. DOI: 10.7554/eLife.01632                                                                           2 of 23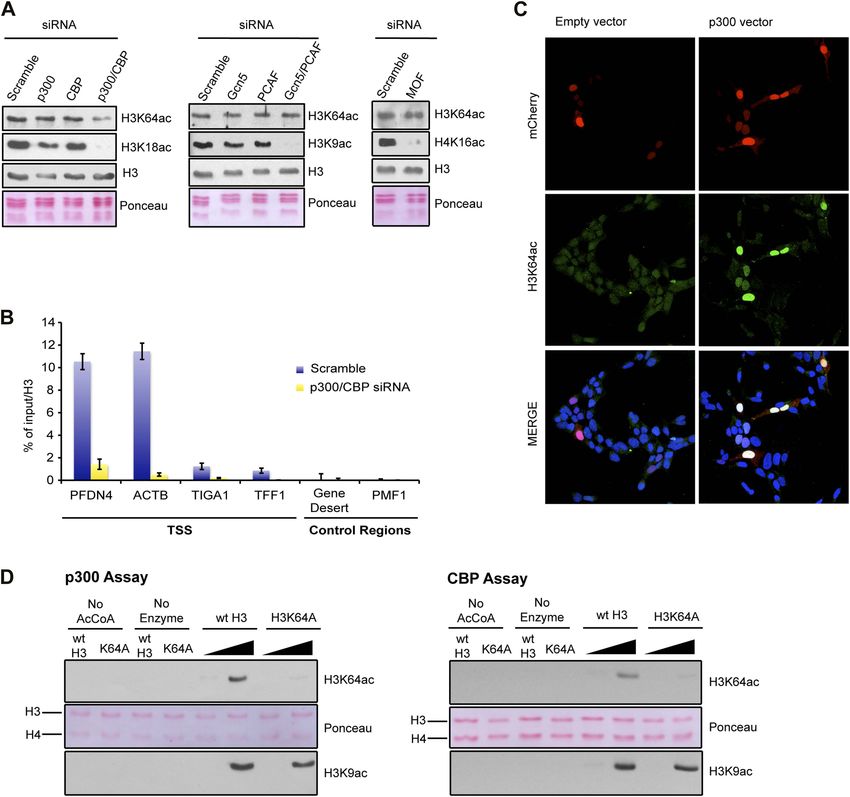
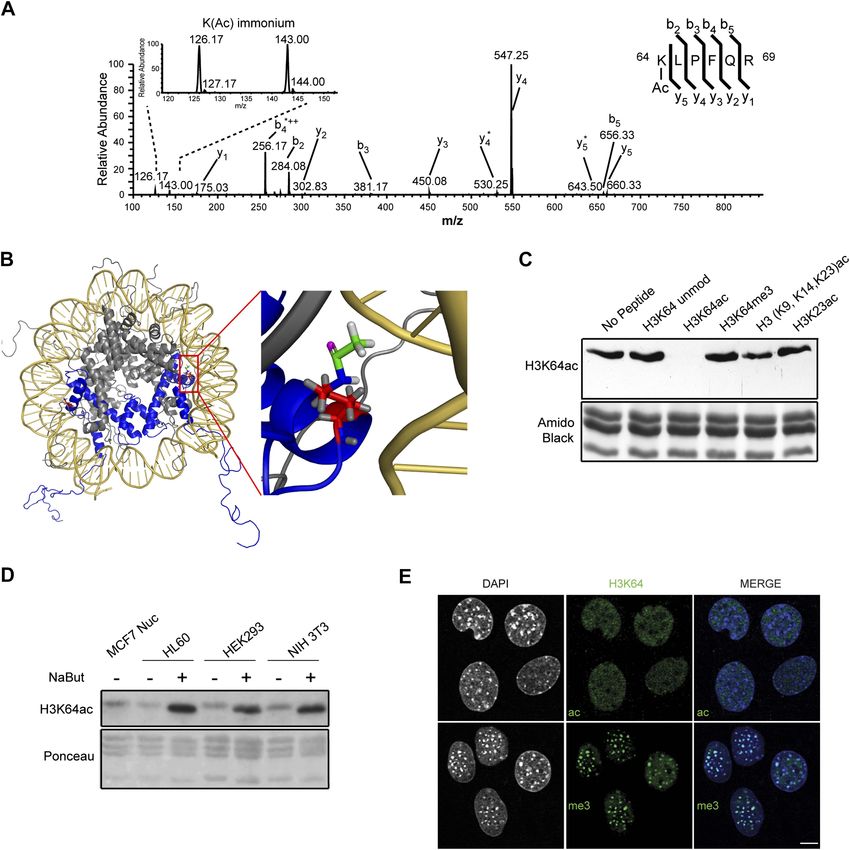
Research article                                                                                                    Genes and chromosomes

Figure 1. Acetylation of K64 in histone H3 is a novel histone modification. (A) CID MS/MS spectrum of the tryptic peptide (K(ac)LPFQR; m/z [MH22+]
415.74823) derived from endogenous histone H3 demonstrating K64 acetylation. The presence of the b2, the y5, the y5-NH3(y5*) and the immonium
ions derived from (ɛ) acetyl-lysine (enlarged spectrum inlet) are used for site localization to lysine 64. (B) H3K64 is on the lateral surface of the histone
octamer. 3D modelling of a nucleosome. H3 dimer is shown in blue and the proximity of acetylated H3K64 (red rectangle) with the DNA is highlighted in
the zoomed-in inset. In red are shown the main-chain and the side-chain of lysine 64. The acetyl group linked to the side-chain terminal nitrogen atom (in
blue) appears in green, with its oxygen atom in purple. All hydrogen atoms are displayed in grey. (C) Peptide competition of H3K64ac immunoblot.
H3K64ac antibody was pre-adsorbed with 50 pmoles/ml of indicated peptides. Amido black staining is shown as loading control (bottom panel).
(D) Immunoblot analysis of H3K64 acetylation state in different cell lines, treated (+) or not (−) with HDACs inhibitor Na-Butyrate. Untreated MCF7
nuclesosomes were used as control. Ponceau staining is shown as loading control (bottom panel). (E) H3K64ac is enriched in euchromatic regions. H3K64
Figure 1. Continued on next page

Di Cerbo et al. eLife 2014;3:e01632. DOI: 10.7554/eLife.01632                                                                                        3 of 23
Research article                                                                                                  Genes and chromosomes

Figure 1. Continued
acetylation (ac, upper panels) and tri-methylation patterns (me3, lower panels) in MEFs. DAPI dense foci represent pericentric heterochromatin. Single
sections are shown. Scale bar, 10 μm.
DOI: 10.7554/eLife.01632.003
The following figure supplements are available for figure 1:
Figure supplement 1. MS/MS spectra of H3K64ac peptides.
DOI: 10.7554/eLife.01632.004
Figure supplement 2. Anti-H3K64ac antibody validation.
DOI: 10.7554/eLife.01632.005
Figure supplement 3. H3K64ac is excluded from heterochromatic foci.
DOI: 10.7554/eLife.01632.006

                                     histone H3 (Figure 1—figure supplement 2A) and recognizes a K64-acetylated peptide with a high
                                     degree of specificity (Figure 1—figure supplement 2B–E) compared to other H3 acetylated lysines.
                                     Its recognition of H3 was efficiently competed by the immunizing peptide, but not by other peptides
                                     containing acetylated, methylated, or unmodified histone regions (Figure 1C, Figure 1—figure
                                     supplement 2F). Furthermore, limited tryptic digestion of native nucleosomes, which removes the H3
                                     tails whilst leaving the DNA-protected H3 core region largely intact, confirmed the antibody’s specificity.
                                     Indeed, this digestion treatment resulted in the loss of signal for the tail modifications, such as H3K9ac,
                                     H3K18ac, and H3K27ac. In contrast, the truncated H3 core was still recognized by the H3K64ac antibody
                                     at levels comparable to the undigested H3 (Figure 1—figure supplement 2G).
                                         Using this antibody, we found that H3K64ac is present in a variety of mouse and human cell lines and
                                     tissues suggesting a rather ubiquitous function (Figure 1D, Figure 1—figure supplement 2I). Upon
                                     HDAC-inhibitor treatment, H3K64 acetylation levels increased (Figure 1D, Figure 1—figure supple-
                                     ment 2I). Immunofluorescence (IF) showed a distinct nuclear localization of H3K64ac with a relative
                                     depletion from heterochromatin (Figure 1E, Figure 1—figure supplement 3, compare panels 5 and 6,
                                     and Figure 1—figure supplement 2H). Interestingly, this localization pattern is the opposite to that of
                                     H3K64me3 (Figure 1E). We previously established that H3K64me3 is a novel repressive mark enriched
                                     in pericentromeric heterochromatin that might help to ‘lock’ the conformation and/or position of the
                                     nucleosome, and consequently the surrounding chromatin (Daujat et al., 2009; Lange et al., 2013)

                                     H3K64ac associates with active regulatory genomic regions
                                     To obtain a comprehensive picture of the genomic distribution of H3K64ac, we performed ChIP-on-chip
                                     assays using chromatin isolated from mouse embryonic stem (ES) cells and Nimblegen tiling microarrays
                                     (Figure 2—figure supplement 1A; Lienert et al., 2011). In line with the euchromatic localization
                                     detected in IF, we found strong enrichment of H3K64ac at the transcriptional start site (TSS) of active
                                     genes (Figure 2A, Figure 2—figure supplement 1A–C). At TSSs, we detected a strong correlation
                                     between the enrichment of H3K64ac and RNA Polymerase II occupancy (Figure 2B), as well as with the
                                     presence of active histone marks (Figure 2—figure supplement 1D), suggesting a role for H3K64ac
                                     in transcriptional activation. Of note, local H3K64ac enrichment is indicative of the steady-state mRNA
                                     level of the respective gene (Figure 2C) and it is not simply due to increased histone H3 density
                                     (Figure 2—figure supplement 1E). Consistent with this, H3K64ac enrichment is anti-correlated with
                                     repressive marks such as H3K27me3 and H3K64me3 (Figure 2—figure supplement 1D). Furthermore,
                                     we find H3K64ac strongly enriched at enhancers (Figure 2A), with a preference for active enhancers,
                                     where it co-localizes with established enhancer marks such as H3K27ac, H3K4me1, and p300-binding
                                     (Figure 2D; Creyghton et al., 2010; Rada-Iglesias et al., 2011). Multiple single gene validations by
                                     ChIP-qPCR confirmed the genome-wide data and also revealed that H3K64ac levels are very low at
                                     repetitive elements (Figure 2—figure supplement 2A,B), where H3K64me3 is highly enriched (Daujat
                                     et al., 2009), again indicating opposing genomic localizations for these two marks.
                                         To study H3K64ac in a dynamic system, we followed the kinetics of H3K64ac during ES cell
                                     differentiation (Figure 3A). In pluripotent ES cells, H3K64ac is strongly enriched at active pluripotency-
                                     associated genes such as Nanog, Pou5f1 and Dppa3, whereas after retinoic acid-induced differentiation
                                     this enrichment shifts towards active differentiation-associated genes (e.g., Hoxb3 and Hoxd3, Pax6)
                                     demonstrating that H3K64ac levels reflect transcriptional activity during differentiation. Since we
                                     found H3K64ac tightly associated with transcribed regions, we next asked if H3K64ac is enriched on

Di Cerbo et al. eLife 2014;3:e01632. DOI: 10.7554/eLife.01632                                                                                    4 of 23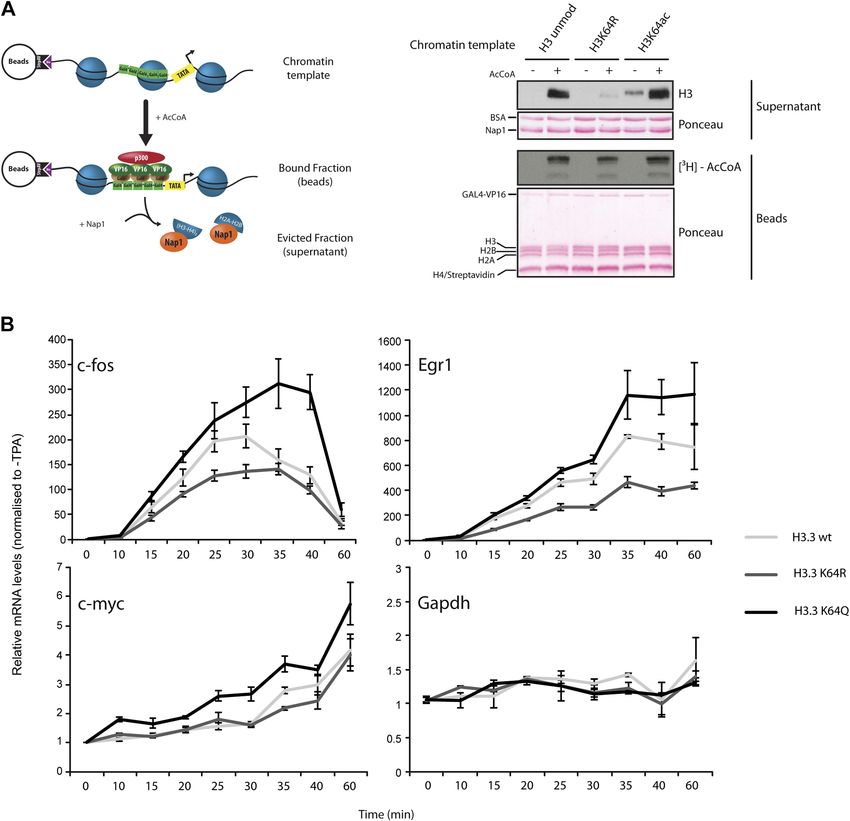
Research article Genes and chromosomes
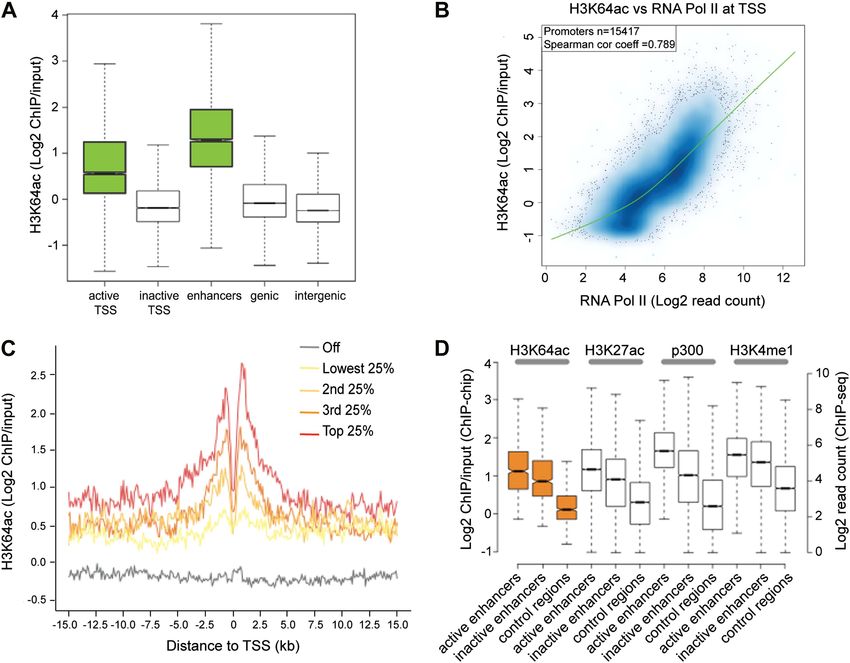
Figure 2. H3K64ac is enriched genome-wide at active regulatory regions. (A) H3K64ac is predominantly localized to active TSS and enhancers in mouse
ES cells (see also D). Boxplot showing H3K64ac signal intensity (log2 ChIP/input) for all microarray probes at active TSS, inactive TSS, enhancers, gene
bodies, and intergenic regions. (B) Comparison of H3K64ac and RNA Pol II at TSS. Scatterplot showing signal density distribution and global correlation.
The green line is a loess-fitted trend line. (C) Meta-gene plot showing H3K64ac enrichment around TSS grouped according to their expression level.
(D) Boxplot comparing H3K64ac to ‘enhancer-specific’ histone modifications and p300 levels (Creyghton et al., 2010) at active enhancers, inactive
enhancers and control regions (enhancer regions shifted by 100 kb). H3K64ac levels were measured by ChIP-on-chip (left Y axis), whereas the other
modifications and p300 by ChIP-seq (right Y axis).
DOI: 10.7554/eLife.01632.007
The following figure supplements are available for figure 2:
Figure supplement 1. H3K64ac distribution within active chromatin.
DOI: 10.7554/eLife.01632.008
Figure supplement 2. Genome-wide data validation by ChIP-qPCR.
DOI: 10.7554/eLife.01632.009
specific H3 variants. In line with previous findings that H3.3 has covalent modifications associated with
transcriptionally active chromatin (Hake et al., 2006), we found the highest enrichment of H3K64ac on
the H3 variant H3.3 (Figure 3B, Figure 3—figure supplement 1A). Importantly these experiments
also show that mutation of K64 to R results in a loss of detection of H3 by the H3K64ac antibody used
(Figure 3—figure supplement 1B), suggesting high specificity of the antibody.
Our staining and ChIP data suggested mutually exclusive distribution patterns of H3K64 acetylation
and methylation. To corroborate this in a functional model, we made use of imprinted loci; an ideal
system to study potentially opposing histone marks, as one allele is transcriptionally silent whilst the
other one is active (Singh et al., 2010). We analysed five imprinting control regions (ICRs) and in each
Di Cerbo et al. eLife 2014;3:e01632. DOI: 10.7554/eLife.01632 5 of 23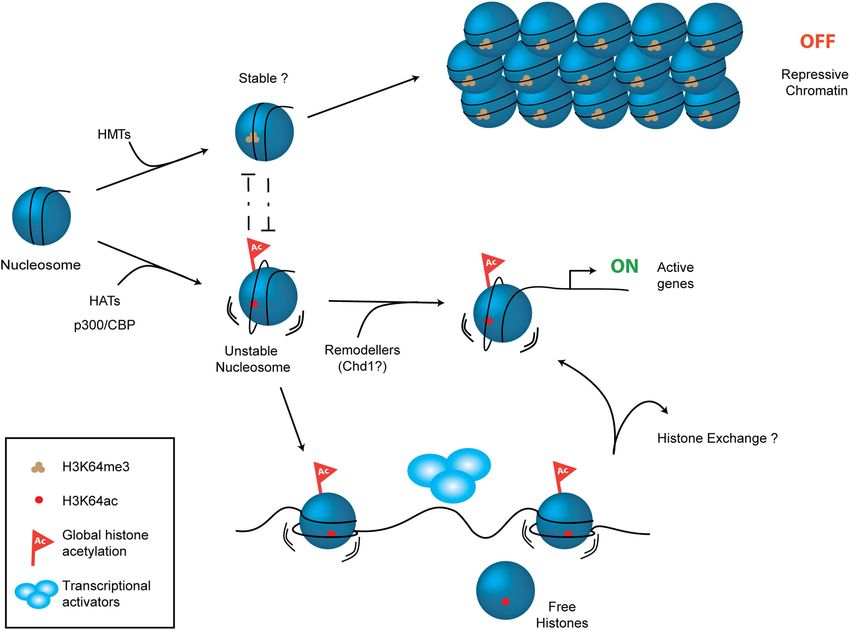
Research article                                                                                                       Genes and chromosomes

Figure 3. H3K64ac is enriched on active genes. (A) ChIP analysis of H3K64ac on pluripotency genes and differentiation-specific genes. Real-time PCR analysis
for indicated promoter regions and gene desert in undifferentiated (yellow bars) or retinoic acid-induced (blue bars) ES cells. (B) Distribution of H3K64ac among
the H3 variants. Flag-HA-tagged histones H3.1, H3.2, or H3.3 were immunoprecipitated and probed with H3K64ac antibody. Average quantification of
three biological replicates (±SD) showing H3K64ac signal over HA relative to H3.1. (C) The active alleles of ICRs are specifically marked by H3K64ac. Native ChIP
performed on primary embryonic fibroblasts of (C57Bl/6 x JF1) F1 genotype followed by radioactive PCR across polymorphic nucleotides between the paternal
JF1 (M. m. molossinus) and the maternal C57BL/6J (B6) genomes. Single-strand conformation polymorphisms (SSCP) were revealed by electrophoresis
through a non-denaturing agarose gel. The left panels show PCRs on control genomic DNAs to depict the SSCP polymorphisms used. In the input
chromatin (input), the parental were equally represented at the loci analysed. U, unbound fraction; B, bound fraction; M, maternal allele; P, paternal allele.
DOI: 10.7554/eLife.01632.010
The following figure supplements are available for figure 3:
Figure supplement 1. Immunoblots of H3K64ac distribution among H3 variants.
DOI: 10.7554/eLife.01632.011
Figure supplement 2. The active alleles of ICRs are specifically marked by H3K64ac.
DOI: 10.7554/eLife.01632.012

                                       case we found that the transcriptionally active alleles were specifically enriched in H3K64ac, whereas
                                       the inactive ones were enriched in H3K64me3 (Figure 3C, Figure 3—figure supplement 2). These
                                       data suggest that H3K64ac and H3K64me3 can define functionally opposing chromatin states.

                                       H3K64ac can be set by p300/CBP
                                       To identify the enzyme(s) responsible for H3K64ac, we systematically depleted candidates from dif-
                                       ferent HAT families. In these assays, knockdown of p300 and CBP, but not of other HATs decreased the
                                       steady-state levels of H3K64ac (Figure 4A, Figure 4—figure supplement 1A). This decrease was
                                       most pronounced at p300/CBP-specific genomic target regions (Figure 4B). In line with this, overex-
                                       pression of p300 resulted in increased levels of H3K64ac (Figure 4C, Figure 4—figure supplement 1B),
                                       and p300 and H3K64ac distributions showed a strong correlation (Figure 4—figure supplement 1C).
                                       Moreover, p300 and CBP can acetylate H3K64 in vitro on free H3 (Figure 4D) and within chromatin
                                       (Figure 4—figure supplement 1D). Altogether these data clearly establish p300/CBP as H3K64
                                       acetyltransferases, not excluding the presence of additional H3K64 acetyltransferases.

Di Cerbo et al. eLife 2014;3:e01632. DOI: 10.7554/eLife.01632                                                                                            6 of 23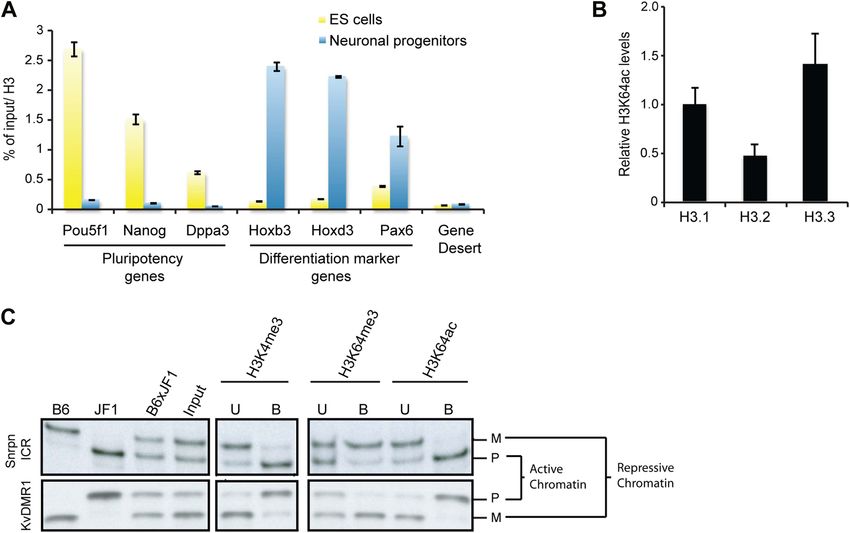
Research article                                                                                                 Genes and chromosomes

Figure 4. p300 acetylates H3K64 in vivo and in vitro. (A) siRNA-mediated depletion of HATs (as indicated) in MCF7 cells. Immunoblot analysis of global
H3K64ac levels and additional modifications as controls for siRNA efficiency. Anti-H3 blot and Ponceau staining are shown as loading controls. (B) ChIP
analysis of H3K64ac enrichment on different mouse genomic regions (as indicated) upon depletion of p300/CBP (yellow) compared to the control
knock-down (scramble, blue). (C) Overexpression of p300 in HEK293 cells. Control (empty vector) or p300 overexpressing cells co-expressed mCherry
(red, top panel) and were assessed for H3K64ac levels (green) in immunoflourescence. (D) In vitro HAT assay with p300 or CBP using recombinant H3 (wt
or K64A mutant) as substrate and probed with the H3K64ac antibody (top panel). Ponceau staining as loading control (middle panel) and H3K9ac
western blot as activity control (bottom panel) are shown.
DOI: 10.7554/eLife.01632.013
The following figure supplements are available for figure 4:
Figure supplement 1. Validation and supporting experiment to establish p300 activity on H3K64.
DOI: 10.7554/eLife.01632.014

Di Cerbo et al. eLife 2014;3:e01632. DOI: 10.7554/eLife.01632                                                                                    7 of 23
Research article                                                                                          Genes and chromosomes

                                   H3K64ac can increase nucleosome instability
                                   Given the location of H3K64ac on the nucleosome’s lateral surface, a potential mechanism is that it acts
                                   through modulating ATP-dependent chromatin remodelling and/or nucleosome stability. To investigate
                                   this, we produced recombinant histone H3 acetylated on K64 in Escherichia coli using site-specific
                                   genetically directed incorporation of acetyl-lysine (Neumann et al., 2009; Figure 5—figure supple-
                                   ment 1A,B). To address effects on chromatin remodelling, we incubated H3K64ac and unmodified
                                   nucleosomes with two different chromatin remodelers belonging to two different Snf2 subfamilies,
                                   Chd1 and RSC (Flaus et al., 2006; Clapier and Cairns, 2009). Our results show that Chd1 repositioned
                                   H3K64-acetylated nucleosomes faster than unmodified nucleosomes. This was not the case when we
                                   used the RSC enzyme (Figure 5—figure supplement 2). This suggests that acetylation of H3K64 could
                                   differentially affect remodelling enzymes. Next, we sought to investigate whether H3K64ac also
                                   impacts on passive fluctuations in nucleosome structure and interrogated whether H3K64ac affects the
                                   stability of DNA association with histone octamers within nucleosomes. To do this, we attached fluorescent
                                   dyes to specific sites on the DNA, 35 bp from each end of the nucleosomal DNA, and performed FRET
                                   measurements (Neumann et al., 2009). Using this strategy, we observed that the FRET interaction
                                   for H3K64ac nucleosomes was more sensitive to salt-disruption than unmodified nucleosomes at NaCl
                                   concentrations ranging between ∼0.5 M and 1.0 M (Figure 5A). In parallel, we also measured the
                                   salt-dependent nucleosome stability by single-molecule FRET, which again resulted in a lower stability of
                                   H3K64ac nucleosomes (Figure 5—figure supplement 3). Together these data demonstrate a decreased
                                   stability of H3K64ac nucleosomes, distinguishing this acetylation from H3K56ac that was reported not
                                   to significantly affect nucleosome stability under comparable conditions (Neumann et al., 2009).
                                       Modifications of histones that affect interactions between the H3–H4 tetramer and DNA also have
                                   the potential to influence the efficiency of chromatin assembly. To address whether H3K64ac affects
                                   the affinity of histone–DNA binding, we performed competitive nucleosome reconstitution assays
                                   (Thåström et al., 2004). Figure 5B shows that H3K64ac reduces the level of nucleosome assembly,
                                   relative to unmodified H3, indicating that H3K64 acetylation reduces histone–DNA binding affinity. In
                                   contrast, acetylation at H3K9 had no detectable effect (Figure 5A,B), illustrating functional differences
                                   between acetylation of lateral surface and histone tail lysines. In concert, these observations demon-
                                   strate that H3K64ac directly influences histone–DNA association and nucleosome stability. This could
                                   provide a mechanistic explanation as to why H3K64ac is found in vivo at sites where increased nucle-
                                   osome mobility/instability is required, such as the TSS of active genes (Segal et al., 2006).
                                       In vivo, one of the most dramatic chromatin-reorganization events that require nucleosome instability
                                   occurs during spermatogenesis. In mammalian elongating spermatids, histones are initially replaced by the
                                   transition proteins and then by protamines (Gaucher et al., 2010, 2012). In spermatocytes and round
                                   spermatids H3K64ac was below the limit of detection. However, the levels of H3K64ac dramatically
                                   increased in elongating spermatids (Figure 5C,D). At approximately the same time, we also detected the
                                   presence of some specific H3 tail acetylations (Figure 5—figure supplement 4A). Notably, we observed
                                   this increase in H3K64ac precisely during the period of nucleosome disassembly and replacement of his-
                                   tones by transition proteins in spermiogenesis. Our present data suggest a potential role for lateral surface
                                   modifications, such as H3K64ac, in this replacement process by creating a less stable, more ‘open’ chroma-
                                   tin state. In contrast to this, H3K64me3 is enriched in the part of the spermatid where genomic regions that
                                   undergo late histone replacement are located, suggesting that H3K64me3 may ‘stabilize’ particular regions
                                   of chromatin thereby protecting them from histone exchange (Figure 5—figure supplement 4B).

                                   H3K64ac can promote histone eviction and facilitate transcription
                                   To test whether H3K64ac can indeed promote histone displacement from chromatin, we assembled
                                   chromatin with unmodified H3, H3K64R, or H3K64ac octamers on a template containing five GAL4-binding
                                   sites in front of a MLP promoter (Figure 6—figure supplement 1) and performed a histone eviction assay
                                   (Figure 6A, left panel). Using this assay, we detected more H3 in the evicted fraction from H3K64ac chro-
                                   matin than from H3K64R chromatin (Figure 6A, right panel, Figure 6—figure supplement 2A), suggesting
                                   that the destabilization introduced by H3K64ac facilitates histone displacement and eviction. This could
                                   explain at least in part how H3K64ac can directly impact on nucleosome stability at active promoters and
                                   is in line with our observation that H3K64ac is associated with regions of the genome that are transcription-
                                   ally active or require histone exchange/turnover. Of note, we detected equivalent binding of Nap1 to each
                                   of the H3 species used (unmodified, K64R, or K64ac) indicating that the observed difference in histone
                                   eviction is not due to differential Nap1 histone binding (Figure 6—figure supplement 2B).

Di Cerbo et al. eLife 2014;3:e01632. DOI: 10.7554/eLife.01632                                                                            8 of 23
Research article Genes and chromosomes
Figure 5. H3K64 acetylation affects DNA-octamer interactions. (A) H3K64ac nucleosomes are more sensitive to salt-induced disruption in in vitro FRET
assays. Left, different views of a nucleosome with H3K64 highlighted in blue (spacefill) and the internal positions of the dye-labeled bases 35 bp from the
end of the nucleosome. Right, the average (±s.e.) of three separate titrations is shown for unmodified (black squares), H3K9ac (unfilled squares), and
H3K64ac nucleosomes (unfilled triangles). (B) Competitive in vitro nucleosome assembly reactions suggest that H3K64ac weakens histone–DNA interac-
tions. Unmodified, H3K9ac, and H3K64ac nucleosomes were assembled in the presence of an excess of non-specific competitor DNA. The average (±s.e.)
of three independent competitive assembly reactions is shown. (C) In spermatogenesis H3K64ac levels are high in elongating spermatids during the wave of
massive chromatin remodelling. Schematic of mouse spermatogenesis (top). Immunofluorescence stainings (IF) show high H3K64ac levels in elongating
spermatids (E) and below detection limit in spermatocytes (P) and round spermatids (R). Scale bar, 5 µm. (D) Immunohistochemistry stainings (IHC) on
sections of mouse testis tubules. H3K64ac (brown) is enriched in elongating spermatids (stages IX-X), which are present near the lumen. Scale bar, 20 μm.
DOI: 10.7554/eLife.01632.015
The following figure supplements are available for figure 5:
Figure supplement 1. Validation of the substrates used in the in vitro assays.
DOI: 10.7554/eLife.01632.016
Figure supplement 2. Effect of H3K64ac on repositioning by RSC and Chd1.
DOI: 10.7554/eLife.01632.017
Figure supplement 3. Single-molecule analysis of unmodified and H3K64ac salt-dependent nucleosome stability.
DOI: 10.7554/eLife.01632.018
Figure supplement 4. H3 acetylation and H3K64me3 stainings in spermatogenesis.
DOI: 10.7554/eLife.01632.019
Figure supplement 5. Structural analysis of H3K64 interactions.
DOI: 10.7554/eLife.01632.020
Finally, to demonstrate a function for H3K64ac in gene expression in vivo, we expressed wildtype H3.3,
H3.3K64Q (acetylated lysine mimetic) and H3.3K64R (retains positive charge but is non-acetylatable) in
NIH3T3 cells (Figure 6—figure supplement 3A) and assayed for effects in TPA-dependent early-response
gene activation. In this setup, H3K64Q promoted the expression of certain genes, such as c-fos, Egr1,
Di Cerbo et al. eLife 2014;3:e01632. DOI: 10.7554/eLife.01632 9 of 23Research article Genes and chromosomes Figure 6. H3K64ac can promote histone eviction and facilitate transcription. (A) H3K64ac promotes histone eviction. Schematic of eviction assay (left) shows chromatin templates assembled on a biotin-labeled pG5-MLP promoter fragment. Recruitment of transcriptional activators and p300 causes displacement of histone octamers, and histones can be trapped onto a supercoiled plasmid (not shown) by Nap1. Immunoblot of the evicted fraction (right, supernatant) with anti-H3 antibody shows the total amount of H3 released from unmodified H3, H3K64R, or H3K64ac chromatin templates in the presence or absence of acetyl-CoA. Ponceau staining as loading control and autoradiography (3H-acetyl-CoA incorporation) on the immobilized fraction as control for p300 activity are shown. (B) The acetylation mimic H3K64Q promotes transcription of early-response genes. NIH3T3 cells overexpressing either wild type, K64R, or K64Q FlagHA-H3.3 were stimulated with 25 nM TPA for the indicated times. mRNA levels of the indicated genes were analysed by qPCR. Gapdh is shown as control gene. Average of three experiments (±s.e.) are shown. DOI: 10.7554/eLife.01632.021 The following figure supplements are available for figure 6: Figure supplement 1. Validation of the chromatin templates used in the in vitro assay. DOI: 10.7554/eLife.01632.022 Figure supplement 2. Control experiments for the eviction assay involving the role of Nap1. DOI: 10.7554/eLife.01632.023 Figure supplement 3. Controls for H3.3 expression and gene induction. DOI: 10.7554/eLife.01632.024 Di Cerbo et al. eLife 2014;3:e01632. DOI: 10.7554/eLife.01632 10 of 23
Research article                                                                                               Genes and chromosomes

                                   and c-myc, (Figure 6B), above the levels obtained when assaying wildtype H3.3 or the acetylation-
                                   deficient H3.3K64R. Notably, expression of control genes such as Gapdh and Hsp70 was unaffected
                                   (Figure 6B, Figure 6—figure supplement 3B). The observed transcriptional effects due to a single
                                   acetylation mimic within the globular domain strongly suggest that H3K64ac has an intrinsic ability to
                                   impact upon transcription mechanisms in vivo. Taken together, our results provide novel mecha-
                                   nistic insights into how a single histone modification, H3K64ac, within a nucleosome could specif-
                                   ically regulate nucleosome stability and transcription.

                                   Discussion
                                   We have identified and functionally characterized a novel histone modification located on the octamer’s
                                   lateral surface in close proximity to the DNA backbone of the inner gyre. The main chain atoms of H3K64
                                   are in direct contact with the DNA phosphate backbone and this places the H3K64 side chain close enough
                                   to potentially contact the DNA, with the average H3K64 side-chain nitrogen-to-DNA distance approx-
                                   imately 6.1 Å (Figure 5—figure supplement 5A,B). Lysine acetylation results in increased bulk and charge
                                   neutralization of the lysine side-chain, and it is likely that acetylation of lateral surface lysines (e.g., H3K64)
                                   could interfere with histone–DNA interactions. Interestingly, in the high-resolution crystal structure of the
                                   nucleosome (PDB 1KX5; Davey et al., 2002) H3K64 is found to be involved in an extensive network of
                                   water-mediated hydrogen bonds that link numerous water molecules, histone side- and main-chain atoms
                                   and the DNA (Figure 5—figure supplement 5C). Acetylation of H3K64 would be predicted to disrupt this
                                   hydrogen bond network. Davey et al. estimate from their crystallographic analysis that water-bridged inter-
                                   actions between histones and DNA are as important to nucleosome stability as the direct histone–DNA
                                   contacts (Davey et al., 2002). These water-bridges provide a plasticity that allows the histone core to
                                   adapt to myriad variations in the DNA sequence and conformation. They postulate that disruption
                                   of even a single water–bridge interaction (e.g., acetylation of H3K64) has the potential to significantly
                                   affect nucleosome stability. This is indeed fully supported by our findings—we demonstrate that H3K64ac
                                   exerts a direct effect on nucleosome stability and facilitates histone eviction.
                                        H3K64 acetylation could cause the reduced FRET signal we observed in the salt-dependent disso-
                                   ciation assay in multiple ways. A pre-requisite for the loss of histones from the nucleosome is the
                                   dissociation of DNA from the surface of the histone octamer. Given the proximity of H3K64ac to DNA
                                   it is likely that it may facilitate this dissociation. This loss of histone–DNA contacts caused by H3K64ac
                                   may aid the loss of H2A–H2B dimers, contributing to the observed change in FRET signal. Alternatively,
                                   following the loss of H2A–H2B dimers H3K64ac may favour dissociation of DNA from histones H3 and
                                   H4, or H3K64ac may affect water-mediated hydrogen bonds that directly influence the association
                                   of H2A–H2B dimers. These modes of action are not mutually exclusive and they are consistent with the
                                   observed effects of H3K64ac in chromatin assembly in vitro. They also all have the potential to influence
                                   chromatin organization during cycles of assembly/disassembly at gene regulatory elements. We detect
                                   an approximately 60 mM decrease in the salt-dependent stability between H3K64ac and unmodified/
                                   H3K9ac nucleosomes. This difference in salt stability of H3K64ac appears to be in a range consistent
                                   with the observed changes in nucleosome dynamics. Gansen et al. (2013) showed that simultaneous
                                   acetylation of all sites in H3 results in a decrease in nucleosome salt stability of approximately 100–130 mM
                                   NaCl. Furthermore, a fundamental change in the histone content of the nucleosome via incorporation
                                   of the histone H2A variant H2A.Z, increases salt stability by up to ∼70 mM (Park et al., 2004). Moreover,
                                   the observed enrichment of H3K64ac at active gene promoters and during chromatin reorganization
                                   in spermiogenesis argues for a role of H3K64ac in creating an open, permissive chromatin state.
                                   Indeed, this is supported by increased histone eviction and the finding that a mutation mimicking
                                   constitutive acetylation, H3K64 to Q, can promote transcription of at least certain genes. We consider
                                   a twofold higher transcription due to a single histone mutation as biologically important.
                                        Additional lysines on the octamer’s lateral surface have been found to be acetylated, such as
                                   H3K56, which is located closer to the ends of the nucleosomal DNA. Interestingly, these acetylations
                                   can mediate distinct effects on nucleosomes (this work and Neumann et al., 2009; Tropberger et al.,
                                   2013). Thus, specificity exists in the way that the biomechanical properties of nucleosomes are
                                   affected differentially by acetylation at different sites within the globular domain of H3.
                                        Despite considerable efforts, we have so far been unable to detect specific readers, or binders of
                                   H3K64ac. Consequently, we prefer a model in which it acts via direct effects. However, H3K64ac may also
                                   function by preventing H3K64me3 from being laid down at key genomic regions. We have previously
                                   suggested that methylation of H3K64 is involved in the creation of repressive chromatin states (Daujat

Di Cerbo et al. eLife 2014;3:e01632. DOI: 10.7554/eLife.01632                                                                                11 of 23
Research article Genes and chromosomes
Figure 7. Schematic model for H3K64ac function. H3K64ac (bottom) helps to create an open, permissive chromatin environment. In contrast to this
H3K64me3 could lock the nucleosomes in a stable, repressive conformation (top), resulting in an inactive chromatin environment. H3K64ac can directly
act by affecting nucleosome dynamics, but also indirectly by blocking methylation of the same residue.
DOI: 10.7554/eLife.01632.025
et al., 2009; Lange et al., 2013). Thus, H3K64ac might serve to prevent the nucleosome from adopting
a repressive conformation, thereby maintaining chromatin in a transcriptionally competent state. Our
working model (Figure 7) proposes that opposing chromatin states can be defined via the mutually
exclusive presence of H3K64ac or H3K64me3. This model is reinforced by the observed distinct and
largely mutually exclusive genomic distribution patterns of these two H3K64 modifications.
The data provided here strengthen the concept that lateral surface modifications play a key role in
regulating chromatin function, as initially proposed by others (Cosgrove et al., 2004; Mersfelder and
Parthun, 2006) and us (Tropberger and Schneider, 2013). They also extend our understanding of
chromatin regulation and provide mechanistic insights into how chromatin organization is spatially and
temporally controlled by globular domain modifications. The identification of novel pathways regulating
chromatin function has also the potential to highlight druggable targets for diseases in which chromatin
states have been distorted.
Materials and methods
MS/MS analysis of acetylated H3
In vivo modified histone H3 was digested either with trypsin or chymotrypsin and analyzed by nanoLC-
MS as previously published (Waldmann et al., 2011). For both digests, STAGE tip-assisted sample
purification was achieved essentially as described (Rappsilber et al., 2007). Desalted samples were
subsequently analyzed using nanoflow (Agilent 1200 nanoLC, Germany) LC-MS/MS on a linear ion trap
(LIT)-Orbitrap (LTQ-Orbitrap XL) mass spectrometer (ThermoFisher, Germany). Peptides were eluted
with a linear gradient of 10–60% buffer B (80% ACN and 0.5% acetic acid) at a flow rate of 250 nl/min
Di Cerbo et al. eLife 2014;3:e01632. DOI: 10.7554/eLife.01632 12 of 23Research article Genes and chromosomes
over 40 or 60 min depending on the experiment. Data were acquired using a data-dependent ‘top
5’ method, dynamically choosing the five most abundant precursor ions from the survey scan (mass
range 250–1650 Th) in order to isolate and fragment them in the LTQ. All data were acquired in the
profile mode and dynamic exclusion was defined by a list size of 500 features and exclusion duration
of 30 s with a MMD of 10 ppm. Early expiration was disabled to decrease the resequencing of isotope
clusters. The isolation window for the precursor ion selection was set to 2.0 Th. Precursor ion charge
state screening was enabled, and all unassigned charge states as well as singly charged ions were
rejected. For the survey scan a target value of 10,00,000 (1000 ms maximal injection time) and a reso-
lution of 60,000 at m/z 400 were set (with lock mass option enabled for the 445.120024 ion), whereas
the target value for the fragment ion spectra was limited to 10,000 ions (200 ms maximal injection
time). The general mass spectrometric conditions were: spray voltage, 2.3 kV; no sheath and aux-
iliary gas flow; ion transfer tube temperature, 150°C; collision gas pressure, 1.3 mTorr; normalized
collision energy using wide-band activation mode; 35% for MS2. Ion selection thresholds were 500
or 1000 counts for MS2 depending on the experiment. An activation q = 0.25 and activation time of
30 ms was applied.
MS data were processed into peak lists by DTASuperCharge 2.0b1 (part of the MSQuant 2.0b7
software environment Mortensen et al., 2010) and searched with Mascot 2.2 against the human
International Protein Index protein database (IPI, version 3.65) combined with frequently observed
contaminants and concatenated with the reversed versions of all sequences. The MMD for monoiso-
topic precursor ions and MS/MS peaks were restricted to 5 ppm and 0.8 Da, respectively. Enzyme
specificity was set to trypsin (with a maximum of two missed cleavages) allowing cleavage N-terminal
to proline and C-terminal to aspartate. Modifications were cysteine carbamidomethylation (fixed) and
protein lysine acetylation, lysine butyrylation, lysine propionylation, lysine and arginine methylation (all
states), lysine formylation, serine/threonine/tyrosine phosphorylation, deamidation (asparagine and
glutamine) and methionine oxidation (variable). Alternatively, we searched the chymotrypsin digested
sample with low chymotrypsin specificity (cleavage carboxyterminal to L, M, W, F, and Y allowing a
maximum of four missed cleavages). Protein and peptide identifications were further analyzed and
manually verified by inspection of chromatograms and spectra.
To confirm the identity of the tryptic peptide K(Ac)LPFQR (Figure 1A) a synthetic peptide
(Biosyntan, Berlin) harbouring the sequence STELLIRK(ac)LPFQRLVGC was trypsin digested and
demonstrated the generation of three tryptic peptides, in particular the peptide K(ac)LPFQR. The
MS/MS fragment spectrum of the latter was virtually identical to the one derived from the endoge-
nous tryptic peptide. Both spectra contain two significant immonium ion peaks (at m/z 143 and m/z 126)
that indicate the presence of acetylated lysine at the amino terminus (Trelle and Jensen, 2008). In
addition two chymotryptic peptides with the sequence LIRK(Ac)LPF (Figure 1A) and IRK(Ac)LPF
(Figure 1—figure supplement 1A) confirm the presence of an acetylated lysine at K64 of endoge-
nous histone H3.
3D modeling
The acetylation of H3K64 was modelled on the 1KX5 Xenopus laevis nucleosome core particle struc-
ture (Davey and Richmond, 2002). Pictures and modifications were generated using PyMOL (http://
www.pymol.org).
Cell culture
Mouse embryonic stem (ES) cells used for chromatin immunoprecipitation (ChIP) experiments were
derived and cultivated as described previously (Mohn et al., 2008). ES cells differentiation was car-
ried out as described previously (Bibel et al., 2007). Briefly, embryonic stem cells were cultured
feeder-free for three to five passages after which LIF was withdrawn to allow formation of cellular
aggregates in liquid culture. After 4 days, retinoic acid (RA) was added to induce neuronal progenitor
(NP) formation for another 4 days before chromatin isolation. All the other mammalian cell lines
were cultured in DMEM (PAA, GE Healthcare Life Sciences, Sweden) medium supplemented with
10% FCS, 2 mM L-glutamine, 100 U/ml Penicillin and 0.1 mg/ml Streptomycin. For the HDAC inhibi-
tors treatment either Na-butyrate (10 mM, overnight) or Trichostatin A (TSA, 0.2 µM, 48 hr) were used.
Antibody characterization
For characterization of the H3K64ac antibody (Active motif, Carlsbad, CA, cat no. 39545, lot 32908001)
immuno-dot blotting and peptide competitions were carried out as described previously (Daujat
Di Cerbo et al. eLife 2014;3:e01632. DOI: 10.7554/eLife.01632 13 of 23Research article Genes and chromosomes
et al., 2009). Histone H3 acetylated peptides corresponding to amino-acid residues 1–15 (for K9),
12–24 (for K18), 1–27 (for K23), 1–27 (for K9-K14-K23), and 51–62 (for K56) and histone H3 methylated
peptides corresponding to amino-acid residues 57–71 (for K64me1, me2 and me3) were used in these
assays.
Mononucleosome preparation and limited trypsin digestion
1 × 10⁸ mouse NIH3T3 cells were harvested, washed in PBS, resuspended in cold hypotonic buffer
(5 mM KCl, 1.5 mM MgCl2, 20 mM Hepes pH 7.5, 1x protease inhibitors (Roche, Switzerland), 5 mM
Na-butyrate) at a density of 2 × 10⁷ cells/ml and pelleted. Cells were resuspended in the same buffer
at 4 × 10⁷ cells/ml and incubated on ice for 10 min. Cell suspension was dounced 12 times with the
S pestle and store on ice for 30 min. After 10 min of centrifugation at 500×g at 4°C, released nuclei
were resuspended in 1 ml of isolation buffer-100 (0.25 M sucrose, 100 mM NaCl 1.5 mM MgCl2, 1 mM
CaCl2, 10 mM Tris–HCl pH 7.5, 1x protease inhibitors, 5 mM Na-butyrate) and stored 10 min on ice.
After 5 min of centrifugation at 4°C nuclei were resuspended in 1 ml of isolation buffer-250 (same as
previously with 250 mM NaCl) and stored 10 min on ice. Nuclei were centrifuged at 4000×g for 10 min
at 4°C and resuspended in 1 ml of isolation buffer-0 (same as previously with no NaCl) for DNA
concentration determination. The chromatin was then digested in the same buffer for 30 min at 37°C
(50 units/mg DNA of Micrococcal Nuclease in the presence of 3 mM CaCl2) and stopped by the
addition of 10 mM EDTA. Nuclei were centrifuged at 10000×g for 10 min and resuspended in 1 ml of
lysis buffer (650 mM NaCl, 5 mM EDTA pH 8.0, 10 mM Tris–HCl pH 6.8, 1x protease inhibitors, 5 mM
Na-butyrate) and incubated on ice for 30 min. Lysed nuclei were centrifuged at 16500×g for 10 min at
4°C and supernatant containing digested chromatin was loaded on a 5–40% sucrose gradient and
centrifuged at 40,000 rpm (SW41 rotor) for 16 hr at 4°C. 600 µl fractions were then collected and the
concentration of chromatin was determined at OD 260 nm. Chromatin of each fraction was either
analysed by electrophoresis on a 1% agarose gel in 0.5x TBE or by SDS-PAGE to assess DNA size and
core histones integrity. Fractions containing mononucleosomes were pooled and used for limited
trypsin digestion.
10 µg of DNA corresponding to mononucleosomes were digested by 20 and 30 µg of trypsin for
30 min at 26°C in 250 µl final of PBS. This mild digestion cuts the N-terminal histones tails protruding
out from the nucleosome and leaves the H3 core region (protected by the DNA) mainly intact. Intact
or digested nucleosomes were analysed by SDS-PAGE and Western blotting for the presence of
N-terminal H3 acetylations (anti-H3K9ac; anti-H3K18ac; anti-H3K27ac) and H3K64 acetylation. H3
digestion pattern was controlled with an anti-H3 antibody.
ChIP analysis
ChIPs of histone modifications on native or crosslinked chromatin were performed with minor modifi-
cations of procedures described previously (Cuthbert et al., 2004; Daujat et al., 2009).
For native ChIPs nuclei were extracted and isolated over a sucrose cushion, resuspended in MNase
buffer (0.32 M sucrose, 50 mM Tris-HCl pH 7.5, 4 mM MgCl2, 1 mM CaCl2) and digested with 10 U
MNase (Thermo Fisher Scientific Inc., Waltham, MA) for at least 15 min at 37°C, so that mononuceo-
somes were released. This chromatin was incubated overnight with specific antibodies and then
precipitated with protein A/G Sepharose 4 fast flow beads (GE Healthcare Life Sciences). After washing
three times with increasing amount of salt (50 mM Tris-HCl pH 7.5, 10 mM EDTA, containing either
75 mM, or 125 mM, or 175 mM NaCl), immunoprecipitated DNA was eluted and purified.
For ChIPs on cross-linked chromatin ES cells were lysed and sonicated to produce chromatin
fragments of 0.5 Kb on average. Diluted chromatin equivalent to 2 × 10⁶ cells was subjected to immu-
noprecipitation overnight. Sepharose beads were used to recover chromatin. Precipitates were washed
10 min at RT two times in lysis buffer (50 mM HEPES/KOH pH 7.5, 500 mM NaCl, 1 mM EDTA, 1%
Triton X-100, 0.1% DOC, 0.1% SDS), once in DOC buffer (10 mM Tris pH 8, 0.25 mM LiCl, 0.5% NP40,
0.5% DOC, 1 mM EDTA) and once in TE and DNA was recovered as described previously (Dedon
et al., 1991; Orlando et al., 1997; Daujat et al., 2002). Quantitative real-time PCR were performed
using SybrGreen (Thermo Fisher Scientific Inc.) on an ABI Prism 7300 apparatus (Applied Biosystems,
France). The 5′ to 3′ sequences of the ChIP primers used for different genomic regions in qPCR are listed
in Supplementary file 1.
ChIP-on-chip of histone modifications were carried out as described previously (Mohn et al.,
2008).
Di Cerbo et al. eLife 2014;3:e01632. DOI: 10.7554/eLife.01632 14 of 23Research article Genes and chromosomes
For ChIP followed by PCR-SSCP to distinguish the parental alleles, primary MEFs were derived from
13.5 d.p.c. (C57BL/6 x JF1)F1 foetuses (genotype: [C57BL/6 x M. m. molossinus]F1). After ChIP, DNA
was extracted from the immunoprecipitated (B, bound) and unbound (U) chromatin. As a control mock
precipitation, we used a rabbit IgG antiserum against chicken IgI (Sigma-Aldrich, St. Louis, MO, cat no.
C2288, lot 21K4851). The maternal (M) and paternal (P) alleles were distinguished by radio-active PCR
amplification across nucleotides that were polymorphic between the paternal JF1 (M. m. molossinus)
and the maternal C57BL/6J (B6) genome. Primers used for PCR are listed in Supplementary file 1.
Following denaturation of the amplification products, single-strand conformation polymorphisms
(SSCP) were revealed by electrophoresis through a non-denaturing agarose gel (Gregory and Feil,
1999; Umlauf et al., 2004; Pannetier et al., 2008).
Microarray design, hybridization and analysis
ChIP samples were hybridized to custom tiling microarrays (Lienert et al., 2011) representing all well-
annotated promoters and the complete chromosome 19 with an average probe spacing of 100 bp
(NimbleGen Systems Inc., Madison, WI).
Sample labelling, hybridization and array scanning were performed according to the manufactur-
er’s protocols using a MAUI hybridization station and a NimbleGen MS200 slide scanner in combi-
nation with NimbleScan software (NimbleGen Systems Inc.). Further processing was done using R.
For analysis raw fluorescent intensity values were used to calculate log2 of the bound/input ratios
for each individual oligo. Subsequently, for comparison all arrays were normalized to a median log2 =
0 and scaled to have the same median absolute deviation using the ‘LIMMA’ R/Bioconductor
package (Smyth and Speed, 2003; Smyth, 2004). For boxplots, all microarray probes that overlap
the indicated genomic regions were grouped and log2 ChIP/Input values for every probe are dis-
played as one boxplot per class. Active and inactive TSS (activity cutoff defined according to
Lienert et al., 2011) contain probes that are in a 2-kb window (± 1 kb) around the respective tran-
scription start sites, ‘enhancers’ contains all probes overlapping the enhancer regions as defined by
Creyghton et al. (2010), ‘genic’ represents all probes that map to annotated genes without the
first 1000 bp to avoid overlap with the promoters, and ‘intergenic’ contains all remaining probes on
chromosome 19 that are not in any of the other groups to avoid overlap between the individual
classes.
The data discussed in this publication have been deposited in NCBI’s Gene Expression Omnibus
(Edgar et al., 2002) and are accessible through GEO Series accession number GSE35355 (http://www.
ncbi.nlm.nih.gov/geo/query/acc.cgi?acc=GSE35355).
Deep sequencing data and analysis
H3K27ac and p300 ChIPseq data were taken from Creyghton et al. (2010), H3K4me1 data from
Stadler et al. (2011), mRNA expression data from Lienert et al. (2011). Raw data was downloaded
from the NCBI Gene Expression Omnibus and the reads were mapped to the Mus musculus genome
(mm9) and transcriptome (RefSeq, downloaded on 07/17/2009) as previously described (Lienert et
al., 2011).
For promoter analysis, mapped reads were counted in a 2-kb window centred around all transcrip-
tion start sites without further normalization.
Enhancers were classified according to the definitions previously reported (Creyghton et al., 2010).
In brief, active enhancer regions required a significant enrichment for both, H3K4me1 and H3K27ac,
while inactive enhancers were defined as regions containing only H3K4me1 (Creyghton et al., 2010).
Total H3 ChIP-seq data to generate the meta plots around the TSSs and to calculate enrichments were
extracted from Mikkelsen et al., 2007. Read densities ± 15 kb around TSSs were binned in 1 kb win-
dows and plotted as mildly smoothed lines using R (lowess, f = 0.05).
Western blotting analysis and protein pull-down
For histone extraction, nuclei were isolated by incubating the cell pellets 10 min in TEB buffer (0.5%
Triton X-100 in PBS) and histones were acid extracted with 0.2 N HCl overnight at 4°C. After extrac-
tion, protein concentration was measured according to the Bradford method and equal amounts of
protein were separated on SDS-PAGE and transferred onto nitrocellulose membrane.
For nuclear extracts preparation, HeLa cell pellets were incubated with TEB buffer as before, but
then nuclei were incubated in extraction buffer (0.3% SDS, 0.8 M NaCl, 0.3% NP40) diluted in water to
a final NaCl concentration of 0.4 M and sonicated.
Di Cerbo et al. eLife 2014;3:e01632. DOI: 10.7554/eLife.01632 15 of 23Research article Genes and chromosomes
For H3 variants quantification, histones were acid extracted as described above from HEK293 cell
lines stably expressing different FlagHA-H3 variants and immunoprecipitated using anti-Flag beads
(Sigma-Aldrich). Bound FlagHA-tagged H3s were eluted by boiling in Leammli buffer. Quantification
was done using the ImageJ software and the ratio between specific H3K64ac and HA signals (loading
control) was calculated.
For Nap1 pull-down, His-tagged Nap1 was pre-incubated with different histone species in incuba-
tion buffer (10 mM Tris–HCl pH 8.0, 100 mM NaCl, 100 ng/µl BSA, 0.05% NP-40, 1 mM EDTA, 1 mM
DTT, 5% glycerol) for 30 min at 30°C 300 RPM. Samples were then supplied with nickel beads (His-
Select Nickel Affinity Gel, Sigma) and incubated for 4 hr on the wheel at 4°C. Bound material was
washed with wash buffer (10 mM Tris-HCl pH 8, 250 mM NaCl, 0.1% NP-40, 1 mM EDTA, 1 mM DTT, 5%
glycerol) and elution was achieved by boiling the beads in Leammli buffer.
Overexpression and siRNA knock-downs
For HATs overexpression, a tagged p300 HAT domain was cloned in pcDNA3 vector and 5 μg
of plasmid were transfected together with a carrier DNA plasmid (0.5 μg) expressing mCherry.
HEK293 cells were grown on poly-L-lysine-coated coverslips, transfected with the conventional cal-
cium-phosphate method and processed for immunofluorescence (see below for details) after 24 hr.
For HATs knock-down RNAiMAX (Invitrogen, Carlsbad, CA) was used and a reverse transfection
protocol was applied following the supplier’s instructions. The siRNAs used were an ON-target plus
SMART pool from Dharmacon (Thermo Fisher Scientific Inc.): p300, L-003486-00-0010; CBP, L-003477-
00-0010; GCN5, L-009722-00; PCAF, L-005055-00; scramble negative control, D-001810-10. hMof
siRNA was purchased from MWG (Eurofins, Germany) with sequence 5′-GUGAUCGAGUCUCGA
GUGArUrU-3′. Briefly, a mixture of 50 nM total of siRNA and lipofectamine were prepared in the wells
and subsequently MCF7 cells were plated on it and grown for 72 hr.
HAT assay
Full-length HATs were expressed and purified from Sf9 cells as described elsewhere (Kraus and
Kadonaga, 1998). Recombinant GST-tagged HAT domains were expressed in E. coli and then purified.
For the HAT assay, recombinant histones H3 (wt and K64A) and H4 were incubated with the specific
HAT in the presence of acetyl-CoA (without in case of mock reaction) in HAT buffer (50 mM Tris–HCl
pH8.0, 7% glycerol, 25 mM NaCl, 0.1 mM EDTA, 5 mM DTT) for 1 hr at 30°C. The reaction was then
analysed by western blotting with the specific H3K64ac antibody and the activity of the enzyme was
checked using antibodies against known specific targets.
Antibodies
Histone modifications primary antibodies: H3K4me3 (Millipore, Billerica, MA), H3K9ac (Cell Signaling,
Boston, MA), ChIP grade H3K9ac (Abcam, UK), H3K9ac (Millipore, Billerica, MA), H3K9me3 (Millipore),
H3K14ac (Millipore), H3K18ac (Cell Signaling), H3K18ac (Abcam), ChIP grade H3K27ac (Abcam),
H3K27me3 (Millipore), H3 (Abcam), H4K16ac (Santa Cruz Biotechnology Inc., Dallas, Texas).
Non-histone primary antibodies: HA (Abcam).
Immunofluorescence (IF) staining
Cells were fixed in 4% paraformaldehyde/2% sucrose for 15 min, washed three times in cold PBS and
permeabilised with 0.5% Triton X-100 in PBS for 20 min. After washing in PBS, cells were blocked in
3% BSA/PBS and then stained with specific primary antibodies overnight at 4°C. Fluorescent secondary
antibodies (FITC or RedX from Jackson Immunoresearch, UK) were then used for detection.
Coverslips were either directly mounted with Vectashield containing DAPI (Vector laboratories,
UK) or stained with DAPI for 10 min and then mounted with DABCO (Sigma-Aldrich).
Confocal microscopy was performed in a Leica TCS SP2/MP inverted confocal microscope using a
63× or 100× oil objective. Images were acquired along the Z-axis every 0.5 μm.
Immunofluorescence on tubules
Tubules of mice were prepared as previously reported (Kotaja et al., 2004). Cells were fixed in 90%
ethanol for 10 min at RT. They were permeabilised with 0.2% Triton X-100 and 0.5% saponine in PBS
for 15 min at RT and blocked with 5% milk in PBS. They were incubated with anti-H3K64me3 at 4°C
overnight, followed by incubation with Alexa488 conjugated secondary antibody for 30 min at 37°C.
Finally, cells were counterstained with DAPI and mounted in Vectashield with DAPI (Vector laboratories).
Di Cerbo et al. eLife 2014;3:e01632. DOI: 10.7554/eLife.01632 16 of 23You can also read