The structural basis for dynamic DNA binding and bridging interactions which condense the bacterial centromere - eLife
←
→
Page content transcription
If your browser does not render page correctly, please read the page content below
RESEARCH ARTICLE

                                    The structural basis for dynamic DNA
                                    binding and bridging interactions which
                                    condense the bacterial centromere
                                    Gemma LM Fisher1†, César L Pastrana2†, Victoria A Higman3†, Alan Koh4,
                                    James A Taylor1‡, Annika Butterer5§, Timothy Craggs6, Frank Sobott5,7,8,
                                    Heath Murray4, Matthew P Crump3, Fernando Moreno-Herrero2,
                                    Mark S Dillingham1*
                                    1
                                      DNA:protein Interactions Unit, School of Biochemistry, University of Bristol, Bristol,
                                    United Kingdom; 2Department of Macromolecular Structures, Centro Nacional de
                                    Biotecnologia, Consejo Superior de Investigaciones Cientificas, Madrid, Spain;
                                    3
                                      School of Chemistry, University of Bristol, Bristol, United Kingdom; 4Centre for
                                    Bacterial Cell Biology, Institute for Cell and Molecular Biosciences, Newcastle
                                    University, Newcastle, United Kingdom; 5Biomolecular and Analytical Mass
                                    Spectrometry Group, Department of Chemistry, University of Antwerp, Antwerpen,
*For correspondence:                Belgium; 6Department of Chemistry, University of Sheffield, Sheffield, United
mark.dillingham@bristol.ac.uk       Kingdom; 7Astbury Centre for Structural Molecular Biology, University of Leeds,
†
 These authors contributed          Leeds, United Kingdom; 8School of Molecular and Cellular Biology, University of
equally to this work                Leeds, Leeds, United Kingdom
Present address: ‡Laboratory of
Molecular Biology, National
Institute of Diabetes and
Digestive and Kidney Diseases,      Abstract The ParB protein forms DNA bridging interactions around parS to condense DNA and
National Institutes of Health,      earmark the bacterial chromosome for segregation. The molecular mechanism underlying the
Bethesda, United States;            formation of these ParB networks is unclear. We show here that while the central DNA binding
§
  Institute of Pharmacy and         domain is essential for anchoring at parS, this interaction is not required for DNA condensation.
Biochemistry, Johannes              Structural analysis of the C-terminal domain reveals a dimer with a lysine-rich surface that binds
Gutenberg-Universität Mainz,       DNA non-specifically and is essential for DNA condensation in vitro. Mutation of either the
Mainz, Germany
                                    dimerisation or the DNA binding interface eliminates ParB-GFP foci formation in vivo. Moreover,
Competing interests: The            the free C-terminal domain can rapidly decondense ParB networks independently of its ability to
authors declare that no             bind DNA. Our work reveals a dual role for the C-terminal domain of ParB as both a DNA binding
competing interests exist.          and bridging interface, and highlights the dynamic nature of ParB networks in Bacillus subtilis.
Funding: See page 21                DOI: https://doi.org/10.7554/eLife.28086.001

Received: 25 April 2017
Accepted: 02 December 2017
Published: 15 December 2017
                                    Introduction
Reviewing editor: Antoine M         Bacterial chromosomes are actively segregated and condensed by the ParABS system and condensin
van Oijen, University of
                                    (Wang et al., 2014; Song and Loparo, 2015). In B. subtilis, this machinery is physically targeted to
Wollongong, Australia
                                    the origin proximal region of the chromosome by eight palindromic DNA sequences called parS
   Copyright Fisher et al. This     (consensus sequence 50 -TGTTNCACGTGAAACA-30 ) to which the ParB (Spo0J) protein binds
article is distributed under the
                                    (Breier and Grossman, 2007; Lin and Grossman, 1998). These nucleoprotein complexes act as a
terms of the Creative Commons
                                    positional marker of the origin and earmark this region for segregation in a manner somewhat analo-
Attribution License, which
permits unrestricted use and        gous to eukaryotic centromeres and their binding partners.
redistribution provided that the       ParB is an unusual DNA binding protein. In addition to sequence-specific interactions with the
original author and source are      parS sequence, the protein also spreads extensively around the site for about 18 kbp (Breier and
credited.                           Grossman, 2007; Murray et al., 2006; Lynch and Wang, 1995). The mechanistic basis for this

Fisher et al. eLife 2017;6:e28086. DOI: https://doi.org/10.7554/eLife.28086                                                      1 of 25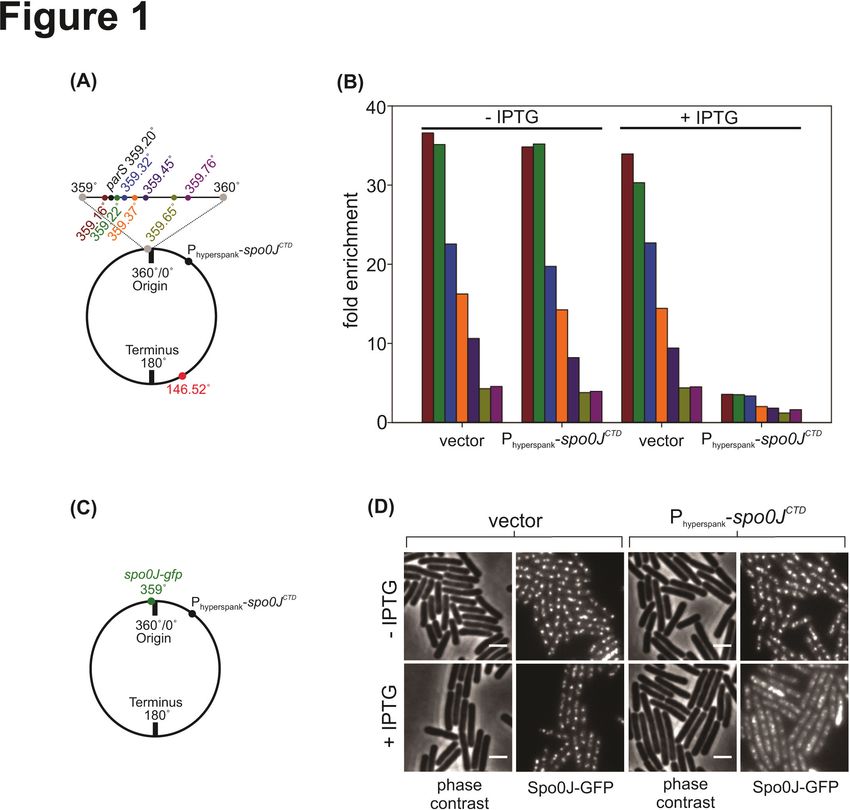
Research article                                                                          Biophysics and Structural Biology Genes and Chromosomes

                                    behaviour is not well understood and a matter of active debate. Earlier models envisioned a lateral
                                    1D spreading around parS to form a filament (Murray et al., 2006; Rodionov et al., 1999), princi-
                                    pally because spreading can be inhibited in a polar manner by ‘roadblocks’ placed to the side of
                                    parS sequences. However, ParB foci appear to contain fewer proteins than are necessary to form a
                                    filament, and single molecule analyses using direct imaging (Graham et al., 2014) and magnetic
                                    tweezers (Taylor et al., 2015) have shown that binding of DNA by ParB is accompanied by conden-
                                    sation. These ‘networks’ were inferred to be dynamic and poorly-ordered, consisting of several DNA
                                    loops between distally bound ParB molecules. In cells, they are presumably anchored at parS sites
                                    by sequence-specific interactions but must also contain many interactions with non-specific DNA
                                    (nsDNA), as well as self-association interactions that bridge ParB protomers to form DNA loops.
                                    Modelling suggests that a combination of 1D spreading and 3D bridging interactions can explain
                                    the condensation activity and recapitulate the polar effect of roadblocks on ParB spreading
                                    (Broedersz et al., 2014). Recently, single-molecule imaging of the F-plasmid SopB led to a broadly
                                    similar model, defining ParB networks as fluid structures that localise around parS using a ‘nucleation
                                    and caging’ mechanism (Sanchez et al., 2015). Despite these recent experiments converging on
                                    DNA bridging models to explain the ParB spreading phenomenon, the mechanism underpinning
                                    this behaviour remains unresolved. In particular, the relationship between these dynamic nucleopro-
                                    tein complexes and the molecular architecture of the ParB protein is unclear and is the subject of
                                    the work presented here.
                                        Genomically-encoded ParB proteins comprise three distinct domains (Figure 1A and Figure 1—
                                    figure supplement 1A,B and C). Our understanding of their structure is limited to the N-terminal
                                    domain (NTD) which binds ParA (Bouet and Funnell, 1999; Davey and Funnell, 1997; Davis et al.,
                                    1992; Radnedge et al., 1998) and the central DNA binding domain (CDBD) which binds parS and
                                    possibly also nsDNA (Leonard et al., 2004; Schumacher and Funnell, 2005). A structure of Thermus
                                    thermophilus ParB lacking the C-terminal domain (CTD) revealed a compact dimer in which the
                                    helix-turn-helix (HtH) motifs were symmetrically arranged in a manner suitable for binding to the pal-
                                    indromic parS sequence (Figure 1—figure supplement 1D) (Leonard et al., 2004). Analysis of the

                                         A                    NTD
                                                   1                         96 102          CDBD             216     233 CTD 282
                                              Region 1              Box IBox II Region 2     HtH           Region 3        Region 4
                                              N                                                                                    C
                                                                       Y72-A83             T137-L159                      G258-L277

                                         B
                                             NTD
                                                       CDBD + ParB
                                                                   2

                                        CTD                                                        ?

                                         CDBD-dependent                       Higher-order ParB2               Condensed ParB-DNA networks
                                            binding of                  oligomerisation and non-specific          as a result of dynamic and
                                          ParB2 to parS?                    DNA binding at the CTD?            stochastic ParB-DNA and ParB-
                                                                                                                       ParB interactions

                                    Figure 1. A hypothetical model for ParB-mediated condensation of the origin of replication region. (A) Domains
                                    and regions as identified in (Bartosik et al., 2004; Kusiak et al., 2011). (B) ParB is thought to be anchored at
                                    parS (grey) via the HtH motif found in the CDBD (red). ParB protomers self-associate via poorly defined
                                    interactions and also make non-specific contacts with DNA segments, leading to the formation of ParB networks.
                                    In this work we have investigated the potential role of the CTD (green) in mediating ParB oligomerisation and non-
                                    specific DNA binding.
                                    DOI: https://doi.org/10.7554/eLife.28086.002
                                    The following figure supplement is available for figure 1:
                                    Figure supplement 1. Structural models for genomic ParB.
                                    DOI: https://doi.org/10.7554/eLife.28086.003

Fisher et al. eLife 2017;6:e28086. DOI: https://doi.org/10.7554/eLife.28086                                                                            2 of 25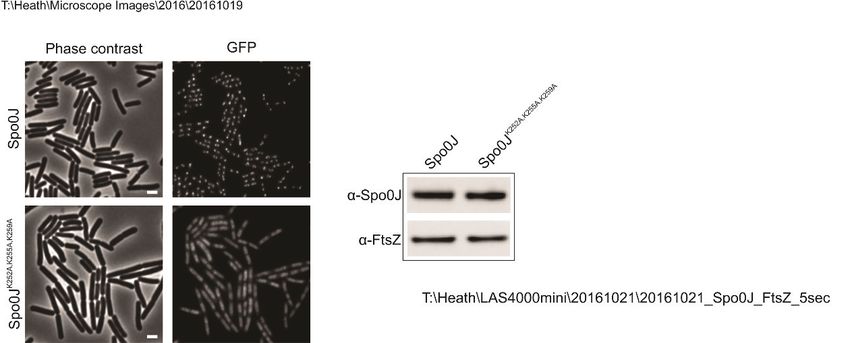
Research article                                                      Biophysics and Structural Biology Genes and Chromosomes

                                    CTD by analytical ultracentrifugation suggested that it also formed a dimer, and it was argued that
                                    this interface might promote spreading interactions. Recently, a structure of Helicobacter pylori
                                    ParB, in which the protein was also truncated by removal of the CTD, showed a strikingly different
                                    conformation, where the NTD had moved away from the CDBD domain to form a tetrameric self-
                                    association interface (Figure 1—figure supplement 1E) (Chen et al., 2015). The CDBD was bound
                                    to a parS half site, and it was argued that tetramerisation of the NTD could be responsible for bridg-
                                    ing interactions between specific and nsDNA bound to the CDBD.
                                        In previous work, we hypothesised that ParB contains a second DNA binding locus for nsDNA
                                    that functions independently of the HtH motif (Figure 1B) (Taylor et al., 2015). This idea was attrac-
                                    tive to us for several reasons. Firstly, in a single DNA binding locus model, it is not straightforward
                                    to reconcile the strict localisation of ParB networks to just a few parS sites (and their surroundings)
                                    with the limited discrimination between specific and nsDNA binding that is observed in vitro (a
Research article Biophysics and Structural Biology Genes and Chromosomes
A [ParB2] (nM) [ParB2R149G] (nM)
2500
2500
5000
5000
1250
1250
12.5
12.5
250
250
500
500
125
125
25
25
50
50
0
0
non-
specific
complex
ParB-parS
+ 2.5 mM Mg2+
147 bp
non-
specific
complex
147 bp
B C
Force
1
Force (pN)
Extension
0.1 3 M ParB2R149G
+ ParB2 1 M ParB2R149G
1 M ParB2
DNA only
0.01
0 0.2 0.4 0.6 0.8 1.0
Normalised extension
Figure 2. The R149 residue within the HtH motif is essential for specific binding to parS, but not required for non-
specific binding and condensation. (A) Representative TBM-EMSAs for wild type ParB and ParBR149G monitoring
binding of parS-containing or non-specific 147 bp dsDNA. (B) Schematic of the magnetic tweezer assay used to
monitor ParB-dependent DNA condensation. (C) Mean force-extension curves for parS-containing DNA molecules
in the presence of wild type ParB and ParBR149G. Non-condensed DNA data is fitted to the worm-like chain model.
Solid lines in condensed data are guides for the eye. Errors are the standard error of the mean of measurements
on different molecules (N ~15–35 molecules).
DOI: https://doi.org/10.7554/eLife.28086.004
The following figure supplement is available for figure 2:
Figure supplement 1. The R149 residue within the HtH motif is not required for non-specific binding and
condensation.
DOI: https://doi.org/10.7554/eLife.28086.005
indicating that nsDNA binding is required for condensation. At a concentration sufficient for efficient
condensation by wild type ParB (1 mM), ParBR149G did not fully condense DNA, although fluctuations
of the DNA tether were consistent with minor condensation events that do not greatly affect the
mean extension value measured (data not shown). However, at moderately elevated concentrations
(3-fold), reversible condensation did occur and was qualitatively equivalent to wild type behaviour
(Figure 2C and Figure 2—figure supplement 1D).
Together, these data show that mutation of the HtH motif effectively eliminates the ability of
ParB to interact specifically with its cognate parS site, while nsDNA binding and condensation is rela-
tively unaffected. This is consistent either with the R149G mutation exclusively affecting nucleobase-
specific contacts in the ParB-parS complex, and/or with the idea that nsDNA binding may occur at a
second DNA binding locus.
Fisher et al. eLife 2017;6:e28086. DOI: https://doi.org/10.7554/eLife.28086 4 of 25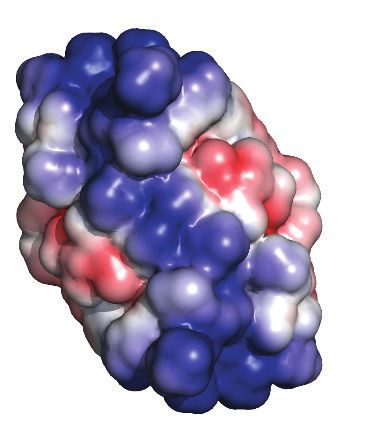
Research article                                                                      Biophysics and Structural Biology Genes and Chromosomes

                                    The structure of BsParB CTD reveals a dimer with a putative DNA
                                    binding interface
                                    We next used solution NMR to determine the structure of the CTD alone (see Figure 3—source
                                    data 1 for structure validation and statistics and Figure 3—figure supplement 1A for an assigned
                                    1
                                      H-15N HSQC spectrum). The structure forms a well-defined dimer containing two a-helices and two
                                    b-strands per monomer in a a1-b1-b2-a2 arrangement (Figure 3A and B). The dimer interface is
                                    formed via an intermolecular b-sheet and two domain-swapped C-terminal helices. Although this
                                    protein fold is somewhat similar to that seen in the plasmid P1 and SopB ParB proteins (Figure 3—
                                    figure supplement 1B,C and D) (Schumacher and Funnell, 2005; Schumacher et al., 2007), there
                                    are also significant differences especially in the N-terminal region: the a1 helix in the chromosomal
                                    ParB structure is replaced by an additional b-strand in the CTDs of P1 ParB and SopB. Analytical
                                    ultracentrifugation, native mass spectrometry and circular dichroism (CD) thermal melt scans further
                                    confirmed that the CTD was primarily dimeric in solution and measured a Tm of 68˚C (Figure 3—fig-
                                    ure supplement 1E and F). NMR H-D exchange data revealed that the dimer exchanges slowly
                                    (which will be relevant to the interpretation of later experiments), with those most stable being the
                                    intermolecular H-bonds between the two b2 strands (data not shown; the half-lives range from 10
                                    min to 4 hr). This secondary structure element is at the centre of the hydrophobic core which is

                                                                           -2        -1
                                          A                      B                                                              C
                                                                     -2
                                                                  -1

                                                                                           -1
                                                                                      -2        180o
                                                                     -1    -2

                                          D                                      E                              F
                                                   -1     -2
                                                                                                                          low
                                                                                                               conservation

                                           L240                  L277

                                                                 L274
                                           L234
                                                                 L270                +ve
                                                                                     -ve
                                                                                                                        high

                                    Figure 3. Solution NMR structure of the dimeric ParB C-terminal domain. (A) Ensemble overlay of the 14 lowest-
                                    energy CTD structures. Red and blue depict separate monomers within the dimer. (B) Secondary structure
                                    elements are identified. a1 indicates the N-terminus of each monomer. (C) The hydrophobic core of Ile, Val, Leu
                                    and Phe residues. For clarity, portions of both monomers were removed. (D) Interdigitating Leu residues of both
                                    monomers form a leucine-zipper interaction. (E) Surface charge representation reveals a large electropositive
                                    region across the b-sheet face (orientation as in B, right hand side). Continuum electrostatics calculations used the
                                    PDB2PQR web server (Dolinsky et al., 2004) and the APBS plugin for PyMOL (Lerner and Carlson, 2006;
                                    Baker et al., 2001). (F) Evolutionary conservation surface profile of the CTD of ParB prepared using ConSurf
                                    (Goldenberg et al., 2009; Celniker et al., 2013) (orientation as in E). The chemical shifts, restraints and structural
                                    co-ordinates have been deposited with the BMRB (34122) and PDB (5NOC).
                                    DOI: https://doi.org/10.7554/eLife.28086.006
                                    The following source data and figure supplement are available for figure 3:
                                    Source data 1. NMR assignment, structure calculation and validation statistics.
                                    DOI: https://doi.org/10.7554/eLife.28086.008
                                    Figure supplement 1. Solution NMR structure of the dimeric ParB CTD domain.
                                    DOI: https://doi.org/10.7554/eLife.28086.007

Fisher et al. eLife 2017;6:e28086. DOI: https://doi.org/10.7554/eLife.28086                                                                        5 of 25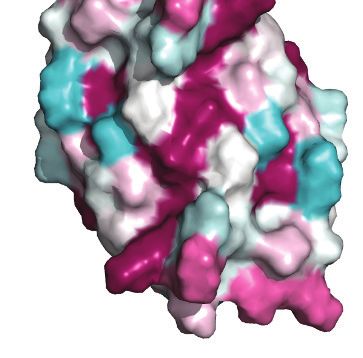
Research article                                                      Biophysics and Structural Biology Genes and Chromosomes

                                    made up of several Ile, Val and Phe residues in the b-sheet (Figure 3C). The a1 helix forms a leucine
                                    zipper with the a2 helix, where alternating Leu residues interdigitate (Figure 3D). A striking feature
                                    of the structure is a highly electropositive face of the dimer arising from several conserved Lys resi-
                                    dues (Figure 3E and F) analogous to the plasmid-encoded SopB and P1 ParB proteins (Figure 3—
                                    figure supplement 1G,H and I).

                                    The CTD binds DNA non-specifically via a lysine-rich surface
                                    To test the idea that the lysine-rich surface we had observed might bind to DNA, we performed
                                    TBE-EMSAs with the isolated CTD. These showed that the CTD was indeed able to bind dsDNA
                                    (Figure 4Ai) resulting in the formation of a ‘ladder’ of bands of decreasing mobility. This is highly
                                    reminiscent of patterns formed by full length ParB under the same conditions (Figure 4Aii and
                                    (Taylor et al., 2015)) except for the presence of smaller gaps between the ‘rungs’ as would be
                                    expected for a protein of smaller size. The CTD was also shown to bind to hairpin oligonucleotides
                                    as short as 10 bp and to ssDNA (Figure 4—figure supplement 1A and data not shown). We do not
                                    see substantial differences in the affinity of ParB for DNA substrates with different sequences and so
                                    this binding activity appears to be non-specific (data not shown). Native mass spectrometry of com-
                                    plexes formed between the CTD and a 15 bp duplex DNA revealed a stoichiometry of 1 DNA per
                                    dimer (Figure 4D). This is in contrast to the P1 ParB system where the CTD operates in a different
                                    binding mode, and can bind two 16-mers (Schumacher et al., 2007).
                                        To further probe the putative DNA binding surface, we performed a titration of the 10 bp hairpin
                                    DNA against the isotopically-labelled CTD dimer (Figure 4E, assigned 1H-15N HSQC spectra are
                                    shown in Figure 4—figure supplement 1B). Residues with large chemical shift perturbations (CSPs,
                                    Dd > 0.08) are either directly involved in DNA-binding or undergo a conformational change as an
                                    indirect result of DNA-binding, and these were mapped onto the structure (Figure 4F). Two regions
                                    of interest were identified: D231-V233, and K252-K259, which are found on the intermolecular b-
                                    sheet face and proximal loop regions to form a large, concave and positively-charged interaction
                                    surface (Figure 4G).
                                        To confirm that this surface was responsible for DNA binding we substituted several Lys residues
                                    with Ala and monitored the effect on DNA binding using EMSA and PIFE assays. In the first instance,
                                    a dual K255A/K257A substitution was studied in the context of both the CTD-only construct (CTDKK)
                                    and the full length ParB protein (ParBKK). CTDKK displayed a greatly reduced affinity (~50 fold) for
                                    DNA, but the binding was not completely abolished (Figure 4Bi). CD thermal melt analysis con-
                                    firmed that this defect was not attributable to global misfolding (Figure 4—figure supplement 1C).
                                    The full length ParBKK variant showed a sigmoidal DNA binding isotherm in a PIFE assay, indicating
                                    strong positive cooperativity as observed for wild type ParB but the apparent Kd was 6-fold weaker
                                    (Figure 4—figure supplement 1D). In EMSA assays, this variant showed no defect in specific bind-
                                    ing to parS as would be expected (Figure 4—figure supplement 1E). Somewhat more surprisingly
                                    however, these lysine substitutions appeared to have a negligible effect on nsDNA binding when
                                    assessed using the TBE-EMSA assays (Figure 4Bii). This may well reflect the complexity that arises
                                    when a partially defective nsDNA binding locus is physically attached to the wild type CDBD domain
                                    (which is still fully competent to bind DNA).
                                        We next designed a triple K252A/K255A/K259A variant with the aim of fully dissipating the posi-
                                    tive charge density across the surface of the CTD, rather than only targeting the loop-proximal
                                    regions. EMSA analysis showed that DNA binding was completely abolished in CTDKKK up to con-
                                    centrations of 50 mM (Figure 4Ci and Figure 4—figure supplement 1F). CD thermal melt analysis
                                    showed that CTDKKK was equivalently folded to wild type CTD at ambient temperatures, but with a
                                    reduced Tm (53˚C) indicating a moderate destabilising effect of the mutations (Figure 4—figure sup-
                                    plement 1G). Interestingly, analysis of full length ParBKKK showed a clear and consistent defect in all
                                    nsDNA binding assays used. TBM-EMSA gels showed that ParB-parS complexes were still formed,
                                    although it should be noted that their yield was reduced relative to wild type (Figure 4—figure sup-
                                    plement 1I). TBE-EMSA gels showed a complete eradication of the discrete lower mobility bands
                                    which arise from nsDNA binding (Figure 4Cii). Moreover, nsDNA binding was undetectable using
                                    the PIFE analysis (Figure 4—figure supplement 1H). Interestingly, EMSA analysis showed that
                                    DNA-bound ParBKKK networks do still form as very low mobility species that assemble co-operatively
                                    at high ParB concentrations. Given that the ParBKKK protein retains a functional HtH motif, this prop-
                                    erty might well reflect a role for the CDBD in binding to nsDNA, albeit weakly compared to the parS

Fisher et al. eLife 2017;6:e28086. DOI: https://doi.org/10.7554/eLife.28086                                                         6 of 25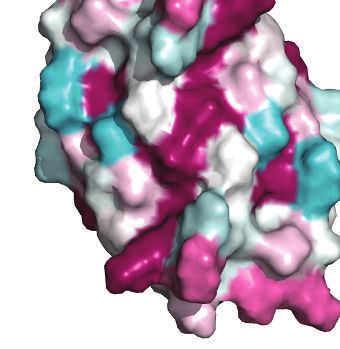
Research article Biophysics and Structural Biology Genes and Chromosomes
A i) [CTD2] (nM) ii) [ParB2] (nM)
2500
2500
5000
5000
1250
1250
12.5
12.5
250
250
500
500
125
125
25
25
50
50
0
0
WT WT
non-specific
+ 1 mM EDTA
complexes
147 bp
B i) ii)
KK KK
non-specific
complexes
+ 1 mM EDTA
147 bp
C i) ii)
KKK KKK
+ 1 mM EDTA
147 bp
D CTD2-DNA F
2x
1.1:1
DNA:CTD2
DNA
CTD
CTD2
>0.08
CTD4 monomer A
1.5:1
monomer B
1000 2000 3000
m/z
K256
E G K255
Chemical shift distance
K256
Q254 K255
A232
V233
K259G258
K252
D231
0.2
(ppm)
K259
K252
>0.08 0.1 K259
K252
0.0
230
240
250
260
270
280
K255
K256
-1 -1 -2 -2
Figure 4. The CTD binds DNA via a lysine-rich surface. (A–C) TBE-EMSAs for the titration of full length ParB and
CTD against 147 bp DNA. Wild type and mutant proteins, K255A + K257A and K252A + K255A + K259A, are
indicated. (D) Native mass spectrometry. Titrations of a 15 bp nsDNA hairpin against CTD were performed
between ratios of 1.1:1 and 1.5:1 DNA:CTD2. Example spectra are shown with the DNA-CTD2 complex shaded in
grey. (E) Deviations in the assigned 1H-15N HSQC spectra of CTD upon titration with a 10 bp hairpin DNA. (F)
Chemical shift perturbations exceeding 0.08 Dd are highlighted on the structure in yellow. (G) Lys residues thought
most likely to bind to DNA are shown as sticks.
DOI: https://doi.org/10.7554/eLife.28086.009
The following figure supplement is available for figure 4:
Figure supplement 1. The CTD binds DNA via a lysine-rich surface.
Figure 4 continued on next page
Fisher et al. eLife 2017;6:e28086. DOI: https://doi.org/10.7554/eLife.28086 7 of 25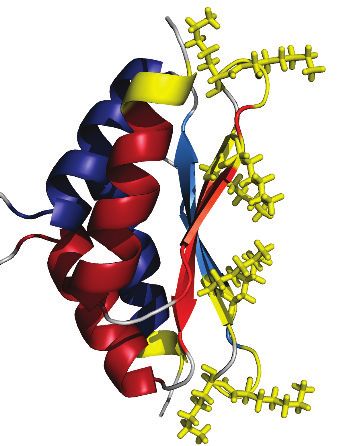
Research article                                                      Biophysics and Structural Biology Genes and Chromosomes

                                    Figure 4 continued
                                    DOI: https://doi.org/10.7554/eLife.28086.010

                                    sequence. This highlights the potential complexity of nsDNA binding in ParB which might involve
                                    synergistic binding by both the CDBD and CTD domains.

                                    DNA binding by the CTD is essential for DNA condensation and
                                    bridging in vitro
                                    We next exploited our double- and triple-lysine mutant ParB proteins to test the role of the DNA-
                                    binding activity associated with the CTD in forming condensed ParB networks. These networks have
                                    been extensively characterised previously for wild type ParB using magnetic tweezers with single
                                    tethered DNA substrates (Taylor et al., 2015) and also in TIRF-based microscopy (Graham et al.,
                                    2014).
                                        Unlike full length ParB, the CTD was not capable of condensing DNA tethers under any condition
                                    tested, even up to 5 mM CTD2 concentrations and under applied forces as low as 0.02 pN (Fig-
                                    ure 1—figure supplement 1Ai). This is consistent with the expected requirement for multiple pro-
                                    tein-protein and/or protein-DNA interfaces to promote DNA looping and condensation. Incubation
                                    of full length ParBKK with single DNA tethers resulted in defective DNA condensation compared to
                                    wild type ParB (Figure 5A). When it was observed, condensation was sudden (rather than progres-
                                    sive, as for wild type ParB) and full condensation required the applied force to be dropped to an
                                    exceptionally low value (0.09 pN) (Figure 5—figure supplement 1Aii). The DNA molecules also
                                    showed unusually large steps when decondensed by force, suggesting that ParBKK was infrequently
                                    stabilising in cis DNA-bridging interactions between isolated DNA regions (data not shown). Co-
                                    incubation of ParBKKK with single DNA tethers under our standard experimental conditions resulted
                                    in no measurable condensation events, even under applied forces as low as 0.02 pN and at elevated
                                    concentrations (Figure 5A and Figure 5—figure supplement 1Aiii). The average work done by
                                    ParB compared to the variant proteins during these condensation events was determined from the
                                    difference between the integral of the force-extension curve in the presence of the protein and that
                                    of DNA alone. This provides a means to quantitatively compare the condensation efficiency between
                                    mutants (Figure 5—figure supplement 1B). We also performed plectoneme stabilisation experi-
                                    ments (Figure 5B). In this assay, a single torsionally-constrained DNA molecule is positively super-
                                    coiled at a 4 pN force by applying 60 turns. ParB is then introduced and, after full buffer exchange,
                                    all turns are released whilst monitoring DNA extension. Any deviation of DNA extension from that
                                    expected of bare DNA is indicative of supercoiled regions being stabilised by ParB. ParBKK could
                                    stabilise DNA-bridging interactions between isolated DNA regions but this was often characterised
                                    by large steps in the DNA tether extension increase which is unlike the behaviour of wild type
                                    (Figure 5C and Figure 5—figure supplement 1C). ParBKKK was unable to stabilise plectoneme
                                    structures showing that it cannot bridge DNA segments in trans (Figure 5D and Figure 5—figure
                                    supplement 1D).

                                    The CTD can both inhibit the formation of, and decondense, ParB-DNA
                                    networks in vitro
                                    The CTD potentially acts as both an oligomerisation interface and also a site of nsDNA-binding.
                                    Therefore, we hypothesised that the CTD might have a dominant negative effect on full length ParB
                                    by competing for the DNA and protein interfaces that mediate the formation of ParB networks in
                                    the magnetic tweezers (MT).
                                       Purified CTD completely inhibited the formation of the condensed state if pre-incubated with
                                    wild type ParB and DNA under the high stretching force regime (Figure 6A and Figure 6—figure
                                    supplement 1A). We also tested whether the introduction of free CTD to pre-condensed tethers
                                    was able to disrupt ParB-DNA networks. Condensed ParB networks were completely stable in a flow
                                    of free ParB on the timescale of these experiments, and the DNA tethers were also able to re-con-
                                    dense following force-induced decondensation (Figure 6Bi). However, the inclusion of excess free
                                    CTD rapidly disrupted ParB networks, with some degree of decondensation observed in 94% of all
                                    the molecules tested (Figure 6Bii). Moreover, those molecules which did not decondense

Fisher et al. eLife 2017;6:e28086. DOI: https://doi.org/10.7554/eLife.28086                                                        8 of 25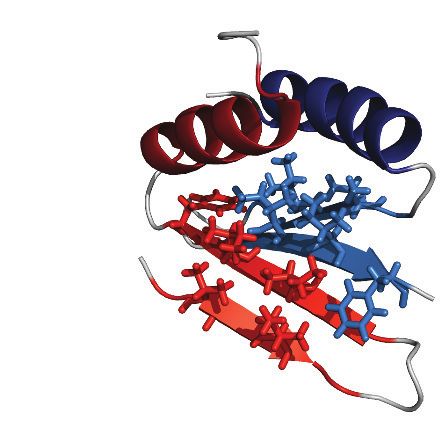
Research article                                                                                     Biophysics and Structural Biology Genes and Chromosomes

                                           A                                                                      B

                                                              1                                                                                                     ParB2

                                           Force (pN)
                                                                                              4 M ParB2KKK
                                                                                                                           Z
                                                            0.1
                                                                                              4 M ParB2KK
                                                                                              1 M ParB2KK
                                                                                              1 M ParB2
                                                                                              DNA only
                                                    0.01                                                                             (1)          (2)       (3)       (4)
                                                        0               0.2   0.4     0.6    0.8          1.0
                                                                          Normalised extension
                                           C                                                                      D
                                                            2.1                                                                    2.1
                                                            1.8       (1)                      (2)                                 1.8
                                           Extension (µm)

                                                                                                                  Extension (µm)
                                                            1.5                                                                    1.5
                                                            1.2                                                                    1.2
                                                                            (4)
                                                            0.9                                      (3)                           0.9
                                                                                     Backward 1 M ParB2
                                                            0.6                      Backward 2 M ParB2KK
                                                                                                                                   0.6                  Backward 1 M ParB2
                                                            0.3                      Forward 3 M ParB2KK                          0.3                  Backward 4 M ParB2KKK
                                                                                     Backward 3 M ParB2KK                                              Forward 4 M ParB2KKK
                                                            0.0                                                                    0.0
                                                                  0    10         20  30     40      50      60                          0   10     20  30     40      50    60
                                                                                  Magnet turns                                                      Magnet turns

                                    Figure 5. DNA binding by the CTD is required for efficient DNA condensation in vitro. (A) Mean force-extension
                                    curves of DNA molecules co-incubated with ParB variants at the indicated concentrations. Non-condensed
                                    (protein-free) DNA data is fitted to the worm-like chain model. Solid lines in condensed data are guides for the
                                    eye. Errors are the standard error of the mean of measurements on different molecules (N ~ 18–35 molecules). (B)
                                    Schematic of plectoneme stabilisation assay. A single torsionally-constrained DNA molecule was positively
                                    supercoiled at 4 pN force by applying 60 turns. This shortens the tether length due to the formation of
                                    plectonemes in the overwound DNA. ParB2 is then introduced and all turns are released whilst monitoring DNA
                                    extension. Evidence for ParB-dependent plectoneme stabilisation is provided by hysteresis in the extension as a
                                    function of magnet turns as the supercoiling is removed. (C) Plectoneme stabilisation assay comparing bare DNA,
                                    wild type ParB and ParBKK. The double-mutant protein supported DNA bridging and occasionally large steps were
                                    observed in the backward trace (see text for discussion). (D) Plectoneme stabilisation assay comparing wild type
                                    ParB and ParBKKK. No activity was detected for the triple-mutant protein.
                                    DOI: https://doi.org/10.7554/eLife.28086.011
                                    The following figure supplement is available for figure 5:
                                    Figure supplement 1. DNA binding by the CTD is required for efficient DNA condensation in vitro.
                                    DOI: https://doi.org/10.7554/eLife.28086.012

                                    spontaneously could be stretched by force, but were then unable to recondense when permissive
                                    forces were restored. This ability of the CTD to decondense ParB networks demonstrates that the
                                    protein-protein and/or protein:DNA interfaces that maintain the condensed state under a low force
                                    regime are dynamic (i.e. they are exchanging while the overall structure of the network is
                                    maintained).
                                        We have shown above that the CTD binds tightly to nsDNA. Therefore, its ability to prevent con-
                                    densation and induce decondensation might simply reflect competition for the nsDNA that becomes
                                    available during exchange of ParB:DNA interfaces. Indeed, we have shown previously that free DNA
                                    is a potent inducer of network decondensation in the MT apparatus (Taylor et al., 2015). To test the
                                    idea that the CTD dimerisation interface is also important for maintaining the condensed state, we
                                    repeated our experiments with the CTDKK and CTDKKK constructs, which are defective and appar-
                                    ently unable (respectively) to bind nsDNA. Both mutant proteins were as effective as wild type in
                                    preventing condensation (Figure 6C and Figure 6—figure supplement 1B), and both were able to
                                    induce decondensation in approximately 95% of all molecules tested (Figure 6Biii and D). This
                                    strongly suggests that CTD-dependent ParB network dissipation is primarily mediated by competi-
                                    tion for the CTD dimerisation interface and further confirms that the CTDKKK construct is folded. This

Fisher et al. eLife 2017;6:e28086. DOI: https://doi.org/10.7554/eLife.28086                                                                                                       9 of 25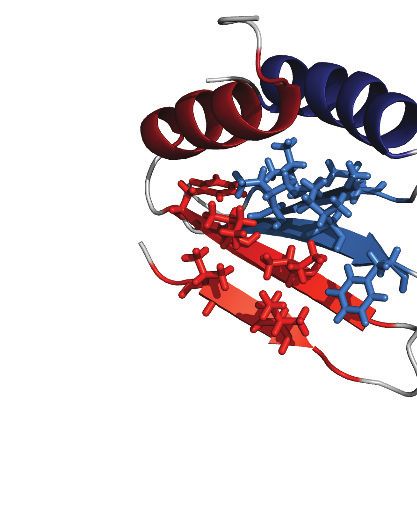
Research article Biophysics and Structural Biology Genes and Chromosomes
A B i)
2.1
Extension (µm)
1.8
1 1.5
Force (pN)
1.2
0.9 + ParB2
Re-condensation
0.6 Flow
0.1 1 M ParB2 + 0.3
5X CTD2 0.0
Force (pN)
1 M ParB2
1
DNA only 0.34 pN
0.01 1E-3
0 0.2 0.4 0.6 0.8 1.0 0 150 300 450 600 750 900
Normalised extension Time (s)
C B ii)
2.1
+ ParB2 + 5X CTD2
Extension (µm)
1.8
1 1.5
Force (pN)
1.2
0.9
No re-condensation
0.6
0.1 1 M ParB2 + 0.3
5X CTD2KKK 0.0
Force (pN)
1 M ParB2 1
DNA only 0.34 pN
0.01 1E-3
0 0.2 0.4 0.6 0.8 1.0 0 150 300 450 600 750 900
Normalised extension Time (s)
D 1.0 B iii) 2.1
+ ParB2 + 5X CTD2KKK
Extension (µm)
1.8
Condensation ratio
0.8 1.5
1.2
0.6
0.9
0.4 0.6
0.3
0.2 0.0
Force (pN)
1
0.0 0.34 pN
1E-3
ParB2 +CTD2 +CTD2KKK +CTD2KK 0 150 300 450 600 750 900
(1 µM) (5 µM) (5 µM) (5 µM) Time (s)
Figure 6. The CTD of ParB both inhibits and disrupts ParB-dependent DNA condensation. (A) Mean force-
extension curves for DNA molecules co-incubated with 1 mM ParB2 in the presence or absence of 5 mM CTD2.
Non-condensed (protein-free) DNA data is fitted to the worm-like chain model. Solid lines in condensed data are
guides for the eye. (B) (i) ParB-DNA networks are stable in magnetic tweezers in the presence of 1 mM ParB2. (ii)
ParB-DNA complexes spontaneously decondense following the introduction of 1 mM ParB2 and 5 mM free CTD2.
(iii) ParB-DNA complexes spontaneously decondense following the introduction of 1 mM ParB2 and 5 mM CTD2KKK.
(C) Mean force-extension curves for DNA molecules co-incubated with 1 mM ParB2 in the presence or absence of 5
mM mutant CTD2KKK. Errors are the mean of measurements on different molecules (N > 40 molecules) (D)
Condensation ratio (see Materials and methods for definition) for individual DNA condensation events involving
the addition of CTD competitor variants to pre-condensed ParB-DNA networks.
DOI: https://doi.org/10.7554/eLife.28086.013
The following figure supplements are available for figure 6:
Figure supplement 1. The CTD of ParB both inhibits and disrupts ParB-dependent DNA condensation.
DOI: https://doi.org/10.7554/eLife.28086.014
Figure supplement 2. Possible mechanisms to explain the dominant negative effect of the CTD on full length
ParB.
DOI: https://doi.org/10.7554/eLife.28086.015
competition presumably results from the formation of heteroligomers between full length ParB and
the CTD, which disrupts interactions that are essential for condensation (Figure 6—figure supple-
ment 1C).
Fisher et al. eLife 2017;6:e28086. DOI: https://doi.org/10.7554/eLife.28086 10 of 25Research article Biophysics and Structural Biology Genes and Chromosomes
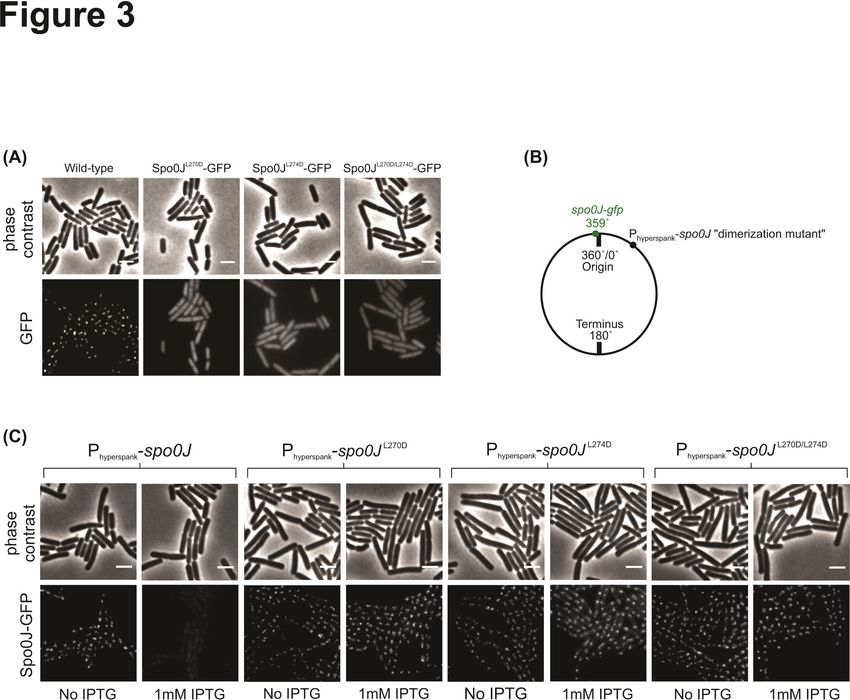
The CTD is critical for the formation of ParB foci in vivo
To test the importance of the CTD dimerisation and DNA binding interfaces in vivo, we compared
the ability of wild type and mutant ParB-GFP proteins to form foci in B. subtilis cells when expressed
from the endogenous locus. Wild type ParB-GFP formed discrete foci around oriC as expected
(Murray et al., 2006; Graham et al., 2014; Autret et al., 2001; Real et al., 2005; Glaser et al.,
1997; Lin et al., 1997; Lewis and Errington, 1997; Marston and Errington, 1999). In contrast,
ParBKKK-GFP failed to form discrete foci (Figure 7Ai–ii) despite wild type expression (Figure 7—fig-
ure supplement 1A). Interestingly, the triple-mutant protein appeared to localise non-specifically to
the nucleoid, perhaps as a result of residual DNA binding by the HtH motifs, suggesting that
ParBKKK-GFP retained the ability to dimerise. A caveat in interpreting this experiment is that, in addi-
tion to a complete eradication of nsDNA binding by the CTD domain, the ParBKKK mutant protein
also showed a reduction in parS binding (Figure 4—figure supplement 1I). Therefore, we cannot
exclude the possibility that defective parS binding also contributes to the lack of ParB foci formation
we have observed. A ParBL270D+L274D construct, designed to prevent leucine zipper-mediated dimer-
isation of the CTD, was completely unable to form ParB foci (Figure 7Aiii–v) despite being
expressed at approximately wild type levels (Figure 7—figure supplement 1B). The complete dele-
tion of the CTD by truncation to E222 or E227 resulted in the same phenotype (data not shown).
Our attempts to purify recombinant ParBL270D+L274D failed because the protein was insoluble
upon overexpression in E. coli. This raises the possible caveat that the loss of function associated
with this dimerisation mutant in vivo might reflect mis-folding. Therefore, we also investigated
whether the free CTD was able to interfere with dimerisation in vivo, thereby causing a dominant
negative effect on ParB function. A B. subtilis strain was engineered with a C-terminal gfp fusion
replacing the endogenous spo0J and the unlabelled CTD-only gene inserted at an ectopic locus
downstream of a Phyperspank promoter, designed for high protein expression that is tightly-controlled
with IPTG (Figure 7B). Overexpression of the CTD caused ParB-GFP foci to become diffuse
(Figure 7C), although expression levels of endogenous ParB-GFP were unaffected (Figure 7—figure
supplement 1C).
ChIP-qPCR analysis allowed us to more directly characterise the effect of CTD expression upon
ParB spreading (i.e. the enrichment of ParB at and widely around parS sites). Spreading was mea-
sured around a single parS site (359.20˚) and used a locus towards the terminus to monitor back-
ground ‘enrichment’ (146.52˚) (Figure 7D). As expected, in the absence of CTD expression, ParB
was highly enriched not only at parS sites (~40 fold), but also for several kilobase pairs around parS
(Figure 7E). Overexpression of CTD significantly decreased the signal around parS (up to ~4 fold),
indicating that it interferes with spreading. Western blotting of cells grown under equivalent condi-
tions to the ChIP-qPCR assay and using the same batch of polyclonal anti-ParB antibody suggests
that the CTD is not preferentially recognised over the endogenous full length ParB protein (Fig-
ure 7—figure supplement 1D). Note that the reduced signal observed for the parS fragment does
not necessarily indicate defective specific binding, because the PCR product at parS is much larger
than the 16 bp parS site or the 24 bp footprint of a ParB dimer (Murray et al., 2006). We can con-
clude that non-specific DNA interactions are reduced, but we are unable to say whether specific
interactions are also reduced, or are maintained at wild type levels.
Finally, we determined the consequence of decreased ParB spreading in vivo induced by CTD
overexpression by measuring the rate of DNA replication initiation. ParB normally inhibits the activity
of Soj, a regulator of the master bacterial initiation protein DnaA (Murray and Errington, 2008).
Marker frequency analysis showed that CTD overexpression stimulated the frequency of DNA repli-
cation initiation, indicating that regulation of DnaA by Soj was adversely affected (Figure 7—figure
supplement 1E). Together, these results are consistent with our in vitro observations, and support a
model in which dynamic ParB-DNA networks are dependent upon ParB oligomerisation and DNA-
binding interfaces in the CTD.
Discussion
ParB proteins form long-distance bridging interactions on DNA, forming foci that facilitate chromo-
somal partitioning reactions (Lynch and Wang, 1995; Rodionov et al., 1999; Bingle et al., 2005).
These foci are anchored at parS sites and interact non-specifically around a single site for ±18 kbp
(Breier and Grossman, 2007; Wang et al., 2017). This ParB ‘spreading’ activity is a conserved
Fisher et al. eLife 2017;6:e28086. DOI: https://doi.org/10.7554/eLife.28086 11 of 25Research article Biophysics and Structural Biology Genes and Chromosomes
A K252A+K255A L270D
WT-GFP +K259A-GFP L270D-GFP L274D-GFP +L274D-GFP
(i) (ii) (iii) (iv) (v)
phase contrast
ParB-GFP
B C phase contrast ParB-GFP phase contrast ParB-GFP
(i) (ii)
no IPTG
spo0J-gfp Phyperspank
359o -spo0JCTD
360/0o
origin
(iii) (iv)
terminus 1 mM IPTG
180o
ParB-GFP + CTD overexpression
(amyE::Phyperspank) (amyE::Phyperspank-CTD)
D E
35 .32 o9.20 o
1.0
359.16o
9 5
45 o
76 o
35 S 3
359.22o
9.
9.
r
pa
0.8
35
359o 360o
359.32o
o
9. o
37 o
65 o
359.37o
359.16
359.22
9.
Phyperspank 0.6
35
35
359.45o
% IP
-spo0JCTD
360/0o 359.65o
origin 0.4 359.76o
146.52o
terminus 0.2
180o
146.52o
0
amyE::Phyperspank amyE::Phyperspank-CTD
+ IPTG + IPTG
Figure 7. DNA-binding and dimerisation by the CTD is critical for ParB function in vivo. (A) Variant ParB-GFP
mutants form abnormal foci in B. subtilis. Cells were grown overnight in slow growth conditions before dilution
(1:100) into fast growth media, and were allowed to achieve at least five mass doublings before observation by
microscopy (N > 300 cells). Scale bar is 2 mm. (B) Construct design for overexpression of the CTD in vivo. (C) CTD
overexpression was induced by IPTG in the presence of chromosomally-encoded wild type ParB-GFP using the
Phyperspank construct. Cells were grown as in A. (D) Construct design for ChIP-qPCR. (E) ChIP-qPCR assay for ParB
spreading. Cells were grown slowly overnight, diluted (1:100) into fast growth media, and allowed to reach eight
mass doublings before crosslinking with 1% formaldehyde. Background IP was measured at the terminus (146˚).
Primer pairs produced 200–300 bp fragments.
DOI: https://doi.org/10.7554/eLife.28086.016
The following figure supplement is available for figure 7:
Figure supplement 1. DNA-binding and dimerisation by the CTD is critical for ParB function in vivo.
DOI: https://doi.org/10.7554/eLife.28086.017
property across chromosomal and plasmid segrosomes, yet the interaction interfaces involved have
remained elusive, particularly for genomically-encoded systems (Graham et al., 2014). This is, in
part, due to the variable structures of ParB proteins and their cognate centromere sequences, even
within the type I subclass of which B. subtilis ParB is a member (Gerdes et al., 2000;
Fisher et al. eLife 2017;6:e28086. DOI: https://doi.org/10.7554/eLife.28086 12 of 25Research article Biophysics and Structural Biology Genes and Chromosomes
Schumacher, 2008). Increasing evidence indicates that ParB spreading is the result of a DNA-bridg-
ing activity mediated by ParB-ParB oligomerisation interfaces (Graham et al., 2014; Taylor et al.,
2015; Broedersz et al., 2014; Sanchez et al., 2015; Sanchez et al., 2013). However, a complete
understanding of the relationship between ParB structure and function has been hindered by the
lack of any full length structure for a chromosomally-encoded ParB. Indeed, the organisation of the
N-terminal (NTD), central DNA-binding (CDBD) and C-terminal (CTD) domains appears to be quite
complex (Figure 1—figure supplement 1A,B and C; Figure 6—figure supplement 2A). For the
type I ParB protein class, there is evidence to suggest that dimerisation and/or tetramerisation can
occur at the NTD and CDBD, and that dimerisation can occur at the CTD (Leonard et al., 2004;
Schumacher and Funnell, 2005; Chen et al., 2015). Alongside an ability to bind DNA both specifi-
cally and non-specifically, a combination of some or all of these protein:protein interfaces must sup-
port ParB spreading and network formation (Figure 6—figure supplement 2A).
To address the putative role of the CTD in spreading (Leonard et al., 2004), we resolved the first
structure of a genomic ParB CTD. The structure revealed a conserved lysine-rich surface and we
showed that this binds to DNA in an apparently non-specific manner. This novel DNA binding locus
is distinct from the sequence-specific DNA binding site for parS formed by the classical HtH motif
within the CDBD domain. In this respect, there are parallels with the plasmid-encoded ParB proteins
P1 and SopB (Schumacher et al., 2007; Schumacher et al., 2010). In these systems, the CTDs share
similar surface electrostatics in which a polar distribution of charged residues results in both posi-
tively- and negatively- charged surfaces on opposite faces of the domain. In both B. subtilis ParB
and P1 ParB, the Lys/Arg rich surface has been shown to bind to DNA using structural or biochemi-
cal techniques ([Schumacher and Funnell, 2005; Schumacher et al., 2007] and this work), but
experiments with SopB do not support the idea that it shares this activity (Ah-Seng et al., 2009).
The integrity of the CTD may also be important for stabilising the N-terminal region of the protein.
When SopB was truncated ahead of the CTD, it could not bind sopC (the F-plasmid equivalent of
parS) (Kusukawa et al., 1987), and analogous results have been obtained with T. thermophilus and
B. subtilis ParB ((Leonard et al., 2004) and unpublished observations).
Our CTD structure facilitated the design of separation of function mutations to test the impor-
tance of the dimerisation and DNA binding activities using a variety of in vitro and in vivo readouts
of ParB function. We showed that the DNA binding interface in the CTD is not required for parS
binding, and that this is instead dependent on the HtH motif found within the CDBD domain as pre-
dicted in several previous studies (Graham et al., 2014; Chen et al., 2015; Autret et al., 2001;
Gruber and Errington, 2009; Gerdes et al., 2000; Bignell and Thomas, 2001; Theophilus and
Thomas, 1987; Lobocka and Yarmolinsky, 1996). In contrast, the CTD is essential for the formation
of nsDNA complexes that are observed as ladders of decreasing mobility in EMSA assays. Mutant
proteins that were unable to bind DNA at the CTD locus were severely defective in both DNA con-
densation assays in vitro and ParB foci formation assays in vivo. Moreover, ParB proteins that were
designed to be unable to form oligomeric structures by mutation of the CTD-CTD dimerisation inter-
face were completely unable to form ParB foci. Finally, we showed that the free CTD domain can dis-
rupt ParB networks, both in vitro and in vivo. Overexpression of the CTD in B. subtilis can lead
directly to the assembly of heterodimers or heterooligomers with full length ParB that interfere with
wild-type function. However, this is not the case when using purified proteins in vitro, and we envi-
sion at least two non-exclusive explanations for the CTD-induced decondensation we observe in the
MT assay (see Figure 6—figure supplement 2B): the CTD could simply compete for binding to the
DNA substrate (scenario 1 in the figure), or the CTD could exchange with full length ParB to form
mixed species (scenarios 2 and 3). The first possibility can be excluded as being solely responsible
for decondensation, because a CTD construct that is devoid of DNA binding activity has the same
dominant negative effect. In the second scenario, the CTD might form inactive heterodimers with
the full length ParB in free solution, such that it can longer exchange with the condensed network.
Alternatively, the CTD could interact with the full length ParB that remains bound to DNA in the net-
work. This could ‘cap’ the bridging interactions, if indeed the CTD interface were important for such
interactions (although we cannot exclude the alternative idea that binding of the CTD has an alloste-
ric effect on a different bridging interface). In either case our results highlight a critical function for
the CTD interface in overall ParB function, but we favour the second idea. Although our NMR experi-
ments indicate that exchange of the CTD interface does occur, it is on a timescale of hours to days.
This is too slow to account for the effect we observe in the MT if it is simply based on monomer
Fisher et al. eLife 2017;6:e28086. DOI: https://doi.org/10.7554/eLife.28086 13 of 25Research article Biophysics and Structural Biology Genes and Chromosomes
exchange between the CTD dimer and the full length ParB dimer in free solution. However, the situ-
ation in the ParB network is very different, because the opposing force generated by the MT can
dramatically increase the rate of exchange of bridging interactions that hold the DNA in a con-
densed state. Ultimately, a direct demonstration of this idea will require a correlative measurement
of DNA extension with the observation of ParB/CTD binding under conditions of controlled force,
and this will be the subject of future studies. Taken together, our observations support the idea that
the CTD is essential for both DNA binding and for ParB-ParB bridging interactions that support
DNA condensation in vitro.
We propose that the presence of two DNA binding loci in ParB can help to explain how ParB net-
works are anchored at parS in vivo. Importantly, this architecture resolves the paradoxical observa-
tion that the apparent specificity for parS in vitro (Research article Biophysics and Structural Biology Genes and Chromosomes
over multiple NAP-10 columns (GE Healthcare Life Sciences) before concentration in a centrifugal
vacuum concentrator.
ParB overexpression and purification
ParB, and the variants R149G, K255A + K257A and K252A + K255A + K259A, were overexpressed
and purified as described (Taylor et al., 2015). CTD, and mutants thereof, were His-tagged and
purified to homogeneity as follows. Cell pellets, produced as described (Taylor et al., 2015), were
resuspended in 20 mM Tris-HCl pH 7.5, 500 mM NaCl and 1 mM BME (TNB buffer) with the addition
of 10 mM imidazole, 5% (v/v) glycerol and protease inhibitor cocktail set II (Millipore), before being
snap-frozen and stored at 80˚C. Cells were lysed by sonication in the presence of 0.2 mg/ml lyso-
zyme (Sigma). The lysate was clarified by centrifugation and loaded onto a 5 ml HisTrap HP column
(GE Healthcare Life Sciences) equilibrated with TNB buffer +10 mM imidazole. CTD elution was
achieved with a linear gradient of 10 mM to 500 mM imidazole. Peak fractions were assessed by
SDS-PAGE and pooled accordingly. The tag was removed with HRV 3C protease (Thermo Scientific,
Pierce) for 16 hr at 4˚C during dialysis into TNB buffer +10 mM imidazole. The products were subse-
quently loaded onto a HisTrap HP column whereby the cleaved CTD was collected in the flow-
through volume, followed by concentration by centrifugation in Amicon Ultra-15 3 kDa MWCO spin
filters (Millipore). This concentrate was loaded at 1 ml/min onto a Hiload 16/600 Superdex S75 gel
filtration column (GE Healthcare Life Sciences) equilibrated with 50 mM Tris-HCl pH 7.5, 1 mM
EDTA, 300 mM NaCl and 1 mM DTT (storage buffer). Appropriate peak fractions were pooled, fol-
lowed by final concentration by centrifugation as described. Spectrophotometric grade glycerol
(Alfa Aesar) was added to 10% (v/v). The final protein was then snap-frozen as aliquots and stored at
80˚C. ParB concentration was determined by spectrophotometry using theoretical extinction coef-
ficients of 7450 M 1 cm 1 and 2560 M 1 cm 1 for ParB and CTD respectively. ParB concentrations
in all assays refer to the dimeric state. The wild type, K255A + K257A and K252A + K255A + K259A
variants of ParB behaved equivalently during purification, and run almost identically on preparative
size exclusion columns (both in the context of the CTD and full length protein), suggesting that they
are all dimeric. For structure determination by NMR, the CTD was dual isotopically (13C and 15N)
labelled during overexpression in M9 media, as described previously (Williams et al., 2007), and
subsequently purified as above.
CD spectroscopy
CD spectra were collected using a JASCO J-810 spectropolarimeter fitted with a Peltier temperature
control (Jasco UK). 50 mM protein samples were buffer exchanged into phosphate buffered saline
(PBS; 8.2 mM NaH2PO4, 1.8 mM KH2PO4, 137 mM NaCl and 2.7 mM KCl (pH 7.4)) by 16 hr dialysis
at 4˚C using a membrane with a MWCO of 3.5 kDa. At 20 mM and using a 0.1 cm quartz cuvette,
thermal stability data was acquired across a 190–260 nm absorbance scan (1 nm data pitch at a scan-
ning speed of 100 nm/min) from 5˚C to 90˚C at 5˚C increments. Raw data was normalised to molar
ellipticity (MRE (deg.cm2.dmol 1)) using calculation of the concentration of peptide bonds and the
cell path length. A buffer only baseline was subtracted from all datasets. All data for mutant variants
was acquired alongside a wild type CTD control.
NMR
NMR datasets were collected at 35˚C, utilising a Varian VNMRS 600 MHz spectrometer with a cryo-
genic cold-probe. The purified protein was buffer exchanged into PBS (10 mM NaH2PO4, 1.8 mM
KH2PO4, 137 mM NaCl and 2.7 mM KCl (pH 6.1)) and concentrated to 1 mM. 1H-15N HSQC, 1H-13C
HSQC, HNCACB, CBCA(CO)NH, HNCA, HN(CO)CA, HNCO, CC(CO)NH, H(CCO)NH, HCCH-
TOCSY, 15N-NOESY-HSQC (150 ms mixing time), 13C-NOESY-HSQC (140 ms mixing time) and aro-
matic 13C-NOESY-HSQC (140 ms mixing time) experiments were collected on 13C,15N-labelled CTD.
2D 1H-1H TOCSY and NOESY spectra were recorded on unlabelled protein. 13C,15N-labelled and
unlabelled protein were mixed in equimolar amounts to create a mixed labelled sample used to
record 3D13C,15N F1-filtered, 13C,15N F3-edited 13C-NOSEY-HSQC and 15N-NOESY-HSQC experi-
ments (Zwahlen et al., 1997). A hydrogen-deuterium (HD) exchange experiment was conducted by
recording 1H-15N HSQC experiments at several intervals following dissolution of freeze-dried protein
in D2O. A titration was conducted by adding a 10 bp DNA hairpin step-wise to 13C, 15N-labelled
Fisher et al. eLife 2017;6:e28086. DOI: https://doi.org/10.7554/eLife.28086 15 of 25Research article Biophysics and Structural Biology Genes and Chromosomes
CTD and recording a 1H-15N HSQC experiment after each addition. The final molar ratio of protein:
DNA was 1:1.25. All NMR data were processed using NMRPipe (Delaglio et al., 1995). Spectra
were assigned using CcpNmr Analysis 2.4 (Vranken et al., 2005). Proton chemical shifts were refer-
enced with respect to the water signal relative to DSS.
Heteronuclear NOE experiments showed residues 214–228 to be highly flexible. This was sup-
ported by chemical shift analysis with TALOS+ (Shen et al., 2009) and the absence of any medium
or long-range NOEs for these residues. Structure calculations were only conducted on residues 229–
280, as the unstructured tail made unfavourable energy contributions to the calculation which dis-
torted the selection of ensembles of low-energy structures. Structure calculations were conducted
using ARIA 2.3 (Rieping et al., 2007). 10 structures were calculated at each iteration except iteration
8, at which 200 structures were calculated. The 20 lowest energy structures from this iteration went
on to be water refined. Spin diffusion correction was used during all iterations (Linge et al., 2004).
Two cooling phases, each with 30,000 steps were used. Torsion angle restraints were calculated
using TALOS+. Standard ARIA symmetry restraints for two monomers with C2 symmetry were
included (Bardiaux et al., 2009). Structural rules were enabled, using the secondary structure pre-
dictions made by TALOS+. The HD exchange experiment showed 29 NH groups to be protected
after 8 min. Initial structure calculations were conducted without hydrogen bond restraints. Hydro-
gen bond donors were then identified and corresponding hydrogen bond restraints included in later
calculations. Calculations were conducted using a flat-bottom harmonic wall energy potential for the
distance restraints until no consistent violations above 0.1 Å were observed. The final calculation was
then performed using a log-harmonic potential (Nilges et al., 2008) with a softened force-field
(Mareuil et al., 2015). Structures were validated using the Protein Structure Validation Software
(PSVS) suite 1.5 (Bhattacharya et al., 2007) and CING (Doreleijers et al., 2012). The chemical shifts,
restraints and structural co-ordinates have been deposited with the BMRB (34122) and PDB (5NOC).
EMSA experiments
The specific and nsDNA-binding activity of ParB was analysed by TBM- and TBE-PAGE as described
(Taylor et al., 2015). Serial dilutions of ParB, to the indicated concentrations, were incubated with
20 nM 147 bp parS or ‘scrambled’ DNA (at a ratio of 1:19 labelled to unlabelled), 50 mM HEPES-
KOH pH 7.5, 100 mM KCl, 2.5 mM MgCl2, 0.1 mg/ml BSA, 1 mM DTT and 2.5% (v/v) Ficoll in a 20 ml
reaction volume. Where indicated, different length dsDNA substrates were used equivalently. Sam-
ples were incubated at room temperature for 30 min followed by 5 min on ice. 10 ml of each were
loaded onto a 6% acrylamide/bis-acrylamide (29:1) gel in 90 mM Tris, 150 mM H3BO3 (final pH 7.5),
supplemented with either 2.5 mM MgCl2 (TBM) or 1 mM EDTA (TBE). Gels were pre-run at 150 V,
4˚C for 30 min in a buffer identical to their composition, and run post-loading at 150 V, 4˚C for 1 hr.
For imaging, gels were vacuum-dried, exposed to a phosphor screen and subsequently scanned by
a Phosphor-Imager (Typhoon FLA 9500, GE Healthcare Life Sciences). Gels are representative of
three biological replicate experiments.
Protein induced fluorescence enhancement (PIFE) assay
ParB DNA-binding to non-specific substrates was analysed in a solution-based assay where a change
of emitted Cy3 fluorescence acted as a reporter of ParB binding (Taylor et al., 2015). ParB was incu-
bated with 20 nM 147 bp 5’-Cy3-labelled DNA, 50 mM HEPES-KOH pH 7.5, 100 mM KCl, 2.5 mM
MgCl2, 0.1 mg/ml BSA and 1 mM DTT. Samples of 120 ml were incubated at room temperature for
30 min before being transferred into a quartz cuvette for data collection. Cy3 fluorescence in each
sample was measured by excitation at 549 nm and an emission scan between 560 and 600 nm (Cary
Eclipse Fluorescence Spectrophotometer, Agilent Technologies). Peak maxima were calculated by
the area under the curve function in GraphPad Prism software, and the increase in fluorescence cal-
culated relative to a DNA only control. Where appropriate, data was fitted with a Hill equation.
Bmax ½ParB2 h
Y¼ (1)
h þ ½ParB h
Kdapp 2
Where Y is the measured increase in fluorescence, Bmax is the maximal increase in fluorescence, h
is the Hill coefficient and Kdapp is the apparent dissociation constant. When comparing wild type
and mutant binding isotherms, the data were well-fitted using a shared value for the Hill coefficient
Fisher et al. eLife 2017;6:e28086. DOI: https://doi.org/10.7554/eLife.28086 16 of 25Research article Biophysics and Structural Biology Genes and Chromosomes
(i.e. there was no evidence for changes in binding cooperativity as a result of the mutations studied).
Standard errors for the fitted parameters were calculated in GraphPad Prism using three indepen-
dent repeat experiments.
Magnetic tweezers
Instrument and samples
We used a home-made magnetic tweezers setup similar in design to that described in Strick et al.
(1998), Carrasco et al. (2013) and detailed in Pastrana et al. (2016). In brief, images of 1 mm super-
paramagnetic beads tethered to the surface of a glass slide by DNA constructs are acquired with a
100x oil immersion objective and a CCD camera. Real-time image analysis was used to determine
the spatial coordinates of beads with nm accuracy in x, y and z. A step-by-step motor located above
the sample moves a pair of magnets allowing the application of stretching forces to the bead-DNA
system. Applied forces can be quantified from the Brownian excursions of the bead and the exten-
sion of the DNA tether. Unless specified otherwise, data were acquired at 120 Hz and filtered down
to 3 Hz for representation and analysis.
Fabrication of DNA substrates for MT experiments containing a single parS sequence with biotins
and digoxigenins at the tails was described in Taylor et al. (2015). The DNA substrates were incu-
bated with 1 mm streptavidin-coated beads (MyOne, Invitrogen) for 10 min. Then, the DNA-bead
complex was injected in a liquid cell functionalised with anti-digoxigenin antibodies (Roche) and
incubated for 10 min before applying force. In a first step, visual inspection allows identification and
selection of tethered DNA molecules. Torsionally-constrained molecules and beads with more than a
single DNA molecule were identified from its distinct rotation-extension curves. Double or multiple
tethers were discarded for further analysis in this work. All the experiments were performed in a
reaction buffer composed of 100 mM NaCl, 50 mM Tris-HCl or HEPES-KOH pH 7.5, 100 mg/ml BSA
and 0.1% Tween 20 (v/v).
CTD-induced decondensation
Once selected single torsionally-relaxed DNA molecules, 1 mM ParB2 was incubated for 2–3 min and
condensation was induced by decreasing the force to 0.34 pN. Immediately after this, one cell-vol-
ume of reaction buffer containing 5 mM CTD and 1 mM ParB2, pre-incubated for 2–3 min, was
applied at a constant flow velocity of 16 ml/min. In control experiments where only 1 mM ParB2 was
applied, the reaction was supplemented with a volume of storage buffer equal to that used in the
CTD experiments and thus maintaining the ionic conditions.
To have a measurement of the degree of induced decondensation, we determined a condensa-
tion ratio, Cr (Figure 6D), which was calculated simply as:
z0 z
Cr ¼ (2)
z0
where z0 is the expected extension at 0.34 pN measured before ParB injection and z is the equilib-
rium extension after induced-decondensation. z was determined from average extensions of 120
data points at 390 s after the cell volume was completely exchanged. These data were acquired at
60 Hz and filtered down to 3 Hz.
Force-extension curves and work calculation
Force-extension curves were obtained by decreasing the applied force in steps from 4 pN to ~0.02
pN for a total measuring time of 13 min. This procedure is initially performed for bare DNA mole-
cules. Then, the force is reset to 4 pN and ParB variants are flown and incubated for 2 min before
starting the measurement of a new force-extension curve using the same magnet positions in
absence of proteins. In every case, the force applied to each bead was calculated from the force-
extension data of bare DNA molecules.
The work done during condensation (DW) can be calculated by the difference in work between
the force-extension curve in the presence of ParB variants and that of bare DNA (Equation 3), where
zmax is the extension at the maximum applied force of 4 pN. Integrals were calculated using the trap-
ezoidal rule using OriginLab software.
Fisher et al. eLife 2017;6:e28086. DOI: https://doi.org/10.7554/eLife.28086 17 of 25You can also read