Ireland's Long-Term Renovation Strategy 2020 - European ...
←
→
Page content transcription
If your browser does not render page correctly, please read the page content below
Ireland’s Long-Term
Renovation Strategy
2020

As required by Directive (EU) 2018/844 of the European Parliament and of
the Council of 30 May 2018 amending Directive 2010/31/EU on the energy
performance of buildings and Directive 2012/27/EU on energy efficiency
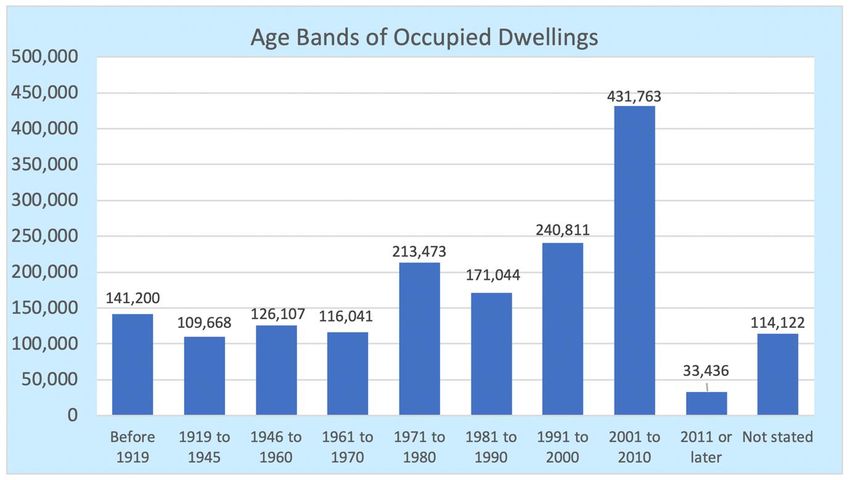
Table of Contents
1     Overview ........................................................................................................................ 4

2     Targets and Objectives .................................................................................................. 5

    2.1     Renovation of Ireland’s Building Stock .................................................................... 5

    2.2     National Milestone Targets ..................................................................................... 5

3     Overview of the National Building Stock ......................................................................... 8

    3.1     Climatic Zones and Location ................................................................................... 8

    3.2     Residential Sector ................................................................................................... 8

    3.3     Commercial & Public Sector ................................................................................. 18

    3.4     Traditional Buildings.............................................................................................. 26

4     Barriers ........................................................................................................................ 27

    4.1     Appetite ................................................................................................................ 28

    4.2     Affordability ........................................................................................................... 29

    4.3     Accessibility .......................................................................................................... 29

5     Cost-Effective Approaches to Renovation .................................................................... 31

    5.1     Identifying Trigger Points ...................................................................................... 31

    5.2     Energy Performance Assessment ......................................................................... 32

    5.3     Influencing Decision Making ................................................................................. 34

    5.4     Building Energy Rating System ............................................................................. 34

    5.5     Stakeholder Engagement...................................................................................... 34

    5.6     Energy Saving Advice ........................................................................................... 35

    5.7     New Delivery Model .............................................................................................. 35

    5.8     Funding and Financing ......................................................................................... 36

    5.9     Promoting Retrofit Projects ................................................................................... 37

    5.10    Large-Scale Retrofit .............................................................................................. 38

    5.11    Guidance & Standards .......................................................................................... 39

    5.12    Energy Performance Contracting .......................................................................... 41

                                                                                                                                        2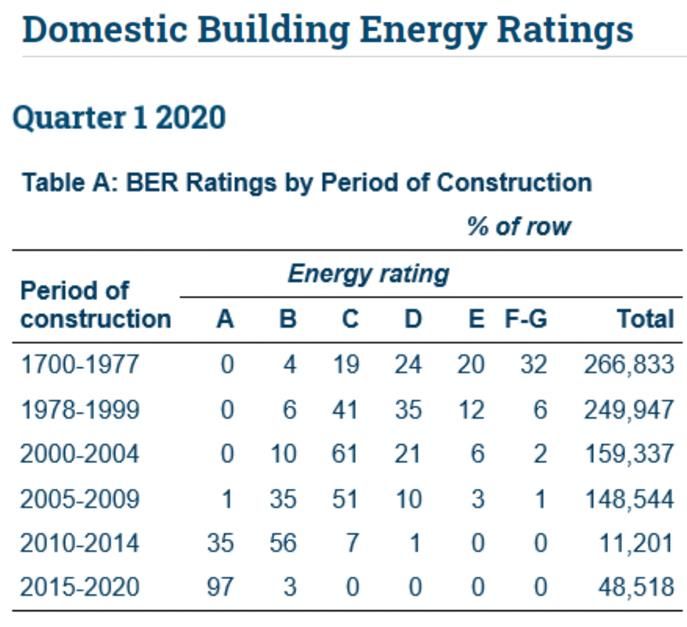
5.13    Skills ..................................................................................................................... 42

6     Policies & Measures .................................................................................................... 44

    6.1     Market Failure ....................................................................................................... 44

    6.2     Energy Poverty ..................................................................................................... 44

    6.3     Residential Sector ................................................................................................. 45

    6.4     Commercial and Public Sector .............................................................................. 46

    6.5     District Heating ..................................................................................................... 48

    6.6     Building Regulations ............................................................................................. 49

    6.7     Policies and Actions on Public Buildings ............................................................... 50

    6.8     Challenging Segments of the National Building Stock ........................................... 52

    6.9     Split Incentive Problems........................................................................................ 53

7     Smart Technologies & Well-Connected Buildings ........................................................ 55

    7.1     Smart Meters ........................................................................................................ 55

    7.2     Smart Readiness Indicator .................................................................................... 55

    7.3     Supporting Technologies and Smart Solutions...................................................... 56

8     Energy Savings and Wider Benefits ............................................................................. 58

    8.1     Energy Savings..................................................................................................... 58

    8.2     Wider Benefits ...................................................................................................... 60

Annex 1: Public Consultation .............................................................................................. 62

Annex 2: Implementation of Ireland’s LTRS 2017-2020 ...................................................... 64

                                                                                                                                         3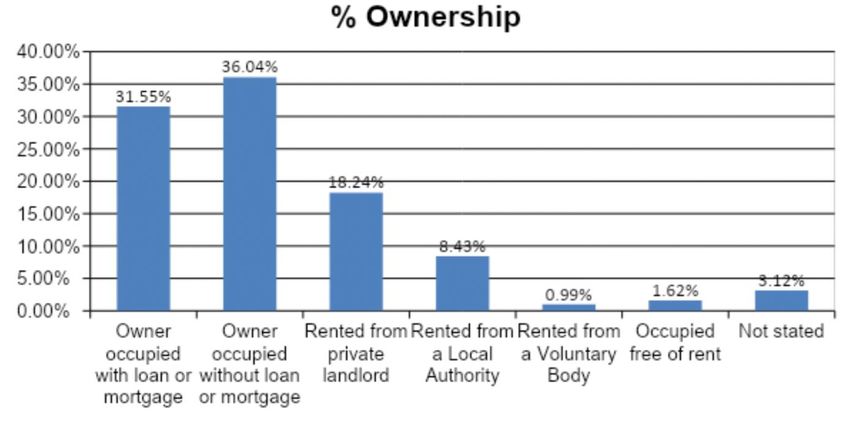
1 Overview
This document sets out Ireland’s Long-Term Renovation Strategy as required by Directive
(EU) 2018/844 of the European Parliament and of the Council of 30 May 2018 amending
Directive 2010/31/EU on the energy performance of buildings and Directive 2012/27/EU on
energy efficiency1.

This Long-Term Renovation Strategy has been developed based on the guidance issued by
the European Commission2.

This Long-Term Renovation Strategy includes Ireland’s existing building renovation policies
which are set out in a range of policy documents most notably the Climate Actin Plan3 and
the National Energy and Climate Plan4. This document does not change or amend policy
and it does not provide a framework for development consent for projects.

Following the formation of a new Government in June 2019, a new Programme for
Government was approved and published. This includes the commitment to an average 7%
per annum reduction in overall greenhouse gas emissions from 2021 to 2030 (a 51%
reduction over the decade) and to achieving net zero emissions by 2050.

As Ireland’s building renovation polices are further developed in order to meet the
commitments set out in the Programme for Government, it is intended to update this Long-
Term Renovation Strategy to encompass new polices and measures. Prior to any updates or
developments to the Strategy, a public consultation will be carried out which will be open to
all organisations and individuals, and will provide them with the opportunity to input into the
process.

1
 Directive (EU) 2018/844 available at https://eur-lex.europa.eu/legal-
content/EN/TXT/PDF/?uri=CELEX:32018L0844&from=EN
2
 Commission Recommendations (EU) 2019/786 available at https://eur-lex.europa.eu/legal-
content/EN/TXT/PDF/?uri=CELEX%3A32019H0786
3
 https://www.dccae.gov.ie/en-ie/climate-
action/publications/Documents/16/Climate_Action_Plan_2019.pdf
4
  https://www.dccae.gov.ie/en-
ie/energy/publications/Documents/26/National_Energy_and_Climate_Plan2021-2030.pdf

                                                                                             4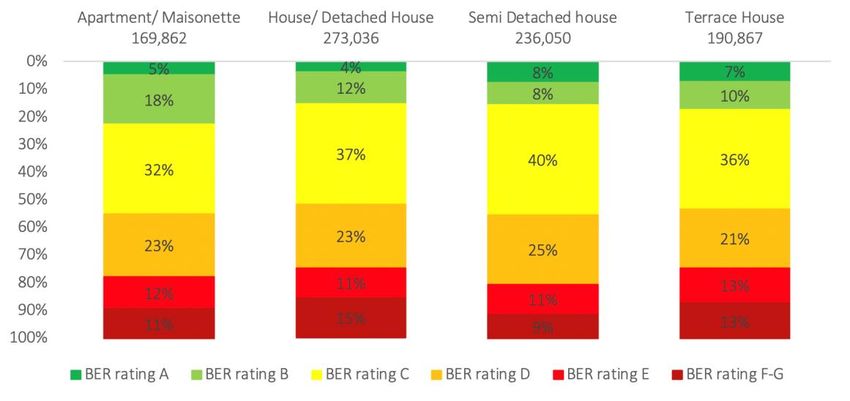
2 Targets and Objectives
2.1 Renovation of Ireland’s Building Stock
In order to reduce emissions in line with national and international targets, Ireland’s building
stock will need to be highly energy efficient and largely decarbonised by 2050.
This will require:
1. ensuring that new buildings are to at least a nearly zero-energy building (NZEB)
standard, and
2. The retrofitting of the majority of existing buildings.
The introduction of advanced Building Regulations, energy and carbon performance
requirements for new dwellings in 2007, 2011 and Nearly Zero Energy Buildings (NZEB)
requirements in 2017 for new buildings other than dwellings and in 2019 for dwellings has
been a key driver in ensuring all new buildings are energy efficient. The NZEB standard,
which has been in place since 1 November 2019, ensures all new buildings are highly
energy efficient. It is projected that approximately 355,000 new dwellings will be constructed
to a Building Energy Rating (BER) level of A by 2030.
It will also be necessary to retrofit older buildings. The Building Regulations require major
renovations to achieve a BER level of B, or cost optimal or carbon equivalent. It is expected
that it will be necessary to retrofit more than 1.5 million buildings by 2050.
2.2 National Milestone Targets
Ireland’s Climate Action Plan5 sets out a detailed roadmap for the period 2021 to 2030 with
the objective of reducing CO2 equivalent emissions from the built environment by 40%-45%
relative to 2030 projections. This includes the milestone targets for 2030.
In the residential sector, these include:
retrofitting 500,000 homes to a BER level of B2 or cost optimal equivalent or carbon
equivalent;
Local Authorities upgrading their housing stock under Phase 2 of the social housing
retrofit programme to bring dwellings to a BER level of B2 or cost optimal equivalent;
installing 600,000 heat pumps (400,000 in existing buildings); and
5
https://www.dccae.gov.ie/en-ie/climate-
action/publications/Documents/16/Climate_Action_Plan_2019.pdf
5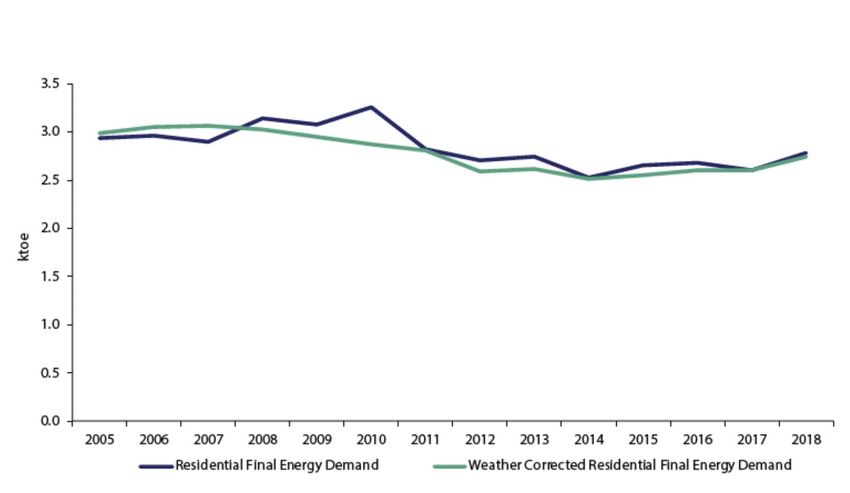
advanced performance requirements in the current regulations combined with a
mandatory renewables requirement, creating a rapid transition to low carbon heating
systems in new dwellings.
In the commercial and public sectors, the targets include:
investments in energy efficiency of existing commercial building stock with a target at
least one-third of total commercial premises upgraded to BER level of B; and
the Public Sector Energy Efficiency Strategy and its associated support programme
assisting public bodies in achieving the national energy efficiency targets of 33%
2020, and 50% by 2030, which includes public buildings.
It is targeted that all public sector buildings and one-third of commercial buildings will be
retrofitted to a BER level of B by 2030. While no milestones have been formally set for 2040
and 2050, it is expected that an indicative milestone of two-thirds of commercial buildings
retrofitted to a BER of B will be reached by 2040 and all commercial buildings by 2050.
Formal milestones have not been set for the residential sector for 2040, however as the
500,000 target for 2030 represents one-third of the stock in the first of three decades, it
currently considered likely that a further 500,000 retrofits would be an expected milestone
target for 2040 ahead of achieving the 1.5 million houses retrofitted by 2050.
The indicative annual breakdown for residential retrofit as modelled Under the With
Additional Measures (WAM) of the National Energy and Climate Plan (NECP) is shown in
the table below. While this may change due to a range of factors, we will endeavour to
deliver in line with the profile below.
For public buildings, it is estimated that an average of 1,350 buildings per annum will be
retrofitted.
Number of Residential Buildings Expected to be Retrofitted to BER B2 per
Annum (or carbon equivalent)
Year Heat Pumps in Residential Buildings
2021 13,000
2022 33,500
2023 55,000
2024 - 2030 56,215 each year
Table 1: Number of Residential Buildings Expected to be Retrofitted to BER B2 per
Annum (or carbon equivalent)
Source: SEAI
6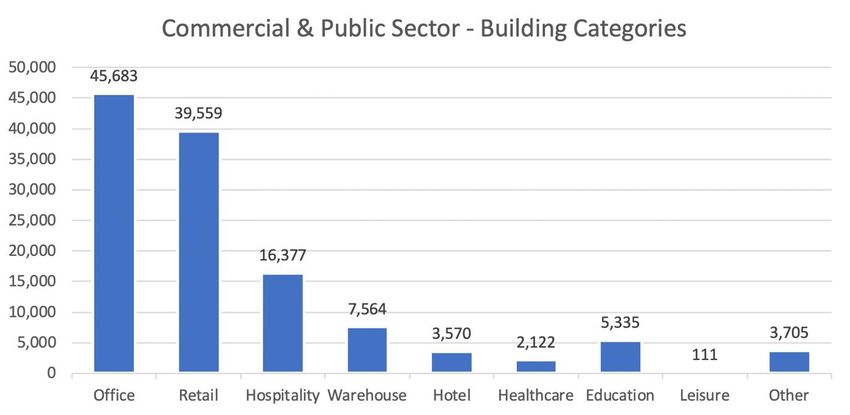
The level of retrofit will lead to an increase in the number of heat pumps and biomass
boilers. The numbers assumed under the With Additional Measures (WAM) of the National
Energy and Climate Plan (NECP) are shown in the table below.

           Cumulative Number of Heating Systems in Existing Buildings

                Heat Pumps in          Heat Pumps in           Biomass Boilers in
    Year          Residential        Commercial/Public         Commercial/Public
                   Buildings          Sector Buildings          Sector Buildings

    2021            53,865                  5,872                     72
    2022            75,365                  6,330                     186
    2023            118,240                 6,752                     307
    2024            161,115                 7,185                     433
    2025            203,990                 7,336                     558
    2026            246,865                 7,489                     558
    2027            289,740                 7,644                     558
    2028            332,615                 7,786                     558
    2029            375,490                 7,928                     558
    2030            418,365                 8,071                     558
Table 2: Cumulative Number of Heating Systems in Existing Buildings

Source: SEAI

                                                                                    7
3 Overview of the National Building Stock

3.1 Climatic Zones and Location
Ireland is a small island with temperate weather across the entire country. There is little
climatic variation across the country. Given the geographical area of the nation and lack of
significant climatic variation across this area there is no need to identify discrete bands of
climatic zones that might require differing interventions.

There is a also very low level of seismic activity in Ireland resulting in very minimal fire safety
and risk in relation to energy efficiency renovations.

The external environment in Ireland presents unique challenges, particularly for internally
insulated solid wall buildings. Many of these structures are already poorly adapted to the
Irish climate and require expensive ongoing maintenance. Wind-driven rainfall indices for
Ireland are well beyond the values experienced by most of the other Member States.
Additionally, atmospheric relative humidity levels are high year-round and the drying
experienced in most Member States through seasonal weather patterns is not experienced
to any similar extent in Ireland.

More than one-third of Irish dwellings are in rural areas and 93%6 of these dwellings are
either detached or semi-detached. The combination of high numbers of rural dwellings and
single family homes makes retrofit project aggregation more challenging in Ireland.

There are high levels of privately-owned single-family dwellings which have been adapted to
particular family needs over time on a piecemeal basis. This introduces a level of
customisation in the residential building stock which makes aggregation of retrofitting more
challenging. For instance, even buildings built on the same street at the same time by the
same builder are adapted over time and become very different in their floor area and energy
use.

3.2 Residential Sector
3.2.1 Building Numbers, Types, Age and Occupancy
There are approximately 1.7 million occupied residences in Ireland. The vast majority of
residential buildings in Ireland are single family houses. Only one in eight dwellings in Ireland
is an apartment or part of a multi residential unit.

6
    2016 Census

                                                                                                 8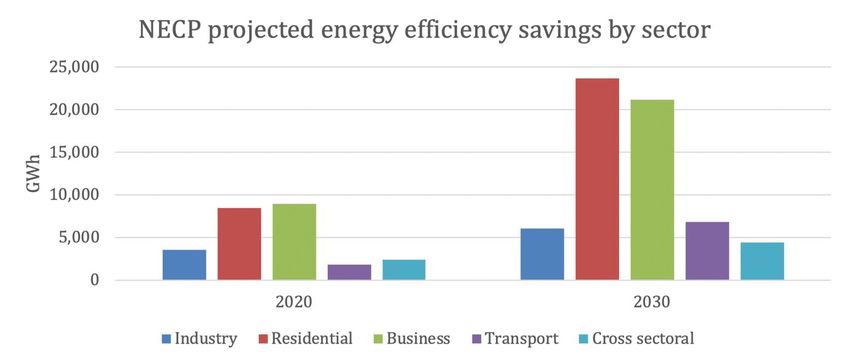
Figure 1: Residential Building Categories
                          7
Source: The 2016 Census (residential data)

The European Housing Review of 2007 found that Ireland has the youngest dwelling stock in
the EU. Buildings constructed in Ireland pre-1940 (described as ‘traditional buildings’) are
generally of solid masonry wall construction and deal with moisture in a very different way to
modern buildings, allowing the absorption, movement and evaporation of moisture within the
building fabric rather than attempting to exclude it, as is the case with most modern
buildings.

A general lack of understanding of the hygrothermal (the movement of heat and moisture
through buildings) performance of the traditional building stock in the construction industry
and among specifiers together with the diverse nature of these buildings, can pose some
difficulty in retrofitting. Approximately 16% of the residential building stock was constructed
prior to 1940. A further 15% of the current housing stock was completed before 1970, and
has little or no insulation built in.

The first Building Regulations, that explicitly addressed conservation of fuel and energy in
buildings, were issued in 1992. Approximately 58% of residential dwellings date from before
this time. As a result of the Building Regulations, dwellings built after 2006 are required to
have a higher level of energy efficiency.

7
    The next Census in Ireland is due to take place in 2021.

                                                                                             9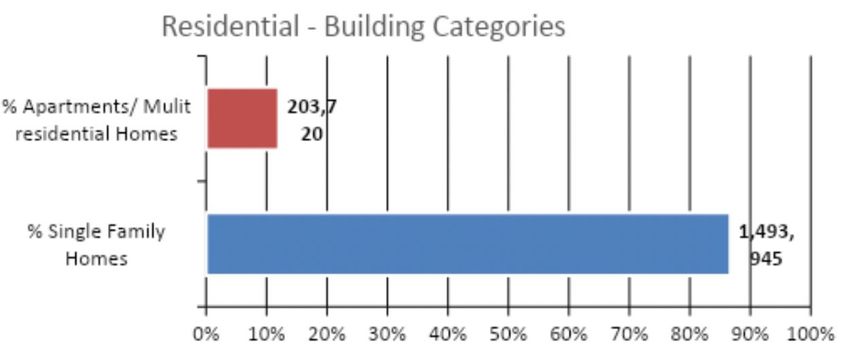
Figure 2: Age Bands of Occupied Dwellings

Source: Census 2016

Approximately two-thirds of residential buildings in Ireland are owner occupied; although,
there has been a trend towards renting in recent years. 36% of Irish households own their
home outright, without any mortgage or loan. Tenure is an important consideration for retrofit
or renovation programmes as consumers with different tenures are likely to have differing
circumstances and motivation. The private rental sector represents 18% of the Irish housing
stock.

                                                                                           10
Figure 3: Breakdown of Ownership
Source: Census 2016
3.2.2 Energy Performance
The figure below shows the trend for residential sector final energy consumption between
2005 and 2018. Residential energy demand decreased every year between 2007 and 2012
but increased between 2015 and 2018. Residential final energy use in 2018 was 2,786 ktoe
which is 5.1% below the level recorded in 2005. Correcting for weather variations, 2018
residential final energy use was 8.2% below 2005.
11Figure 4: Residential Final Energy.
Source: SEAI December 2019
30
25
Energy per dwelling (MWh/dwelling/annum)
20
15
10
5
0
2000 2001 2002 2003 2004 2005 2006 2007 2008 2009 2010 2011 2012 2013 2014 2015 2016 2017 2018
Total energy Non-electric energy Electricity
Total energy (Weather corrected) Non-electric (Weather corrected) Weather corrected electricity
Figure 5: Energy per dwelling
Source: SEAI September 2020
12All fuels unit 2016 2017 2018
Space heating ktoe 61% 1,652 59% 1,535 61% 1,686
Space cooling ktoe 0% 0 0% 0 0% 0
Water heating ktoe 19% 507 20% 516 19% 532
Cooking ktoe 2% 61 2% 63 2% 64
Lighting and
appliances ktoe 17% 459 18% 468 17% 477
Other end uses ktoe 1% 25 1% 25 1% 26
Total Residential /
Households ktoe 2,704 2,608 2,786
Table 3: End use of energy in the residential sector
Source: SEAI September 2020
Between 2005 and 2018, sources of fuel were relatively stable, with a gradual increase in
the share of electricity and gas and a gradual, decline in coal, peat and oil use. The mix of
fuels consumed in the residential sector over the period as well as the growth rates,
quantities and shares are shown in the figures below.
Oil remains the dominant fuel in the residential sector, though its share reduced slightly, from
39% in 2005, to 38% in 2018. Electricity was the second largest source of energy in the
sector in 2018, at 25%, with natural gas having the next largest share at 22%. The
renewables share of final energy used directly in households in 2018 was 2.5% which does
not take into account the renewable share of electricity use.
Over the period 2007 to 2014 weather-corrected residential energy use declined by 18%, or
542 ktoe. The majority of the reduction was due to oil use which fell by 28% (or 324 ktoe)
followed by gas, which fell by 16%, (100 ktoe). Electricity consumption in the residential
sector peaked in 2010 and has fallen by 2.1% since then.
13Overall Quantities
Average Annual Growth (%) Share (%)
Growth (%) (ktoe)
Residential 1990 - 2005 - 2005 - 2010 - 2015 -
2018 2005 2018 2005 2018
TFC 2018 2018 2018 2015 2018
Fossil Fuels
8.5 -11.3 -0.9 -5.0 1.7 8.3 2,271 2,015 77.3 72.3
(Total)
Coal -75.2 -36.9 -3.5 -4.1 -9.0 4.4 246 155 8.4 5.6
Peat -72.9 -28.0 -2.5 -4.6 -0.7 4.4 273 197 9.3 7.1
Briquettes -55.6 -23.8 -2.1 -3.7 -1.9 13.5 90 69 3.1 2.5
Oil 172.0 -7.5 -0.6 -5.4 3.5 9.5 1,145 1,059 39.0 38.0
Gas 415.2 -0.4 0.0 -4.8 2.9 8.7 607 604 20.7 21.7
Renewables 52.9 246.1 10.0 6.4 4.2 8.0 20 68 0.7 2.5
Combustible
7.4 -10.7 -0.9 -4.9 1.6 8.3 2,287 2,043 77.9 73.3
Fuels (Total)
Electricity 97.3 8.8 0.7 -1.6 1.2 2.6 646 703 22.0 25.2
Total 23.4 -5.1 -0.4 -4.0 1.6 6.8 2,937 2,786 100.0 100.0
Total
(weather- 15.6 -8.2 -0.7 -2.3 2.5 5.5 2,995 2,749 - -
corrected)
Table 4: Growth rates, quantities and shares of final consumption in the residential sector
Source: SEAI December 2019
In 2018, the average dwelling consumed a total of 18,208 kWh of energy based on weather-
corrected data. This comprised 13,614 kWh (75%) of direct fuels and 4,594 kWh (25%) of
electricity.
The average final energy use of permanently occupied dwellings reduced significantly
between 2005 and 2014, before returning to growth in 2015 and 2016, falling in 2017, and
growing again in 2018. Weather-corrected total final energy consumption per dwelling had
been consistent for the last three years, and is still 27% below 2005 levels. Between 2007
and 2018, the final energy use of electricity per dwelling, weather corrected, reduced by
14%.
14Overall Growth Quantities (kWh/
Residential Average Annual Growth (%)
(%) Dwelling)
Unit Energy
Consumption 1990 - 2005 - 2005 - 2010 - 2015 -
2005 - 2018 2018 2005 2018
2018 2018 2010 2015 2018
Total Energy -30.2 -24.5 -2.1 -1.0 -5.0 1.0 6.2 24,105 18,208
Fossil Fuel
-38.0 -27.6 -2.5 -1.2 -5.8 1.1 7.7 18,802 13,614
Energy
Electrical
11.7 -13.4 -1.1 -0.6 -2.7 0.6 2.0 5,302 4,594
Energy
Residential Quantities
Overall Growth (%) Average Annual Growth (%)
Unit Energy (kWh/Dwelling)
Consumption
1990 - 2005 - 2005 - 2010 - 2015 -
Weather 2005 - 2018 2018 2005 2018
2018 2018 2010 2015 2018
Corrected
Total Energy
Climate -34.5 -26.9 -2.4 -3.4 -3.9 1.9 4.9 24,583 17,967
Corrected
Fossil Fuel
Energy Climate -42.5 -30.5 -2.8 -4.2 -4.3 2.3 6.0 19,261 13,385
Corrected
Electrical
Energy Climate 10.4 -13.9 -1.1 -0.6 -2.8 0.8 1.8 5,322 4,582
Corrected
Residential Quantities
Overall Growth (%) Average Annual Growth (%)
Energy-Related (tCO2/Dwelling)
CO2 Unit 1990 - 2005 - 2005 - 1990 - 2005 - 2005 - 1990 -
2005 - 2018 2005
Emissions 2018 2018 2010 2018 2018 2018 2018
Total Energy
-52.1 -38.7 -3.7 -2.6 -5.7 -2.2 -0.6 8.4 5.1
CO2
Fossil Fuel
-51.4 -31.9 -2.9 -1.7 -6.0 0.4 7.4 5.0 3.4
Energy CO2
Electrical
-53.2 -48.8 -5.0 -4.1 -5.1 -6.5 -13.2 3.4 1.7
Energy CO2
Table 5: Growth rates and quantities of residential energy consumption and unit of CO2
emissions
Source: SEAI December 2019
The emissions of energy-related carbon per dwelling fell by 39% over the period 2005 to
2018, while the reduction for unit energy use was 24%. In 2018, the average dwelling was
responsible for emitting 5.1 tonnes of energy-related CO2. A total of 3.4 tonnes of CO2
15(66%) came from direct fuel use in the home and the remainder indirectly from electricity
use.
Energy-related CO2 emissions per dwelling for direct non-electric fuel use fell by 32%
between 2005 and 2018, primarily as a result of reduced energy consumption per dwelling.
CO2 emissions from electricity use reduced by 49% in the same time period due to a
combination of reduced electricity use and the reduced carbon intensity of the electricity grid.
The carbon intensity of grid electricity has improved since 2002, with combined-cycle gas
turbines replacing oil, peat and coal-fired generation and the contribution of renewables in
electricity generation began to grow.
Emissions from energy use in households increased by just 0.04% in 2018, the increase
kept low as a result of the decreased CO2 intensity of the electricity supplied and countered
by increased fossil fuel consumption. Emissions from the direct use of fuel increased by 8%
in 2018.
The table below illustrates the BER system as operated in Ireland.
Building Energy Rating Rating Primary Energy
A rating < 75 kWh/m2/yr
B rating 75 to 150 kWh/m2/yr
C rating 150 to 225 kWh/m2/yr
D rating 225 to 300 kWh/m2/yr
E rating 300 to 380 kWh/m2/yr
F rating 380 to 450 kWh/m2/yr
G rating > 450 kWh/m2/yr
Table 6: Building Energy Rating (BER) Chart
The most recent data on the energy rating of the national housing stock is presented in the
table and graph below. It shows the distribution of energy ratings nationally as of 2019.
Produced by the CSO it projects the national picture of energy ratings with actual BER
ratings weighted to national level.
16Figure 6: BER Ratings by type of dwelling
Source: CSO BER Database
Dwellings built in 2015-2019 were considerably more energy efficient than in earlier periods
with 97% given a BER “A” compared with 36% in 2010-2014 and 1% in 2005-2009.
Figure 7: Domestic BER Chart
Source: CSO April 2020
3.2.3 Renovation to Date
The graphic below shows dwellings that have had more than one BER audit carried out. This
illustrates the progress in the past decade in improving residential energy ratings.
17Figure 8: Earliest BER compared with latest for dwellings with multiple BERs (2009-2020)
8
Source: CSO 2020 based on over 835,000 ratings for that period.
In Ireland energy efficiency grant and support schemes are designed to support energy
efficiency upgrades to houses built before 2006 and installation of renewables in houses
built before 2011. Building regulations introduced from 2006 required an improved level of
energy performance and regulations introduced from 2011 required renewables to be
installed. Since its introduction over 400,000 households have availed of Government grant
support under the Better Energy Programme.
In the period between 2000 and 2019, circa one-third of homes had some renovation work
done with Government or energy supplier support. Renovations carried out over the period,
where these do not involve State support or are not supported by an energy supplier, are not
currently recorded. The focus since 2017 has been more in-depth of renovation. Therefore,
while the overall number of home renovations with state supports may have declined in
comparison to previous years, the level of renovation in those homes has been significantly
higher.
3.3 Commercial & Public Sector
Ireland has a commercial building stock that includes offices, retail and industrial buildings.
The public sector building stock includes offices, hospitals and healthcare buildings, schools
and educational buildings, cultural and historic buildings and Garda (police) stations.
8
https://www.cso.ie/en/releasesandpublications/er/dber/domesticbuildingenergyratingsquarter12020/
183.3.1 Building Numbers, Types, Age and Occupancy
There are an estimated 124,000 buildings in the commercial and public sector in Ireland with
the largest numbers being offices and retail outlets. A breakdown by category is shown
below.
Figure 9: Commercial and Public Sector Building Categories
Source: SEAI: Extensive survey of the commercial buildings stock in Ireland
The building stock in Ireland includes approximately 15,000 public sector buildings and in or
around 109,000 commercial buildings. A breakdown of commercial buildings by size is
shown below.
19No. of Commercial buildings in Ireland
45
40
1000s of Buildings
35
30
25
20
15
10
5
0
Office Retail Hospitatlity Warehouse Hotel
Large 2 3 0 1 1
Small 40 37 16 6 3
Figure 10: Number of Commercial Buildings
Source: SEAI: Extensive survey of the commercial buildings stock in the Republic of Ireland
Large Building: Gross Floor Area > 1000m2; Small Building Gross Floor Area < 1000m2
It is estimated that 29% of commercial buildings in Ireland also incorporate a level of
residential use with the remaining 71% being exclusively commercial.
An estimated 38% of commercial building stock in Ireland consists of standalone buildings
with the majority of buildings attached to one or more other buildings. A breakdown is
provided below.
Figure 11: Building Type
Source: SEAI: Extensive survey of the commercial buildings stock in the Republic of Ireland
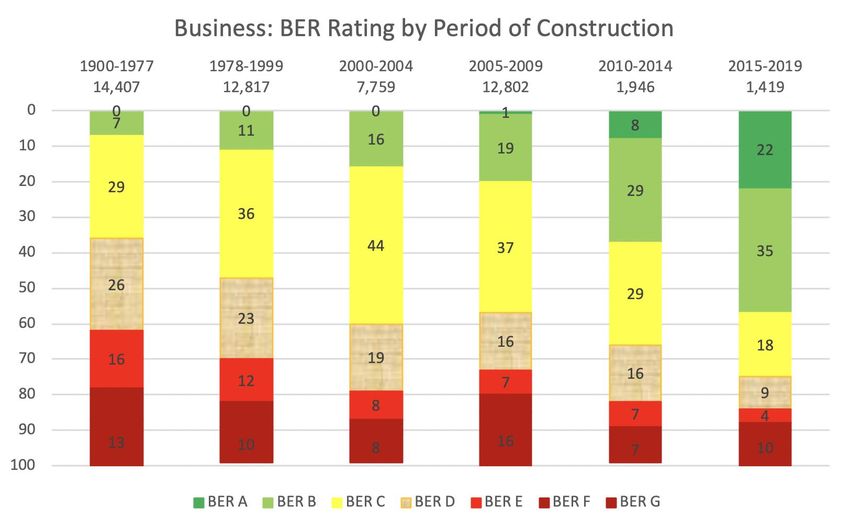
20An estimated 7% of Ireland’s commercial building stock has been constructed since 2010. A
breakdown is provided below.
Business: Period of Construction
30% 28%
25% 25%
25%
20%
15%
15%
10%
5% 4%
3%
0%
1900-1977 1978-1999 2000-2004 2005-2009 2010-2014 2015-2019
14,407 12,817 7,759 12,802 1,946 1,419
Figure 12: Commercial and Public Sector Period of Construction %
The commercial building stock in Ireland includes a mix of owner-occupier and rented
buildings. A breakdown, including who the decision maker is in relation to retrofitting, is
provided below.
21Figure 13: Decision Makers
3.3.2 Energy Performance
An indication of the energy performance of buildings by period of construction is provided
below based on available data. It should be noted that this data is not available for all
buildings and is more likely to be available for those that have undergone retrofit and so
should be treated as indicative only.
The figure below shows the trend for final energy consumption in the commercial and public
sector between 2005 and 2018.9 Commercial and public sector energy demand decreased
every year between 2008 and 2014 but increased between 2015 and 2018.
Commercial and public sector final energy use in 2018 was 1,484 ktoe, 5.4% below the level
recorded in 2005. Correcting for weather variations, 2018 final energy use was also 8.2%
below 2005. When reviewed based on the number of employees, the energy use/employee
in 2018 was 10,040 kWh/employee a 22.9% improvement on the level recorded in 2005.
9
The data regarding energy use are sourced from: Energy in Ireland. 2019 Report, Sustainable
Energy Authority of Ireland, 2019.
22Figure 14: Commercial and Public Sector Final Energy
Source: SEAI December 2019
14
12
Energy per dwelling (MWh/dwelling/annum)
10
8
6
4
2
0
2005 2006 2007 2008 2009 2010 2011 2012 2013 2014 2015 2016 2017 2018
All energy use Non-electricity Electricity All energy use, weather corrected
Figure 15: Energy per dwelling
Source: SEAI September 2020
Electricity is the dominant fuel in the commercial and public sector, though its share reduced
slightly, from 46% in 2005, to 43% in 2018. Fossil fuels remained consistent at 53%,
however oil reduced from 33% to 18% and gas increased from 19% to 36%. The renewables
share of final energy used directly in commercial and public Sector in 2018 was 2.9%. The
23emissions of energy-related CO2 emissions fell by 37% over the period 2005–2018. This is
shown in more detail in the tables below.
Quantity
Overall Growth (%) Average Annual Growth (%) Shares (%)
(ktoe)
Commercial/
Public TFC
2005 - 2010 - 2015 -
1990 - 2018 2005 - 2018 2018 2005 2018 2005 2018
2018 2015 2018
Fossil Fuels
9.3 -4.5 -0.4 -4.2 6.1 7.8 837 800 53.4 53.9
(Total)
Coal -100.0 -100.0 -100.0 - - - 27 - 1.7 0.0
Oil -55.8 -47.7 -4.9 -9.6 4.2 4.0 511 268 32.6 18.0
Gas 466.2 78.2 4.5 -0.4 7.2 9.9 299 532 19.0 35.8
Renewables 89719.3 964.6 20.0 8.7 9.7 -2.0 4 43 0.3 2.9
Combustible
12.8 -1.8 -0.1 -4.0 6.1 7.2 840 825 53.6 55.6
Fuels (Total)
Electricity 167.0 -11.8 -1.0 -1.2 3.4 5.3 728 642 46.4 43.2
Total 52.7 -5.4 -0.4 -2.7 5.0 6.4 1,569 1,484 100.0 100.0
Total Climate
43.0 -8.2 -0.7 -1.1 5.9 5.2 1,597 1,466 - -
Corrected
Table 7: Growth rates, quantities and shares of final consumption in the commercial and
public sector
Source: SEAI December 2019
Overall
Average Annual Growth (%) Quantity (kWh)
Growth %
Commercial/Public Energy per
Employee 2005 - 2010 - 2015 -
2005 - 2018 2018 2005 2018
2018 2015 2018
Total kWh/employee -22.9 -2.0 -4.1 1.9 3.0 13,020 10,040
Fuel kWh/employee -18.3 -1.5 -5.2 3.1 3.9 6,980 5,699
Electricity kWh/employee -28.1 -2.5 -2.6 0.3 1.9 6,040 4,341
Commercial/Public Energy per 2005 - 2010 - 2015 -
2005 - 2018 2018 2005 2018
Employee (Climate Corrected) 2018 2015 2018
Total kWh/employee (cc) -25.2 -2.2 -2.5 2.7 1.8 13,248 9,914
Fuel kWh/employee(cc) -21.9 -1.9 -3.0 4.4 2.1 7,163 5,596
Electricity kWh/employee(cc) -29.0 -2.6 -1.9 0.7 1.4 6,085 4,318
Table 8: Growth rates and quantities of unit energy consumption per employee for
Commercial and Public Sector
Source: SEAI December 2019
24Overall Quantity (kt
Average Annual Growth (%) Share (%)
Growth % CO2)
Commercial/ Public
CO2
2005 - 2010 - 2015 -
2005 - 2018 2018 2005 2018 2005 2018
2018 2015 2018
Combustible Fuels -13.6 -1.1 -4.9 5.5 7.5 2,385 2,060 30.7 42.4
Electricity -48.0 -4.9 -3.6 -3.9 -10.4 5,379 2,800 69.3 57.6
Total -37.4 -3.5 -4.1 -0.3 -3.6 7,764 4,860 100.0 100.0
Table 9: Growth rates, quantities and shares of CO2 emissions in Commercial and Public
Sector
Source: SEAI December 2019
Figure 16: Non-domestic BER rating by period of construction
Source: CSO compiled from SEAI BER Database
There is a range of exchequer supports available to incentivise the upgrading of buildings in
the commercial and public sector. In addition, the Energy Efficiency Obligation Scheme
provides a market-funded incentive for retrofit. A limited number (estimated to be circa 3% of
commercial and public sector buildings) have been upgraded to date using these support
schemes. The level of retrofit is thought to be significantly higher. However, gathering
accurate data on the level of retrofit is not straightforward.
253.4 Traditional Buildings
Traditional buildings are generally defined as those constructed with solid masonry walls,
single-glazed windows and timber-framed roofs. This type of construction was typically used
in buildings constructed in Ireland before 1940. Many of these buildings have statutory
protection. There are currently over 45,000 protected structures (the majority of which are
buildings in use) while many other historic buildings are located within architectural
conservation areas. However, most traditional buildings do not have statutory protection.
Traditional buildings occur in the residential, commercial and public sectors. Based on the
2016 Census it is estimated that some 18% of dwellings fall into the traditionally built
category. These buildings are generally constructed with vapour-permeable materials and do
not incorporate barriers such as damp-proof courses, vapour barriers and membranes and
the like which are considered standard in modern construction. For this reason, traditional
building fabric is often referred to as ‘breathable’ construction which both absorbs and
readily allows the evaporation of moisture. Therefore, some approaches to energy insulation
retrofit are not suitable as they would cause damage to the structures and adversely impact
on the internal living environment and the health of its occupants.
The Department of Culture, Heritage and the Gaeltacht are leading the development of a
retrofitting guidance document for traditionally built buildings. Other key stakeholders include
the Department of Housing, Planning and Local Government, Department of
Communications, Climate Action and Environment and the Sustainable Energy Authority of
Ireland.
264 Barriers
This scale of retrofit ambition is a significant challenge for Ireland. This is demonstrated by
the level of retrofit carried out to date in the residential sector. There were an estimated
23,00010 homes renovated in Ireland in 2019 (with State support through SEAI schemes) of
which approximately 1,500 were renovated to a BER level of B2 or better. Meeting the
500,000 target will require an average of 50,000 homes to be renovated to this standard
each year to 2030.
To enable this scale up the Irish Government has:
1. approved a National Development Plan that has allocated funding of €4.5 billion to
support energy efficiency improvements across the residential and public sector;
2. committed to increasing the price of carbon to €100 per tonne by 2030 in the
Programme for Government;
3. established a Retrofit Taskforce to focus on residential renovation; and
4. set a high level of ambition and leadership expected of the Public Sector.
Ireland faces a number of challenges in reducing emissions from our buildings. Our homes
use 7% more energy than the EU average11. Our buildings are 70% reliant on fossil fuels,
including oil-fired boilers; over 80% of our homes and other buildings assessed have a BER
level of C or worse. The current annual retrofit activity for existing stock is relatively low.
Achieving the new retrofit targets it will require analysis of the issues and barriers, and
developing appropriate responses to address those barriers. It will also entail very significant
scaling up of effort, capacity and investment.
The key barriers can be grouped around three themes. These are:
Appetite,
Affordability, and
Accessibility.
The assessment of barriers, set out below, is structured around these themes.
10
Source SEAI
11
SEAI, Energy in the Residential Sector 2018.
274.1 Appetite
It is necessary to grow the appeal of and appetite for retrofit. Unless and until homeowners
and decision makers in the commercial and public sectors decide to take the retrofit steps –
it will be difficult, if not impossible, to achieve the massive uptake in renovation that we need.
The barrier here goes beyond awareness, it’s about motivation. The responses will need to
entail a focus on making retrofit a more attractive and desirable choice. This will mean
demonstrating the advantages and multiple benefits resulting from retrofit, development of
effective messaging and marketing as well as push factors.
The following barriers are common across the residential, commercial and public sectors:
In many cases, the decision maker (e.g. a landlord) will not significantly benefit from
the retrofit (e.g. the tenant will have greater comfort and lower utility bills). This is the
split incentive problem and is considered a key barrier.
Opportunities to influence renovation decisions are often time constrained. People's
personal circumstances influence receptiveness to the renovation message and
appeal varies depending on the stage decision makers are at.
Even when people consider renovation, it is usually not a priority for them and will not
happen unless its appeal and benefits can be more effectively “sold”.
There can be a lack of trust and confidence that the promised outcomes will be
delivered as promised.
Energy costs are sometimes not as visible or significant for some – so reducing
energy use is often not prioritised.
The status quo tends to be the default approach in the absence of an imperative
such as regulation to act differently.
The following barriers are most prevalent in the residential sector:
Lack of awareness of retrofitting and what it means for their homes.
Long pay back periods and significant upfront costs.
The level of disruption and “hassle” associated with the experience including from:
o Co-ordinating contractors
o Disruption in the home
o Paperwork associated with applying for grants
The following barriers are prevalent in the commercial and public sectors:
28 Lack of expertise, resources, time and information are key barriers to achieving
improved energy efficiency and renovation in the commercial sector.
In the absence of a requirement to act the focus will be on their core business
objectives which, in many cases, do not include renovation.
Without senior management commitment, improved energy efficiency and retrofit is
much less likely to happen.
4.2 Affordability
Renovation on the scale needed can only happen if affordability is addressed. Affordability
does not appear as a barrier until appetite exists. For those who have developed an appetite
affordable options will be required. Mechanisms will need to be developed to allow the
decision makers – be they homeowners, landlords or businesses to acquire the renovation in
an affordable way. This is likely to entail partial financial assistance in the form of grants or
supports – especially for homeowners – and will require the right financing solutions to be
developed which meet the affordability circumstances of the people or organisations
concerned.
The following barrier is common across the residential, commercial and public sectors:
Renovations can be expensive – sometimes too expensive to be an option for many.
The following barriers are more prevalent in the residential sector:
Affordability is a significant barrier given the high up-front costs
A lack of finance and loans at attractive interest rates or with sufficiently low monthly
repayment costs.
Paperwork associated with grants can be a barrier.
The following barriers are more prevalent in the commercial and public sectors:
Many businesses lack the resources as well as the expertise to invest in energy
efficiency or retrofit.
To date there has been only modest interest and uptake of Energy Performance
Contracting (EPC)
4.3 Accessibility
Accessibility is about making it not just possible, but easy, for decision makers to renovate.
This covers availability of the right solutions – effective project approaches delivering the
desired results at the right quality. It entails ensuring enough people with the right skills to
29carry out the work to the right standards. It also means making the project or journey as easy
for the decision makers as possible – and one-stop-shops will have a role in this regard.
The following barriers are common across the residential, commercial and public sectors:
Projects are perceived as complex and or disruptive.
Not enough of the skilled and trusted people or companies to do the work to the
required quality.
Without the right guidance and standards, the necessary quality outcomes will not be
delivered and further uptake will be impeded.
The following barriers are more prevalent in the residential sector:
Complexity of the retrofit process;
Lack of independent advice;
Lack of trust in contractors;
Lack of confidence post-works around validity of guarantees provided by contractors.
The following barriers are more prevalent in the commercial and public sectors:
Without being pushed to do so most businesses would not prioritise or act on retrofit.
A reluctance to embark on renovation (entailing expenditure of effort and resources)
without visibility of effective approaches.
305 Cost-Effective Approaches to Renovation
It is important that approaches used ensure renovation is carried out in a cost-effective
manner.
For instance, having energy renovation work done at the same time as other work (e.g.
when carrying out major upgrade works) delivers cost effectiveness due to economies of
scale while also minimising disruption. Cost effectiveness can also be enhanced by carrying
out more works at once than by retrofitting in an incremental or piecemeal fashion. While
retrofitting incrementally can be supported and facilitated new approaches are needed to
encourage packages of measures or more substantial retrofit wherever possible as this
maximises the energy saving gain, minimises disruption and optimises cost effectiveness.
Cost effectiveness is considered in the BER advisory report as it outlines the different
approaches appropriate to the property and their relative costs. It communicates to the
decision maker how cost effectiveness can be enhanced by availing of grant support for
some of the measures.
Cost effectiveness may also be improved through aggregation and this is a key component
of the approach to renovation at scale which will be led by the Retrofit Taskforce. The
Retrofit Taskforce has cross Departmental and agency membership and has been
established to oversee the design and development of a new retrofit delivery model with a
specific focus on the residential sector.
The following sub-sections set out a range of approaches that are being employed or
considered in order to enhance cost-effectiveness.
5.1 Identifying Trigger Points
Research undertaken for the Retrofit Taskforce indicates that certain “trigger points” can
make consumer cohorts more likely to carry out retrofits. Trigger points include:
House renovations and work:
o Major renovations which trigger the Building Regulations
o Other home renovations that don’t require planning permission, but
contractors are in the house anyway to advise and carry out work
o Heating system failure
Home purchases with BER certificate informing homeowner of energy performance:
o Mover purchasers (both upgrades and downgrades)
31o Buy to let
o First time buyers
Key life events:
o Households with new babies
o Health issues
o Finalisation of mortgage repayments
o Eligibility for energy poverty retrofits schemes.
Building regulations relating to major works on existing buildings are used to ensure that
when a substantial renovation is taking place on an existing building that energy renovation
requirements come into play. Building regulations, already in force, require that where major
renovations12 are taking place that the energy performance of the whole property is
improved. The improvement required13 has been identified in the Cost Optimal Report14.
5.2 Energy Performance Assessment
The Department of Housing, Planning and Local Government carried out an assessment of
cost-optimal calculations and a gap analysis for residential15 and non-residential16 buildings.
The report describes cost-optimal calculations and gap analysis for buildings in accordance
with Article 5 of Directive 2010/31/EU of the European Parliament and of the Council of 19
May 2010 on the energy performance of buildings (recast). The report has been developed
in accordance with Commission Delegated Regulation (EU) No 244/2012 of 16 January
2012 supplementing Directive 2010/31/EU of the European Parliament and of the Council on
the energy performance of buildings (hereinafter referred to as the Cost-Optimal Regulation)
and the associated Guidelines accompanying Commission Delegated Regulation (EU) No
244/2012 of 16 January 2012.
For the 2019 non-residential report the cost optimal level has been compared to 2017 Part L
of the Building Regulations performance requirements. This regulation introduces Nearly
12
“Major renovations” means the renovation of a building where more than 25% of the surface area of
the building envelope undergoes renovation.
13
125kWh/m2/year, where technically, functionally and economically feasible
14
Cost optimal report
15
https://www.housing.gov.ie/sites/default/files/publications/files/200407_irish_2019_non-
domestic_cost_optimal_report_revised_.pdf
16
https://www.housing.gov.ie/sites/default/files/publications/files/200407_irish_2018_residential_cost_
optimal_report_revised_0.pdf
32Zero Energy Building performance requirements and Major Renovation provisions into
Ireland’s Building Regulations for buildings other than dwellings.
The 2018 residential cost optimal report compares the cost optimal level to the NZEB
performance requirements which were implemented in 2019. These regulations introduce
Nearly Zero Energy Building performance requirements and Major Renovation provisions to
a cost optimal level into Ireland’s Building Regulations for Dwellings.
The cost optimal level of performance is the energy performance level which leads to the
lowest cost during the estimated economic lifecycle where the lowest cost is determined
taking into account energy-related investment costs, maintenance and operating costs. The
cost optimal calculations will be revised every 5 years and regulations will be reviewed if
performance levels deviate off cost optimal. This regular assessment allows for a review of
the minimum energy performance requirements for buildings in light of technical progress.
The performance requirements in building regulations are set at the cost optimal levels
which ensure that the best energy performance is obtained for the lowest lifecycle cost
taking account of capital cost and operating costs. These calculations have been carried out
to assess performance requirements in 2013 and again in Sept. 2018.
A range of solutions can be used to achieve these performance requirements. The advanced
performance requirements in the current regulations combined with a mandatory renewables
requirement is creating a rapid transition to low carbon heating systems in new dwellings.
Builders and homeowners have a choice in deciding which energy system best suits their
needs.
The NZEB requirements make it more attractive for builders and homeowners to further
incorporate renewable technologies and move away from traditional fossil fuels. The Central
Statistics Office analysis of Building Energy Rating data demonstrates this shift away from
fossil fuels; the installation of oil boilers has dropped from 36% to 4% in new dwellings, and
electrical systems (primarily heat pumps) make up 44% of heating systems in new dwellings
with this percentage growing steadily each year.
It is estimated that the cumulative improvements to regulations mean that a dwelling built to
the 2011 Part L regulations requires 90% less energy than the equivalent dwelling built in
1978 to deliver the same standards of heat, hot water and light. This shows the very
significant progress that has already been made in the standards for new buildings.
335.3 Influencing Decision Making
The SEAI Behavioural Economics Unit was established in 2017 to focus on encouraging
measurable changes to homeowners’ and business’ energy behaviour, using the latest
evidence from Behavioural Science and Economics. The unit’s process of rapid iteration
helps to design and test impactful behaviour change strategies. Successful strategies can
then be scaled and incorporated into national schemes.
5.4 Building Energy Rating System
One way to help focus people on renovation opportunities is to present them with renovation
suggestions – practical measures they can take and associated costs in an accessible way.
With this in mind SEAI, working with key stakeholders, have developed a new enhanced
BER Advisory report to be introduced in 2020. These reports are provided when a new
Building Energy Certificate is obtained – when a property is offered for sale. It therefore has
the potential to be a catalyst for action at some key trigger points. Additional supports
include the development by SEAI of a technical advisor role for home grant schemes to
assist homeowners for technologies such as heat pumps.
5.5 Stakeholder Engagement
To help better understand the issues facing businesses, particularly smaller businesses,
DCCAE conducted a stakeholder engagement exercise the results of which were published
in 201817. The responses confirmed that businesses were time poor – needing to focus
primarily on delivering their service or producing their products and there was little interest in
renovation. Since then the additional uncertainties and pressures arising from preparing for
Brexit, and more recently the impacts of Covid-19, mean it will be a challenge to engage
most businesses to meaningfully consider and respond to renovation objectives.
A key learning from the stakeholder engagement exercise was that businesses were
primarily interested in technological solutions and investments with short payback periods.
Businesses and investment decisions tend to favour investments for projects with relatively
short timeframes of three years or less. Furthermore, businesses with restricted access to
capital will also evaluate the opportunity cost of capital invested in energy efficiency against
investment in their core business which may offer more attractive returns than a competing
energy efficiency project.
17
https://www.dccae.gov.ie/en-ie/energy/publications/Pages/Report-on-the-Findings-from-the-
DCCAE-Commercial-Sector-Survey-Consultation0328-5224.aspx
34Recognising these realities, efforts have focused on initiatives with most potential to gain
traction with business and deliver improved energy efficiency and emissions reduction
outcomes and the potential to drive renovation in the sector.
Stakeholder engagement is also informing the approaches being designed by the Retrofit
Taskforce.
5.6 Energy Saving Advice
The SEAI have developed a suite of free online training modules for general use and for
SMEs to help them identify and pursue energy efficiency opportunities including renovation.
Known as The SEAI Energy Academy18, short course modules are currently being made
available on various aspects of energy, efficiency, and renewables, including:
Energy and Climate Change
Business Energy Efficiency
Office Energy Efficiency
The Home Energy Challenge
Behavioural Change
Lighting Efficiency – Basic and Advanced Design
Further modules will be developed and added and all can be accessed at:
www.seaienergyacademy.ie.
As renovation is not a high priority for many businesses, linking renovation to priorities they
do have, such as renewable energy, or green credentials, can help drive energy renovation
activity.
5.7 New Delivery Model
Delivering on our national retrofit targets is a complex programme of work with a wide range
of interlinkages and interdependencies. A truly all of Government approach with effective
collaboration will be required to deliver the programme. A Retrofit Taskforce with cross
Departmental and agency membership has been established to oversee the design and
development of a new retrofit delivery model for the residential sector.
18
https://www.seaienergyacademy.ie/users/sign_in?next=%2Fdashboard
35The Taskforce is assessing a range of potential approaches across the 4 dimensions/pillars
that will form the core of the retrofit solution:
(i) Customer/homeowner propositions to improve awareness and drive demand
o A network of one-stop-shops that deliver simple customer journeys and
coordination with contractors and finance providers as well as minimising
hassle;
o Proactive and targeted marketing campaigns targeted at identified segments;
o Appropriate regulation.
(ii) Financial/funding models for each consumer segment/cohort to address high
payback periods and ability to pay upfront costs
o Exchequer funding including new and expanded grant schemes;
o Opportunities for private finance;
o Possible tax incentives.
(iii) Supplier scale-up and contracting
o Drive confidence in long-term attractiveness of retrofit market;
o Consistency and confidence in one-stop-shop offerings through clear
standards and establishment of contractual obligations;
o Changes to the existing apprenticeship and education programmes and other
initiatives to up-skill the existing workforce and bring in new entrants;
o Foster aggregation and standardisation;
o Stimulate innovation.
(iv) Programme governance and roadmap
o Appropriate entity with responsibility for driving achievement of our national
retrofit targets;
o Performance monitoring and evaluation mechanisms established.
5.8 Funding and Financing
There is a range of Government supports and grant schemes in place. These undergo a
continued process of review and redesign to ensure alignment with Government objectives
and value for money.
There is also a range of approaches to financing that are being considered including:
36 Identifying options for targeted financing for energy efficiency retrofits in the domestic
and commercial sector.
Exploring (through piloting) the use of salary incentive schemes to encourage,
facilitate and support people in retrofitting their homes.
Exploring the potential use of tax incentives to stimulate the demand for residential
energy efficiency improvements.
Providing easier to access tailored finance for residential energy efficiency
investment utilising if/as appropriate the European Commission’s Smart Finance for
Smart Buildings loan scheme.
Examining opportunities associated with green mortgages.
5.9 Promoting Retrofit Projects
The effective marketing of retrofit is considered important. The Economic and Social
Research Institute’s (ESRI) savings index, recorded that 54% of consumers surveyed would
use any surplus cash to pay down debt, including their mortgage. This may in part be due to
the advantages of retrofit not being properly understood. It underlines the importance of
effectively marketing the multiple benefits of retrofit solutions.
Building trust and confidence are also key. Retrofit projects entailing disruption and
significant costs are unlikely to be embarked upon unless the decision maker is confident
that the promised outcomes will be delivered on time and to the necessary quality.
Community and locally-based organisations are important in building trust and confidence
among consumers. The value of working with these locally-based organisations is
recognised and a core constituent of Ireland’s retrofit approach. SEAI is working closely in
delivering the Better Energy Communities Scheme and community engagement will be a key
element of future initiatives. The establishment of over 250 Sustainable Energy Communities
has been a significant success in encouraging local actors to work together. It is
underpinned by SEAI mentors and grants for a Local Energy Plan. They have been able to
undertake quite ambitious changes across multiple locations in cooperation with the energy
suppliers who are obligated under the Energy Efficiency Obligation Scheme.
There is a huge opportunity to build on this model and to work with the new Climate Officers
in Local Authorities to mobilise more such networks with a target to reach 1,500. The aim is
to develop a concerted effort to make local communities more conscious of poor carbon
technologies and how they can be rectified. A wider use of BER ratings by auctioneers,
37You can also read