Understanding in Cameroon - A supply- and demandside analysis of the ICT sector
←
→
Page content transcription
If your browser does not render page correctly, please read the page content below
Evidence for ICT Policy Action
 Policy Paper 2, 2012

Understanding
 what is happening in ICT
 in Cameroon
 A supply- and demand-
 side analysis of the
 ICT sector

 Olivier Nana Nzépa and
 Robertine Tankeu Keutchankeu
Research ICT Africa
Research ICT Africa (RIA) is an information and communication technology (ICT) policy and regulation research
network based in Cape Town, South Africa, under the directorship of Dr. Alison Gillwald. As a public interest think tank,
RIA fills a strategic gap in the development of a sustainable information society and knowledge economy. The network
builds the ICT policy and regulatory research capacity needed to inform effective ICT governance in Africa. RIA was
launched a decade ago and has extended its activities through national, regional and continental partnerships. The
network emanates from the growing demand for data and analysis necessary for appropriate but visionary policy
required to catapult the continent into the information age. Through development of its research network, RIA seeks
to build an African knowledge base in support of sound ICT policy and regulatory design, transparent implementation
processes, and monitoring and review of policy and regulatory developments on the continent. The research, arising
from a public interest agenda, is made available in the public domain, and individuals and entities from the public
sector, private sector and civil society are encouraged to use it for purposes of teaching and further research or to
enable them to participate more effectively in national, regional and global ICT policymaking and governance.

Series Editor: Alison Gillwald
Editorial assistance: Broc Rademan
Copy-editing: Chris Armstrong
Evidence for ICT Policy Action

Acknowledgements
Research ICT Africa (RIA) is an information and communication technology (ICT) policy and regulation research
network based in Cape Town, South Africa, under the directorship of Dr. Alison Gillwald. As a public interest think tank,
RIA fills a strategic gap in the development of a sustainable information society and knowledge economy. The network
builds the ICT policy and regulatory research capacity needed to inform effective ICT governance in Africa. RIA was
launched a decade ago and has extended its activities through national, regional and continental partnerships. The
network emanates from the growing demand for data and analysis necessary for appropriate but visionary policy
required to catapult the continent into the information age. Through development of its research network, RIA seeks
to build an African knowledge base in support of sound ICT policy and regulatory design, transparent implementation
processes, and monitoring and review of policy and regulatory developments on the continent. The research, arising
from a public interest agenda, is made available in the public domain, and individuals and entities from the public
sector, private sector and civil society are encouraged to use it for purposes of teaching and further research or to
enable them to participate more effectively in national, regional and global ICT policymaking and governance.

This research is made possible by significant funding received from the International Development Research Centre
(IDRC), Ottawa, Canada, and RIA network members express their gratitude to the IDRC for its support. The network
consists of members in 18 African countries, and RIA researchers in 12 countries were able to participate in the supply-
and demand-side reviews of their national ICT sectors (as detailed in this and other national Sector Performance
Reviews for 2012). The national reviews for 2012 were led by the following RIA network members: Dr. Patricia Makepe
(Botswana); Prof. Olivier Nana Nzèpa (Cameroon); Dr. Lishan Adam (Ethiopia); Dr. Godfred Frempong (Ghana); Prof.
Tim Waema (Kenya); Francisco Mabila (Mozambique); Dr. Christoph Stork (Namibia); Fola Odufuwa (Nigeria); Louise
Karamage (Rwanda); Dr. Alison Gillwald (South Africa); Mary Materu-Behitsa (Tanzania); and Ali Ndiwalana (Uganda).

RIA’s Household and Individual ICT Access and Use Surveys and Informal Sector ICT Access and Use Surveys conducted
in 12 countries – used to inform the national SPRs of 2012 – were led by Dr. Christoph Stork who, together with
Mariama Deen-Swarray, was responsible for preparation of the statistical data and data analysis for the 12 sets of
national findings – and the comparative analyses across the 12 countries. The Telecom Regulatory Environment (TRE)
assessments, the compilation of supply-side indicators, and the collection and presentation of the pricing data, were
coordinated across the 12 study countries by Enrico Calandro and Mpho Moyo. Additional peer-reviewing to that
done amongst partners was undertaken by Steve Esselaar and Enrico Calandro.

Design and layout: Grant Logan, Creative Storm | Cover image: Amy DeVoogd, Photodisc
Understanding what is happening in ICT in Cameroon

Authors
Olivier Nana Nzépa has training in Journalism, Business Administration, International Relations, Management and
Communication, and specialises in ICT policymaking, leadership in the knowledge society, governance, and public
management. He has served as a member of the UN Working Group on Internet Governance (WGIG), a member of the
African Bamako Bureau for the World Summit on the Information Society (WSIS), a member of the Working Group for
the Commonwealth Action Programme for the Digital Divide (CAPDD), and as an international ICT consultant for Atos
KPMG, the UNDP, UNESCO, UNECA, the Canadian International Development Agency (CIDA), and the Francophonie.
He is a member of, and former Regional Coordinator for RIA and has played a central role in RIA research on ICT
governance, ICT regulation, and ICT access and use. He has also supported RIA network data compilation, data analysis
and capacity-building. He is head of the ICT Department at ASMAC (Advanced School of Mass Communications,
Université de Yaoundé II), head of the research department at the Institut Superieur de Management Public de Yaoundé
(ISMP), a visiting professor with Middlesex University Business School, and an Open University Business School (OUBS)
International Fellow.

Robertine Tankeu Keutchankeu holds a Bachelor’s degree in Economics from the University of Yaoundé, a Master of
Science degree in Economics from the University of Montreal, and an International Master of Business Administration
(IMBA) degree from the University of Ottawa. She specialises in ICT, gender and informal economies, and is an Associate
Researcher for the RIA network. She has worked as a consultant for the Canadian International Development Agency
(CIDA) and is a Team Leader in Gender and Development for the Bureau d’Appui à la Coopération Canadienne (BACC)-
Yaoundé, a development consultant for the Japanese Embassy in Cameroon, a Cameroon researcher for the regional
NGO network ENDA, Regional Coordinator for the Advisory Network for the African Information Society (ANAIS),
Regional Correspondent for the World Dialogue on Regulation (WDR), and Deputy General Affairs Director for the
Electricity Development Corporation in Cameroon.
Evidence for ICT Policy Action

Executive summary
This is the third RIA Sector Performance Review (SPR) for the information and communication technology (ICT)
sector in Cameroon. The first SPR, published in 2008, generated debates and research relating to RIA’s contentions
regarding the country’s ICT performance. The second set of RIA Cameroon ICT data, captured in 2010 returned to the
trends underscored in the first country report. Development of this third SPR, for 2012, took place while Cameroon
was gearing, to some extent on the basis of the recommendations put forward by RIA, towards a new phase of ICT
sector development. The current Minister, appointed as the head of the Ministry of Posts and Telecommunications
(MINPOSTEL) three years ago, has made it a point of honour to bring more competition to the mobile sector and to
improve the telecommunications regulatory landscape.

An outsourced professional social research provider collected the RIA ICT Survey data outlined in this report. The
general finding after data collection and analysis it is that there has been no significant breaking of new ground in
recent years in terms of ICT sector performance in Cameroon. While some sector dimensions have seen some slight
improvement, generally the sector has not lived up to expectations in terms of job and wealth creation, and in some
respects (e.g. quality of service [QoS]) the sector has deteriorated.

The mobile sector has remained a duopoly held by MTN and Orange, which has affected the dynamism of the whole
sector to a great extent and has maintained very high costs for telecommunications services. Meanwhile, the fixed-
line service provided by the incumbent CAMTEL is perishing, and the national objective of providing universal and
affordable access to a full range of communications services is yet to become a reality.

The average monthly expenditure on telecommunications services in Cameroon stands at around CFAf2 7001 per
month per customer, with no significant difference in average expenditure between users in urban or rural areas. But
while the urban-rural divide in access to voice services is decreasing, the divide remains high for internet access.

The overly-freewheeling nature of the mobile sector at present is threatening some of the gains made in the sector’s
earlier development stages. Loopholes in regulation have enabled mobile operators to enter the gambling industry,
thus potentially contributing to poverty and family dysfunction in the country.

This 2012 RIA Cameroon SPR includes findings from the third RIA Telecom Regulatory Environment (TRE) assessment
of Cameroon. Cameroon’s TRE scores have for the most part declined with each successive TRE exercise, from the 2006
assessment to the 2009 assessment, and from the 2009 assessment to the 2012 assessment outlined in this report.

1 In 2012, the CFAf has traded in a range between CFAf487 and CFAf543 to USD1.
Table of contents
Introduction                                 1   Conclusions and recommendations    42
Main sector developments                     2   References                         44
The ICT market                               9   Annexure: MINPOSTEL’s ICT Sector
                                                 “Problem Trees” of 2005            46
ICT use                                     13
 Fixed telephony
 (fixed-line and fixed-wireless)            15
 Mobile telephony                           16
 Internet/broadband                         20
Emerging trends                             24
 Decline of fixed-line connections          24
 Extinction of public payphones             24
 Mobile internet access                     24
 Mobile financial services                  25
 Mandatory SIM registration                 26
 Mobile gambling                            26
 Informal sector ICT use                    26
Telecom Regulatory Environment
(TRE) assessment                            29
 Regulation of fixed sector                 31
 Regulation of mobile sector                31
 Regulation of the broadband VANS sector 32
 Regulation of interconnection              35
 Regulation of market entry                 36
 Regulation of access to scarce resources   37
 Regulation of USO                          38
 Regulation of QoS                          39
 Regulation of anti-competitive practices   40
 Regulation of tariffs                       41
Evidence for ICT Policy Action
Acronyms and abbreviations
ACE African Coast to Europe MCT Multipurpose Community Telecentre, or
Télécentre communautaire polyvalent (TCP)
AfDB African Development Bank
MVNO mobile virtual network operator
ADSL asymmetric digital subscriber line
NAICT National Agency for Information and
ARCEP Autorité de régulation des communications Communication Technologies, or Agence
électroniques et des postes (France) nationale des technologies de l’information
AU African Union et de la communication (ANTIC)
BACC Bureau d’Appui à la Coopération canadienne NIS National Institute of Statistics, or Institut
national de la statistique (INS)
BIRD Banque internationale pour la
reconstruction et le développement NCC National Communication Council, or Conseil
national de la communication (CNC)
CAB Central African Backbone
NGO non-governmental organisation
CAMTEL Cameroon Telecommunications
PRSD Poverty Reduction Strategy Document
CDMA code division multiple access
QoS quality of service
CESIR Credit Enhancement Servicing and
RIA Research ICT Africa
Investor Reporting
SAP structural adjustment programme
CFAf CFA franc, or Coopération financière en
Afrique centrale franc SAT-3/WASC South Atlantic 3/West Africa Submarine
Cable
COTCO Cameroon Oil Transportation Company
SME small and medium enterprise
DSL digital subscriber line
SMI small and medium initiative
GESP Growth and Employment Strategy Paper
SPR Sector Performance Review
GOVNET Government Intranet
TRB Telecommunications Regulatory Board,
GSM global system for mobile communications or Agence de régulation des
HIPC heavily indebted poor countries télécommunications (ART)
ICT information and communication technology TRE Telecom Regulatory Environment
IDA International Development Association USD US dollar
IDB Islamic Development Bank USO universal service obligations
IDD international direct dialing VANS value-added network services
WACS West Africa Cable System
IMF International Monetary Fund
WEF World Economic Forum
ISDN integrated services digital network
WiMAX worldwide interoperability for
ITU International Telecommunication Union
microwave access
MINPOSTEL Ministry of Posts and WSIS World Summit on the Information Society
Telecommunications, or Ministère
des Postes et Télécommunications WTO World Trade OrganisationUnderstanding what is happening in ICT in Cameroon
Introduction
The official ICT data available in Cameroon may be soothing to the country’s public decision-makers, but the data is not The data currently
accurate. According to official statistics, Cameroon scores highly for public payphone use and the incumbent CAMTEL is soothing public
holding its own in terms of the number of households with fixed lines. However, the reality is that the public payphone decision-makers
as a tool for communication is nearly extinct in Cameroon, and as for the statistical data on fixed lines, even the people
in charge of compiling these statistics discount their veracity. Accordingly, this 2012 Research ICT Africa (RIA) Cameroon
are inaccurate
Sector Performance Review (SPR) uses as its core materials the RIA data generated by the 2012 RIA Cameroon Household
and Individual ICT Access and Use Survey and the 2012 Informal Sector ICT Access and Use Survey.
This report has six sections:
Section 1 gives an overview of key developments in Cameroon’s ICT sector in recent years. Among the recent significant
events is the shift in responsibility from the Presidency to the Ministry of Posts and Telecommunications (MINPOSTEL)
for oversight of the National Agency for Information and Communication Technologies (NAICT, or Agence nationale des
technologies de l’information et de la communication [ANTIC]).
Section 2 describes Cameroon’s ICT market structure, its ICT players, the players’ market shares, and other financial
analysis. Included in this section is a discussion of new pricing strategies – strategies that have been creating increasing
confusion about what are the actual costs of services.
Section 3 looks at ICT use and discusses, inter alia, how mobile voice telephony is killing off the public payphone sector.
Section 4 delineates the emerging trends in Cameroon’s ICT sector, including the mobile operators’ highly lucrative
provision of gambling services.
Section 5 presents the results of the 2012 Telecom Regulatory Environment (TRE) assessment, and provides comparisons
with Cameroon’s TRE scores in 2006 and 2009, as well as comparisons between Cameroon’s scores and those in other
RIA TRE assessment countries.
Section 6 provides the paper’s conclusions and recommendations.
1Evidence for ICT Policy Action
Main sector developments
The first phase In order to frame the current status of Cameroon’s ICT sector, it is useful to recall the historical phases of the sector’s
of Cameroon’s development. The first phase was characterised by a firm state grip over the sector. Telecommunications were
ICT sector was considered a strategic governmental tool and, consequently, MINPOSTEL was one of the most prominent ministries.
Between 1960 and 1990, the sector’s development took place via a series of five-year plans, which endowed the
characterised by
country with one of the most enviable networks in Africa. In addition to a terrestrial satellite centre in Zamengoe, the
a firm state grip country was, in 1989, an early adopter of the GSM mobile platform.
on the sector
But with those early successes came ill-practice: top-down decision-making and corruption led the sector to the brink
of collapse in 1996. A former Minister of Posts and Telecommunications was one of the first top civil servants to serve a
jail term for corruption. At the end of 1996, the waiting list for telecommunication services topped 2million customers
and the waiting time for a new service was more than two years. The IMF/World Bank structural adjustment then came
into play. Under pressure from international partners and in terms of a structural adjustment programme (SAP), the
telecommunications sector partially opened up to competition: two mobile operators entered the market, though
fixed-line operations remained in the portfolio of the incumbent CAMTEL. A sector regulator, the Telecommunications
Regulatory Board (TRB, or Agence de régulation des télécommunications [ART]), was set up in 1998.
Two mobile In 2005, the NAICT (or ANTIC), which had been created by Presidential Decree in 2001, received appointment of its
operators now first Director General. By the end of 2007, two mobile operators, MTN and Orange, overwhelmingly dominated the ICT
dominate the sector, CAMTEL’s fixed-line operation was stumbling, the regulatory landscape was overly complex and inefficient, and
quality of service (QoS) was degrading.
ICT sector
The most recent phase is based on a governmental strategy framed by two documents: the Sector Strategy for
Telecommunications and Communication Technologies 2005-2015 (MINPOSTEL, 2005), and the Growth and
Employment Strategy Paper (GESP) (Republic of Cameroon, 2009). Broadly speaking, the Sector Strategy is three-
fold: (1) develop policies aligned with the new environment; (2) adopt and implement those policies; and (3) seek
contributions from international cooperation partners and the private sector.
The GESP plans to The GESP, for its part, assigns to the ICT sector several goals to be reached by 2020, including:
extend telephony
coverage to 45% tlandline telephony coverage to 45% of the population, and mobile coverage to 65% of the population;
of the population tprovision of modern means of communication to 40 000 villages; and
by 2020
tmultiplication by 50 of the number of direct and indirect employment positions in the ICT sector (Republic of
Cameroon, 2009, p. 63).
The Sector Strategy implementation in the ICT sector in Cameroon is to be based on three key areas:
trefining the legal, regulatory, and institutional framework;
tincreasing service quantity, quality, and affordability; and
tincreasing the use of ICT and fostering ICT enterprises (MINPOSTEL, 2005).
2Understanding what is happening in ICT in Cameroon
This 2012 SPR seeks to contribute to the achievement of the goals of the Sector Strategy. The RIA data collected
between September and December 2012 make clear the need for:
timproved management of frequency spectrum to ensure its rational use; There is a clear
need for improved
tpromotion of industrialisation within the ICT sector; management of
tdrawing on the innovative skills of SMEs and informal sectors; frequency spectrum
timplementation of programmes extending ICT services to rural and disadvantaged areas; and
tharnessing new trends, such as mobile money.
In 2011, MINPOSTEL and the TRB published a report entitled Telecommunications and ICTs in Cameroon: A
Seven Year Greater Achievement Review (MINPOSTEL and TRB, 2011). The Review seeks to highlight government
achievements in the telecommunications sector, and in the document Jean Pierre Biyiti Bi Essam, Minister of Posts and
Telecommunications, writes:
- The turnover of the sector increased from CFAF 272.318 billion in December 2005 to more than CFAF 433 billion in
late 2010;
- Added value for concession operators valued at CFAF 100 billion in 2005 rose to nearly CFAF 210 billion in late 2010;
- The accumulated volume of investments of concession operators is estimated at more than CFAF 524 billion between
January 2005 and December 2010, an average annual investment flow of over CFAF 83 billion;
-The cumulative contribution of the sector to VAT since the introduction of competition is estimated at more than
CFAF187 billion in 2009;
- The cumulative contribution of operators to tax revenue between January 2005 and December 2010 is estimated at
more than CFAF 417 billion. This contribution is increasing since the reform of the sector;
- About 1 000 direct jobs and over 300,000 indirect jobs were created in the sector between January 2005 and December
2010. Also, since 2009, the number employed in telecommunications and ICT represents more than 50% of the direct
total of the tertiary sector;
- The wage bill distributed by concession operators increased from CFAF 24.3 billion in December 2004 to nearly 30
billion CFA francs in December 2010;
- Since 2006, the average annual income per user (ARPU) for operators of fixed and mobile telephony is less than the
average per capita income (GDP per capita). This illustrates the fact that today, access to the telephone concerns even
people with low-income;
- The number of phone lines for all the services rose from 1,624,010 in December 2004 to nearly 9,223,718 active
subscribers at the end of 2010, giving a growth rate of over 568%;
- The number of Internet subscribers increased from 3,000 in 2005 to almost 50,000 in late 2009 and the number of
Internet users is more than 400 000;
- The national coverage by mobile operators is situated around 80% in 2010;
- Teledensity which was only 9.8% in late 2004 increased to approximately 47.5 lines per 100 inhabitants in December
3
2010 (MINPOSTEL and TRB, 2011, pp.12-13).Evidence for ICT Policy Action
In 2012, a market survey commissioned by the Ministry from Network Dynamics Associates put the number of
telecommunications subscribers at 8 003 844 in 2009 and estimated that 8million more customers could be added by
the year 2015 (Network Dynamics Associates, 2012).
ICT infrastructure But the 2012 Network Dynamics Associates study argued that at its current stage of development, the deployment
and services of ICT infrastructure and services in Cameroon primarily benefitted cities and the high-earning bracket of consumers.
primarily benefit More than 80% of subscribers were found to be concentrated in cities (Douala, Yaoundé, Bafoussam) and among
high-income earners, while people in the middle and lower classes were struggling to be part of the new ICT reality
cities and the high- (Network Dynamics Associates, 2012).
earning bracket of
Among the 10 RIA ICT Survey countries covered in the World Economic Forum’s (WEF’s) Networked Readiness Index
consumers
(NRI) and NRI sub-indices for 2010-11 (see Table 1 below), Cameroon was the lowest-ranked in the overall NRI (in 125th
place) (WEF, 2011).
Table 1: RIA Survey country Networked Readiness Index (NRI) and NRI sub-index rankings, 2010-11
Environment Readiness Usage (NRI sub-index)
NRI
Country (NRI sub- (NRI sub-
ranking Overall Government Business Individual
index) index)
Botswana 91 74 93 97 84 112 101
Cameroon 125 126 128 124 111 113 129
Cameroon ranked Ghana 99 82 80 108 116 102 112
125th in the WEF’s Kenya 81 99 55 88 65 67 104
NRI ranking Mozambique 106 113 87 107 92 96 125
Namibia 82 56 71 109 129 90 107
Nigeria 104 105 108 99 123 81 92
South Africa 61 38 79 83 76 52 95
Tanzania 118 104 124 125 117 120 127
Uganda 107 102 105 118 109 111 121
Source: WEF (2011)
The Economist Intelligence Unit (EIU) did not include Cameroon among the 70 countries accounted for in its 2009
e-readiness rankings (EIU, 2009). (This absence could be seen as a lost opportunity for Cameroon to get accurate
input on the country’s ICT strengths and weaknesses.) The EIU e-readiness ranking is a tool to measure a population’s
capacity to use ICTs through looking at how many people have the necessary skills and how ICTs are currently used.
The World Economic Forum (WEF) stresses the importance of “technological readiness” in these terms:
In today’s globalized world, technology has increasingly become an important element for firms to compete and
prosper. In particular, information and communication technologies (ICT) have evolved into the “general purpose
technology” of our time, given the critical spillovers to the other economic sectors and their role as efficient infrastructure
for commercial transactions. Therefore ICT access (including the presence of an ICT-friendly regulatory framework) and
4 usage are […] essential components of economies’ overall level of technological readiness (WEF, 2009, p. 6).Understanding what is happening in ICT in Cameroon
Some recent actions have been taken in an effort to improve Cameroon’s ICT sector. In 2010, the Set’Mobile MVNO was Viettel became
given operational authorisation (selling access to Orange’s network), and in late 2012 it became clear that a 3G licence the third licensed
granted to Viettel (a Vietnamese-owned mobile operator) would become operational in 2013. Viettel would then mobile operator
become the third mobile operator in the country, along with MTN and Orange. The country is also seeking to position
alongside MTN and
itself favourably in the deployment of fibre-optic technology. Twelve of 18 planned fibre-optic cables have been laid
along the Chad/Cameroon oil pipeline and handed over to the country by the American Cameroon Oil Transportation
Orange
Company (COTCO) consortium. These cables are serving as an embryonic trunk line for the Central African Backbone
(CAB) project, which will ultimately link Cameroon, Chad, and the Central African Republic. If completed according to
plan, the CAB initiative could result in Cameroon becoming a telecommunications hub for Central Africa.
The CAB project will
connect Cameroon,
Chad and the
Central African
Republic
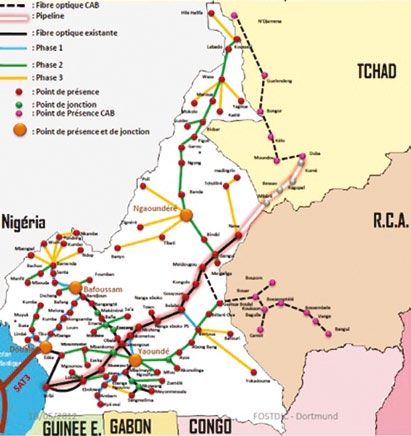
Figure1: Existing and projected fibre-optic networks in Cameroon
Source: Tonye (2012)
5
Note: “RCA” in the map stands for “République centrafricaine” (Central African Republic)Evidence for ICT Policy Action
In addition to connecting three countries, the CAB network will extend the global information highway through
to the landing points of submarine cables in Cameroon’s main port, Douala. The World Bank is participating in the
financing of the CAB project through contributions by its International Development Association (IDA) and its Banque
internationale pour la reconstruction et le développement (BIRD), with World Bank contributions amounting to
USD215million over a period of 10 years. The African Development Bank (AfDB) and the Islamic Development Bank
(IDB) are participating in the project and have opened a line of credit amounting to about USD200million. The CAB
programme also expects to raise USD97.8million from the private sector.
The CAB project The CAB programme also includes construction of a national broadband backbone, but this backbone will only
includes be useful if it connects to international submarine cable networks. Since the SAT-3/WASC submarine cable is
becoming saturated, the government is exploring alternatives to reduce SAT-3/WASC traffic and diversify access. The
construction
opportunities offered by the West Africa Cable System (WACS), African Coast to Europe (ACE), and MainOne projects
of a national are all being explored.
broadband
backbone The ACE cable project of which Cameroon is part, initiated by France Telecom, is looking to deploy a 14 000 km fibre-
optic submarine cable along the West coast of Africa to provide international connectivity to land-locked countries.
Twenty-seven landing points – corresponding to the number of member countries in the ACE consortium – have
been identified. The project envisages direct connectivity, avoiding transit between consortium member countries.
The MainOne Cameroon is also participating in the MainOne initiative, which aims to deploy a network of submarine cables with
Initiative aims to a capacity of 1.92 Terabits to provide open and low-cost access to international bandwidth. The first phase went
operational in June 2011, enabling the linking of Nigeria to Portugal, over a distance of 7 000 km, with a landing point
deploy a network of
in Ghana. In Portugal, the system is connected to other cable systems linked to Europe, the Americas, and Asia.
submarine cables
to Cameroon Under the umbrella of the African Union (AU) Cameroon has signed (in 2005) a project agreement with India to be
part of the Pan African e-Network, which aims to link all 53 African countries via both satellite and fibre-optic cable
and to provide services such as e-learning, telemedicine, and diplomatic communications. This network would
enable the inter-connection of the countries of the AU as well as connections between these countries and India,
which is funding the setup of the project. India is responsible for provision and installation of the equipment, rental
fees for bandwidth on satellite links and submarine cables, and the operation and maintenance costs over a period
of five years – before leaving network management to African states. To date, 33 African countries have signed onto
this project.
GOVNET intends Domestically, the government is engaged in a high-speed government Intranet project (GOVNET) in an effort to
to connect public interconnect public administration sites via a broadband network. The main network will be supported by a fibre-optic
loop, which will be connected to a platform that provides administrative services online. Decentralised administrative
administration sites
services will be connected to the main network nodes, either through a broadband radio relay link using WiMAX
via a broadband technology or through the national backbone network. This GOVNET network will serve as the foundation for
network e-government in Cameroon.
The government also envisages the interconnection of 20 000 villages through Multipurpose Community Telecentres
(MCTs, or Télécentres communautaires polyvalents [TCPs]). This telecentre project’s purpose is to involve rural
communities in the process of developing an affordable, viable, and replicable ICT access model. The total amount of
government investment needed for the project amounts to about CFAf14billion by the year 2015.
Some critics argue that there is too much emphasis and expenditure on the aforementioned network projects,
6 and that other critical ICT sub-sectors are potentially being neglected. Indeed, it would appear that Cameroon isUnderstanding what is happening in ICT in Cameroon
likely involved in more infrastructure deployment than is necessary for the country’s needs, and there is insufficient
balancing between competing ICT imperatives.
The government is seeking to simplify the regulatory framework and to refine provision of ICT services to cope with The institutional
convergence of technologies and greater user demand. Two presidential Decrees were signed in April 2012 with the roles of the TRB and
aim of ending tensions between the TRB and the NAICT over control of ICT regulation in Cameroon. In terms of the
Decrees, the two institutions’ roles have been clarified. the NAICT have
been clarified in
The first Decree states that the TRB (established in 1998) is now in charge of assuring healthy competition in the ICT two Presidential
sector. As such, its mission has been expanded and reinforced with the TRB now called upon to regulate the activities
of network operators and providers of electronic communications services. The Decree thus expands the activities of
Decrees
the TRB well beyond telecommunications to a wide range of ICT matters. The TRB is also expected to ensure operator
compliance with the principle of equal treatment of users of electronic communications.
The second Decree strips the National ICT Agency (NAICT) of the privilege of being directly attached to the Presidency. The NAICT is
The Agency is now under the tutelage of MINPOSTEL and the Ministry of Finance. The fall from grace is accompanied now the keeper
by the loss of responsibility over ICT activities. The NAICT is now the governmental watchdog for activities related to
of electronic
the security of electronic communication networks in accordance with cyber-security and cybercrime law.
communications
In spite of this attempt to clarify ICT regulatory arrangements, a number of areas of potential regulatory inefficiency security in
remain e.g. the fate of regulating the satellite trunk is not resolved, radio and television spectrum attribution still accordance with
belongs to the portfolio of MINPOSTEL, and the control of electronic and print media activities is still under the control
of the National Communication Council (NCC). cybercrime law
The complexity of the new ICT era requires increasingly complex and flexible regulation in order to cope with the
unpredictable nature of new technologies. However, Cameroon’s latitude in setting its own agenda has been greatly
affected by its admission to the heavily indebted poor countries (HIPCs) initiative in 1996. The initiative imposed upon
HIPC countries, inter alia, the setup of development targets and adoption of a Poverty Reduction Strategy, with World Admission to the
Bank and International Monetary Fund (IMF) guidance. This one-size-fits-all Strategy process resulted in a structural
HIPC initiative
adjustment programme (SAP) in the 1990s and a Poverty Reduction Strategy Document (PRSD) in 2003.
has constrained
In 2009, the PRSD became the aforementioned (in Section 1) GESP and, in its “Vision and Goals” section, it states: Cameroon’s self-
With the vision, Cameroon is asserting its desire to see the incidence of poverty drop below 1/10, meaning that; only help policymaking
one of every ten Cameroonians would still be poor by 2035. The reduction of income poverty would lead to improved
access to healthcare, education, training services, and basic infrastructure, including water supply, roads, and electricity
(Republic of Cameroon, 2009, p. 54).
The GESP document also states Government’s resolve to improve Cameroon’s socio-political environment, and to
restore the confidence of citizens and investors through:
timproving the electoral system;
timproving access to, and the quality of, the justice system;
tconsolidating national human rights promotion and protection; and
treinforcing maintenance of law, order, and security along the country’s borders. (Republic of Cameroon, 2009,
p. 94)
7Evidence for ICT Policy Action
In terms of the business environment, the GESP commits the government to greater dialogue with the private
sector in order to improve the business climate, pursuit of the legal model developed by the Organisation for the
Harmonisation of Business Law in Africa (OHADA), and adherence to an Investment Charter (Republic of Cameroon,
2009, p. 94).
The GESP states As mentioned in Section 1 above, the GESP’s strategic goals in the area of ICT to be achieved by 2020 include increased
the Government’s landline and mobile teledensity, improved ICT access and use for villages, and increased ICT sector employment
resolve to increase (Republic of Cameroon, 2009, p. 63).
teledensity, The document goes on to affirm that:
improve ICT access
and increase ICT In order to achieve the goals set by the Government in the Telecommunications/ICT field, a certain number of
programmes must be executed. They will involve organizing the electronic communications system to have a good
sector employment
visibility and legibility of the sector’s activities, to optimize the use [of ] telecommunications/ICT so as to have reliable
and sufficient infrastructure, to facilitate the development of ICT in order to popularize them and make it possible for
all citizens to use them, improve management of the spectrum of frequencies and ensure rational use of this scarce
resource, to promote industrialization within the Telecommunications/ICT sector in order to develop procedures for
the emergence of Telecom/ICT small SME/SMIs, to implement the programme of extending their services to rural or
disadvantaged areas, thus reducing the digital divide between rural and urban areas, to organize the provision of
services and the trend of various market components (Republic of Cameroon, 2009, p. 63).
For public authorities, the implementation of the GESP’s overall telecommunications/ICT strategy is underpinned by
three key dimensions:
[…] (I) adapting and updating the legal, statutory, and institutional […] framework, (II) improving the quantity and
quality of services provided and making them affordable, and finally (III) increasing the use of ICT and the industrial
fabric of ICT companies (Republic of Cameroon, 2009, p. 63)
There is some There is scepticism in some quarters regarding the potential of the GESP to provide tangible results, as evidenced by
scepticism around online discussions (see AfCoP, n.d.). The PRSD adopted in 2003 only brought the level of poverty in the country down
the potential of the to 39.9% in 2007 from 40.1% in 2001.
GESP to provide
tangible results
8Understanding what is happening in ICT in Cameroon
The ICT market
The ICT sector generated gross revenue of CFAf426billion in 2010, a growth of 7.7% over 2009 (ARCEP, 2010). This
makes ICT one of the most dynamic branches of the tertiary sector in Cameroon. The industry is driven primarily by
the strong mobile sub-sector.
According to the African Development Bank (AfDB), the agricultural sector is no longer the backbone of the country’s The tertiary
economy. Agriculture’s contribution to GDP has tumbled (standing at 21.3% in 2008) while the tertiary sector (the (services) sector has
services sector) has become the largest contributor to national income (46.2% in 2008) (AfDB, 2009).
become the largest
The number of fixed telephone subscribers increased at a rate of 14.9% between 2009 and 2010 by virtue of contributor to
subscriptions to the fixed-wireless CTPhone service provided by the fixed-line incumbent CAMTEL.1 CDMA subscribers national income
represented 88% of the total 539 504 subscribers claimed on 31 December 2010 by the fixed-line operator.
The average monthly consumption per subscriber for fixed and fixed wireless decreased by 12.1% between December
2009 and December 2010 from 25 minutes to 22 minutes per month (Nana Nzépa et al., 2011).
The total number of telephony subscribers (mobile and fixed) stood at 9 176 156 on 31 December 2010, up from 8 473
492 at the end of 2009 (a year-on-year increase of 8.3%) (ARCEP, 2010) (see Table 2).
Table 2: Telephony subscriber numbers, 2004 to 2010
2004 2005 2006 2007 2008 2009 2010
Fixed lines 99 439 100 331 150 706 169 222 255 306 469 648 539 504
The rate of increase
Mobile 1 526 462 1 993 194 3 135 946 4 535 991 6 164 784 8 003 844 8 636 652 in telephony
Total subscribers 1 625 901 2 093 525 3 286 652 4 705 213 6 420 090 8 473 492 9 176 156 subscribers has
Net increase 451 557 467 624 1 193 127 1 418 561 1 714 877 2 053 402 702 664 decreased
Rate of increase 38.5% 28.8% 57% 43.2% 36.4% 32% 8.3%
Source: ARCEP (2010)
In terms of the telephony subscriber breakdown (for both fixed and mobile) between prepaid and postpaid, the
percentage split has remained at 99% in favour of prepaid since 2007 (see Table 3 below).
Table 3: Prepaid versus postpaid telephony subscribers (mobile and fixed)
2004 2005 2006 2007 2008 2009 2010
Prepaid Prepaid
1 490 114 1 933 380 3 060 466 4 475 234 6 096 831 7 931 631 8 543 636
subscribers subscription is far
Postpaid more popular than
36 348 59 914 75 480 60 757 67 953 72 213 93 015
subscribers postpaid
Total 1 526 462 1 993 194 3 135 946 4 535 991 6 164 764 8 003 844 8 636 652
Source: ARCEP (2010)
9
1 The CTPhone service is based on code division multiple access [CDMA] technology.Evidence for ICT Policy Action
In 2012, the telecommunications market in Cameroon had three major players: the incumbent CAMTEL with a
legislated monopoly over fixed services, and the two mobile operators, Orange and MTN. The contribution to market
development of the second-tier telecommunications operators – those providing satellite telephony (Thuraya) and
satellite internet – is still marginal.
The contribution MTN dominates telephony with a market share of 52.2% of all subscriptions in the country (taking into account both
of the second-tier mobile and fixed), followed by Orange (41.90%) and CAMTEL (5.30%). As for employment, CAMTEL is still creating
some new jobs (an increase from 2 454 employees in 2009 to 2 512 in 2010), as is MTN to a small extent (from 661
telecommunica-
employees in 2009 to 668 in 2010), while Orange’s workforce has recently decreased (from 634 employees in 2009 to
tions operators is 629 in 2010). The overall job increase for the telephony sub-sector was 1.9% in 2010 (ARCEP, 2010).
still marginal.
Table 4: Telephony jobs, 2004 to 2010
2004 2005 2006 2007 2008 2009 2010
CAMTEL 2 235 2 250 No data 2 083 2 190 2 454 2 512
MTN 399 446 485 694 625 661 668
Orange 496 514 577 586 623 629 634
Total 3 130 3 213 N/A 3 363 3 438 3 744 3 814
Rate of increase N/A 2.7% N/A N/A 2.2% 8.9% 1.9%
Source: ARCEP (2010)
Investments made by Cameroon’s mobile operators totalled CFAf77.3billion in 2010 – a 10.8% decrease from the
amount spent in 2009 (ARCEP, 2010).
Table 5: Telecommunications sector investments, 2004 to 2010
2004 2005 2006 2007 2008 2009 2010
Fixed (CFAf billions) 15.4 18.8 No data 63.1 15.8 36.4 37.6
Mobile (CFAf billions) 47 58.2 65.5 60.0 81.6 86.6 77.3
The mobile Total (CFAf billions) 62.4 77.0 No data 123.1 97.4 123.0 114.9
sub-sector still
Rate of increase/decrease N/A 23.9% N/A N/A -20.9% 26.3% -6.6%
represents 85%
of the telecom- Source: ARCEP (2010)
munications Though its turnover growth has slowed in recent years, the mobile sub-sector still represents 85% of the
sector’s investment telecommunications sector turnover as a whole (ARCEP, 2010).
Internet/broadband is provided in Cameroon through fixed lines by the incumbent CAMTEL, and wirelessly by
Orange’s, MTN’s, and a core of small telecommunications players’ mobile networks (Ringo, Douala One, Creolink, Matrix
Telecoms, Yoomee, CamNet, Pastel, and Foris Cameroon). The efforts made by the government to build more fibre-
10
optic networks (and thus reduce wholesale bandwidth costs) have yet to translate into lower retail costs or higher QoS.Understanding what is happening in ICT in Cameroon
Cameroon’s telephony operators and the TRB have for several years been doing battle over pricing matters. Four years The pricing process
ago, the TRB threatened to set a capped price for mobile services if operators failed to make reductions. Officially, has been altered by
operators did not respond, continuing to officially charge CFAf120 per minute. But in reality, the pricing process has
an operator price
been altered profoundly by an operator price war based on the introduction of bonuses and other incentives. In 2010,
after announcement of the bid for a third mobile operator, Orange triggered the war by offering a “timer” option at war based on the
a cost of CFAf2 (on-network) and CFAf3 (off-network) per second, i.e. between CFAf120 and CFAf150 per minute but introduction of
with per-second billing. Another Orange incentive programme provides free airtime in response to volume of use, bonuses and other
e.g. a customer receives one minute free for every three minutes paid. Roaming free of charge is also offered on some incentives
weekends to Orange customers who have chosen the “top joker” option (Orange Cameroon, n.d.). CAMTEL struck back
by offering a rate of CFAf35 per minute during weekends (CAMTEL, n.d.).
The virtual operator Set’Mobile entered the battle with an offer of CFAf1.5 per second and CFAf40 per minute. MTN
responded in December 2012 with two promotional plans with different names but the same offering: MTN Best and
MTN Elite. The offer consists of a two-minute cost of CFAf90 per minute, dropping to CFAf50 per minute for the third
minute onwards (MTN Cameroon, n.d.). The moves by Orange, CAMTEL, and MTN are intended, inter alia, to undermine
the business case of the third mobile operator expected to become operational in mid-2013.
ARCEP data show an increase of nearly 11% in mobile voice traffic in 2010 – much lower growth than in previous years There has been an
but still strong (see Table 6 below). increase in mobile
Table 6: Mobile voice traffic, 2004 to 2010 (millions of minutes) voice traffic of
nearly 11%
2004 2005 2006 2007 2008 2009 2010
On-net calls (within a
370.2 452 694.2 1 134 1 803 2 240 2 463
network)
Off-net calls (from one
7.8 8.5 14.5 497 571 1 216 701
network to another)
International calls 238.7 301.8 389.9 51 62 76 92
International roaming No data No data No data 2.4 1.2 1.4 10
Total mobile traffic 649.1 792.2 1 139.5 1 684.4 2 439.2 2 946.3 3 266.1
Rate of increase 13.9% 22.1% 43.8% 47.8% 44.2% 21.3% 10.9%
Source: ARCEP (2010)
Assessment of voice traffic by type shows that on-net calls are the most important share of communication on On-net calls
mobile networks. In 2010, on-net calls made up to 75.4% of outgoing mobile network calls, while off-net calls (to the are the most
competitor’s network) represented 20.6% of outgoing traffic. Calls to landlines represented 0.9% of total outbound
important share of
traffic. The remaining 3.1% of mobile calls were distributed between outgoing international calls and roaming calls
made by subscribers while outside of the country. communications
on mobile networks
As mentioned earlier, telephony operator turnover rose to CFAf426billion in 2010, an increase of 7.7% on 2009, despite
the economic downturn (ARCEP, 2010). As Table 7 below shows, this turnover growth was largely supported by growth
11
of the mobile sub-sector.Evidence for ICT Policy Action
Table 7: Telephony companies’ total turnover, 2004 to 2010
2004 2005 2006 2007 2008 2009 2010
Telephony operator
turnover rose Fixed (CFAf billions) 58.4 50.8 No data 54.6 56.2 60.6 70.4
by 7.7% despite Mobile (CFAf billions) 195.5 221.8 247.8 295.2 312.4 335 355.6
the economic
Total (CFAf billions) 253.9 272.7 No data 349.8 368.6 395.6 426
downturn
Rate of increase N/A 7.4% N/A N/A 5.4% 7.3% 7.7%
Source: ARCEP (2010)
Mobile operator turnover grew 6.1% in 2010 (see Table 8 below), slightly lower than the 7.3% growth in 2009. Table 8
also shows that mobile sector turnover growth has been in single digits since 2008 after double-digit growth between
2004 and 2007.
Table 8: Mobile operator turnover, 2004 to 2010
Growth in mobile 2004 2005 2006 2007 2008 2009 2010
operator turnover Turnover (CFAf millions) 195 496.2 221 804.5 247 787 295 170 312 379.1 335 046 355 637
has slowed
Rate of increase 22.8% 13.5% 11.7% 19.1% 5.8% 7.3% 6.1%
Source: ARCEP (2010)
12Understanding what is happening in ICT in Cameroon
ICT use
Cameroonian households did not experience significant changes in their use of grid electricity, fixed lines, computers,
or internet services between 2008 and 2012, as shown below in Table 9.
Table 9: Household electricity and ICT use in RIA Survey countries, 2012 and 2008
Electricity from grid Fixed-line Computer Internet
2012 60.1% 15.0% 15.7% 8.6%
Botswana 2008 47.5% 11.0% 4.5% 0.1%
Change 12.6% 4.0% 11.2% 8.5%
2012 64.5% 2.2% 8.6% 1.3%
Cameroon 2008 57.1% 1.8% 4.1% 1.2%
Change 7.4% 0.4% 4.5% 0.1%
2012 73.0% 1.8% 8.5% 2.7%
Ghana 2008 62.6% 2.6% 5.1% 0.3%
Change 10.4% -0.8% 3.4% 2.4%
2012 60.1% 0.6% 12.7% 12.7%
Kenya 2008 46.6% 2.3% 5.5% 2.2%
Change 13.5% -1.7% 7.2% 10.5%
2012 41.8% 11.5% 14.7% 11.5%
Namibia 2008 44.6% 17.4% 11.2% 3.3%
Change -2.8% -5.9% 3.5% 8.2%
2012 15.6% 0.2% 2.0% 0.7%
Rwanda 2008 4.7% 0.1% 0.3% 0.0%
Change 10.9% 0.1% 1.7% 0.7%
2012 89.2% 18.0% 24.5% 19.7%
South Africa 2008 77.2% 18.2% 14.8% 4.8%
Change 12.0% -0.2% 9.7% 14.9%
13Evidence for ICT Policy Action
Electricity from grid Fixed-line Computer Internet
2012 19.4% 0.4% 1.6% 0.8%
Tanzania 2008 13.4% 0.9% 1.0% 0.0%
Change 6.0% -0.5% 0.6% 0.8%
2012 13.4% 1.5% 2.2% 0.9%
Uganda 2008 9.5% 0.3% 1.2% 0.0%
Change 3.9% 1.2% 1.0% 0.9%
Nigeria 2012 58.4% 0.3% 6.6% 3.4%
Ethiopia 2012 18.1% 4.0% 0.7% 0.5%
Source: RIA ICT Survey data 2011-12 and 2007-08
The average The average monthly invoice – the average amount a subscriber is charged by an operator – was CFAf2 701 per
monthly month per mobile subscriber in 2010. The average revenue per minute across fixed and mobile telecommunications
networks was CFAf85.7 per minute in the same year and the average monthly use per subscriber was 31.5 minutes per
consumption per
subscriber per month, an increase of 2.7% compared to 30.7 minutes per subscriber per month in 2009. The average
subscriber for monthly consumption per subscriber for mobile is diminishing over time and sat at around 30 minutes in 2010. The
mobile services average monthly use per subscriber for fixed services was 22 minutes in 2010, a decrease of 12.1% compared to 2009
diminished when people were spending close to 24 minutes per month on the phone (ARCEP, 2010).
14Understanding what is happening in ICT in Cameroon
The number of subscribers to fixed services was 539 504 in 2010, a 17.7% increase compared to 2009. In absolute The subscriber base
terms, however, the increase reflects a setback for fixed-line connections. As seen below in Table 10, the vast majority of fixed telephony
of subscriptions to fixed services are for fixed wireless – CDMA wireless technology. CDMA technology has enabled continues to swell
the incumbent CAMTEL to increase its annual turnover since 2007. Turnover increased from CFAf60.6billion in 2009 to
CFAf70.4billion in 2010.
Table 10: Subscriber numbers for fixed telephony services, 2004 to 2011
2004 2005 2006 2007 2008 2009 2010
Total fixed subscribers 99 439 100 331 150 706 169 222 255 306 469 648 539 504
Net increase 2 046 892 50 375 18 516 86 084 214 342 69 856
Rate of increase 2.1% 0.9& 50.2% 12.3& 50.9% 84% 14.9%
Teledensity 0.59% 0.57% 0.84% 0.92% 1.35% 2.43% 2.72%
Fixed-line subscribers 99 439 100 331 12 318 73 348 71 898 66 332 65 808
Net increase 2 046 892 11 987 -38 970 -1 450 -5 566 -524
Rate of increase/
2.1% 0.9% 11.9% -34.7% -2% -7.7% -0.8%
decrease
Fixed-wireless CDMA
N/A N/A 38 388 95 874 183 408 403 316 473 696
subscribers
Net increase N/A N/A N/A 57 486 87 534 219 908 70 380
Rate of increase N/A N/A N/A 149.7% 91.3% 119.9% 17.7%
Source: ARCEP (2010)
Investment in the fixed sector was CFAf36.4billion in 2009 and CFAf37.6billion in 2010. Nonetheless, the fate of the
classic fixed line is an issue of concern. Its contribution to telecommunications services continues to diminish with
many potential consequences including high costs and loss of technological opportunities (such as the use of ADSL
and ISDN to provide multi-play services).
15Evidence for ICT Policy Action
Mobile telephony
As seen above, mobile services are the dominant ones in the telecommunications sector. The mobile market is still a
duopoly, consisting of MTN and Orange. Viettel, a 3G mobile provider, is to become operational in mid-2013. Viettel is
a Vietnamese operator already present in Vietnam, Laos, Cambodia, Haiti, Peru, and Mozambique.
The new player in 2012, Set’Mobile, is a virtual MVNO owned by Cameroonian football star Samuel Eto’o. The entrance
of Set initially generated confusion over the real nature of its services. Set was presented as a full mobile operator,
compelling the regulator TRB to clarify the virtual status of the newcomer (an MVNO selling products operating on
the Orange network).
Half the surveyed According to the findings of the 2012 RIA Cameroon ICT Survey, 50.6% of people aged 15 years and older2 were
population were owners of a mobile phone or an active SIM card in 2012, a significant increase over the 36.5% figure in the 2008 RIA
Cameroon Survey.
owners of a mobile
phone or an active Among 11 RIA countries surveyed in the 2012 RIA ICT Surveys, Cameroon ranks eighth in terms of the percentage
SIM card of phone or active SIM ownership (see Figure 2 below) – a low ranking given that Cameroon was one of Africa’s
pioneering countries in terms of deployment of mobile GSM technology.
South Africa 87% 62.1%
Kenya 86.7% 52%
Botswana 83.5% 59.9%
Ghana 70.5% 59.8%
Nigeria 69.4%
Namibia 66.5% 49.3%
Uganda 53.6% 20.7%
Cameroon 50.6% 36.5%
Tanzania 41.7% 21.5%
Rwanda 38.5% 9.9%
Ethiopia 19% 3.2%
2011/2012 2007/2008
Figure 2: Ownership (%) of a mobile phone or active SIM in RIA Survey countries, 2012 and 2008
Today price Source: RIA ICT Survey data 2011-12 and 2007-08
asymmetries
The 2012 RIA Cameroon Survey found that among mobile users in Cameroon, only 22.6% have more than one active
between MTN and
SIM (see Figure 3 below). This would appear to be a shift from years past (the percentage was 51% in the 2008 RIA
Orange are no survey) when multiple-SIM ownership was quite common due to price asymmetries between the two mobile firms.
longer significant Today, price differences between MTN and Orange are no longer significant.
2 For the 2012 RIA ICT Surveys, the sample was drawn from people aged 15 years or older. The 2008 RIA Survey samples were aged
16 16 years and older.Understanding what is happening in ICT in Cameroon
62.4%
Tanzania
37.6%
63.1%
Rwanda
36.9%
69.9%
Uganda
30.1%
72.1%
Nigeria
27.9%
72.1%
Ghana
27.9%
75.1%
Kenya
24.9%
76.9%
Botswana
23.1%
77.4%
Cameroon
22.6%
85.7%
South Africa
14.2%
92.8%
Namibia
7.2%
97.2%
Ethiopia
2.8%
1 Active SIM More than 1
Figure 3: Single-SIM versus multi-SIM ownership in RIA Survey countries, 2012
Source: RIA ICT Survey data 2011-12
Cameroon ranks fourth highest among RIA survey countries in terms of its percentage (77.4%) of single-SIM subscribers,
behind only Ethiopia, Namibia, and South Africa. In addition to the fact that the cost of services is almost the same
between the two mobile operators, the mandatory SIM card registration exercise imposed by MINPOSTEL since 2008 It is clear that the
might also be a factor discouraging multiple-SIM use. prepaid payment
tool has been
As for payment methods, the 2012 RIA Survey confirms what has been revealed by other sources: more than 99% of
the mobile users in Cameroon are prepaid. As shown in Figure 4 below, all 2012 RIA ICT Survey countries except South central to the
Africa have 90% or greater prepaid use, with eight of the RIA countries, including Cameroon, having more than 97% growth and success
prepaid use. Looking at the payment pattern of African users, it is clear that the prepaid payment tool has been central of the mobile sector
to the growth and success of mobile in Africa.
17Evidence for ICT Policy Action
0.2%
Kenya
99.8%
0.5%
Tanzania
99.5%
1.0%
Nigeria
99.0%
1.0%
Cameroon
99.0%
1.6%
Ethiopia
98.4%
2.0%
Uganda
98.0%
2.6%
Botswana
97.4%
2.6%
Ghana
97.4%
8.2%
Namibia
91.8%
9.9%
Rwanda
90.1%
12.5%
South Africa
87.5%
Postpaid Prepaid
Demand for more Figure 4: Prepaid versus postpaid mobile subscribers in RIA Survey countries, 2012
affordable airtime Source: RIA ICT Survey data 2011-12
has increased
The responses to the 2012 RIA Survey questions related to price sensitivity showed that in the hypothetical case of a
significantly as
price decrease of 50%, 47.9% of respondents would double their use of telephony services (and another 2.7% would
telecommunica- more than double their use). In contrast, it was found in the 2008 Survey that only 27.1% would double phone use if
tions costs restrain costs came down by 50%. These findings suggest that pent-up demand has increased significantly since 2008, that
market growth. telecommunications costs are restraining market growth, and that the mobile duopoly has not served user needs.
18Understanding what is happening in ICT in Cameroon
Table 11: Predicted shift in telephony use if costs decreased 50% in RIA Survey countries, 2012 and 2008
More than
Unchanged Double my
Country Survey Slight increase double my
phone use phone use
phone use
Kenya 2012 17.9% 44.5% 31.1% 6.5%
2008 13.4% 45.8% 27.3% 13.5%
Tanzania 2012 31.3% 52.8% 13.0% 2.9%
2008 27.9% 35.5% 23.7% 12.9%
Rwanda 2012 24.5% 53.1% 21.0% 1.4%
2008 22.9% 40.8% 11.1% 25.1%
Ethiopia 2012 10.7% 70.2% 16.7% 2.3%
2008 30.1% 45.2% 21.3% 3.4%
Ghana 2012 22.8% 45.8% 24.9% 6.5%
2008 18.7% 49.2% 21.3% 10.9%
Cameroon 2012 16.9% 32.6% 47.9% 2.7%
2008 14.3% 52.2% 27.1% 6.4%
Nigeria 2012 15.9% 27.7% 48.4% 8.0%
2007/2008
Namibia 2012 13.4% 48.0% 29.9% 8.7%
2008 20.6% 20.7% 26.7% 32.0%
South Africa 2012 27.5% 33.5% 33.5% 5.5%
2008 27.6% 38.4% 18.5% 15.5%
Botswana 2012 25.1% 30.8% 36.5% 7.6%
2008 31.8% 42.4% 21.7% 4.0%
Source: RIA ICT Survey data 2011-12 and 2007-08
19You can also read