Lost Opportunities in the Buildings Sector: Energy-Efficiency Analysis and Results - PNNL-17623
←
→
Page content transcription
If your browser does not render page correctly, please read the page content below
PNNL-17623

Prepared for the U.S. Department of Energy
under Contract DE-AC05-76RL01830

Lost Opportunities in the Buildings
Sector: Energy-Efficiency Analysis
and Results

JA Dirks                   DB Belzer
DM Anderson                KA Cort
DJ Hostick

September 2008
PNNL-17623

Lost Opportunities in the Buildings
Sector:
Energy-Efficiency Analysis and
Results

JA Dirks             DB Belzer
DM Anderson          KA Cort
DJ Hostick

September 2008

Prepared for
the U.S. Department of Energy
under Contract DE-AC05-76RL01830

Pacific Northwest National Laboratory
Richland, Washington 99352
Executive Summary

    While US federal investment in research and development of improved technologies in the buildings
sector has been shown to result in significant energy efficiency gains for the nation, a substantial amount
of additional energy- and carbon-saving benefits will not be realized at current investment levels. This
report documents the analysis of achievable energy- and carbon-saving opportunities that would not be
realized (or would be “lost”) without requisite investment in technology research addressing the buildings
sector – here defined as the sum of the commercial and residential sectors as characterized by the Energy
Information Administration.

    The approach compares commercial and residential primary energy consumption under the AEO
2008 Reference Case to consumption under the Department of Energy’s Building Technologies Program
“business as usual” case, and to a case designed to represent a much more aggressive pursuit of energy-
and carbon-saving technology advances, termed the “lost opportunities” case. Business as usual is
represented by the planned fiscal year (FY) 2009 research portfolio of the Building Technologies Program
being maintained over the 2009-2025 period. The lost opportunities case is represented by applying
aggressive, but plausible, market penetration scenarios to the overnight technical potential of the
technologies analyzed.

    Of necessity in terms of resources and tractability, the approach is deterministic in nature.
Uncertainty with respect to the modeling inputs or outputs has not been considered. As such, the report
represents one possible outcome, determined based on conventional wisdom of expert buildings sector
analysts. Therefore the estimates are not provided with confidence intervals – an acknowledged
weakness among all such studies we have encountered. However, we offer the results and suggest that
they are robust, but caution that a truly probabilistic analysis might suggest lower or higher estimated
results.

    The analysis shows that if supported at requisite levels, technologies developed through the
Department of Energy (DOE)’s Building Technologies Program could result in annual energy savings of
about 8.5 QBtu by 2025 – equivalent to the annual primary energy consumption of the state of California.
The pathway to this level of savings also would result in the cumulative avoidance of an estimated 4.4 Gt
of carbon dioxide emissions over the 2009-2025 period. In percentage terms, for relative comparison,
8.5 QBtu equates to about 17.8% of the buildings sector projected energy consumption in 2025, and
4.4 Gt of carbon dioxide equates to about 10.4% of projected cumulative CO2 emissions in the buildings
sector. These energy savings, if realized, would cause total primary energy consumption in the buildings
sector to level off over the 2009-2025 study period to just below 2009 consumption levels, as opposed to
the Reference Case projection suggesting continued steady growth in consumption.

    The methodological approach developed for this analysis is fully integrated across end use services
(e.g., lighting). Full accounting has been made for technologies that compete for the same end use load
reduction. As such, the energy and carbon savings estimates do not include double counting of any
savings from separate technologies. The approach does not rely on selecting one optimal pathway for
technological research; it is instead based upon selecting reasonable end states for each performance
parameter in each timeframe that could reasonably be expected to be achieved with significant additional
investment above the "business-as-usual" case. As such, energy savings achieved do not represent the
maximum possible primary energy savings under a greatly expanded buildings sector program and the

                                                    iii
end points do not necessarily represent the optimal research agenda. It is, however, the opinion of the
authors that the end states and the potential savings are achievable and realistic with a substantial
expansion of the buildings sector technology research agenda. Other pathways are possible and could
result in similar energy savings estimates in the view of other experts. We compare our approach and
results to other similar published studies, discussing significant methodological differences.
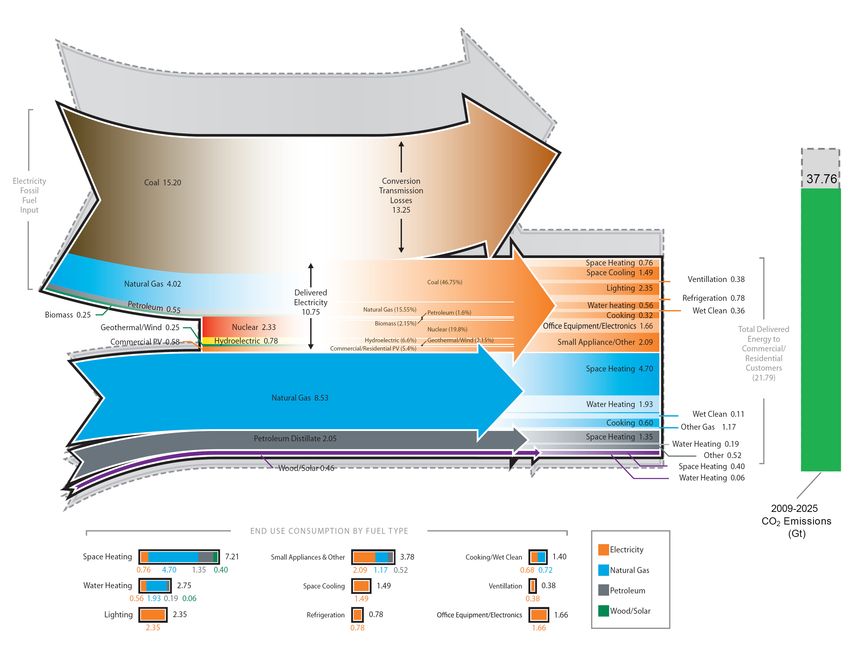
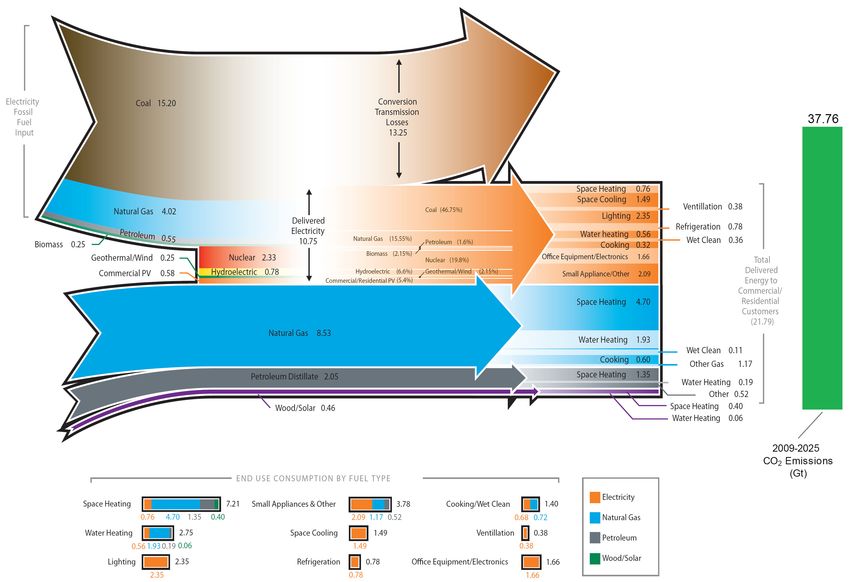
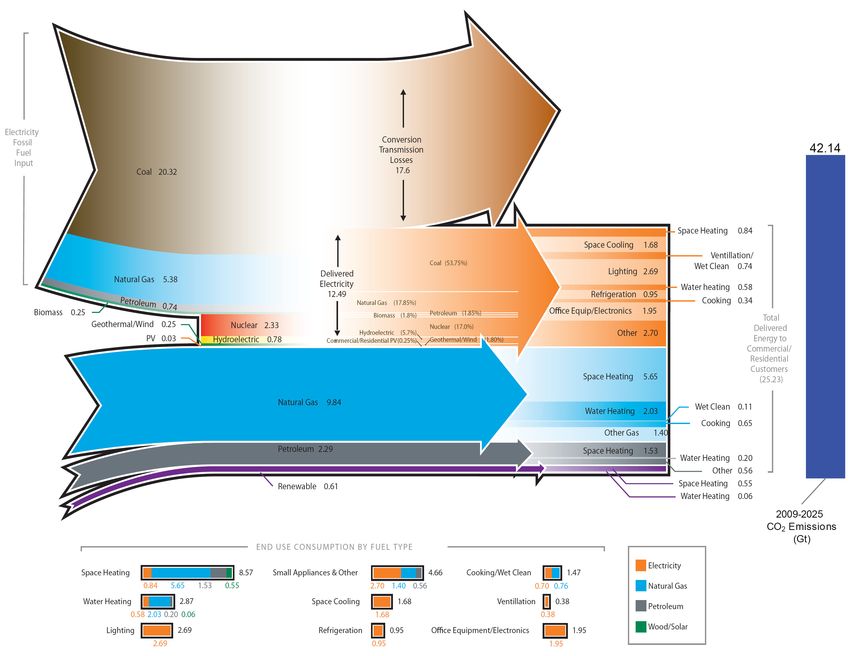
Energy flow maps developed for this analysis depict the flow of energy from source to end use in the
buildings sector and reflect the sector’s carbon footprint. For comparison, the energy flow of the lost
opportunities case is superimposed over the AEO 2008 reference case to illustrate the potential reduction
in the energy and carbon footprint of the buildings sector.
ivAcknowledgments
The authors wish to acknowledge the helpful contributions of three people. Dr. Robert Margolis of
the National Renewable Energy Laboratory was the original author of the energy analysis of DOE’s
Solar-Zero Energy Buildings Vision. His calculations estimate the potential impacts of a combined zero-
net energy buildings vision involving both aggressive end-use efficiency and rooftop photovoltaic (PV)
systems, and were adopted into this analysis. Edward Barbour of Navigant Consulting provided helpful
review of the technological assumptions used to represent a very aggressive research approach for the
Building Technologies Program. Nathan Johnson, a graphic artist at PNNL, developed the complex
energy flow map graphics shown in this report. Dr. Leon Glicksman, PhD, of Massachusetts Institute of
Technology and Dr. David Sailor, PhD, of Portland State University provided helpful review comments
on an earlier draft of this report.
vAcronyms and Abbreviations
ACH Air Changes per Hour
AEO Annual Energy Outlook
AER Annual Energy Review
ASHRAE American Society of Heating Refrigeration and Air Conditioning Engineers
BAU Business as Usual
BEAMS Building Energy Analysis Modeling System
BT Building Technologies
BTP Building Technologies Program
BTU British Thermal Unit
CBECS Commercial Building Energy Consumption Survey
CFL compact fluorescent lamp
CHPS Collaborative for High Performance Schools
DOE Department of Energy
EERE Office of Energy Efficiency and Renewable Energy
EIA Energy Information Administration
EISA Extended Industry Standard Architecture
EPA Environmental Protection Agency
FEDS Facility Energy Decision System
FEMP Federal Energy Management Program
FY Fiscal Year
GPRA Government Performance and Results Act
GW Gigawatts
HP Horsepower
HVAC heating, ventilation and air conditioning
IGU Insulating Glass Unit
KW Kilowatt
LED Light Emitting Diode
LEED Leadership in Energy and Environmental Design
LO Lost Opportunities
MF Multifamily
MH Mobile Home/Manufactured Housing
MMTCE Million Metric Tons of Carbon Emitted
MYPP Multi Year Program Plan
NEMS National Energy Modeling System
NREL National Renewable Energy Laboratory
OMB Office of Management and Budget
viiPC Personal Computer
PNNL Pacific Northwest National Laboratory
PV photovoltaic
R&D Research and Development
RECS Residential Energy Consumption Survey
SAI Solar America Initiative
SEIA Solar Energy Industries Association
SF Single Family
SHGC Solar Heat Gain Coefficient
SSL Solid State Lighting
STEO Short Term Energy Outlook
TVMI Technology Validation and Market Introduction
VFD Variable Frequency Drive
VSD Variable Speed Drive
VT Visual Transmittance
viiiContents
Executive Summary .............................................................................................................................. iii
Acknowledgments................................................................................................................................. v
Acronyms and Abbreviations ............................................................................................................... vii
1.0 Introduction .................................................................................................................................. 1.1
2.0 Results Summary .......................................................................................................................... 2.1
2.1 Comparisons with Other Studies .......................................................................................... 2.3
3.0 Commercial Sector Approach ...................................................................................................... 3.1
3.1 Commercial Penetration Rate Development ........................................................................ 3.3
3.1.1 Existing Commercial Market .................................................................................... 3.4
3.1.2 New Commercial Market .......................................................................................... 3.6
3.1.3 Market Penetration Summary.................................................................................... 3.7
4.0 Residential Sector Approach ........................................................................................................ 4.1
4.1 Residential Penetration Rate Development .......................................................................... 4.2
4.1.1 New Residential Market ............................................................................................ 4.3
4.1.2 Existing Residential Market ...................................................................................... 4.3
5.0 Analysis Methodology .................................................................................................................. 5.1
5.1 Challenges ............................................................................................................................ 5.2
5.2 Current BTP Activities ......................................................................................................... 5.3
5.3 Lost Opportunities Technology Performance Assumptions................................................. 5.4
5.3.1 Plug Loads ................................................................................................................. 5.8
5.3.2 Solar Photovoltaic ..................................................................................................... 5.8
6.0 Discussion..................................................................................................................................... 6.1
7.0 Avoided CO2 Emissions ............................................................................................................... 7.1
8.0 Energy Flow Maps........................................................................................................................ 8.1
Appendix A – Projected Miscellaneous Electricity Consumption in the Commercial Sector .............. A.1
Appendix B – FY 2009 BTP Activity Level Benefits Analysis Results ............................................... B.1
Appendix C – Benefits of Solar-Zero Energy Buildings Vision........................................................... C.1
Appendix D – Benefits of the Vision .................................................................................................... D.1
ixFigures
2.1 Total Estimated Buildings-Sector Energy Consumption under Alternative Cases ....................... 2.1
2.2 New and Existing Commercial Floorspace, 2008-2030, .............................................................. 2.2
2.3 New and Existing Housing Stock, 2008-2030, Analysis Methodology........................................ 2.3
3.1 AEO 2008 Reference Case Projection for the Commercial Sector, Broken Out by the End
Uses Considered in This Analysis ................................................................................................ 3.2
4.1 AEO 2008 Reference Case Projection for the Residential Sector, Broken Out by the End
Uses Considered in This Analysis ................................................................................................ 4.2
6.1 AEO 2008 Reference Case Projection for the Combined Commercial and Residential
Sectors, Broken Out by the End Uses Considered in This Analysis............................................. 6.2
6.2 Integrated Commercial and Residential End Uses Represented in the BT BAU Case ................. 6.5
6.3 Integrated Commercial and Residential End Uses Represented in the BT Lost Opportunities
Case............................................................................................................................................... 6.6
6.4 Integrated Commercial and Residential End Uses Represented in the BT BAU Case ................. 6.6
6.5 Integrated Commercial and Residential End Uses Represented in the BT Lost Opportunities
Case............................................................................................................................................... 6.7
6.6 Integrated Commercial and Residential End Uses Represented in the BT BAU Case ................. 6.7
6.7 Integrated Commercial and Residential End Uses Represented in the BT Lost Opportunities
Case............................................................................................................................................... 6.8
8.1 2025 Buildings Sector Energy Flow from Source to End Use ..................................................... 8.2
8.2 2025 Buildings Sector Energy Flow from Source to End Use under the BT Lost
Opportunities Case ........................................................................................................................ 8.3
8.3 Change in 2025 Buildings Sector Energy Flows between AEO 2008 Reference Case and the
BT Lost Opportunities Case.......................................................................................................... 8.4
xTables
2.1 Primary Energy Consumption and Savings by Analysis Case ..................................................... 2.2
2.2 Comparison of Study Results........................................................................................................ 2.4
3.1 Treatment of Commercial End Uses in the Lost Opportunities Case ........................................... 3.1
4.1 Treatment of Residential End Uses in the Lost Opportunities Case ............................................. 4.1
4.2 2001 Housing Unit Ownership by Weatherization Eligibility ...................................................... 4.4
5.1 Commercial Sector Performance Assumptions ............................................................................ 5.5
5.2 Residential Sector Performance Assumptions .............................................................................. 5.7
6.1 Comparison of Forecasted AEO 2008 Reference Case Commercial Sector End Use
Consumption ................................................................................................................................. 6.2
6.2 Comparison of Forecasted AEO 2008 Reference Case Residential Sector End Use
Consumption ................................................................................................................................. 6.3
6.3 Lost Opportunities Case Energy Savings by Commercial End Use and Vintage, Site QBtu in
2025 .............................................................................................................................................. 6.4
6.4 Lost Opportunities Case Energy Savings by Residential End Use and Stock Vintage, Site
QBtu in 2025 ................................................................................................................................. 6.4
7.1 Carbon Dioxide Emissions Factors ............................................................................................... 7.2
7.2 Annual Carbon Dioxide-Equivalent Emissions Impacts .............................................................. 7.3
xi1.0 Introduction
This report summarizes the results and the assumptions used in an analysis of the potential “lost
efficiency opportunities” in the buildings sector. These targets of opportunity are those end-uses,
applications, practices, and portions of the buildings market that are not currently being addressed, or
addressed fully, by the US Department of Energy (DOE) through its Building Technologies Program
(BTP), due to lack of resources. The lost opportunities, while a significant increase in effort and impact
in the buildings sector, still represent only a small portion of the full technical potential for energy
efficiency in buildings. Such national-scale benefits will not be realized without a more aggressive
national program, and are thus “lost opportunities” if not captured now. It is much more cost-effective
to realize profound improvements in building performance at the time of construction; once a building is
constructed, it is not cost effective to realize similar levels of performance, and thus the opportunities are
“lost.”
BTP commissioned Pacific Northwest National Laboratory (PNNL) to estimate the potential impacts
on national energy consumption in the year 2025 from a greatly expanded commercial and residential
sector portfolio. PNNL first was directed to analyze the lost opportunities in the residential buildings
sector, which resulted in an initial internal white paper 1 on the expected impacts in terms of energy and
carbon. After completing that analysis, the request was expanded to include a separate analysis of the
commercial buildings sector. That analysis resulted in an Official Use Only publication 2 illustrating the
potential implications of failing to pursue an aggressive research portfolio, using an integrated analysis
of potential research programs. That white paper demonstrated the ability to consider the integrated
impacts of a portfolio of activities. PNNL’s previous analyses (many years of annual budget benefits
estimates) of energy and carbon impacts associated with detailed BTP activities have necessarily been
“unintegrated” or individually estimated impact assessments produced for BTP’s internal use and are
pre-decisional in nature. However, PNNL has developed an approach to estimating the integrated
contribution of many research activities spanning many end-uses. Therefore, BTP has commissioned
this report which expands the approach used for the commercial sector to include the residential sector
and provides integrated energy and carbon impacts across BTP’s span of influence in the buildings
sector.
Based on discussions with BTP, PNNL postulated and analyzed a greatly expanded buildings
sector program that would aggressively pursue an integrated program of research, demonstration,
and deployment of improved technologies for the commercial and residential sectors. Through the
integration of measures targeting major energy service demands including space conditioning, water
heating, and lighting, the energy performance of new additions to the stock and some element of the
existing stock would be greatly improved. Further, BTP would target increased energy-efficiency in
what the Energy Information Administration (EIA) terms the “other” 3 (and sometimes “miscellaneous”)
end uses. Finally, the zero-energy concepts currently being developed in the commercial and residential
sectors would be more aggressively integrated and packaged for deployment in the new stock, leading to
wide adoption of solar photovoltaic (PV) technology in buildings.
1
J.A. Dirks, D.M. Anderson, D.J. Hostick, D.B. Belzer, K.A. Cort, Feb. 2007, Lost Opportunities in the Residential Sector: Draft Analysis and
Results, PNNL-16455. This document was superseded by the current document.
2
J.A. Dirks, D.M. Anderson, D.J. Hostick, D.B. Belzer, K.A. Cort, Oct. 2007, Lost Opportunities in the Commercial Sector: Draft Analysis and
Results, PNNL-SA-57697. This document was superseded by the current document.
3
Per EIA, Annual Energy Outlook 2008, Table 5, Footnote 6: “includes miscellaneous uses, such as service station equipment, automated teller
machines, telecommunications equipment, medical equipment, pumps, emergency generators, combined heat and power in commercial
buildings, manufacturing performed in commercial buildings, and cooking (distillate fuel oil), plus residual fuel oil, liquefied petroleum gas,
coal, motor gasoline, and kerosene.”
1.1This analysis presents the effects of pursuing reductions in energy use and carbon emissions through
technology research activities. It does not consider alternative pathways which could lead to the same
end. For example, disruptive changes in service demands could alter the landscape of opportunities for
end use technology development. Such disruptions might occur if viable alternative technologies for
achieving the same level of comfort emerge or gain strongholds (for example, hand disinfectant
replacing hand washing with water, advances in clothing technology to “space condition” the person in
hot or cold built environments, increased task illumination vs. room illumination, increased application
of microwave technology for cooking, ultrasonic dishwashing and showering technologies, open-air
clothes drying, etc.)
Because of the necessarily hypothetical nature of the requested analysis, PNNL relied heavily on
professional judgment, derived in part from PNNL’s experience in estimating national-scale energy
savings impacts as part of the Government Performance and Results Act (GPRA) benefits estimation
process. PNNL staff also drew on its experience estimating the energy efficiency potential at Army
bases and other federal facilities.
1.22.0 Results Summary
The effects of the Lost Opportunities (LO) case are best illustrated using Figure 2.1. The top line of
the figure shows building energy consumption as projected by EIA in the Annual Energy Outlook 2008
(AEO) Reference Case. 4 In the Reference Case, EIA projects combined commercial and residential sector
primary energy use to be 47.7 QBtu in 2025. As Table 2.1 indicates, over 70% of the projected growth is
commercial. The bottom line in Figure 2.1 indicates the technical potential for energy savings if the
outcomes from BTP technologies in the Lost Opportunities analysis were adopted instantaneously at
100% levels. Just below the top line is the business as usual (BAU) case for BTP, developed from
PNNL’s analysis of the FY 2009 budget request 5; that is, the current effort in research and development,
codes and standards, and deployment given current resources. PNNL projects that this current or BAU
BTP program will result in energy consumption levels which are 6.9% lower than the Reference Case by
2025. With the activities defined in the more aggressive Lost Opportunities case (third line from the top);
primary energy consumption would be 17.8% lower than the Reference Case in 2025. Total energy
savings are estimated to be 8.5 primary QBtu (3.3 QBtu BAU plus an additional 5.2 QBtu Lost
Opportunities) by 2025. In perspective, 8.5 QBtu is about equal to the total primary energy consumed by
the state of California annually. 6 These results are summarized in Table 2.1 below. Note that each
successive savings level reported in Table 2.1 incorporates savings reported in the previous case. That is,
the “Lost Opportunities” case assumes all the savings from the Building Technologies (BT) BAU case
and adds to these additional opportunities for savings.
Integrated Commercial+Residential Energy Consumption (QBtu, Primary)
50
45
40
35
30
AEO Reference Case
25
BT LO Case
BT BAU Case
20
Overnight Technical Potential
15
* Technical potential shown does not include the ef f ect of overnight saturation of PV in the residential sector.
See text f or f urther discussion. Note also the Y-axis is truncated f or display purposes
10
2009
2010
2012
2013
2014
2015
2016
2017
2018
2019
2020
2021
2022
2023
2024
2025
2011
Figure 2.1. Total Estimated Buildings-Sector Energy Consumption under Alternative Cases
4
The lost opportunities case should not be compared to the full AEO Reference Case commercial and residential energy consumption, because
not all end uses included in the AEO commercial and residential sectors are expected to be addressed by BTP. This is further clarified in Tables 4
and 5. The baseline for comparison is a subset of the AEO commercial and residential sectors – excluding only very minor end uses.
5
OMB Budget of 9/21/2007.
6
Table S3. Energy Consumption Estimates by Source, 2005, http://www.eia.doe.gov/emeu/states/sep_sum/html/sum_btu_tot.html.
2.1Table 2.1. Primary Energy Consumption and Savings by Analysis Case (QBtu)
Analysis Case 2009 2015 2025 2009 2015 2025
AEO Reference Case - Commercial 18.6 20.3 23.5
Savings Relative to the
AEO Reference Case - Residential 22.2 22.6 24.2
AEO Reference Case
Buildings Sector Reference Case 40.8 42.9 47.7
BT BAU Case - Commercial 18.6 20.2 22.4 0.0 0.2 1.2
BT BAU Case - Residential 22.2 21.6 22.1 0.0 1.0 2.1
Buildings Sector BAU Case 40.8 41.7 44.4 0.0 1.2 3.3
BT LO Case - Commercial 18.5 19.1 19.6 0.1 1.3 3.9
BT LO Case - Residential 22.1 20.8 19.6 0.1 1.8 4.6
Buildings Sector LO Case 40.6 39.9 39.2 0.2 3.0 8.5
Technical Potential - Commercial 18.0 15.4 15.4 0.6 4.9 8.2
Technical Potential - Residential 21.1 15.4 14.5 1.1 7.2 9.7
Buildings Sector Technical Potential 39.1 30.8 29.8 1.7 12.1 17.9
*Totals affected by rounding.
The results show that an aggressive program in the buildings sector, represented by the Lost
Opportunities case, could result in decreasing energy consumption through the projection period. The
BAU case could hold combined residential and commercial consumption nearly level through the
period—increasing slightly in the out years. However, the legacy of the existing stock and the associated
barriers to implementation of aggressive energy savings measures in the other end uses causes a wide gap
to remain between the Lost Opportunities case and technical potential case. Projected beyond 2025, the
divergence from the AEO Reference Case forecast increases, as the new post-2008 buildings gain a
greater and greater share of the total stock. See Figure 2.2 and Figure 2.3 for context.
Commercial Floorspace (Billion ft2) Energy Intensity (KBtu/sqft)
120 300
100 250
80 200
60 150
40 100
Cumulative New Stock Additions
20 Existing 2009 Commercial Stock 50
Commercial Energy Intensity
0 0
2009 2012 2020 2030
Figure 2.2. New and Existing Commercial Floorspace, 2008-2030, (AEO 2008 Reference Case)
2.2SF Units (Millions) Energy Intensity (KBtu/sqft)
120 120
100 100
80 80
60 60
40 40
New SF Stock Additions
20 Existing 2009 SF Stock 20
Residential Energy Intensity
0 0
2009 2012 2020 2030
Figure 2.3. New and Existing Housing Stock, 2008-2030, (AEO 2008 Reference Case) Analysis
Methodology
2.1 Comparisons with Other Studies
Two previous national studies conducted in the last 10 years ask similar questions (i.e. what are
the potential energy and carbon savings still to be harvested from the buildings sector?), though each
is unique in approach and nuance of the policy question. Chapter 4 of the Clean Energy Futures 7 study
(CEF) of 2000 covers the buildings sector and focuses on the specific policy levers available to affect
wider adoption of advanced building technologies. These effects were estimated by adjusting consumer
discount rates using a special version of the National Energy Modeling System (NEMS) named CEF-
NEMS, a deterministic model of the US commercial and residential sectors. A Pew Center report 8 from
2005 provides a thorough survey of the policy literature to assess the potential energy and carbon savings
in the near and long term. That study is based on the “10-50” solution to climate change, which suggests
that the climate change problem needs to be resolved in the next 50 years by providing solutions in each
decade.
Both of these studies provide summarized results that may be useful for general comparison with this
study. While general comparisons are useful for gaining an understanding of convention wisdom about
efficiency opportunities in the buildings sector, differences in methodological approaches make statistical
comparisons between the studies invalid. Both the cited studies and this study use deterministic
7
Interlaboratory Working Group. 2000. Scenarios for a Clean Energy Future (Oak Ridge, TN; Oak Ridge National Laboratory and Berkeley, CA;
Lawrence Berkeley National Laboratory), ORNL/CON-476 and LBNL-44029, November. Available online at: http://www.ornl.gov/sci/eere/cef/
8
Brown, M.A., F. Southworth, T.K. Stovall, 2005, Towards a Climate-Friendly Built Environment, prepared for the Pew Center on Global
Climate Change, Oak Ridge National Laboratory, June, 2005. Available online at:
http://www.pewclimate.org/docUploads/Buildings_FINAL.pdf
2.3approaches which do not provide statistical confidence intervals around the reported results. We are not
aware of any national study of the buildings sector that addresses uncertainty in a quantitative fashion.
Table 2.2 provides some illustrative comparisons of results for discussion purposes.
Table 2.2. Comparison of Study Results
Baseline Annual Baseline Annual Projected Annual Projected Annual
Study Energy Savings CO2 Savings Energy Savings CO2 Savings
(QBtu, Primary) (GtCO2) (QBtu, Primary) (GtCO2)
Lost Opportunities
0.20 0.0149 8.5 0.5117
(Out year=2025)
Clean Energy Future 9
NA NA 8.2 0.8983
(Out year=2020)
Pew Center 10
0.21 0.0132 4.2 0.2603
(Out year=2025)
Several important considerations affect these comparisons. First, this study has overcome some
known traditional analytical problems not handled in the comparison studies, including the modeling
of overlapping end uses and the modeling of electricity dispatch and its associated fuel mix impacts.
Second, the set of measures considered in each of the studies may not be comparable. For example,
this study models technology research advances that could be expected under greatly enhanced federal
investment as integrated activities, and incorporates associated deployment activities by assumption.
The other studies focus more on the market mechanisms that could be employed to affect wide adoption
of technologies. Therefore, the comparison provided is illustrative only of the magnitude of impacts that
would be reasonably achievable given significantly expanded federal investment
9
Interlaboratory Working Group. 2000, Op Cit; CO2 savings were converted from reported carbon savings
10
Brown, M.A., F. Southworth, T.K. Stovall, 2005, Op Cit; CO2 savings were converted from reported carbon savings
2.43.0 Commercial Sector Approach
To capture potential energy savings in a very “deep and broad” efficiency case, the impetus for
this analysis, PNNL established aggressive commercial performance targets including improved shell
(building envelope and structural elements), better heating, ventilation and air conditioning (HVAC)
mechanical performance, two to three times more efficient lighting, and holding energy intensity constant
in various miscellaneous end uses. Table 3.1 illustrates the end uses addressed in Lost Opportunities
Case.
Table 3.1. Treatment of Commercial End Uses in the Lost Opportunities Case
Percent of 2025 AEO
2008 Reference Case
AEO End Use Lost Opportunity End Use
Commercial Primary
Energy Use
Space Heating Heating 8.56%
Space Cooling Cooling 7.67%
Water Heating Water Heating 5.29%
Not explicitly addressed, but decreased in proportion to
Ventilation 2.88%
heating/cooling load reduction
Cooking Not Addressed 1.80%
Lighting Lighting 16.83%
Refrigeration Refrigeration 3.49%
Office Equipment (PC) Office Equipment (PC) 4.35%
Office Equipment Office Equipment
11.39%
(non-PC) (non-PC)
Other Uses Other Uses 37.75%
Sum of Above 100.0%
In addition to the principal building end uses for commercial, PNNL assumed that refrigeration and
office equipment end uses would be targeted under a more robust research and development (R&D)
program. We assumed refrigeration would follow the same percentage reductions as cooling equipment
through some combination of R&D advances and regulatory standards. This would be equivalent to a
about a 23% decrease in 2015 and a 35% decrease in 2025 below EIA projections.
For office equipment, EIA assumptions contained in the AEO reference case suggest that the number
of both personal computer (PC) and non-PC related office equipment will increase in absolute terms and
in intensity as measured by energy use per square foot. In our analysis, we assume that technological
innovation creates increasing efficiency levels in all non-PC office equipment. As such, as increases in
floor space result in increased numbers of office equipment, the related increases in energy consumption
are offset by higher efficiencies. For PC office equipment, we assumed that the delivered electricity
consumption would be flat over time. As a result, given that floor space is increasing, energy intensity
per square foot is actually assumed to decrease; and while overall energy use rises, it is not as dramatic as
in the EIA reference case. For PC-related office equipment, this would be equivalent to a 7.5%–23.1%
decrease (2015–2025) in energy use as compared with EIA projections of delivered electricity for this
end-use. For non-PC office equipment, this outcome would be equivalent to a 15%–25% decrease (2015–
2025) over EIA projections. The Lost Opportunities case does not directly address cooking or ventilation
end uses.
3.1What remains to be addressed is “Other” commercial end uses. A large component of the “Other”
end uses in the commercial sector comes from non-building uses for such things as inter-basin water
transport (moving water from one river basin to another for environmental, agricultural, and fisheries
benefits). According to TIAX 11, just three inter-basin water transfer projects account for 20% of all
US water pumping energy consumption. Public water distribution and waste water treatment also are
significant electric loads assigned by EIA to the commercial sector but not within the programmatic
mandate or addressed by BTP as “buildings-related” energy use. Such non-building end uses are not
addressed under the Lost Opportunities case. Appendix A provides amplified discussion of the “Other”
end use services.
Figure 3.1 illustrates commercial sector component energy use as projected in the AEO 2008
reference case. According to AEO 2008, the average annual growth in commercial primary energy
consumption, from 2006 through 2030 is 0.6% for water heating, 0.2% for space heating, 0.8% for
space cooling, 0.7% for lighting, 1.7% for other uses, 2.1% for PC office equipment, and 3.3% for non-
PC office equipment. While significantly enhanced BTP activities may address the traditional end uses
(space conditioning, water heating, and lighting), it is unclear what sort of program can be formulated to
address these “Other” end uses. If energy efficiency programs, companies, and individuals do not have
specific knowledge as to what is included in “Other” and how further energy savings might be attained
within this area, these “other” end use services will dominate future commercial energy consumption.
This is especially true as the zero energy buildings approach reduces space conditioning, water heating,
and lighting loads down dramatically.
Commercial Energy Consumption (QBtu Primary)
25
EIA "Other"
20 All Office Eq.
Vent/Cook/Refrig.
Lighting
Water Heating
15 Space Cooling
Space Heating
10
5
0
2009
2010
2011
2012
2013
2014
2015
2016
2017
2018
2019
2020
2021
2022
2023
2024
2025
Figure 3.1. AEO 2008 Reference Case Projection for the Commercial Sector, Broken Out by the End
Uses Considered in This Analysis
11
See discussion section and technical memo attachment discussing the TIAX work in this area.
TIAX 2006, Commercial and Residential Sector Miscellaneous Electricity Consumption: Y2005 and Projections to 2030. Prepared for the US
Department of Energy, Energy Information Administration, Reference No. D0366, TIAX LLC, Cambridge, MA
3.2It would appear that there are two principal categories of energy use (though largely undefined) which
are lumped into the “other” by EIA:
• Non-building-related commercial-sector energy consumption (water treatment and storage, for
example)
• An attempt to address a statistical discrepancy between the EIA supply-survey estimates for
electricity (as produced by EIA for the State Energy Data System and published in the Annual Energy
Review) and the Commercial Building Energy Consumption Survey (CBECS) estimates of total
commercial building energy use.
Energy consumption attributable to both of these categories falls outside the scope of energy-
efficiency opportunities that BT expects to address. See Appendix A for further investigation into the
nature of the “Other” end use category.
3.1 Commercial Penetration Rate Development
PNNL assumed that an aggressive technology R&D program targeting both higher performance
and reasonable first cost would be accompanied by an aggressive program of market conditioning and
deployment activities to facilitate timely and significant market penetration of the research outcomes.
This assumption guides the development of market penetration parameters discussed below. Because of
the hypothetical nature of the requested analysis, PNNL relied heavily on analytical conventional wisdom
and employed reasonable technological extrapolations in the view of the authors. For purposes of this
analysis, the commercial market was divided into existing and new, with consideration given to the
segmentation by owned–leased space and by non-government/government-owned. The market
penetration potential is explained in the succeeding sections on the existing and new commercial markets,
followed by a summary of the resulting overall penetration rates.
In developing market penetration rates for the Lost Opportunities exercise, PNNL assumed that
an increase in funding would also fund aggressive deployment and outreach activities. In the process,
PNNL considered possible activities that could be undertaken to increase market penetration, drawing
from a variety of sources to inform the process and provide high, but reasonable, boundaries. These
sources included historical successes of BTP-funded activities such as those that developed and promoted
low-e windows, compact fluorescent lights, and advanced refrigeration (as detailed in publications such
as 'Energy Research at DOE: Was it worth it?' 12), market studies and characterizations (including the
Innovologie report 13, U.S. Department of Energy publications, U.S. Department of Education
publications, Builderonline.com), and surveys (including the Johnson Controls report, Residential Energy
Consumption Survey (RECS), CBECS – see footnotes throughout). Historical experiences provided the
basis for judgement as to the impact of technologies and practices that transformed the market. Market
studies and characterizations informed decisions as to what was possible within market segments (e.g.,
low-income, education), and surveys provided insights as to what has been done historically with respect
to energy efficient technologies and practices, and what decision-makers are considering for the future.
12
National Research Council, 2001, Energy Research at DOE – Was it Worth it: Energy Efficiency and Fossil Energy Research 1978 to 2000,
National Academy Press, Washington, DC.
13
John Reed, Katherine Jonson, et al. Who Plays and Who Decides: The Structure and Operation of the Commercial Building Market.
Innovologie, LLC, March 2004. http://www.eere.energy.gov/buildings/highperformance/pdfs/who_plays_who_decides.pdf
3.33.1.1 Existing Commercial Market
There is a great deal of concentration of ownership in the commercial building sector for all building
types. Commercial building owners and franchisers are typically large national and regional firms.
Seventy six percent of commercial floorspace is non-government owned; and of this total, approximately
50% is occupied by the owners. 14 Based on information provided by Innovologie 15 in 2004, most owner-
occupied arrangements would seemingly have financial incentives to increase energy efficiency in
buildings and reduce energy use; however, an effective strategy to promote the deployment of energy-
efficiency building equipment, designs and retrofits in the commercial sector requires that these designs
are set very early in the design process and prior to the completion of financing. Once the budget is set, it
is difficult to introduce new components, even if they provide energy efficiency benefits and a stream of
future dollar savings.
It is likely that most commercial entities will be able to substantially upgrade the energy-efficiency
of heating and cooling systems as they replace older equipment, in fact changes in underlying equipment
energy standards will dictate it. However, in order to commit resources to substantial and energy-
efficient envelope and lighting retrofits, the profit margins must be at a level to support these higher first
costs of renovation. Most commercial buildings are small. Typically, the facility-management
knowledge of these smaller commercial establishments and the sophistication of the strategies being used
to deal with facility-related matters are not high.
While these factors can adversely impact the potential within the existing commercial market, there are
some factors that increase the potential opportunity for retrofits: 16
• About 50 percent of commercial office lease space is managed by the top 50 property managers.
• The top 40 lodging firms (and their affiliates) own about 70% of the market.
• About 12% of restaurant chains are owned or franchised by 25 firms.
• Fifty convenience store chains own or franchise about 40% of the convenience stores.
• The top 50 warehousing firms control about 8% of the total warehouse space, with the top
10 companies accounting for about 3.7% of the U.S. total.
Additionally, a survey conducted by Johnson Controls of 1,250 commercial energy management
decision makers 17 found that:
• About 60% of respondents expect to make energy efficiency improvements funded from their
operating budget or capital expenditures in the next year, expecting to invest an average of 6%–8% of
those budgets.
• They expect to use an average of 8% less energy as a result of those anticipated investments.
14
EIA, Commercial Buildings Energy Consumption Survey 2003, Table C1
http://www.eia.doe.gov/emeu/cbecs/cbecs2003/detailed_tables_2003/2003set5/2003html/b18.html
15
Reed, et al. Op. Cit.
16
Ibid.
17
Energy Efficiency Indicator Research Final Report. Johnson Controls. May 17, 2007.
http://johnsoncontrolseei.web180.com/files/energy_efficiency_indicator_report.pdf
3.4• About 77% of respondents with current or planned retrofit or new construction projects believe that
energy efficiency is (or will be) a priority in the construction design.
• About 64% of companies have a tolerance for a 2–5 year payback period for return on energy
efficiency investments.
Of the Johnson Controls respondents who already have energy management measures in place, most
measures have been low cost (e.g., educating staff on ways to reduce energy use [70%], adjusting HVAC
controls to reduce on-time [60%], attending energy management seminars [31%]). More capital-intensive
measures installed included:
• 67% switched to energy efficient lighting.
• 31% upgraded their existing energy management system.
• 28% installed energy-saving glass in windows.
• 28% replaced inefficient equipment even though it was not due for replacement.
• 28% installed variable speed or frequency drives (VSD, VFD).
• 23% installed an energy management system.
• 13% re-roofed with white shingles to reduce heat gain.
• 10% self-generate power to use during demand peaks.
While the Johnson Controls study is promising in terms of the number of companies undertaking
individual measures at the current time, we are not aware of similar statistics as to how many are
implementing multiple measures. The measures assumed in this report for existing buildings are not
individual, but represent a package that includes both window replacements and HVAC upgrades. Given
these factors, it is possible that significant gains could be made in the existing commercial building
market with an aggressive campaign focusing on the top property owners and managers. PNNL therefore
assumed potential market penetration of 20% of non-government owned space due to BT efforts.
Twenty four percent of the commercial stock is government-owned. Government-owned buildings
are predominantly locally-owned (CBECS 2003, Table C1), and just over 50% of total government-
owned space is used for education (these buildings are either state-owned, or locally-owned, comprising
about 58% of state and locally-owned floorspace). Federally-owned buildings must meet certain
legislative drivers (e.g., EPAct 2005, Executive Order 13423) regarding energy efficiency, and the Office
of Energy Efficiency and Renewable Energy (EERE)’s Federal Energy Management Program (FEMP) is
tasked with assisting federal agencies in this effort, therefore we assumed that no federally-owned
building energy savings would be due to BT efforts. Within the non-education buildings at the state and
local levels, there may be state and local legislation, as well as other federal programs (such as the State
Energy Program) that potentially overlap with BT’s efforts. Within this segment, we estimate that BT
efforts would increase market penetration by an additional 10%.
Within the remaining public education buildings, there are many efforts underway to target the
potential within this sector. In addition to BT’s Energy Smart Schools program, the Environmental
Protection Agency (EPA) is also promoting energy efficiency in schools through their Energy Star for
Higher Education and Energy Star for K-12 School Districts programs. The same legislative drivers
impacting state and local public buildings may also include education buildings. Additionally, the U.S.
Green Building Council’s Leadership in Energy and Environmental Design (LEED) Green Building
Rating System has developed a specific LEED for Schools rating system (20% of the LEED certified
3.5green buildings are schools and universities), and the Collaborative for High Performance Schools
(CHPS), which started in California in 2000, has been adopted by 14 school districts in California, as well
as three other states, and plans are under way to bring CHPS to five more states. 18 While green buildings
do not necessarily target energy efficiency specifically, they do include energy efficiency as a component,
and may be responsible for energy reductions of up to 40%. 19 Moreover, a Department of Education
Study 20 found that about 47% of public school districts renovated or retrofitted existing facilities to
improve energy efficiency in FY 2001 (although no statistics as to measures undertaken were provided).
While there are a number of activities targeting the education submarket, there are great gains to
potentially be realized. Because the top 100 school districts enroll about 23% of all K-12 students, the
market is similar to the commercial sector as a whole, in terms of concentration or “consolidation” of
school districts. 21 Given these factors, it is possible that gains could also be made in the existing education
market with an aggressive campaign focusing on the largest school districts. PNNL therefore assumed
potential market penetration of 15% of public education space due to BT efforts.
3.1.2 New Commercial Market
In the near term, one can expect new commercial construction to be similar to recent construction;
however, past experience and emerging trends in the commercial market indicate that the commercial
buildings of the future will be different, from design to construction to use. The Innovologie report
identified technological and organizational changes in the areas of communications, energy,
transportation, nanotechnology and biotechnology, manufacturing, and materials as the drivers for these
emerging trends. Additionally, changes in consumer values to focus more on time, convenience, and cost,
will continue to have a greater impact on the built environment (for example, consider the impact of
online shopping to the warehouse and retail sub-markets, or the rise in telecommuting to the office sub-
market).
In the future, new buildings will need to be designed and constructed with these changes in mind.
The Johnson Controls survey indicated that 77% of respondents with current or planned retrofit or new
construction projects believe that energy efficiency is (or will be) a priority in the building design; BT has
the potential opportunity to play a large role in the process. While many of these respondents will be
considering component changes, BT’s efforts can promote and promulgate whole-building efficiency
guidelines that might not otherwise be considered, either due to a lack of awareness or current higher first
costs. Additionally, the Johnson Controls survey found that almost 80% of respondents believe that
energy prices will increase over the next 12 months, with the average expectation of an increase of over
13%. For these reasons, PNNL assumed that an aggressive BT campaign could result in market
penetration of 60% in non-governmental owned space. Because these same drivers may also impact the
lease market in terms of options that lessees will be taking into consideration, PNNL expects that a
percentage of new buildings built to lease will consider the energy-efficiency implications in an effort to
make their buildings more attractive to potential lessees. PNNL therefore assumed that 20% of the non-
governmental lease market will wholly adopt the suite of advanced technologies and practices.
18
McGraw-Hill Construction. Education Green Building SmartMarket Report. 2007.
19
Ibid.
20
National Center for Education Statistics, U.S. Department of Education. Effects of Energy Needs and Expenditures on U.S. Public Schools.
May 2003.
21
Reed, et al. Op. Cit.
3.6PNNL’s assumptions for new government-owned non-education buildings are the same as that for
existing buildings; that 10% of the penetration of non-federally owned non-education buildings would be
due to BT efforts. Because of the potential legislative drivers and number of other players within the
public education energy efficiency market, PNNL assumed that an aggressive BT campaign could result
in market penetration of 40% in public education space.
3.1.3 Market Penetration Summary
Total estimated penetration into the commercial market is therefore assumed to be:
Commercial Existing
(76% non-government owned × 50% owner-occupied × 20% penetration)
plus
(76% non-government owned × 50% leased × 20% penetration)
plus
(3% federally-owned × 0% penetration)
plus
(21% government owned × 42% non-education × 10% penetration)
plus
(21% government owned × 58% education × 15% penetration)
Which resolves to 7.6% + 7.6% + 0% + 0.9% + 1.8%
= 17.9% of existing commercial floorspace by 2025.
Commercial New
(76% non-government owned × 50% owner-occupied × 60% penetration)
plus
(76% non-government owned × 50% leased × 20% penetration)
plus
(3% federally-owned × 0% penetration)
plus
(21% government owned × 42% non-education × 10% penetration)
plus
(21% government owned × 58% education × 40% penetration)
Which resolves to 22.8% + 7.6% + 0% + 0.9% + 4.9%
= 36.2% of new commercial floorspace by 2025.
3.74.0 Residential Sector Approach
For the lost opportunities case, PNNL developed two sets of performance characteristics to represent
future houses: the first set characterizes households in 2015; the second set characterizes households in
2025. The technical potential forecast assumed 100% penetration in both new and existing households
for the years 2015 and 2025 to develop the potential savings for those years. The technical potential case
for 2008 was the same as the reference case, and the points in between were interpolated linearly.
Technical potential bounds the results, and the activities estimated to result from the greatly expanded
residential sector investment would be expected to fall somewhere between the current AEO baseline, and
the technical potential. Penetration rates, as described in a section below, were applied to the technical
potential savings in order to determine the lost opportunities savings.
PNNL focused on major (and growing) end-uses including space heating, space cooling, water
heating, lighting, and plug loads. To capture the potential, residential performance targets were based on
an integrated electric heat pump that serves both space conditioning and water heating loads, more
efficient lighting, general improvements to the building shell, and improvements in plug loads. Table 4.1
illustrates the end uses addressed in Lost Opportunities Case.
Table 4.1. Treatment of Residential End Uses in the Lost Opportunities Case
Percent of 2025
Lost Opportunity End AEO2008 Reference
End Use AEO End Use
Use Case Residential Primary
Energy Use
Clothes Dryers Clothes Dryers Not Addressed 3.95
Clothes Washers* Clothes Washers Not Addressed 0.34
Color Televisions Color Televisions Miscellaneous 4.48
Cooking* Cooking Not Addressed 2.90
Dishwashers Dishwashers Not Addressed 1.30
FA Furnace Fans FA Furnace Fans Not Addressed 0.98
Freezers Freezers Not Addressed 1.31
Lighting Lighting Lighting 6.07
Computer Monitors Personal Computers Miscellaneous 0.39
Desktop PCs Personal Computers Miscellaneous 1.20
Laptops Personal Computers Miscellaneous 0.18
Refrigeration* Refrigeration Not Addressed 4.84
Space Cooling Space Cooling Space Cooling 12.59
Space Heating Space Heating Space Heating 25.67
Water Heating Water Heating Water Heating 10.67
Coffee Makers Other Miscellaneous 0.21
Electric Spas Other Miscellaneous 0.45
Home Audio Eq. Other Miscellaneous 0.53
Microwave Ovens Other Miscellaneous 0.70
Set-top Boxes Other Miscellaneous 1.69
All Other End Uses Other Not Addressed 19.56
Sum of Above 100.00
* These end uses were addressed in the BT BAU case, but not targeted in the Lost Opportunities case. Rounding affects totals.
4.1Similar to the discussion of Figure 3.1 and the commercial sector, Figure 4.1 illustrates residential
sector component energy use as projected in the AEO 2008 reference case. According to AEO 2008, the
average annual growth in residential primary energy consumption, from 2006 through 2030 is 0.1% for
water heating, 0.6% for space heating, 1.2% for space cooling, -1.9% for lighting, 1.9% for other uses,
2.0% for color televisions and set-top boxes, and 3.5% for personal computers. Per Annual Energy
Outlook 2008 Table 4, 88% of “other” is electric “other.” 22 National estimates of stand-by power
consumption for these devices were gathered from two reports commissioned by DOE and completed by
TIAX LLC 23,24 , and inform this analysis regarding the potential energy savings from an aggressive
research program to reduce stand-by losses attributable to these devices under the Lost Opportunities
case.
Residential Energy Consumption (QBtu Primary)
25
EIA "Other"
Comp/TV/Appli.
Vent/Cook/Refrig.
20
Lighting
Water Heating
Space Cooling
15
Space Heating
10
5
0
2009
2010
2011
2012
2013
2014
2015
2016
2017
2018
2019
2020
2021
2022
2023
2024
2025
Figure 4.1. AEO 2008 Reference Case Projection for the Residential Sector, Broken Out by the End
Uses Considered in This Analysis
4.1 Residential Penetration Rate Development
PNNL assumed that an aggressive technology R&D program would be accompanied by an aggressive
program of market conditioning and deployment activities to facilitate timely and significant market
penetration of the research outcomes. This theory guided the development of market penetration
parameters discussed below. Because of the hypothetical nature of the requested analysis, PNNL relied
heavily on analytical conventional wisdom and employed reasonable technological extrapolations in the
view of the authors.
22
Defined by EIA to include “small electric devices, heating elements, and motors not included in end-uses shown in Table 4.”
23
Commercial and Residential Miscellaneous Electricity Consumption: Y2005 and Projections to 2030, TIAX Report #D0366, September, 2006.
24
U.S. Residential Information technology Energy Consumption, TIAX Report, March, 2006.
4.2You can also read