The Deloitte City Mobility Index - Gauging global readiness for the future of mobility
←
→
Page content transcription
If your browser does not render page correctly, please read the page content below

The Deloitte City Mobility Index
Gauging global readiness for the future of mobility

By: Simon Dixon, Haris Irshad, Derek M. Pankratz, and Justine Bornstein

Where should cities                                     the Internet of Things, artificial intelligence, and
                                                        other digital technologies to develop and inform
go tomorrow?
                                                        intelligent decisions about people, places, and prod-
                                                        ucts.
   A smart city is a data-driven city, one in which        Unfortunately, when it comes to designing and
municipal leaders have an increasingly sophisti-        implementing a long-term vision for future mobil-
cated understanding of conditions in the areas they     ity, it is all too easy to ignore, misinterpret, or skew
oversee, including the urban transportation system.     this data to fit a preexisting narrative.1 We have seen
In the past, regulators used questionnaires and sur-    this play out in dozens of conversations with trans-
veys to map user needs. Today, platform operators       portation leaders all over the world. To build that
can rely on databases to provide a more accurate        vision, leaders need to gather the right data, ask the
picture in a much shorter time frame at a lower cost.   right questions, and focus on where cities should
Now, leaders can leverage a vast array of data from     go tomorrow.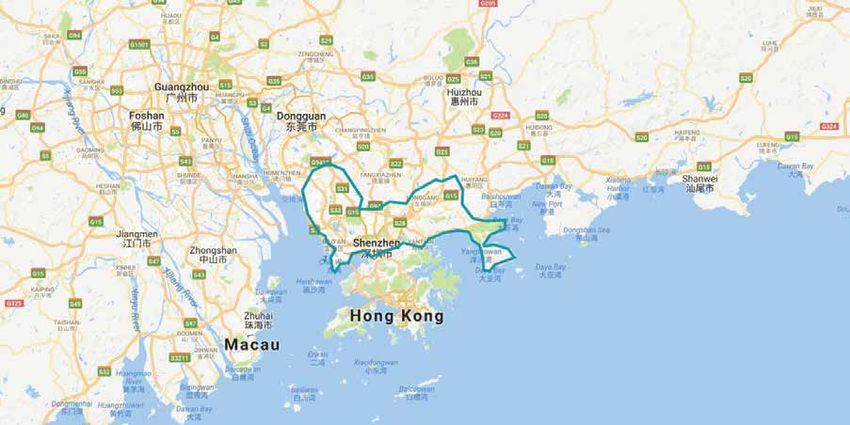
The Deloitte City Mobility Index

   Given the essential enabling role transportation               theme analyses how deliberate and forward-
plays in a city’s sustained economic prosperity, we2
                                                                  thinking a city’s leaders are regarding its future
set out to create a new and better way for city of-               mobility needs.
ficials to gauge the health of their mobility network          3. Service and inclusion. Urban mobility
and their readiness to embrace the future. The result             should be accessible to all residents. Exemplary
is the Deloitte City Mobility Index (DCMI), a collec-             cities in this category offer widespread coverage
tion of conscious choices based on our vision of what             and modest wait times for public transit, afford-
smart urban mobility should look like. The DCMI is                able options, and user-friendly ways to access a
an in-depth exploration into the rapid changes oc-                variety of transportation modes.
curring in the way people and goods move about,
with intermodal journeys, active transportation                   With these three themes as our lodestar, we dug
options, such as sidewalks and bicycle lanes, and              into the component pieces of each.
public transit playing prominent roles. The DCMI
places economic prosperity at its core, takes a holis-
tic view of the city’s entire mobility landscape, and          What we learned:
it is informed by our clear image of how the future            Select findings
of mobility could unfold in urban areas.
   Here you will find an overview of how we con-               “WHAT’S PAST IS PROLOGUE”3—
structed the DCMI and a discussion of some of our               BUT NOT DESTINY
key findings. We invite you also to explore the ac-               Some of the cities we looked at are centuries old;
companying in-depth city profiles and interactive              they reflect countless choices made by political lead-
feature, which we will be expanding over time.                 ers, businesses, and residents over time. Naturally,
                                                               those circumstances, both physical and political,
                                                               shape today’s mobility landscape, and affected their
Measuring urban                                                rankings in our index. Cities in which decision-mak-
mobility performance                                           ing authority rests with multiple actors, like Paris
                                                               and Washington DC, often struggle with articulat-
   To develop a picture of mobility across the globe,          ing and acting upon a cohesive vision for the future.
we went beyond what transportation looks like                     That said, many of the cities we profiled have
today to explore what mobility could be in a truly             shown a remarkable ability to overcome their cir-
smart, liveable, economically vibrant city. Three key          cumstances through new approaches. The mobility
themes emerged from this research:                             profile of Columbus, Ohio, for example, is typical
1. Performance and resilience. Urban mobil-                    of many mid-sized American cities: car-dominated,
   ity should be efficient. It’s a given that the trains       with limited public transit but also limited conges-
   should literally run on time. But cities that               tion due to its modest size. Faced with rapid growth
   scored highest in this category also minimize               and critical shortcomings, especially when it came
   congestion and travel times, maintain roads and             to key health outcomes, city leaders crafted an am-
   other infrastructure, and offer multiple, inte-             bitious strategy to remake Columbus’s transporta-
   grated modes of transportation.                             tion system into a model for smart mobility.4 Even
2. Vision and leadership. Urban mobility re-                   weather need not be a hindrance. Walking and cy-
   quires innovation, coordination among stake-                cling are most prevalent in Paris, Berlin, and Am-
   holders, and direction. Creating a high-per-                sterdam—all northern European cities. Helsinki is a
   forming, resilient, and inclusive mobility system           top performer, too, where it frequently snows!
   is unlikely to happen by accident. This second

                                                           2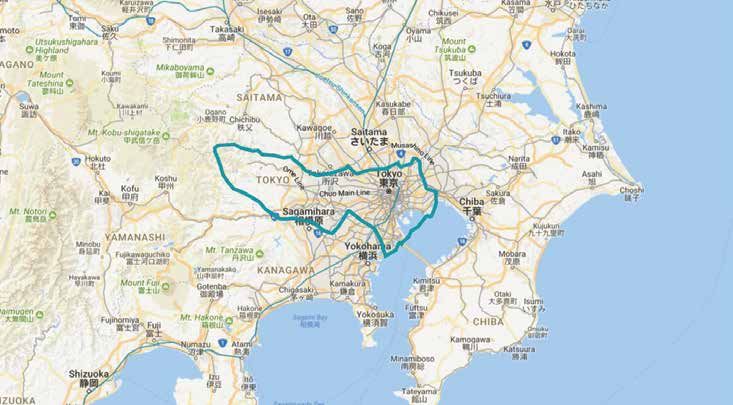
The Deloitte City Mobility Index

INTEGRATION IS KEY
                                                              consuming to utilize. But driving private cars adds
   Cities with high population densities such as              to congestion, pollution, and parking challenges,
London, Singapore, and Berlin scored highest on               not to mention the financial burden it places on
transportation performance. With more people                  families. In fact, some families find that the lower
funding systems that cover less ground, these cities          costs associated with a move outside of the city core
get more bang for their bucks. Cities with large geo-         are offset by car ownership costs or expensive travel
graphic areas, such as New York and Chicago, tend             passes. City governments would do well to work to-
to do better within city limits but do not perform as         gether with their surrounding regions to fix this is-
well in their larger exo-urban areas.                         sue, and to do so quickly.
   One reason for this may be the lack of integra-               There is also a direct tie between the presence
tion, coordination, and effective governance among            of multiple regulatory authorities and service pro-
transportation regulators and providers between               viders and having a lower ability or willingness
the city and the suburbs, and between public and              to explore innovative solutions. In our index, the
private entities. The city proper usually has one             leading innovations include smart parking and
transit authority, surrounding areas have their own,          ticketing, integrated payments, intelligent transit
and the level of cooperation between the various              systems, and electric vehicle infrastructure. For
entities can vary widely. While this is improving in          any of these efforts to succeed, they often need to
many of the cities surveyed, it still has a ways to go.       be offered across commuting corridors and inter-
   Our findings suggest that having multiple regu-            agency (regulatory body) coordination and coop-
latory providers inhibits a smoothly functioning              eration are required. Data integration, governance,
and integrated transportation system, but inter-              and security are also easier with more tightly linked
agency coordination can be successful. In Toronto,            governing bodies.
for example, the Toronto Transit Commission han-                 Finally, the data suggests that more than any
dles public transportation within the city, while a           other indicator, having low levels of integration is
multitude of smaller authorities (GO Transit, YRT/            correlated with low readiness to face the future of
Viva, MiWay, and others) cover the surrounding                mobility. Creating seamless urban transportation
municipalities. The various authorities operated              demands a unity of purpose and an ability to act in
largely independently—for years, passengers travel-           concert across different modes and jurisdictions.
ling between regions required multiple tickets and,
apart from a few exceptions, travellers who crossed           THE CHALLENGES OF PRIVATE CARS
boundaries had to pay two fares. However, since                  Our vision for smart urban mobility emphasizes
city leaders created the Greater Toronto Transpor-            active transportation and public transit. That neces-
tation Authority and the region’s “Big Move” initia-          sarily means any city that relies heavily on private
tive in 2009, integration has proceeded in stages.            cars—as many US cities do—will fare poorly on
When completed, this multiyear endeavor will fully            several metrics in the index. We think that choice
integrate a number of transit systems across On-              is reasonable. Our analysis—and many others’—re-
tario, allowing users to pay fares with a single card         veals a number of deleterious consequences from
across the network.5                                          overreliance on private autos, including congestion,
   As cities grow and expand and housing costs rise,          pollution, and accidents.6 If cities continue to grow—
many young families have little choice but to move            and the Organisation for Economic Co-operation
to the suburbs and commute into the city for work.            and Development (OECD) predicts that 70 percent
Too often, it becomes clear that the only viable com-         of the world’s population will live in urban areas by
muting option is driving; absent a single authority           20507 —then public and private players need to find
or close coordination among multiple authorities,             ways to move people and goods in ways that maxi-
public transportation can be too complex and time-            mize use of space and minimize such social costs.

                                                          3
The Deloitte City Mobility Index

   Private cars can work well in some circum-                     B, cycling across a large city is a less viable option.
stances and are an important piece of the mobility                While it is relatively easy for cities like Amsterdam
landscape, however. Geographically spread-out cit-                and Helsinki to do well in this regard, their recipes
ies tend to favor car use, and North American and                 for success may be hard to replicate in a sprawling
Australian cities are among the most geographically               metropolis, such as Los Angeles.
spread out of cities measured. Thus, they have a                     The role of culture is also much more important
higher modal share of private cars and a lower share              to the development of a transportation system than
of active transportation. Their strategic plans also              we usually assume. Casual ridesharing is common
tend to focus more on road improvements and road-                 in cities such as Washington DC (where it is known
based transportation.                                             as “slugging”) and New York, but less so in other US
   Still, cities that rely heavily on personal vehicles           cities. Similarly, Amsterdam is quite famous for its
should think through ways to optimize their use.                  cycling culture, but this seems not as common in
For example, by augmenting private ownership                      other cities, even those with similar geographic and
with carsharing and ridesharing, perhaps as part of               population profiles.
a mobility-as-a-service solution, it may be possible                 Then there is the issue of social attitudes toward
to keep the cars-to-people ratio in check—or even                 public transportation, such as “bus stigma” and the
drive it down. And cars are often the fallback op-                importance of “car culture.” Cities can spend bil-
tion when the first mile/last mile problem is unsolved.           lions to upgrade their transportation systems, but
Our research suggests that if getting to public trans-            if the public perceives that taking a bus or train is
portation is a problem, people will get in their cars . . .       a second-class option compared to driving in, pas-
and won’t get out until they reach their destination.             senger numbers will not increase. Such was the case
Creating convenient and affordable solutions for                  for Denver (not included in our survey).9 Car own-
the beginning and end of a journey—think bicycle-                 ership is deeply ingrained in the American psyche,
sharing, dynamic shuttles, and ride-hailing, ideally              is reinforced by decades of advertising by automak-
integrated via a full-fledged mobility-as-a-service               ers,10 and is an increasingly important status symbol
offering—can be an important step to reducing reli-               in China.11 Overcoming those cultural barriers could
ance on personally owned vehicles.                                be particularly challenging for transportation plan-
   Paris has made significant strides in reducing                 ners. They should consider ways either to work with
the number of single occupancy vehicles. It intro-                prevailing beliefs, or to find ways to shape them
duced a pioneering bicycle-sharing plan in 2007, an               gently.12
electric carsharing plan in 2011, and closed off the
left bank of the Seine to cars in 2013. As a result,
traffic has dropped by more than 30 percent in the                Remaking your mobility
past 15 years. 8
                                                                  landscape
CULTURE’S ROLE IN TRANSPORTATION                                     From our research, we found that mobility plays
   Similar to the EU’s designation for traditional                a central role in a city’s economic prosperity. This
foodstuffs of specific character, a city’s mobility sys-          is why the rewards for getting it right are poten-
tem will ultimately be shaped by its culture and “ter-            tially great. Looking for out-of-the-box solutions
roir” and have its own distinctive local flavor.                  to solve their problems, leading future of mobil-
   Geography plays a massive role in mobility, and                ity cities demonstrate that finding money is rarely
this is something that leaders should consider when               a long-term solution. Their success tends to stem
looking at other cities for inspiration. Spread-out               from integration and innovation rather than sheer
cities tend not to rank highly for active transporta-             investment.
tion. This is no surprise: If you have to get from A to

                                                              4
The Deloitte City Mobility Index

   For cities that have fared poorly across specific          will produce better returns over time. While adding
indicators, all is not lost. Given the speed of change        more service or building more roads can be helpful,
and technological trends, any city has the opportu-           developing better-integrated strategies with greater
nity to radically remake its mobility landscape over          involvement from the private sector often yields
the next five to ten years. Cities that rank poorly to-       better results. In these scenarios, the government
day could leapfrog to become leaders in the future of         often takes on different roles, such as enabling data
mobility by deploying advanced solutions that solve           sharing, monitoring cybersecurity, incentivizing
some of transportation’s perennial problems.                  private-sector innovation and participation, and es-
   Leaders need to identify what the “right” kind of          tablishing the standards and rules by which mobil-
spending is—typically, those that integrate systems           ity providers must abide.
or introduce technological improvements. These

  DCMI METHODOLOGY
  We chose more than 60 unique data parameters based on a review of existing literature, their
  correlations with economic growth, and our research team’s analysis. Data was gathered from a
  variety of sources, including government statistical databases, third-party reports, private vendors,
  and nongovernmental organizations. We then brought in the qualitative judgments of a variety of
  experts on urban mobility or particular cities, both inside and outside Deloitte.

  We assigned each metric a score between 1 and 5 based on the data parameters within it.
  Depending on the metric, score assignment involved converting a qualitative assessment into a
  number, indexing data to create a relative score, or both. We applied some data parameters and
  metrics to more than one theme.

  To look specifically at a city’s readiness for the future of mobility, we focused more closely on the
  parameters that dealt with “smart” or “digital” elements of transportation. In particular, the DCMI
  looks at integrated and shared mobility, vision and strategy, innovation, regulatory readiness for the
  future of mobility, and ease of use. The metric scores were then averaged. “Five” indicates being
  closest to full future of mobility readiness. (See figure 1.)

  The data was collected for the years 2016 and 2017 (or earlier where newer data did not exist).
  Unless specified otherwise, this information is no more than five years old. In some instances, trend
  data was collected, but predominately the data was cross-sectional for the latest year.

  In all, we examined more than 40 cities. (Profiles of 18 cities were published contemporaneously
  with this report. Additional cities will be added in the coming months.) Cities were selected to
  achieve geographic distribution, a variety of sizes (population and area), and various levels of
  economic development.

  Of course, any effort to create a composite measure such as this is a product of choices and
  assumptions made along the way. Ours were guided by a view of how seamless urban mobility
  that is faster, cheaper, safer, and cleaner than today could look, and the important contribution
  such a system can make to prosperity and productivity. Places that had multiple modes of easily
  accessible transportation; that had placed an emphasis on walking, biking, and public transit
  relative to personally owned automobiles; and that had taken steps toward digitally enabling their
  mobility network received high marks. Different choices and assumptions, guided by a different
  vision, would necessarily yield different results. In addition, the DCMI currently presents a snapshot,
  not a trajectory. It does not capture how cities have trended over time, nor can it evaluate how
  past investments have affected mobility. As we update the data every year, a more robust picture
  will emerge.

                                                          5
The Deloitte City Mobility Index

Figure 1. Deloitte City Mobility Index themes, metrics, and data sources

      THEME              METRIC                                                     EXAMPLE DATA
                                         • Peak hours spent in congestion                 • Driving time to city center (10km drive from
                      Congestion         • Congestion level                                 each cardinal direction, peak hours)
                                                                                          • Dedicated bus lane in km

                      Public transit     • Percentage of metro/tram delays                • Average waiting time for public
                      reliability        • Percentage of bus delays                         transportation (in minutes)

                                         • Road quality                                   • Number of traffic-related fatalities
                      Transit safety
                                         • Walkability score                              • Number of traffic-related serious injuries

  Performance                            • Existence of open data or APIs for transport   • Bikesharing system in the city
                      Integration and    • Existence of integrated ticketing option       • Existence of MaaS-based application
  and resilience      shared mobility      across transport modes                         • Private car dependency
                                         • Carsharing system in the city

                                         • Annual mean of PM2.5 concentration             • CO2 per capita emissions
                      Air quality
                                         • Annual mean of PM10 concentration              • Air quality index

                      Vision and         • City innovation and Future of Mobility         • Regulatory collaborations and joint initiatives
                      innovation           strategy                                         with the private sector and academia

                                         • Transport budget as a percentage of the        • Investment levels in transport
                      Investment           total local authority/city budget

                                         • Electric vehicles (EVs) adoption               • City rank in IESE Smart Cities index
                                         • Existence of open data or APIs for transport   • City innovation and Future of Mobility
                      Innovation                                                            strategy
                                         • Smart transportation/FoM-focused
                                           accelerators/venture capitals/startups         • Existence of MaaS-based application

                                         • Operation of ridesharing companies             • Regulatory collaborations and joint initiatives
    Vision and        Regulatory         • Number of regulatory bodies                      with the private sector and academia
                                                                                          • Autonomous vehicles (AVs) –city support
                      environment        • City innovation and Future of Mobility
    leadership                             strategy

                                         •   Transport sustainability score               • Cars sold/registered in given year that are
                      Environmental      •   Sustainability plan score                       low CO2 (BEV or PHEV)
                      sustainability     •   Length of bicycle lanes (in km)              • Dedicated bus lane (in km)
                      initiatives        •   Electric vehicles (EVs) incentives           • “Environmentally friendly” modal share (includes
                                                                                             public transport, walking, and cycling)

                                         • Rail system length (in km)                     • Metro/subway average peak frequency (in
                                         • Number of light rail stops                       minutes)
                      Public transport
                                         • Length of bicycle lanes (in km)                • Dedicated bus lane (in km)
                      supply
                                                                                          • Average waiting time for public
                                                                                            transportation (in minutes)

                                         •   Monthly public transport cost (in $)         • Minimum daily wage (in $)
                      Transport          •   Fuel price per liter (in $)                  • Modal share divided into percentage of trips
                      affordability      •   Average parking price (in $)                   by cars, public transport, cycling, walking,
                                                                                            and other modes such as taxi, ferries, etc.
                                         •   Average cost of taxi (in $)

                                         •   Presence of tube or commuter rail system     • Presence of dedicated rapid bus transport
                                         •   Presence of tram system                      • Presence of other mode of transport:
                                                                                            rickshaw, taxis, ferries, etc.
   Service and        Versatility        •   Operation of ridesharing companies
                                                                                          • Bikesharing system in the city
                                         •   Carsharing system in the city
    inclusion                                                                             • Private car dependency

                                         • Customer satisfaction with public transport I • Congestion level
                      Customer
                                         • Customer satisfaction with public transport II • Average waiting time for public
                      satisfaction                                                          transportation (in minutes)
                                         • Road quality

                                         • Transport accessibility score                  • Accessibility of train or metro fleet (in
                      Accessibility      • Accessibility of bus fleet (in percentage)       percentage)
                                                                                          • Walkability score

                                                                6
The Deloitte City Mobility Index

ENDNOTES

1.   City leaders are not alone in this. Corporate goal-setting is plagued by similar biases and chal-
     lenges when it comes to assessing current performance and setting future goals. See Michael E.
     Raynor, Mumtaz Ahmed, Derek M. Pankratz, and Rob Del Vicario, “A theory of relativity: Setting
     priorities and goals for financial performance improvement,” Deloitte Review 17, July 27, 2015.

2.   Sir Rod Eddington, “The Eddington transport study,” UK Department for Transport, December 2006.

3.   William Shakespeare, The Tempest, Act II, Scene 1.

4.   “Andrew J. Ginther, “Smart city: The city of Columbus,” E&E News, accessed December 15, 2017.

5.   Metrolinx, “The big move: Baseline monitoring report,” September 2013.

6.   See, for example, Graham Cookson and Bob Pishue, “INRIX Global Traffic Scorecard,” INRIX Research,
     February 2017; Federico Karagulian et al., “Contributions to cities’ ambient particulate matter (PM): A
     systematic review of local source contributions at global level,” Atmospheric Environment 120 (2015):
     pp. 475–83; World Health Organization, “WHO global urban ambient air pollution database,” 2016.
     OECD, The Cost of Air Pollution: Health Impacts of Road Transport, (Paris: OECD Publishing, 2014);
     Jonathan I. Levy, Jonathan J. Buonocore, and Katherine von Stackelberg, “Evaluation of the public
     health impacts of traffic congestion: A health risk assessment,” Environmental Health 9, no. 1 (2010):
     p. 65; and Erik Hansson, et al., “Relationship between commuting and health outcomes in a cross-
     sectional population survey in southern Sweden,” BMC Public Health 11, no. 1 (2011): p. 834.

7.   OECD and CDRF, “Trends in urbanisation and urban policies in OECD countries: What lessons for China?,”
     OECD, accessed December 15, 2017.

8.   Adele Peters, “Inside Paris mayor Anne Hidalgo’s ambitious plans to create the post-car city,”
     Fast Company, April 4, 2017.

9.   Andrew Small, “Denver radically expanded its transit. So why are more people driving cars?,” CityLab,
     November 2, 2017.

10. Derek M. Pankratz, Sarah Kovar, Jordan Sanders, and Philipp Willigmann, “Framing the future of mobility:
    Using behavioral economics to accelerate consumer adoption,” Deloitte Review 20, January 23, 2017.

11. Tania Branigan, “China and cars: A love story,” Guardian, December 14, 2012.

12. Richard H. Thaler and Cass R. Sunstein, Nudge (London: Penguin Books, 2009). See
    also Deloitte Insights’ collection on Behavioral Economics and Management.

13. The sources of data included:
     • 2thinknow data: Data sources purchased from 2thinknow, a research company based in Austra-
       lia that focuses on analysis of cities. Data points include metro/subway average peak frequency,
       taxi rate per km, traffic-related injuries and casualties, and others (14 data points in total).

     • Government statistical databases: Including census reports, eco-
       nomic statistics, and geographical information.

     • City and state/province websites: Including US Department of Trans-
       portation, city transport authority websites

     • External reports and indexes: Including Movmi Shared City Mobility Index, INRIX Global Traffic Scorecard,
       TomTom Traffic Index, Waze Driver Satisfaction Index, IESE Smart Cities Index, Arcadis Sustainability
       Index, Easy Park Smart Cities Index, Moovit average waiting time for public transportation survey.

                                                           7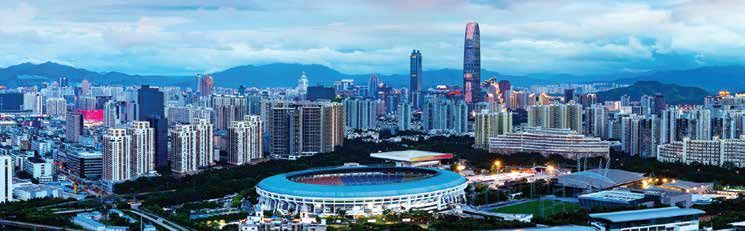
The Deloitte City Mobility Index

    • NGO reports: These include the road quality rating provided by World Economic Forum,
      Particulate Matter (PM2.5 and PM10) reports by World Health Organization, European Alterna-
      tive Fuels Observatory, OECD, CDP, and American Public Transportation Association.

    • Qualitative analysis: Done mostly by the Deloitte USI team. For example, evaluation of Elec-
      tric Vehicles and Autonomous Vehicles regulation, operation of ridesharing companies.

14. See Scott Corwin, Joe Vitale, Eamonn Kelly, and Elizabeth Cathles, The future of mobility: How trans-
    portation technology and social trends are creating a new business ecosystem, Deloitte University
    Press, September 24, 2015; and Scott Corwin, Nick Jameson, Derek M. Pankratz, and Philipp Willig-
    mann, The future of mobility: What’s next?, Deloitte University Press, September 14, 2016.

                                                          8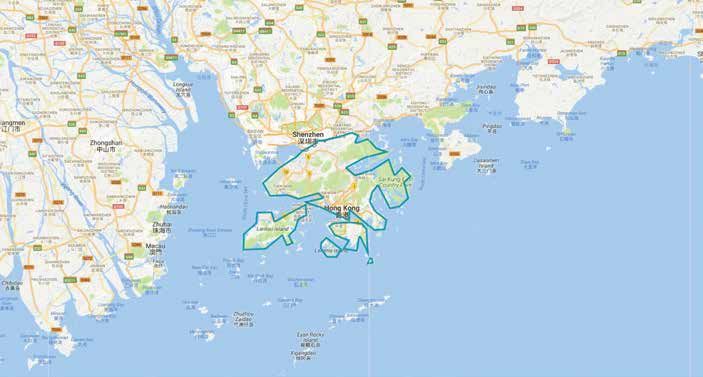
The Deloitte City Mobility Index

ABOUT THE AUTHORS
Simon Dixon is the global transportation leader for Deloitte and a partner in Deloitte’s Public Sector
practice. He specializes in the delivery and commercial management of large, complex business-critical
transformation programs and has a track record of putting government policy into practice. He is cur-
rently leading Deloitte’s global initiatives into the Future of Mobility and Smart Cities and his particular
focus is road pricing/congestion charging, following experience of delivering and supporting a number
of these programs around the world.

Haris Irshad is a senior manager of strategy and operations for Deloitte MCS Limited. An economist by
training, Irshad works with clients to help them instigate, manage, and take advantage of market disrup-
tion, particularly in the transport and urban development sectors. He has led a number of high-profile
projects examining the role of data, digital delivery, and new business models that enable countries and
cities to realize their vision of the future of mobility.

Derek M. Pankratz is a senior research manager with the Center for Integrated Research in Deloitte
Services LP. His research focuses on the confluence of emerging technological and social trends across
industries. Derek currently leads development of Deloitte’s perspectives around the future of mobility:
self-driving cars, shared transportation, and beyond.

Justine Bornstein is the UK Insight lead and program manager for the UK Future of Mobility practice
and a senior manager at Deloitte MCS Limited. Prior to that, she researched automotive and industrial
products, focusing on cross-industry trends affecting transportation and manufacturing and how they
impact corporate behavior.

Research and analysis team: Joanna Karlic, Amit Tzur, Kaustubh Dubey, Ashish Mishra, and Jae Park

ACKNOWLEDGEMENTS

Many colleagues offered invaluable insights throughout the development of this project, including
Scott Corwin, Mike Turley, Bill Eggers, Tiffany Dovey Fishman, Mark Gardner, Mark Price, and
John Skowron.

The authors would like to thank Warwick Goodall, Kim Metzger, Andy Tong, Andrew Nothstine,
Anant Aggarwal, Abhilash Kondapalli, Aarchit Jaiswal, Ankita Raghuvanshi, Vansh Kukreja,
Vaibhav Pandey, and Chaitanya Sandaka for their invaluable assistance in developing and
researching the Index. The authors would also like to thank the team at Deloitte Insights for their work
in seeing this project through to publication, in particular: Karen Edelman, Abrar Khan, Nikita Garia,
Preetha Devan, Joanie Pearson, Sonya Vasilieff, Alok Pepakayala, Anoop R, Tushar Barman, and
Mahima Nair.

                                                        9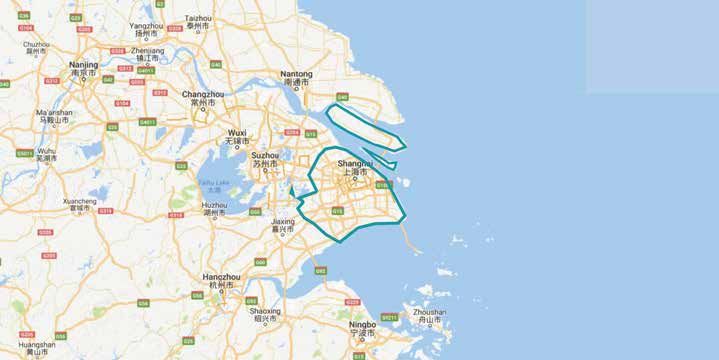
The Deloitte City Mobility Index

CONTACTS

Simon Dixon                                            Mark F. Gardner
Global Transportation leader                           Global Consulting Manufacturing leader
Partner                                                Managing partner
Deloitte MCS Limited                                   Deloitte Consulting LLP
Tel: +44 (0) 207 303 8707                              Tel: +1 313 324 1178
sidixon@deloitte.co.uk                                 mgardner@deloitte.com

John Skowron                                           Marco Hecker
Global Public Sector Consulting leader                 Future of Mobility leader
Partner                                                Deloitte China
Deloitte Consulting LLP                                Tel: +852 2852 6588
Tel: +1 412 402 5228                                   mhecker@deloitte.com.hk
jskowron@deloitte.com
                                                       Clare Ma
Mark Price                                             Smart City leader
US Public Sector leader                                Deloitte China
Vice chairman                                          Tel: +86 21 2312 7461
Deloitte Consulting LLP                                clarma@deloitte.com.cn
Tel: +1 617 585 5984
maprice@deloitte.com
                                                       Future of Mobility practice
                                                       futureofmobility@deloitte.com

                                                  10
The Deloitte City Mobility Index
About the Center for Integrated Research
Deloitte’s Center for Integrated Research focuses on developing fresh perspectives on critical busi-
ness issues that cut across industry and function, from the rapid change of emerging technologies
to the consistent factor of human behavior. We uncover deep, rigorously justified insights and
look at transformative topics in new ways, delivering new thinking in a variety of formats, such as
research articles, short videos, or in-person workshops.
About Deloitte’s Smart Cities/Smart Nation practice
Deloitte’s Smart City | Smart Nation practice strives to bring the full breadth and depth of the
firm’s capabilities to help cities tackle their toughest challenges. The SC|SN practice has devel-
oped a Smart City framework and solutions that help cities improve the quality of life for citizens
and contribute to the sustainability of urban landscapes. The practice has delivered innovative
strategies and solutions in cities across the globe, earning Deloitte recognition as a worldwide
leader in Smart Cities strategy and execution.
About Deloitte’s Future of Mobility practice
The entire way we travel from point A to point B is changing. This transformation is creating a
new ecosystem of personal mobility, with implications affecting more than just the automotive
industry. Our Future of Mobility practice serves the entire ecosystem of companies working in and
around mobility to actively shape its emergence.
For the full interactive index, visit the Deloitte City Mobility Index at
deloitte.com/insights/mobility-index.
For Deloitte’s insights on the Future of Mobility, visit
deloitte.com/insights/future-of-mobility.
11Sign up for Deloitte Insights updates at www.deloitte.com/insights.
Follow @DeloitteInsight
Contributors
Editorial: Karen Edelman, Abrar Khan, and Preetha Devan
Creative: Joanie Pearson
Promotion: Amy Bergstrom, Sandhya Davis, and Devon Mychal
Cover artwork: Sonya Vasilieff
About Deloitte Insights
Deloitte Insights publishes original articles, reports and periodicals that provide insights for businesses, the public sector and
NGOs. Our goal is to draw upon research and experience from throughout our professional services organization, and that of
coauthors in academia and business, to advance the conversation on a broad spectrum of topics of interest to executives and
government leaders.
Deloitte Insights is an imprint of Deloitte Development LLC.
About this publication
This publication contains general information only, and none of Deloitte Touche Tohmatsu Limited, its member firms, or its
and their affiliates are, by means of this publication, rendering accounting, business, financial, investment, legal, tax, or other
professional advice or services. This publication is not a substitute for such professional advice or services, nor should it be
used as a basis for any decision or action that may affect your finances or your business. Before making any decision or taking
any action that may affect your finances or your business, you should consult a qualified professional adviser.
None of Deloitte Touche Tohmatsu Limited, its member firms, or its and their respective affiliates shall be responsible for any
loss whatsoever sustained by any person who relies on this publication.
About Deloitte
Deloitte refers to one or more of Deloitte Touche Tohmatsu Limited, a UK private company limited by guarantee (“DTTL”), its
network of member firms, and their related entities. DTTL and each of its member firms are legally separate and independent
entities. DTTL (also referred to as “Deloitte Global”) does not provide services to clients. In the United States, Deloitte refers to
one or more of the US member firms of DTTL, their related entities that operate using the “Deloitte” name in the United States
and their respective affiliates. Certain services may not be available to attest clients under the rules and regulations of public
accounting. Please see www.deloitte.com/about to learn more about our global network of member firms.
Copyright © 2018 Deloitte Development LLC. All rights reserved.
Member of Deloitte Touche Tohmatsu LimitedDeloitte City Mobility Index Analysis area
Beijing
Analysis area: 16,410 km2 | Population: 21,700,000 (2017) | Population density: 1,323/km2
Definition of analysis area: Beijing Municipality consisting of all 16 districts
TO GL
MOBILITY ANALYSIS CO
P O KEY MOBILITY STATISTICS
P B
EM AS N ERF AL
ER PI T EN O L Public transport options*
GI RI RM EA
N N D D Metro, bus, commuter train
G G ER ER ER
Congestion Monthly public transport pass
US$34
Public transport reliability
Performance Transport safety GDP
US$391 billion (2016)
and resilience Integrated and shared mobility
Air quality Principal transport authorities
Beijing Municipal Commission
of Transport
Vision and strategy
*Planned, regulated, licensed, subsidized, and monitored by
Investment principal transport authority.
Innovation JOURNEY MODAL SPLIT
Vision and
Regulatory environment PRIVATE CAR PUBLIC TRANSIT
leadership
Environmental sustainability 28% 36%
initiatives
Public transit supply
Transport affordability
WALKING BICYCLE
Versatility
27% 9%
Service and Customer satisfaction
inclusion
Accessibility
FUTURE OF MOBILITY CAPABILITY
Beijing
FoM global
leader
Significant Passive environment, Proactive environment, Proactive environment,
work to do a number of barriers some barriers few barriers
STRENGTHS CHALLENGES
• Strong government commitment to improving transport and • Very high levels of traffic gridlock and air pollution, despite high
substantial backing for infrastructure investments alternative transport use
• Plans to upgrade the public transport infrastructure by • Low provision of real-time traffic information and restrictions
deploying new signaling systems and driverless metros on data-sharing for foreign players
• A balanced modal split and moves toward further promotion of • Fragmented policy and decision-making processes related to
sustainable transport, such as electric vehicles (EVs), and bicycles infrastructure involving urban, transport, and national
and pedestrian walkways government agenciesDeloitte City Mobility Index Beijing
Key focus areas to improve
Expansion of the Adoption of new Greater emphasis on
city mobility and realize the metro network to technologies and the adoption of EVs,
Future of Mobility: cover suburbs and
adjacent cities
availability of
transport-related
supported by
comprehensive
open data policies and subsidy
schemes
MOBILITY ANALYSIS FURTHER DETAILS:
Performance and Vision and leadership Service and inclusion
resilience
Struggling with high congestion and poor Beijing has plans to develop sustainable Public transport is affordable for most
air quality, Beijing is looking toward transport, with government investments citizens, but requires technological
innovative solutions, such as ride-hailing focused on expanding its public transport upgrades and expansion in suburban
services, contactless payment, and infrastructure. regions.
low-emission zones. • The city planners have assured investment • With swelling urban expansion, the public
• The capital city now has the largest private of more than US$62 billion through 2020 transport supply needs to grow
vehicle ownership and one of the longest to expand the metro network and to build substantially. Recognizing as much, Beijing
commute times during rush hour in China; a one-hour commuting circle covering transportation authorities have set out
in 2017, the average daily travel time for suburbs and adjacent cities. plans for the capital's transportation
Beijing's workers was 52.9 minutes. development for the next five years, which
• Beijing has been pushing for years for a
involves expanding the bus lane network
• The city is encouraging the use of new greater adoption of EVs, with
to 1,000 km.
technologies, such as ride-hailing and comprehensive policies and subsidy
contactless payment, integrated across schemes in place. The city also has the • The city’s public transit system is
modes, to provide efficient and largest EV ownership in the country, with affordable due to large subsidies provided
high-quality transport services. the highest car-per-charging pile ratio. by the government to ensure equitable
access for minimum wage earners.
• Beijing launched a low-emission zone in • The city also plans to encourage cycling as
September 2017, banning heavy-duty a greener way to commute, with 3,200 km • The metro network is popular and boasts
freight vehicles with emissions above the of bike lanes and at least 100,000 bicycles intervals of only a minute between trains
National IV Standards from entering the for rent. in the morning peak period.
city. The move is expected to reduce public
health hazards and save an estimated 43
lives and more than US$31 million per
year. While air quality has improved in
recent years, it remains a key issue.
SUMMARY
Beijing has taken multiple measures to make itself a livable city. It has a forward-looking approach to its transport issues and has formulated
strong development plans for the next five years. These plans involve expansion of public transport and sustainable modes of transport,
evident in the 72 percent share occupied by public transport and active modes. It has also embraced testing of new mobility solutions, such
as EVs and shared mobility models. A number of these initiatives are already bearing results.
Nonetheless, the city faces some immediate challenges in terms of ongoing air pollution, traffic congestion, and the need for operational
improvements in public transport and stronger coordination efforts among the various government agencies.
CONTACTS
Simon Dixon Marco Hecker Clare Jiong Lin Ma
Global Transportation leader Future of Mobility leader Smart City leader
Partner Deloitte China Deloitte China
Deloitte MCS Limited Tel: +852 2852 6588 Tel: +86 21 2312 7461
Tel: +44 (0) 207 303 8707 Mobile: +86 185 1622 1169 Mobile: +86 137 0164 6437
Email: sidixon@deloitte.co.uk Email: mhecker@deloitte.com.hk Email: clarma@deloitte.com.cn
About the Deloitte City Mobility Index About this publication Tohmatsu Limited, a UK private company limited
The Deloitte City Mobility Index reviews major cities This publication has been written in general terms by guarantee (“DTTL”). DTTL and each of its
on key aspects of mobility and the resulting and we recommend that you obtain professional member firms are legally separate and indepen-
relationship to economic performance. Drawing on advice before acting or refraining from action on dent entities. DTTL and Deloitte NWE LLP do not
publicly available data, client conversations, and any of the contents of this publication. Deloitte MCS provide services to clients. Please see
bespoke Deloitte analyses, we assess each city’s Limited accepts no liability for any loss occasioned www.deloitte.com/about to learn more about our
ability to transport its citizens both now and in the to any person acting or refraining from action as a global network of member firms.
future and therefore its potential to bring prosperity result of any material in this publication. © 2018 Deloitte MCS Limited. All rights reserved
to the city.
About Deloitte
As we receive feedback, we will update and expand Deloitte MCS Limited is registered in England and
the analysis, which may mean the results shown in Wales with registered number 03311052 and its
this document may change. registered office at Hill House, 1 Little New Street,
For the full interactive index, visit the Deloitte City London, EC4A 3TR, United Kingdom.
Mobility Index at deloitte.com/insights/mobility-index.
http://www.deloitte.com/insights/city-mobility-index Deloitte MCS Limited is a subsidiary of Deloitte LLP,
For Deloitte’s insights on the Future of Mobility, visit which is the United Kingdom affiliate of Deloitte
deloitte.com/insights/future-of-mobility.
http://www.deloitte.com/insights/future-of-mobility NWE LLP, a member firm of Deloitte ToucheDeloitte City Mobility Index Analysis area
Shanghai Analysis area: 6,341 km2 | Population: 24,100,000 (2017) | Population density: 3,814/km2
Definition of analysis area: Shanghai municipality, consisting of all 16 districts
TO GL
MOBILITY ANALYSIS CO
P O KEY MOBILITY STATISTICS
P B
EM AS N ERF AL Public transport options*
ER PI T EN O L
GI RI RM EA Metro, bus, commuter train, Maglev, ferry,
N N D D
G G ER ER ER
tram, taxi
Congestion
Monthly public transport pass
Public transport reliability US$33
Performance Transport safety GDP
and resilience Integrated and shared mobility
US$463 billion (2017)
Air quality Principal transport authority
Shanghai Municipal Transportation
Commission
Vision and strategy
*Regulated, licensed, subsidized, and monitored by principal
Investment transport authorities.
Innovation JOURNEY MODAL SPLIT
Vision and PRIVATE CAR PUBLIC TRANSIT
Regulatory environment
leadership
Environmental sustainability 19% 32%
initiatives
Public transit supply
Transport affordability WALKING BICYCLE
Versatility
25% 16%
Service and Customer satisfaction
inclusion
Accessibility
OTHER: 8%
FUTURE OF MOBILITY CAPABILITY
Shanghai
FoM global
leader
Significant Passive environment, Proactive environment, Proactive environment,
work to do a number of barriers some barriers few barriers
STRENGTHS CHALLENGES
• Advanced communications systems in place to ensure fast • Lacks real-time traffic information and data-sharing among
resolution of transportation breakdowns various transport modes
• Transport infrastructure expansion plans include integrating the • Needs more long-term financing channels, such as
metro with other regions such as Kunshan and Suzhou public-private partnerships, for the construction and operation
of the metro system
• Developed an underground pedestrian network in the central
business district to take pedestrians off the busy roads and • Illegal bikesharing schemes and blockage of walkways due to
improve safety bicycles reduce usability for pedestriansDeloitte City Mobility Index Shanghai
Key focus areas to improve
Continue to expand Roll out new Promote the use of
city mobility and realize the the metro network to technologies in the electric vehicles (EVs)
Future of Mobility: cover suburbs and
adjacent cities
metro to avoid long
security queues
more widely
MOBILITY ANALYSIS FURTHER DETAILS:
Performance and Vision and leadership Service and inclusion
resilience
Shanghai has an efficient and reliable The city has a clear long-term vision, Shanghai’s transportation system scores
transportation network that caters to the backed by investment plans with greater highly in terms of versatility, yet
different travel needs of commuters. emphasis on the adoption of new customer satisfaction and affordability
However, air quality and congestion technologies. remain key areas to improve.
remain matters of serious concern. • Shanghai has increased its modal shares • The city has an extensive range of
• The city scores high on “Integration and for public transport by placing restrictions transportation options, including buses,
shared mobility” because it has started to on car license auctions and removing metro, commuter rail, Maglev, trams, and
bring shared mobility services into the more than 160,000 cars that do not meet a large bikesharing network, making it one
public transport system to fulfill emission standards. of the most versatile transport systems.
personalized and point-to-point travel
• The city plans to extend its existing • While affordability is an area of concern
requirements.
subway network to 800 km by 2020. The for private car owners, overcrowding of
• The government has imposed strict goal is to build a one-hour commuting the public transportation system has made
security controls at passenger checkpoints circle, which would cover Zhejiang and it difficult for these individuals to shift their
with 5,000 security staff and 30,000 CCTV Jiangsu provinces. transportation modes. Further, overall
cameras, reflected in the high customer satisfaction levels are low.
• The city authority has also provided
transportation safety score. It is also
licenses and issued regulations to conduct • Almost all the metro stations have
harnessing big data and AI solutions to
road tests of self-driving cars in designated installed wheelchair ramps, sidewalks for
improve traffic law enforcement.
areas. the blind, barrier-free elevators,
• To reduce traffic pollution and improve air barrier-free toilets, broad passageways,
quality, Shanghai is currently upgrading signboards, and logos. However, only 10
the electric bus fleet using super capacitor percent of buses are completely
technologies that can charge a bus in 10 accessible, decreasing the overall
seconds for a 5-km distance. accessibility scores.
SUMMARY
Shanghai is recognized across the globe for its metro system, the longest, busiest, safest, and one of the most punctual on the planet. The city
also has massive expansion plans for its transportation infrastructure, and has seen huge investments in infrastructure projects over the last
five years. It is visible in the expansion of the Shanghai metro, where each kilometer of metro line costs between US$78 million and US$204
million. In addition, the city has developed a strong pedigree of sustainable transport with a robust underground pedestrian network in the
central business district. However, as with other Chinese cities, congestion levels are high and air quality has been low, despite government
efforts, and this may require further stringent measures to bolster the already restrictive license plate system.
CONTACTS
Simon Dixon Marco Hecker Clare Jiong Lin Ma
Global Transportation leader Future of Mobility leader Smart City leader
Partner Deloitte China Deloitte China
Deloitte MCS Limited Tel: +852 2852 6588 Tel: +86 21 2312 7461
Tel: +44 (0) 207 303 8707 Mobile: +86 185 1622 1169 Mobile: +86 137 0164 6437
Email: sidixon@deloitte.co.uk Email: mhecker@deloitte.com.hk Email: clarma@deloitte.com.cn
About the Deloitte City Mobility Index About this publication Tohmatsu Limited, a UK private company limited
The Deloitte City Mobility Index reviews major cities This publication has been written in general terms by guarantee (“DTTL”). DTTL and each of its
on key aspects of mobility and the resulting and we recommend that you obtain professional member firms are legally separate and indepen-
relationship to economic performance. Drawing on advice before acting or refraining from action on dent entities. DTTL and Deloitte NWE LLP do not
publicly available data, client conversations, and any of the contents of this publication. Deloitte MCS provide services to clients. Please see
bespoke Deloitte analyses, we assess each city’s Limited accepts no liability for any loss occasioned www.deloitte.com/about to learn more about our
ability to transport its citizens both now and in the to any person acting or refraining from action as a global network of member firms.
future and therefore its potential to bring prosperity result of any material in this publication. © 2018 Deloitte MCS Limited. All rights reserved
to the city.
About Deloitte
As we receive feedback, we will update and expand Deloitte MCS Limited is registered in England and
the analysis, which may mean the results shown in Wales with registered number 03311052 and its
this document may change. registered office at Hill House, 1 Little New Street,
For the full interactive index, visit the Deloitte City London, EC4A 3TR, United Kingdom.
http://www.http://www.deloitte.com/insights/city-mobility-index
Mobility Index at deloitte.com/insights/mobility-index. Deloitte MCS Limited is a subsidiary of Deloitte LLP,
For Deloitte’s insights on the Future of Mobility, visit which is the United Kingdom affiliate of Deloitte
deloitte.com/insights/future-of-mobility.
http://www.deloitte.com/insights/future-of-mobility NWE LLP, a member firm of Deloitte ToucheDeloitte City Mobility Index Analysis area
Shenzhen
Analysis area: 1,997 km2 | Population: 12,530,000 (2017) | Population density: 6,274/km2
Definition of analysis area: Shenzhen Municipality, consisting of all 10 districts
TO GL
MOBILITY ANALYSIS P O KEY MOBILITY STATISTICS
CO P B
EM AS N ERF AL Public transport options*
ER PI T EN O L
GI RI RM EA Metro, tram, bus, commuter rail,
N N D D
G G ER ER ER bicycle, ferry
Congestion
Monthly public transport pass
Public transport reliability US$23
Performance Transport safety GDP
and resilience US$338 billion (2017)
Integrated and shared mobility
Air quality Principal transport authority
Transport Commission of Shenzhen
Municipality
Vision and strategy
*Planned, regulated, licensed, subsidized, and monitored by
Investment principal transport authority.
Innovation JOURNEY MODAL SPLIT
Vision and PRIVATE CAR PUBLIC TRANSIT
Regulatory environment
leadership
Environmental sustainability 22% 22%
initiatives
Public transit supply
Transport affordability WALKING BICYCLE
Versatility
47% 5%
Service and Customer satisfaction
inclusion
Accessibility
OTHER: 4%
FUTURE OF MOBILITY CAPABILITY
Shenzhen
FoM global
leader
Significant Passive environment, Proactive environment, Proactive environment,
work to do a number of barriers some barriers few barriers
STRENGTHS CHALLENGES
• Provision of city-wide pedestrian-friendly infrastructure • Curbing high congestion given the high motor vehicle density
and limited road infrastructure
• Parking management schemes to improve road capacity
• Reducing real estate–related market risks in suburban regions
• Collaboration with the private sector to use technologies such as
when expanding “Rail+Property” models (a type of land value
AI and big data for traffic law enforcement
capture)
• Maintaining quality and coverage of road infrastructure, as the
urban population and car ownership riseDeloitte City Mobility Index Shenzhen
Key focus areas to improve
Implement revised Encourage the use Reduce financial
city mobility and realize the land use policies to of public and active dependence on
Future of Mobility: accommodate rising
car ownership
modes of transport
to mitigate
government capital for
maintaining public
congestion-related transportation
issues networks
MOBILITY ANALYSIS FURTHER DETAILS:
Performance and Vision and leadership Service and inclusion
resilience
Shenzhen is using AI and big data The government has recently reformed Shenzhen has a highly accessible public
techniques to improve road safety. It is land policy to finance transportation transportation system overall; however,
also using trading mechanisms and programs and is subsidizing charging the bus infrastructure needs
parking policies to deal with greenhouse infrastructure to push electric vehicle (EV) improvement.
gas (GHG) emissions and congestion. adoption. • The city has a robust public transportation
• The city is collaborating with private • While using “Rail+Property” models to system, with good geographic coverage
companies to use AI and big data to finance infrastructure projects helps and accessibility. Around 80 percent of bus
improve road safety, communications, and attract private investors, reduces land fees, stops in the city are available within a
peer efficiency. The Shenzhen Traffic and decreases dependency on walking distance of 500m.
Police Bureau uses these technologies to government capital by almost 50 percent,
• The city is extending the metro network as
identify images of traffic violations, with 95 it also introduces market risks.
well as a road construction program to
percent accuracy.
• To accelerate the EV adoption, the city is further develop and strengthen public and
• In order to deal with the GHG emissions, primarily focused on subsidizing the private transport in expanding exo-urban
Shenzhen has included the public construction of charging infrastructure. By regions of the city.
transportation department in its carbon 2018, the city’s electric bus fleet will have
• All metro stations in Shenzhen are
trading program, Shenzhen ETS. more than 16,000 battery-powered buses
equipped with barrier-free lifts; however,
in operation.
• Shenzhen is piloting a parking the city bus system is not accessible to
management policy to address congestion • Shenzhen is a hub of the Greater Bay Area, disabled people.
challenges. The policy is aiming to take part of the national strategy to create an
330,000 vehicles off the road each day. integrated economic zone by connecting
Hong Kong, Macao, and other districts.
Once infrastructure projects are
completed, the city needs to work on
developing intercity transportation.
SUMMARY
With its consistent focus and investments in the electrification of transport modes, Shenzhen has marked its presence on the global map by
switching on the world’s largest electric bus fleet. The city has very strong carsharing and bikesharing systems, which helps make the
transportation system sustainable and provides first- and last-mile solutions.
The transport authority of Shenzhen is currently focusing on tackling the high congestion levels in the city by using technologies and effective
parking management. If Shenzhen is able to keep its transit system growing at the same pace as its economy, it can potentially become the
leading global city for public transportation.
CONTACTS
Simon Dixon Marco Hecker Clare Jiong Lin Ma
Global Transportation leader Future of Mobility leader Smart City leader
Partner Deloitte China Deloitte China
Deloitte MCS Limited Tel: +852 2852 6588 Tel: +86 21 2312 7461
Tel: +44 (0) 207 303 8707 Mobile: +86 185 1622 1169 Mobile: +86 137 0164 6437
Email: sidixon@deloitte.co.uk Email: mhecker@deloitte.com.hk Email: clarma@deloitte.com.cn
About the Deloitte City Mobility Index About this publication Tohmatsu Limited, a UK private company limited
The Deloitte City Mobility Index reviews major cities This publication has been written in general terms by guarantee (“DTTL”). DTTL and each of its
on key aspects of mobility and the resulting and we recommend that you obtain professional member firms are legally separate and indepen-
relationship to economic performance. Drawing on advice before acting or refraining from action on dent entities. DTTL and Deloitte NWE LLP do not
publicly available data, client conversations, and any of the contents of this publication. Deloitte MCS provide services to clients. Please see
bespoke Deloitte analyses, we assess each city’s Limited accepts no liability for any loss occasioned www.deloitte.com/about to learn more about our
ability to transport its citizens both now and in the to any person acting or refraining from action as a global network of member firms.
future and therefore its potential to bring prosperity result of any material in this publication. © 2018 Deloitte MCS Limited. All rights reserved
to the city.
About Deloitte
As we receive feedback, we will update and expand Deloitte MCS Limited is registered in England and
the analysis, which may mean the results shown in Wales with registered number 03311052 and its
this document may change. registered office at Hill House, 1 Little New Street,
For the full interactive index, visit the Deloitte City London, EC4A 3TR, United Kingdom.
http://www.http://www.deloitte.com/insights/city-mobility-index
Mobility Index at deloitte.com/insights/mobility-index. Deloitte MCS Limited is a subsidiary of Deloitte LLP,
For Deloitte’s insights on the Future of Mobility, visit which is the United Kingdom affiliate of Deloitte
deloitte.com/insights/future-of-mobility.
http://www.deloitte.com/insights/future-of-mobility NWE LLP, a member firm of Deloitte ToucheYou can also read