The Future Isn't What It Used To Be - Changing Trends and Their Implications for Transport Planning - Victoria Transport Policy ...
←
→
Page content transcription
If your browser does not render page correctly, please read the page content below
www.vtpi.org
Info@vtpi.org
250-508-5150
The Future Isn’t What It Used To Be
Changing Trends and Their Implications for Transport Planning
25 June 2021
By Todd Litman
Victoria Transport Policy Institute
Future transportation envisioned by Fred Strothman in 1900.
Abstract
This report investigates how demographic and economic trends will affect future transport
demands (the amount and type of travel people would choose), and their implications. Motor
vehicle travel grew steadily during the Twentieth Century but has started to peak in most
developed countries. Aging population, rising fuel prices, increasing urbanization, improving
travel options, increasing health and environmental concerns, and changing consumer
preferences are reducing demand for automobile travel and increasing demand for alternatives.
Automobile travel will not disappear, but at the margin (compared with current travel patterns)
many people would prefer to drive less and rely more on walking, cycling, public transport and
telework, provided they are convenient, comfortable and affordable. This paper discusses ways
that transport policies and planning practices can respond to these changing demands.
Published as
Todd Litman (2006), “Changing Travel Demand: Implications for Transport Planning,”
ITE Journal, Vol. 76, No. 9, (www.ite.org), September, pp. 27-33.
Todd Litman (2019), “The Future is not what it Used to Be: Changing Travel Demands and their
Implications for Transport Planning,” Plan Canada (https://bit.ly/2zGcgSi). Winner of the Planning
Institute of Canada's Article of the Year / Article de l'année award (https://bit.ly/32fpH7G)
Todd Litman 2005-2021
You are welcome and encouraged to copy, distribute, share and excerpt this document and its ideas, provided the
author is given attribution. Please send your corrections, comments and suggestions for improvement.
The Future Isn’t What It Used To Be: Changing Trends And Their Implications For Transport Planning
                                                      Victoria Transport Policy Institute

Contents
Introduction ...............................................................................................................................2
Factors Affecting Travel Demands ............................................................................................3
Twentieth Century Transport Trends .........................................................................................5
   Transportation Infrastructure ................................................................................................................... 5
   Vehicle Ownership .................................................................................................................................. 6
   Vehicle Travel .......................................................................................................................................... 8
   Trip Purpose ..........................................................................................................................................11
Factors Affecting Travel Demand ............................................................................................ 12
   Demographics .......................................................................................................................................12
   Income ...................................................................................................................................................16
   Geographic Location .............................................................................................................................17
   Vehicle Costs ........................................................................................................................................18
   Travel Speeds .......................................................................................................................................20
   Transportation Options ..........................................................................................................................21
   New Technologies .................................................................................................................................22
   Consumer Preferences .........................................................................................................................25
   Freight Transport ...................................................................................................................................26
   Trend Summary.....................................................................................................................................27
Official Predictions .................................................................................................................. 28
Implications For Planning ........................................................................................................ 30
Benefits of Responding To Changing Travel Demands ........................................................... 33
Conclusions ............................................................................................................................ 34
References and Resources For More Information ................................................................... 35

Past Visions of Future Transportation

         1939 Futurama                                                      1949 ConvAIRCAR Flying Car

1958 Ford Firebird III, which included the “Autoglide”
automated guidance system.

                                                                                                      1961 Bell Rocket Belt

                                                                              1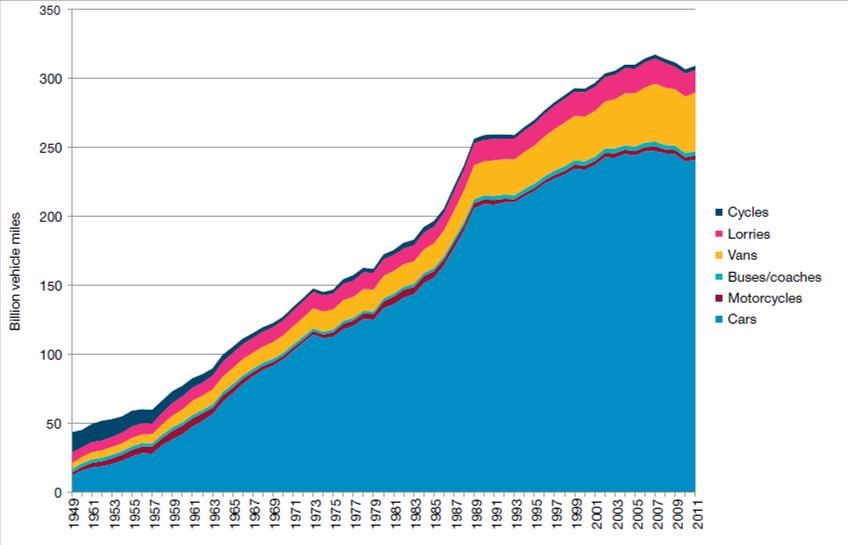
The Future Isn’t What It Used To Be: Changing Trends And Their Implications For Transport Planning
                                         Victoria Transport Policy Institute

Introduction
According to predictions made a few decades ago, current travel should involve flying cars, jetpacks and
moving sidewalks, with space transport a common occurrence (Corn 1984; Cosgrove and Orrick 2004). For
example, General Motor’s 1939 World’s Fair Futurama display predicted that by the 1960s, uncongested,
100-mile-per-hour superhighways would provide seamless travel between suburban homes and towering
cities in luxurious, streamlined cars. In 1961, Weekend Magazine predicted that by 2000, “Rocket belts will
increase a man’s stride to 30 feet, and bus-type helicopters will travel along crowded air skyways. There will
be moving plastic-covered pavements, individual hoppicopters, and 200 mph monorail trains operating in all
large cities. The family car will be soundless, vibrationless and self-propelled thermostatically. The engine will
be smaller than a typewriter. Cars will travel overland on an 18 inch air cushion.”1

The 1968 movie, 2001 A Space Odyssey, shows commercial moon travel. The 1969 Manhattan City Plan
stated, “It is assumed that new technology will be enlisted in this improved transportation system, including
transit powered by gravity and vacuum and mechanical aids to pedestrian movement, such as moving belts
or quick-access shuttle vehicles. These devices almost surely will become available by the end of the
century.”

Figure 1          Segway Human Transporters

                          Segway is an example of a new motorized transport mode.

Although new transport technologies grew during the Twentieth Century, including automobile,2
airplane, and containerized freight, recent transport innovations have been more modest, and none
have displaced existing modes. Segways have not replaced walking, ridehailing has not significantly
reduced private automobile travel, and MagLev trains have not displaced conventional public
transportation services.

Transportation professionals help create the future so it is important that we consider the overall
context of long-term planning decisions. Good planning does not simply extrapolate trends, it
investigate underlying factors that cause change. This report examines various demographic and
economic factors that are likely to affect future travel demands, investigates evidence that travel
demand is peaking, and their implications for transport planning.

1
 “Will Life Be Worth Living in 2,000 AD?” Weekend Magazine, 22 July 1961 (www.pixelmatic.com.au/2000).
2
 In this report, automobile refers to all personal motor vehicles including cars, vans, light trucks, sport utility
vehicles, and even motorcycles.
                                                          2
The Future Isn’t What It Used To Be: Changing Trends And Their Implications For Transport Planning
                                           Victoria Transport Policy Institute

Factors Affecting Travel Demands
Travel demand refers to the amount and type of travel people would consume in a particular situation,
considering factors such as the quality and price of available transport options. Various factors can
affect travel demands, as summarized below (Goodwin 2012; KPMG 2020; Leard, Linn and Munnings
2016). Some of these factors are well recognized in conventional travel demand analysis, but others are
often overlooked or given little consideration in current planning.

Table 1            Factors Affecting Travel Demands
                                  Factor                                     Consideration in Conventional Analysis
Economic factors of productivity, incomes and prices
Demographics (age, school and work status, income, physical ability)        Generally considered
Area economic activity (productivity and types of industries)               Generally considered
Vehicle costs including vehicle fees, fuel prices, road tolls and parking   Fuel prices and tolls generally considered, other
fees                                                                        factors often ignored
Public transit fares                                                        Generally considered
Company car policies and taxes                                              Only considered in special studies
Quality of available transport options
Traffic congestion                                                          Generally considered in traffic models
Public transport service quality                                            Speed considered, comfort often ignored
Walking and cycling conditions (sidewalks, bike lanes, etc.)                Only considered in special studies
Street planning and management, including complete streets policies         Only considered if they affect traffic speeds
Parking supply, management and prices                                       Only considered in special studies
Intercity travel conditions (road, rail and air travel)                     Only considered in special studies
Mobility substitutes such as telecommunications and delivery services       Overlooked by models that extrapolate trends
Vehicle rental and sharing options                                          Only considered in special studies
Land Use Factors
Land use development patterns (density, mix, etc.)                          Considered in integrated models
Smart growth/New urbanist/transit-oriented development practices            Considered in some integrated models
Local neighborhood retail and service quality                               Considered in integrated models
Roadway connectivity                                                        Partly considered in traffic models
Emerging social patterns and preferences
Vehicle ownership and travel time budget saturation                         Overlooked by models that extrapolate trends
Transportation demand management programs                                   Only considered in special studies
Changing transport preferences (declining ‘love affair with the car’)       Overlooked by models that extrapolate trends
Reduced importance and greater barriers to young people’s drivers           Overlooked by models that extrapolate trends
licensing
Health and environmental concerns                                           Overlooked by models that extrapolate trends
Many factors can affect how and how much people want to travel. Conventional analysis tends to
overlook or undervalue many of these factors.

Many demand factors are non-linear and interactive. For example, when household increase from
lower- to middle-incomes their vehicle travel tends to increase significantly, but beyond middle-class
levels additional wealth causes little incremental increases in vehicle travel. Similarly, the impacts of
automobile pricing strategies (the effects of tolls, parking fees, fuel price increases, etc.) tend to be
higher in areas with better travel options, and with lower income travelers than in automobile-
dependent areas and among higher income motorists. Some modes tend to be complementary. For
example, since most transit trips include walking links, improving walking conditions tends to increase
transit demand and vice versa. All of these factors should be considered when evaluating future travel
demands and the impacts of transportation system changes on future travel activity.

                                                             3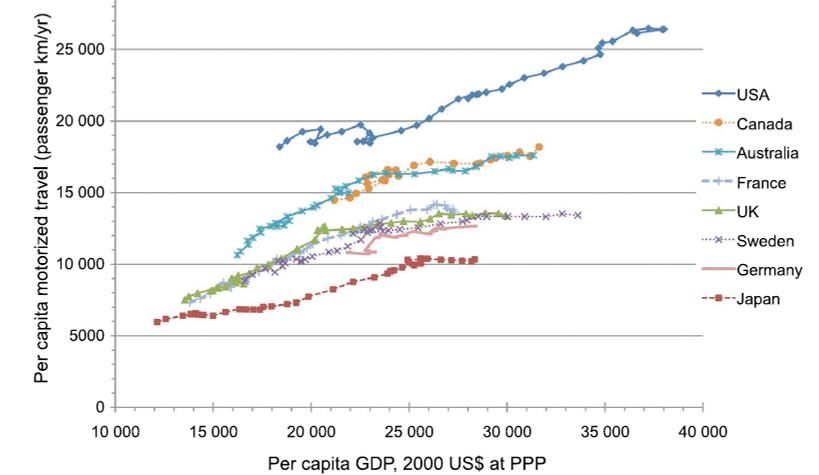
The Future Isn’t What It Used To Be: Changing Trends And Their Implications For Transport Planning
Victoria Transport Policy Institute
For public policy and planning evaluation purposes, travel demands include both community and
individual perspectives. A community perspective reflects the types of travel activities that support
community goals, such as reducing total traffic and parking congestion, accidents, pollution emissions.
Such goals tend to increase communities’ demand for resource-efficient transport options such as
improved cycling, ridesharing and public transit, and for demand management strategies that
encourage efficient mode use. An individual demand perspective reflects the travel activity that
individual travelers or households will choose given available travel options. For example, aging
population, rising fuel prices and increasing health concerns tend to increase demand for walking,
cycling, ridesharing and public transit.
Both of these perspectives should be considered when evaluating transport demands. This is important
because these two perspectives have multiplicative effects: if both community and individual demands
for an alternative mode doubles, total demands quadruple since the community wants people to use
those modes and more individuals are willing to use them. As a result, a combination of trends, such as
aging population, rising fuel prices, urbanization, increasing health and environmental concerns can
greatly increase walking, cycling, ridesharing and public transit demand, since it increases both the
value to communities of increased use of these modes, and travelers willingness to use them.
Figure 2 Community and Individual Demands for an Alternative Mode
Demand can reflect both community and
Community Demands
individual consumers’ perspectives. If
Future Demands
both community and individual demands
for travel by a particular mode doubles,
total demand quadruples since both the
community and individuals perceive more
value from increased use of that
Current Demands transport option.
Individual Demands
For example, you might want walking, cycling, ridesharing and public transit improvements in your
community, in part because you want other travelers to use these modes in order to reduce
congestion, accident and pollution costs you bear (an external benefit), and partly because you want to
use those modes yourself. This can help create a self-reinforcing cycle of improved travel options,
increased use of non-automobile modes, more social acceptance of alternative modes, and more
support for their improvements.
As a result, demographic and economic trends that increase demand for non-automobile modes can
have significant synergistic effects (their combined impacts are much larger than the sum of their
individual impacts), and modest changes often research a tipping point beyond which their impacts are
large (Hidalgo and Zeng 2013; ITF 2021).
4
The Future Isn’t What It Used To Be: Changing Trends And Their Implications For Transport Planning
                                              Victoria Transport Policy Institute

Twentieth Century Transport Trends
This section summarizes how transportation infrastructure, vehicle ownership and use developed during
the Twentieth Century. Also see DfT (2015), ITF (2013), NCHRP (2014) and USDOT (2015).

Transportation Infrastructure
At the start of the Twentieth Century most roads were unpaved. Roadway mileage and quality
increased tremendously during the Century, culminating in the Interstate Highway System. Since that
system was virtually completed in the 1980s there has been little roadway expansion, as indicated in
Figure 3. Similar patterns occurred in other developed countries.

Figure 3                  US. Roadway Mileage (MVMA 1995, p. 69)
                                                                                                    3,500

                               Paved                                                                3,000

                               Unpaved                                                              2,500
      Roadway Miles

                                                                                                    2,000

                                                                                                    1,500

                                                                                                    1,000

                                                                                                    500

                                                                                                     0
                      1904 1921 1930 1935 1940 1945 1950 1955 1960 1965 1970 1975 1980 1985 1990 1995

Roadway mileage grew significantly between 1900 and 1980. Little growth has occurred since.

Railroad mileage increased during the first half of the Twentieth Century and declined during the
second half, but the decline has stopped, and Class 1 track mileage increased slightly between 2000
and 2002. Many major rail lines and terminals are now being upgraded to accommodate more rail
traffic and container volume.

Airport and port infrastructure also expanded significantly during much of the Twentieth Century.
Some expansion continues, particularly at major transfer hubs, but much of demand growth is being
accommodated by incremental improvements and better management of existing facilities. Some
airports and ports are inefficiently oversized.

During the first two-thirds of the Twentieth Century public transit ridership service declined due to a
spiral of declining investment, service quality and ridership, but this has been reversed as many cities
reinvest in transit infrastructure and implement policies that increase service quality and encourage
ridership. For example, between 1995 and 2002 bus route miles increased about 20% and rail transit
track mileage by about 40%.

                                                              5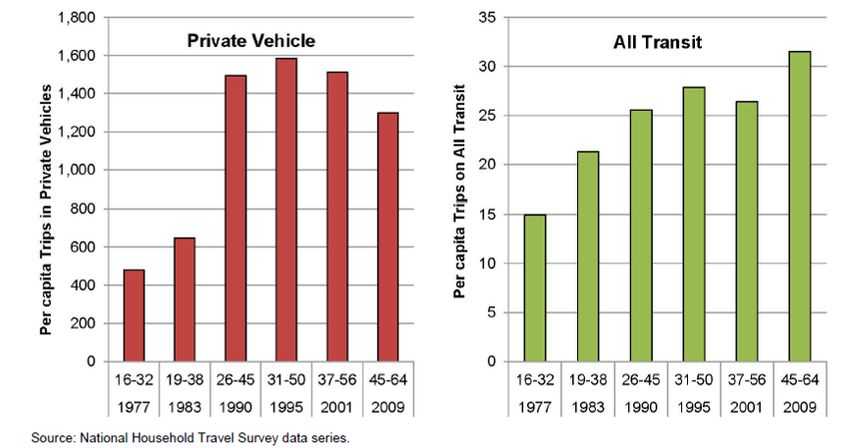
The Future Isn’t What It Used To Be: Changing Trends And Their Implications For Transport Planning
                                                                      Victoria Transport Policy Institute

Vehicle Ownership
In the U.S., per capita motor vehicle ownership grew during the Twentieth Century but peaked at 0.79
vehicles per capita in 2006, and declined to 0.77 in 2016, as illustrated in Figure 4.

Figure 4                                             US. Vehicle Ownership Growth (Sivak 2018)
                                  0.80

                                  0.75
 Vehicles Per Capita

                                  0.70

                                  0.65

                                  0.60
                                              1984       1988      1992        1996        2000       2004        2008          2012        2016
Per capita vehicle ownership grew during most of the Twentieth Century but peaked in 2004.

Figure 5 illustrates per capita automobile ownership trends by income class from 1973 to 2001.

Figure 5                                             Vehicles Per Capita By Income Class (BLS, Various Years)
                                        1.0
                                                                                                                         Highest Quintile
                                                                                                                         Fourth Quintile
                                        0.8                                                                              Third Quintile
                 Vehicles Per Capita

                                                                                                                         Second Quintile
                                                                                                                         Lowest Quintile
                                        0.6

                                        0.4

                                        0.2

                                        0.0
                                                 1972       1981     1986       1991       1996      2001
                                                                               Year
Vehicle ownership rates grew for all income classes until about 1985, but subsequently leveled off.

                                                                                       6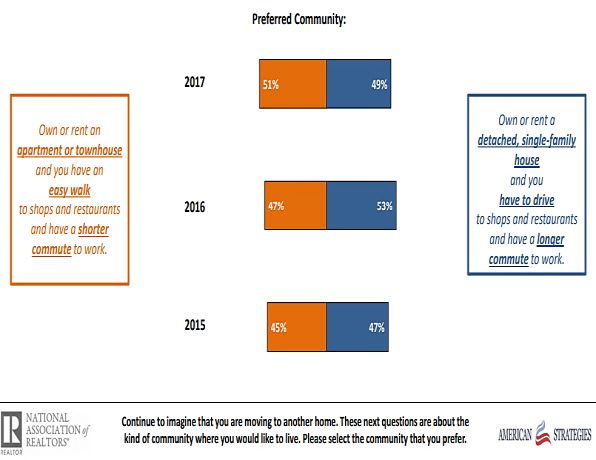
The Future Isn’t What It Used To Be: Changing Trends And Their Implications For Transport Planning
                                                         Victoria Transport Policy Institute

The period of vehicle ownership growth coincided with Baby Boomer’s peak driving years, significant
growth in women employment rates, rising wages, low fuel prices, cheap credit and suburbanization.3
Most of these factors have peaked and many are now reversing. Market experts predict that
demographic and economic trends will reduce the U.S. vehicle fleet size (Brown 2010; Schwartz 2015).
Rubin and Grauman (2009) explain,
                           “Both vehicles per licensed driver and vehicles per household have seen steady, almost
                           uninterrupted growth since the last OPEC oil shock nearly thirty years ago. But both are likely
                           to deteriorate markedly over the next five years, reversing the trend growth in vehicle
                           ownership seen over much of the post-OPEC shock period. This fundamental change in the
                           number of vehicles on American roads will be accomplished not only in the short-run by the
                           broad deleveraging of consumer credit, but also by the prospect of consumers paying last
                           Memorial Day weekend gasoline prices ($4/gal) once economic growth gets back on track.

International data, illustrated in Figure 6, indicates that vehicle ownership growth rates started to
decline after 1990 in most wealthy countries such as Denmark, Germany, France, Italy, Finland, Sweden
and the U.K., and appear likely to level off at a point lower than the U.S. peak of 0.75 vehicles per
capita. Millard-Ball and Schipper (2010) and Newman and Kenworthy (2011) found similar patterns in
other industrialized countries (Australia, Canada, various European countries, and the U.S.).

Figure 6                            International Vehicle Ownership (EC 2010)
                             0.7
                                                                                                         Denmark

                             0.6                                                                         Germany
    Vehicles Per Capita

                                                                                                         Spain
                             0.5
                                                                                                         France
                             0.4
                                                                                                         Italy

                             0.3                                                                         Netherlands

                                                                                                         Portugal
                             0.2
                                                                                                         Finland

                             0.1                                                                         Sweden

                                                                                                         UK
                             0.0
                                    1970       1980      1990          2000   2005      2009

                                                                Year
Vehicle ownership grew in most European countries between 1970 and 2000, but is peaking.

3
 For more analysis of factors that contributed to vehicle travel demand growth from the 1960s through the
1990s see National Personal Transportation Survey analysis by Pisarski (1992) and Puentes 2012.
                                                         7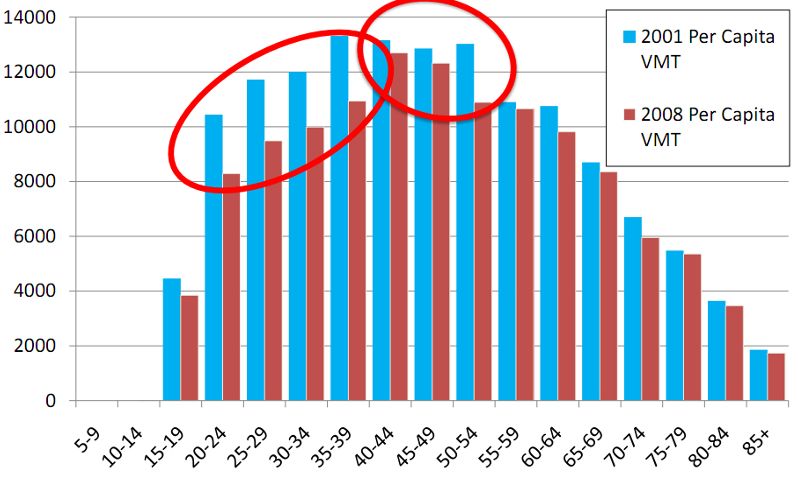
The Future Isn’t What It Used To Be: Changing Trends And Their Implications For Transport Planning
                                        Victoria Transport Policy Institute

Vehicle Travel
Motor vehicle travel grew during the Twentieth Century, but peaked after 2000 in most developed
countries (DfT 2015; ITF 2013; Pyper 2012; The Economist 2012; Tuttle 2012). In the U.S., per capita
vehicle travel peaked at about 10,200 annual vehicle-miles in 2006 and declined to 10,050 in 2018, as
illustrated in Figure 7. This peak predated the 2008 fuel price spike, reflecting fundamental demand
shifts (Silver 2009; Millard-Ball and Schipper 2010; Metz 2010; Sivak 2013-2018).

Figure 7           U.S. Average Annual Vehicles Mileage (FHWA 2016; Sivak 2018)
10,000

  8,000                      VMT Per Capita
                             Total VMT (millions)
  6,000

  4,000

  2,000

     -
          1900   1910    1920   1930    1940   1950    1960   1970    1980    1990   2000   2010    2020
Per capita US vehicle travel grew steadily during the Twentieth Century, but peaked about 2006.

Similar patterns occurred in peer countries, as illustrated in figures 9 and 10. Great Britain’s vehicle
travel trends are similar to those in the U.S., with steady growth until about 2000, followed by declining
growth rates, and peaking about 2007.

Figure 9           Great Britain Road Traffic, 1949–2011 (Le Vine and Jones 2012)

                                                                                              Great Britain
                                                                                              vehicle travel
                                                                                              grew steadily
                                                                                              during the
                                                                                              Twentieth
                                                                                              Century, but
                                                                                              peaked in 2007.

                                                         8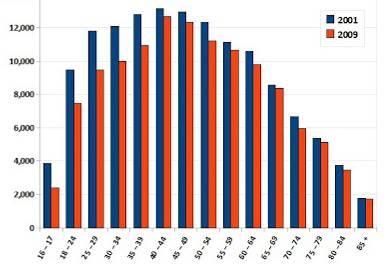
The Future Isn’t What It Used To Be: Changing Trends And Their Implications For Transport Planning
                                                                     Victoria Transport Policy Institute

Per capita vehicle travel has leveled off in most affluent countries and is far higher in the U.S. than
elsewhere (Goodwin 2011; ITF 2013; Le Vine and Jones 2012; Metz 2010; Millard-Ball and Schipper
2010; Schwartz 2015). Current 18-24 year olds tend to own fewer cars and drive less than previous
generations; although they will probably increase vehicle travel as they earn more and have more
responsibilities (particularly parenting) they are unlikely to drive as much as previous cohorts (KiM
2014; Kuhnimhof, Wirtz and Manz 2012).

Figure 10                                         International Vehicle Travel Trends (EC 2007; FHWA, Various Years)4
                                         25,000
                                                                                                              U.S.
    Annual Passenger Kms Per Capita

                                                                                                              Belgium
                                         20,000
                                                                                                              Denmark
                                                                                                              Finland
                                                                                                              France
                                         15,000
                                                                                                              Germany
                                                                                                              Greece
                                                                                                              Ireland
                                         10,000
                                                                                                              Italy
                                                                                                              Netherlands
                                                                                                              Norway
                                          5,000
                                                                                                              Portugal
                                                                                                              Spain
                                                                                                              Sweden
                                              0
                                                                                                              Switzerland
                                                    1970      1980       1990      2000       2007
                                                                                                              U.K.
                                                                         Year

Per capita vehicle travel grew rapidly between 1970 and 1990, but has since leveled off and is much
lower in European countries than in the U.S.

This peaking of motor vehicle travel can be partly explained by Marchetti’s Constant which suggests
that people’s travel time budgets are limited (Puentes 2012, p. 12), so increases in per capita mobility
during the last century can be explained by increased travel speeds. However, as described in more
detail later in this report, average travel speeds peaked in the late Twentieth Century in most
developed countries, and may decline due to increased congestion, while mobility substitutes that
reduce the need for travel, such as telecommunications and delivery services, have improved.

International comparisons indicate that mode shares vary significantly between regions. Many wealthy
countries, such as Denmark, Sweden and Switzerland, have relatively low automobile mode share, as
indicated in Figure 11.

4
 U.S. passenger-kms based on FHWA vehicle-miles x 1.67 (miles to kilometers) x 1.58 (vehicle-km to passenger-
kms) x 0.8 (total vehicles to passenger vehicles).
                                                     9
The Future Isn’t What It Used To Be: Changing Trends And Their Implications For Transport Planning
Victoria Transport Policy Institute
Figure 11 Personal Travel Mode Share By Peer Countries (Bassett, et al. 2008)
100%
Transit
80%
Mode Share
60% Bike
40% Walk
20%
Automobile
0%
Transportation patterns vary significantly among peer countries.
These statistics tend to undercount non-motorized mode share because most travel surveys
undercount short trips, non-commute trips, travel by children, and nonmotorized links of automobile
and transit trips. If instead of asking, “What portion of trips only involve walking?” we ask, “What
portion of trips involve some walking?” nonmotorized trips more than double (Litman 2003). Similarly,
if instead of asking, “What portion of total trips are by public transit?” we ask, “What portion of peak-
period trips on congested corridors are by transit?” or “What portion of residents use transit at least
occasionally?” the numbers are much higher.
U.S. transit ridership declined during most of the Twentieth Century, but increased after 1995 (Figure
12). Between 1995 and 2011, U.S. population grew 17%, VMT grew 22%, and transit ridership grew
34%. Transit ridership grew more in communities that improve transit service, provide incentives, and
implement transit-oriented development (TRL 2004). Coogan, et al. (2018) examine how various
demographic, geographic and economic trends are likely to affect future transit demands, including
ways that age, location, preferences, transit service quality, and availability of alternatives (including
ride-hailing).
10The Future Isn’t What It Used To Be: Changing Trends And Their Implications For Transport Planning
Victoria Transport Policy Institute
Figure 12 U.S. Public Transit Ridership (APTA 2013, Figure 2)
Transit Passenger-Miles Between 2004 and 2012 the U.S.
16% Population population grew 6%, transit
Vehicle-Miles
14% ridership increased 14%, and
Percent Change From 2004
12% motor vehicle travel declined
1%. These trends indicate that
10%
automobile travel demand is
8% peaking, while demand for other
6% modes is growing. Although few
people want to give up driving
4%
altogether, many would prefer
2% to drive less and rely more on
0% walking, bicycling and public
transit, provided they are
-2%
2004 2005 2006 2007 2008 2009 2010 2011 2012 convenient, comfortable and
affordable.
Trip Purpose
During the Twentieth Century there were significant changes in the character of personal travel. Early
in the century, most people worked, shopped and socialized close to their home. They might enjoy an
occasional recreational bike ride or out-of-town train trip, but most travel was functional and local. As
motor vehicle ownership grew, travel costs declined and households dispersed, people organized their
lives around increased mobility. The greatest growth in motorized travel has involved non-commute
personal trips, including shopping, social and recreational travel, and family/personal business, as
indicated in Figure 13, which shows changes in vehicle mileage by trip purpose between 1969 and
2009. Virtually all types of trips have peaked, and both commuting and household errand trips declined
during the last decade.
Figure 13 Vehicle Travel By Trip Purpose (Santos, et al. 2011, Tables 2 & 6)
2,500
Annual Per Capita Vehicle Miles
To or From Work
2,000
Social and Recreational
1,500 Family/Personal Errands
Shopping
1,000
Other
500
0
1969 1977 1983 1990 1995 2001 2009
This figure shows per capita vehicle mileage by trip purpose.
11The Future Isn’t What It Used To Be: Changing Trends And Their Implications For Transport Planning
Victoria Transport Policy Institute
Factors Affecting Travel Demand
This section discusses demographic, geographic and economic trends that affect travel demands.
Demographics
The U.S. population is projected to grow to nearly 400 million residents by 2050, a large absolute
increase but a lower growth rate than in the past (Cheeseman Day 2001). Figure 14 shows U.S.
population pyramids for 1990 and 2050.
Figure 14 U.S. Population by Age and Gender (U.S. Census 2002)
1990 2050
The portion of people who are retired and elderly is increasing significantly in developed countries.
Age affects travel patterns in several ways. Vehicle travel tends to increase as adolescence become
adults, peaks at 30-60-years when employment and childrearing responsibilities are greatest, and then
declines as people retire and age, as illustrated in Figure 15 (for British data see Le Vine and Jones
2012). The portion of households raising young children declined from about half in 1950, to about a
third now and only a quarter by 2030 (Nelson 2006).
Figure 15 Annual Vehicle Miles By Age (National Household Travel Survey)
Annual vehicle travel tends
to peak during the 30 to 60
age period, and then declines
significantly.
12The Future Isn’t What It Used To Be: Changing Trends And Their Implications For Transport Planning
Victoria Transport Policy Institute
Although Baby Boom seniors tend to drive more than seniors of previous generations, they drive much
less than during their peak driving years, when they were employed and raising children, and use public
transit more, as illustrated in Figure 16.
Figure 16 Baby Boomer Annuel Vehicle Trips (McGuckin and Lynott 2012)
As Baby Boomers age they drive less and rely more on public transit.
There is evidence that future generations will drive less at each age level than Baby Boomers (APTA
2013; McDonald 2015; Santos, et al. 2011). Average annual vehicle miles traveled (VMT) was about
20% less in 2008 than in 2001 for under-40 age groups, as illustrated in Figure 17. Blumenberg, et al.
(2012) argue that these travel behavior changes primarily reflect economic factors such as employment
and income, but because travel habits tend to be durable, significant changes are likely to continue
even if that generation becomes more affluent.
Figure 17 Average Annual Mileage by Age (Polzin, Chu and McGuckin 2011)
Annual motor vehicle travel is
significantly lower for people
born between after 1978 than
older cohorts at the same age.
This indicates intergenerational
changes in consumer
preferences and lifestyles.
Although younger people are
likely to increase their vehicle
travel as they earn more and
become parents, they are
unlikely to drive as much as the
Baby Boom generation.
Similar trends are occurring in other developed countries (Le Vine and Jones 2012). Car ownership and
travel declined, and use of other modes has increased, among German and British 20-29 year olds
(Kuhnimhof, Wirtz and Manz). The younger generation appears to place less value on vehicle
ownership and suburban living due a combination of high costs, improved travel options and changing
preferences (Santos, et al. 2011). Sivak and Schoettle (2011) find a positive correlation between
Internet use and drivers’ license rates, while Blumenberg, et al. (2012) find positive relationships
between telecommunications and motor vehicle travel.
13The Future Isn’t What It Used To Be: Changing Trends And Their Implications For Transport Planning
Victoria Transport Policy Institute
Davis, Dutzik and Baxandall (2012) find that between 2001 and 2009, U.S. 16- to 34-year-olds:
Reduced per capita vehicle-miles 23%, from 10,300 to 7,900 annual miles.
Took 16% more walk trips and 24% more bike trips.
Traveled 40% more annual passenger-miles on public transit.
Reduced the share that has a driver’s license from 79% to 74%.
Have different transport and housing preferences.
The portion of young people with driver’s licenses declined significantly in developed countries. In
1983, 87.3% of U.S. 19 year olds had a driver’s licenses, but this declined to 69.5% in 2010, as
illustrated in Figure 18. Although some non-drivers may eventually obtain licenses, their experience
with multi-modal lifestyles will probably influence their future travel habits toward reduced vehicle
travel.
Figure 18 Licensed Drivers Rates By Age Group (Sivak and Schoettle 2012)
Driver’s license rates are much
lower for younger people now
than for past generations.
A travel preference survey indicates that younger people are interested in reduced driving and relying
on alternative modes than older age groups, as illustrated in Figure 19 (Zipcar 2011).
Figure 19 Willingness to Use Alternatives by Age Group (Zipcar 2011)
Consumer preference surveys
indicate that younger people
want to drive less and rely
more on alternative modes
than older people.
14The Future Isn’t What It Used To Be: Changing Trends And Their Implications For Transport Planning
Victoria Transport Policy Institute
Carmakers' next problem: Generation Y: People in their teens and twenties are more interested in
gadgets than cars
Allison Linn, MicroSoft News, 4 Nov 2010 (www.msnbc.msn.com/id/39970363/ns/business-autos).
Meet Natalie McVeigh, the auto industry’s latest headache. At 25 years old, McVeigh lives in Denver and has
two good jobs, as a research analyst and an adjunct professor of philosophy. What she doesn’t have - or want
- is a car. A confluence of events - environmental worries, a preference for gadgets over wheels and the
years-long economic doldrums - is pushing some teens and twentysomethings to opt out of what has
traditionally been considered an American rite of passage: Owning a car.
“There’s kind of almost every force working against the young driver right now,” said Karl Brauer, senior
analyst and editor-at-large at Edmunds.com, an automotive research website.
A confluence of events - environmental worries, a preference for gadgets over wheels and economic
doldrums - is pushing some to opt out of an American rite of passage: Owning a car.
That could be a problem for automakers, which are still reeling from the Great Recession that sorely damaged
their industry. Now, they may find that their youngest generation of potential customers will either purchase
fewer cars, put off buying cars until later in life — or they won’t end up buying cars at all.
“That’s definitely a concern,” said George Peterson, president of AutoPacific, an automotive market research
firm that has been tracking young car buyers for 20 years. “They are not as engaged with cars and trucks as
Gen X or Boomers before them.”
The percentage of new cars sold to 21- to 34-year-olds hit a high of nearly 38% in 1985 but stands at around
27% today, according to CNW research. Over that same period, the percentage of new car buyers who are 55
or older has generally been trending up, according to the vehicle research group. The prognosis isn’t
necessarily encouraging, either. In 2008, 82% of 20- to 24-year-olds had their driver’s license, according to the
Federal Highway Administration. Although that’s gone up a tiny bit in the past few years, it’s down from more
than 87% in 1994. People in their late twenties and early thirties are also slightly less likely to have a driver’s
license than in 1994, and it appears that more people are at least delaying getting their license. Just 31% of
16-year-olds had their license in 2008, down from about 42% in 1994, according to government data.
Brauer said one issue is economic: A combination of high unemployment among young people and economic
troubles for their parents is making it harder for younger people to afford to drive. But there are also other,
longer-term issues at work, he said. For one thing, many young consumers care more about new
technologies, such as the latest phone, than about the latest car. That may be for good reason - thanks to the
Internet and social media, more people can connect with friends, work or even hand in schoolwork without
ever leaving the house, potentially making them less dependent on cars but more dependent on gadgets.
McVeigh didn’t make a conscious plan not to drive. After living overseas as a teenager, she went to college in
a small town and then moved to bigger cities for graduate school and work. At first, a car seemed both
prohibitively expensive and unnecessary, because she could walk or take public transportation. Then, she just
decided she didn’t want one. “I just kind of came to the realization that I didn’t need it,” she said.
McVeigh uses public transport to get to work and likes that she can spend her commute time reading or
grading papers. McVeigh also likes getting the extra exercise when she chooses to walk to work or to the
grocery store, and is happy to be saving money and not polluting the planet.
15The Future Isn’t What It Used To Be: Changing Trends And Their Implications For Transport Planning
Victoria Transport Policy Institute
Income
Motor vehicle ownership and travel tend to increase as household incomes rise from low to moderate
levels, but plateaus at high incomes (Dargay, Gately and Sommer 2007; Luoma, Sivak and Zielinski
2010). Millard-Ball and Schipper (2010) find that per capita vehicle travel tends to plateau at about
$25k annual GDP in most countries, excepting the U.S. which peaks at about $35k, as indicated in
Figure 20. Most wealthy countries are approaching vehicle travel saturation (BITRE 2012).
Figure 20 Vehicle Travel and National Productivity (Millard-Ball and Schipper 2010)
Per capita vehicle travel tends to increase with national productivity, but eventually plateaus.
Although per capita vehicle travel tends to increase with income in Britain, it declined significantly
between 1995 and 2005, as illustrated in Figure 21. This probably reflects, in part, stricter limits on
company car use (Le Vine and Jones 2012).
Figure 21 British Car Mileage By Income Class (Le Vine and Jones 2012)
Although per capita annual
vehicle travel increases
with income, it declined
significantly between 1995
and 2005 for higher
income classes.
Air travel probably continues to increase at high incomes. Wealthier travelers tend to be less sensitive
to price and more sensitive to service quality, which helps explain why public transit ridership is
relatively high in some affluent cities which offer high quality but expensive public transit service (Hass-
Klau and Crampton 2002; Litman 2004).
16The Future Isn’t What It Used To Be: Changing Trends And Their Implications For Transport Planning
Victoria Transport Policy Institute
Geographic Location
Where people live and work significantly affects their travel activity (Figure 22). Residents of more
compact, multi-modal urban communities tend to own fewer motor vehicles, drive less, and rely more
on alternative modes than they would if located in automobile-dependent, suburban communities
(Litman 2008). Cities and states that apply smart growth development policies tend to have
significantly lower per capita VMT than areas with more sprawl development policies (Anbinder 2015).
Residents of multi-modal communities tend typically drive 20-40% less than they would in automobile-
dependent areas (Arrington and Sloop 2010).
Figure 22 Urbanization Impact On Mode Share (Lawton 2001)
100% Car
Transit Public transit and
80%
walking transport
Percent Trips
Walk
60% increase as an area
becomes more
40% urbanized, that is,
20%
more compact and
multi-modal.
0%
least Urban Mixed Most Urban
Urban Index Rating
Demographic and economic trends, including smaller households, rising fuel prices and changing
consumer preferences are increasing demand for more accessible, multi-modal locations (Litman 2009;
NAR 2017). In recent years an increasing portion of population growth has occurred in existing cities,
and many suburbs are becoming more compact and multi-modal (Frey 2012; Newman and Kenworthy
2011; SGA 2012). Market surveys indicate that an growing portion of households prefer smaller-lot,
urban home locations if they provide suitable travel options (good walking, cycling and public transit),
local services (nearby shops, schools and parks) and other amenities (NAR 2017; ULI 2009; Thomas
2009; Myers and Ryu 2008). Real estate market studies predict that by 2030 more than two thirds are
likely to prefer more compact housing types and more urban locations, as illustrated below.
Figure 23 Demand For Housing By Type (Nelson 2006)
180,000
160,000 Housing market analysis
140,000
based on demographic
Units (thousands)
Attached trends and consumer
120,000
Small Lot preference surveys project
100,000
Large Lot that demand for large-lot
80,000 housing will decline and
60,000 demand for small lot and
40,000 attached housing will
20,000
increase during the next
two decades.
0
2007 Supply 2020 Demand 2030 Demand
17The Future Isn’t What It Used To Be: Changing Trends And Their Implications For Transport Planning
Victoria Transport Policy Institute
Vehicle Costs
During most of the Twentieth Century a middle-priced new vehicle generally cost 35% to 50% of
average annual wages. For example, in 1914, a Ford Model T cost $220, about 40% of average annual
wages. In 1953 a Plymouth Cambridge could be purchased for $1,618, about 48% of the $3,387 average
annual household income. In 1967, an average new car sold for $3,212, 40% of $7,933 average income;
in 1977 the average car sold for $5,814, 36% of $16,009 average income; and in 1987 the average new
car sold for $13,657, 46% of $29,744 average income.5
However, new car prices are a poor indicator of overall vehicle affordability because lower-income
households tend to purchase less expensive used vehicles, because many vehicles include costly luxury
features, and because vehicle ownership includes additional expenses such as registration and licensing
fees, repairs, and insurance. For many lower-income motorists, insurance costs are a larger constraint
on vehicle ownership than purchase costs. Ownership trends suggest that vehicles have become more
affordable over time, as indicated by rising vehicle ownership rates among the lowest income quintile
from 1970 through 2000.
Annual vehicle mileage is affected by the financial, time and discomfort costs of driving. Per-mile
vehicle operating costs declined during most of the Twentieth Century, due to cheaper tires, increased
vehicle reliability (and therefore less frequent repairs), increased vehicle fuel efficiency, and declining
real fuel prices. Variable costs decreased relative to fixed vehicle costs, as indicated in Figure 24. This
gives motorists an incentive to increase their mileage to earn a reasonable return on their fixed
investment. Motorists think, “Since I spend so much on payments and insurance, I may as well drive.”
Figure 24 Vehicle Cost Trends (“Cost of Driving,” VTPI 2005)
40%
Portion of Total Vehicle Costs
30%
20%
10%
0%
1950 1960 1970 1980 1990 2000
The variable portion of vehicle costs declined from about 40% in 1950 to 22% in 2000.
Real fuel prices declined for most of the Twentieth Century, excepting spikes during the late 1970s and
early 80s. In 1920 gasoline cost 30¢ a gallon, when wages averaged about 50¢ per hour. Fuel prices are
predicted to increase during the Twenty-First Century as demand grows and production peaks (Ramsey
5
Model T price information from Forbes Greatest Business Stories
(www.wiley.com/products/subject/business/forbes/ford.html). Wage information is from the U.S. Census
Department (www.census.gov/hhes/income/histinc/p53.html). Plymouth prices are from
(www.allpar.com/old/plymouth/plymouth-1953-54.html). Information on average new automobile retail prices
relative to wages, 1967 to 1994 is in MVMA 1995, p. 60. For additional discussion of past transportation costs see
the “Transportation Productivity Trends” section of Litman 2010.
18The Future Isn’t What It Used To Be: Changing Trends And Their Implications For Transport Planning
Victoria Transport Policy Institute
and Hughes 2009). Although substitute fuels are available, none is likely to be as cheap or convenient
as petroleum was during the Twentieth Century.
Figure 25 Per Mile Fuel Costs (VTPI, 2004)
$0.25
2004 Dollars Per Vehicle-Mile
$0.20
$0.15
$0.10
$0.05
$0.00
1960 1965 1970 1975 1980 1985 1990 1995 2000 2005 2010
Years
This graph shows fuel prices per vehicle-mile between 1960 and 2009. Real (inflation adjusted) fuel prices
declined and fuel efficiency increased during much of this period, reducing per-mile costs.
Rising energy prices will probably cause only modest mileage reductions during the foreseeable future.
Taxes and distribution costs represent half or more of the retail price of fuel, so doubling wholesale
petroleum costs only increases retail prices 50%. The long-run price elasticity of vehicle fuel is –0.3 to –
0.7, meaning that a 10% price increase causes consumption to decline by 3% to 7% over the long run,
but about two thirds of this results from shifts to more fuel efficient vehicles and only about a third
from reduced VMT (“Transport Elasticities,” VTPI 2005). The U.S. vehicle fleet is inefficient compared
with its technical potential: vehicles currently average about 20 miles-per-gallon (mpg), while hybrid
vehicles are now available with performance that could satisfy most trip requirements that average
more than 60 mpg. As real fuel prices increase during the next few decades, motorists will probably
trade in their gas guzzlers for fuel efficient vehicles and only reduce their per capita vehicle mileage by
a modest amount.
During the Twentieth Century driving became significantly more convenient, comfortable and safer per
mile of travel due to improved vehicle and road design. Incremental improvements will probably
continue, with quieter operation, more comfort and safety features incorporated in lower-priced
models, but future improvements will probably be modest compared with what occurred in the past.
19The Future Isn’t What It Used To Be: Changing Trends And Their Implications For Transport Planning
Victoria Transport Policy Institute
Travel Speeds
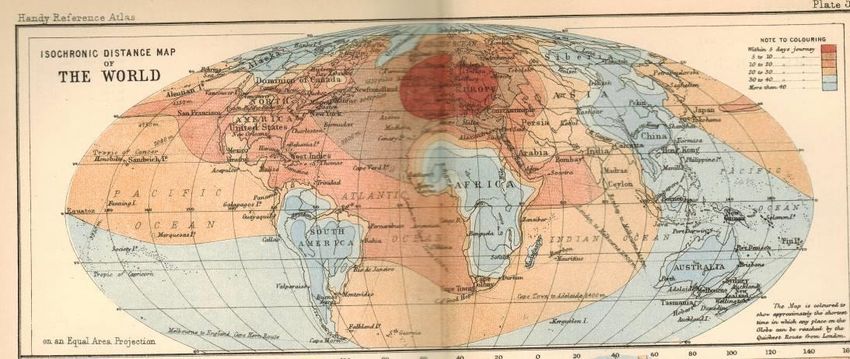
Personal and freight travel speedsaccelerated significantly during the last two centuries (Edwards
2015). Figure 26 illustrates travel time from London to world destinations in travel days (red up to 3,
brown 5-10, blue more than 30). It is accurate if the units are measured in hours rather than days,
indicating travel speed increased approximately 24 times.
Figure 26 Average Travel Speeds (Bartholomew, Atlas of the World, 1888)
This map indicates the number of days required to reach global destinations from London in 1888. It is
approximately accurate for current travel if measured in hours, indicating a 24x speed increase.
Travel speed affect mobility. People tend to devote an average of 1.2 daily hours to travel (Metz 2010;
Puentes 2012), so higher speeds allow more distance within this time budget. During the last century,
vehicle and roadway improvements increased travel speeds. Before 1940 few cars could exceeded 60
miles per hour (mph), and few roads were suitable for such speeds, but since the 1960s virtually all
new motor vehicles can achieve legal speed limits and most new highways were designed with 50-90
mph design speeds.
Figure 27 Estimated Feasible Vehicle Speeds
Maximum feasible (safe and
legal) vehicle speeds increased
during the Twentieth Century,
from walking and cycling speeds
to 65 miles-per-hour on modern
highways. Not all travel occurs at
maximum speeds.
Interstate highway speed limits were reduced to 55 mph in the mid-1970s to conserve fuel, increased
to 65 mph in 1987, and subsequently raised to 75 mph in some rural areas, but overall average travel
speeds have peaked on most roads (Figure 25), and are unlikely to increase significantly in the future
due to traffic congestion, improved speed enforcement, and reduced speed limits on many urban
arterials to create more multi-modal, “complete” streets. Travel surveys indicate that average speeds
increased during the 1970s and 80s, but declined during the 1990s. Average auto commute speeds
peaked in 1995 at 35.2 miles-per-hour (mph), but subsequently declined to 28.9 mph in 2009 (Santos,
et al, 2011, Table 27).
20The Future Isn’t What It Used To Be: Changing Trends And Their Implications For Transport Planning
Victoria Transport Policy Institute
Transportation Options
The quality of transport options available tend to affect travel activity: people who have good walking,
cycling and public transit options tend use these modes more and drive less than they would in more
automobile-dependent communities. In the last few decades, transport professionals, public officials
and the general population have become more familiar with, and accepting of, more multi-modal
transport strategies, as indicated by more multi-modal planning activities at federal, state, regional and
local levels, and by the adoption of concepts such as intermodalism, context sensitive planning,
transport systems management, transportation demand management, and more smart growth land
use planning.
During most of the Twentieth Century transportation investments focused on roadway building,
culminating in the development of the U.S. Interstate Highway System, and similar grade separated
highway systems in other countries. Most transport planning experts, and must of the general public
now realize that this type of planning overlooked and undervalued many important impacts and
planning objectives, resulting in automobile-dependent transportation systems (Boarnet 2013).
The incremental economic benefit of roadway expansion is declining in developed countries (Helling
1997; Goodwin and Persson 2001; Shirley and Winston 2004). During the 1950s and 60s highway
investment economic returns exceeded those of private capital investments, but since the 1980s
returns declined significantly, and these trends are likely to continue since the most cost-effective
roadway investments have already been made (Figure 28).
Figure 28 Annual Highway Rate of Return (Nadri and Mamuneas 1996)
Annual Economic Returns
40%
35%
Highway Capital
on Investments
30%
Private Capital
25%
20%
15%
10%
5%
0%
1950-59 1960-69 1970-79 1980-89
Highway investment economic returns were high during the 1950s and 60s when the U.S. Interstate
was first developed, but have since declined, and are now probably below the returns on private capital,
suggesting that highway expansion is generally a poor investment.
This adds evidence that it is economically efficient to shift funding previously dedicated to roadway
expansion to improving alternative modes.
21The Future Isn’t What It Used To Be: Changing Trends And Their Implications For Transport Planning
Victoria Transport Policy Institute
New Technologies
During the Twentieth Century, technological innovations significantly improved motor vehicle
performance (power, speed, safety, reliability and comfort) which increased vehicle travel. Many
newer transport innovations improve alternative modes6 or allow more efficient pricing. Table 2
categorizes technologies according to their vehicle travel impacts. More new technologies tend to
reduce rather than increase vehicle travel.
Table 2 Travel Impacts Of New Transport Technologies
Increases Motorized Travel Mixed Mobility Impacts Reduces Motorized Travel
Increased fuel efficiency and Electronic vehicle navigation Telework (electronic communication that
cheaper alternative fuels. substitutes for physical travel)
Improved traffic signal
Increased vehicle comfort control Improved road and parking pricing
Automated driving Transit and carshare service
improvements
Improved user information
Improved delivery services
Some new technologies tend to increase vehicle travel, others tend to reduce it.
The mobility effects of specific new technologies are discussed below.
Telework
Telework refers to the use of electronic communication to substitutes for physical travel, including
commuting, business activities and errands such as shopping and banking (“Telework,” VTPI 2005; van
der Waard, Immers and Jorritsma 2012). Many jobs and errands involve information-related goods
suitable for telecommuting, but the actual portion of trips it reduces tends to be modest. Many tasks
require access to special materials and equipment, or face-to-face meetings, even if the primary output
is information that can be transmitted electronically. Not all employees can or want to telework.
Although it tends to reduce peak-period trips, telecommuting does not necessarily reduce total vehicle
mileage unless implemented with other travel reduction strategies, for the following reasons:
Teleworkers often make additional errand trips that would otherwise be made during commutes,
and vehicles not used for commuting may be driven by other household members.
Employees may use teleworking to move further from their worksite, for example, choosing a
home or job in a rural area or another city because they know that they only need to commute two
or three days a week. This may increase urban sprawl.
Improved telecommunications may increase long-distance connections, increasing travel. For
example, people may make new friends through the Internet and travel more to visit them.
Internet shopping appears to be reducing some physical travel. U.S. Households now purchase an
average of three items per month online (Santos, et al. 2011, p. 58). Between 1995 and 2009 shopping
trips declined sharply, from about 790 shopping trips per year to 650 for women, and from about 650
per year for men down to about 525 (McGucken 2011).
6
The Innovative Transportation Technologies (http://faculty.washington.edu/jbs/itrans) identifies many.
22The Future Isn’t What It Used To Be: Changing Trends And Their Implications For Transport Planning
Victoria Transport Policy Institute
Clive Thompson to Texters: Park the Car, Take the Bus,” Wired Magazine,
(www.wired.com/magazine/2010/02/st_clive_thompson_texting)
Texting while driving is a huge problem in the US. We know it’s insanely dangerous. Studies have found
that each time you write or read a text message, you take your eyes off the road for almost five seconds
and increase your risk of collision up to 23 times. The hazard is “off the charts,” says David Strayer, a
University of Utah professor who has studied the practice.
That’s why states are frantically trying to ban it. Nineteen already prohibit texting while driving, and
plenty more will likely join the pack next year. But I’m not convinced the bans will work, particularly
among young people. Why? Because texting is rapidly becoming their default means of connecting with
one another, on a constant, pinging basis. From 2003 to 2008, the number of texts sent monthly by
Americans surged from 2 billion to 110 billion. The urge to connect is primal, and even if you ban texting
in the car, teens will try to get away with it.
So what can we do? We should change our focus to the other side of the equation and curtail not the
texting but the driving. This may sound a bit facetious, but I’m serious. When we worry about driving and
texting, we assume that the most important thing the person is doing is piloting the car. But what if the
most important thing they’re doing is texting? How do we free them up so they can text without needing
to worry about driving?
The answer, of course, is public transit. In many parts of the world where texting has become ingrained
in daily life — like Japan and Europe — public transit is so plentiful that there hasn’t been a major
texting-while-driving crisis. You don’t endanger anyone’s life while quietly tapping out messages during
your train ride to work in Tokyo or Berlin.
Rich Ling, a sociologist who studies the culture of texting, grew up near Denver but now lives in Oslo with
his family. He told me that Denmark has so many buses and streetcars that teenagers often don’t bother
getting their driver’s license until later in life. “My daughter is 18, and she’s only sort of starting to think
about driving,” he says. As a result, texting while driving “isn’t as big a deal.”
In contrast, US cities and suburbs have completely neglected their public transit. With very few
exceptions — New York and Boston are two — buses and trains are either nonexistent or wretchedly
inadequate. People desperately need cars to shop, work, and meet up with friends. Which is precisely
why we’re in a crisis: Two activities that are both central to our lives are colliding.
Of course, you could argue that texting shouldn’t be so culturally central to people and that they should
just cool it in the car. You may well be right, but good luck convincing them, my friend. And anyway,
there are other benefits to making the streets safe for texters: Dramatically increasing public transit
would also decrease our carbon footprint, improve local economies, and curtail drunk driving. (Plus,
we’d waste less time in spiritually draining bumper-to-bumper traffic.)
Texting while driving is, in essence, a wake-up call to America. It illustrates our real, and bigger,
predicament: The country is currently better suited to cars than to communication. This is completely
bonkers.
By all means, we should ban texting while driving, or at least try. But we need to work urgently on
making driving less necessary in the first place. Let’s get our hands off the wheel and onto the keypad —
where they belong.
23You can also read