Towards New Urban Mobility - The case of London and Berlin
←
→
Page content transcription
If your browser does not render page correctly, please read the page content below
Towards New
Urban Mobility
The case of London and Berlin

            3                   3
Research Directors
                                                   Philipp Rode
                                                   Executive Director of LSE Cities and Senior Research
                                                   Fellow, London School of Economics and Political
                                                   Science
London School of Economics and Political Science
Houghton Street                                    Christian Hoffmann, Director of User Research,
London                                             Innovation Centre for Mobility and Societal Change
WC2A 2AE                                           (InnoZ)
UK
                                                   Research Team
Tel: +44 (0)20 7955 7706
lse.cities@lse.ac.uk                               Jens Kandt
www.lsecities.net                                  Lead Researcher, LSE Cities
                                                   Duncan Smith
                                                   Research Officer, LSE Cities
                                                   Andreas Graff
                                                   Researcher, InnoZ
Innovation Centre for Mobility and
Societal Change (InnoZ) GmbH                       Support and Advice
Torgauer Strasse 12 - 15                           Alexandra Gomes, LSE Cities
10829 Berlin                                       Alun Humphrey, National Centre for Social Research
Germany                                            Ben Plowden, Transport for London
                                                   Catarina Heeckt, LSE Cities
Tel: +49 (0)30 238884-0                            Colin Shepherd, Transport for London
info@innoz.de                                      Florian Lennert, InnoZ
www.innoz.de                                       Jillian Anable, University of Aberdeen
                                                   Joe Stordy, Transport for London
Supported by                                       Imke Steinmeyer, Berlin Senate Department for Urban
                                                   Development and the Environment
                                                   Nihan Akyelken, University of Oxford
                                                   Piotr Fryzlewicz, London School of Economics and
                                                   Political Science
                                                   Robert Vollmer, infas Institute for Applied Social
                                                   Sciences
                                                   Robin Hickman, University College London
                                                   Samantha Kennedy, Transport for London
                                                   Thorsten Brand, infas Institute for Applied Social
                                                   Sciences

                                                   Production and Graphic Design
                                                   Peter Griffiths
                                                   Managing Editor, LSE Cities
                                                   Atelier Works
                                                   www.atelierworks.co.uk

                                                   This Report is intended as a basis for discussion. While every effort has been made to
                                                   ensure the accuracy of the material in this report, the authors and/or LSE Cities will
                                                   not be liable for any loss or damage incurred through the use of this report.

                                                   Published by LSE Cities, London School of Economics and Political Science and
                                                   Innovation Centre for Mobility and Societal Change (InnoZ), 2015.

                                                   To cite this report: Rode, Philipp; Christian Hoffmann; Jens Kandt; Duncan Smith; and
                                                   Andreas Graff (2015). Toward New Urban Mobility: The case of London and Berlin.
                                                   Peter Griffiths (ed). LSE Cities/InnoZ. London School of Economics and Political
                                                   Science: London

                                                   Cover: Oxford Circus redesigned with diagonal crossings to improve pedestrian
                                                   mobility across this busy intersection. Photography: Stefan Wermuth/Reuters
Contents

                 Executive Summary                                             2

           1   Introduction                                                    6
           1.1 Contemporary changes in urban travel                            6
           1.2 The case study cities: Berlin and London                        7

           2     Towards New Urban Mobility                                    8
           2.1   Urban change                                                  8
           2.2   New alternatives to the automobile                            8
           2.3   Digital technologies and transport innovations                9
           2.4   The knowledge gap                                             10
           2.5   Travel attitudes and behaviour: a study of mobility styles    11
           2.6   Sample                                                        12

           3   New Urban Mobility in Berlin and London                         13
           3.1 Berlin                                                          13
           3.2 London                                                          19

           4	Mobility attitude groups: a comparative perspective              26
              Traditional car-oriented                                         28
              Pragmatic transit sceptics                                       30
              Green travel oriented                                            32
              Pragmatic transit-oriented                                       34
              Technology focused individualists                                36
              Innovative access-oriented                                       38

           5     Policy implications                                           40

           6	Conclusion                                                       42

                 Appendix – Statistical methods used for sample segmentation   44

                 Bibliography                                                  46

                                                                                    1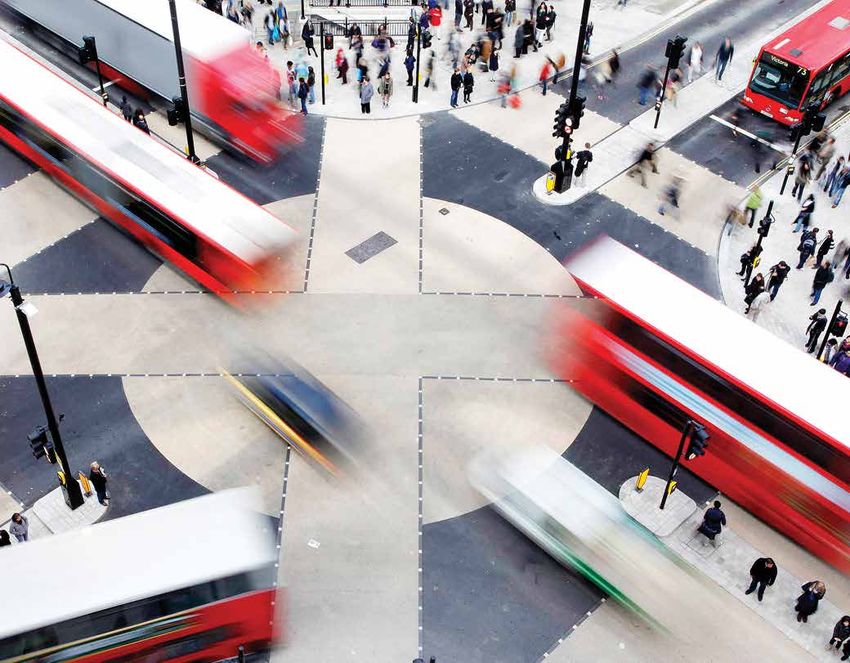
Executive Summary

The report ‘Towards New Urban Mobility: The case of              As transport departments continue to overestimate car
London and Berlin’ provides insight into how urban               traffic growth in countries like the US and the UK, this
transport policy can better leverage new and emerging            report suggests that understanding future mobility trends
mobility choices in cities. It was prepared by LSE Cities at     requires knowledge of what attitudes drive demand for
the London School of Economics and Political Science and         different urban transport modes. The report investigates
the Innovation Centre for Mobility and Societal Change           how attitudes alter opportunities in travel for today’s urban
(InnoZ), and supported by the German Federal Ministry for        transport users and how they open up opportunities for
Transport, Building and Urban Development and Deutsche           transport policies to sustain and encourage alternative
Bank’s Alfred Herrhausen Society.                                forms of travel.
Changes in urban mobility no longer follow traditional
patterns of motorisation and policy makers need to               Study objectives and design
embrace an increasing number of alternatives, including
cycling and walking as main modes of travel, bike and car        The principal objective of this study is to contribute to a
sharing, multimodal travel options and electric vehicles.        stronger understanding of attitudes and behaviour of urban
Smartphone applications now support people’s travel              residents in relation to daily travel, and to use this knowl-
decisions as they move through the city, opening up              edge to assess the potential for behavioural change and
possibilities for smarter mobility services that respond         to identify more targeted policy intervention. It focuses
flexibly to user needs.                                          on mobility attitudes and behaviour in the context of new
                                                                 and emerging urban transport opportunities, such as those
Drawing on the LSE Cities/InnoZ household survey of              related to smartphone travel applications, bike and car
1,000 residents each in Berlin and London, this report           sharing, electric vehicles, and increasing support for urban
investigates how people’s attitudes towards transport            walking and cycling.
modes, technology and travel frames their willingness
to adopt new and more sustainable forms of transport.            Survey questions were aimed at understanding how
The New Urban Mobility report recognises the need to             subjective orientations affect the range of transport
complement infrastructure-oriented transport policy with         decisions made by residents. Capturing particular attitudes
softer, targeted interventions aimed at changing mobility        towards technology provides important insights into how
practices of diverse groups of users. This report argues it is   to best guide behavioural change, while an understanding
the combination of understanding user behaviour and              of residential preferences and geographic context offers
using transport policy to target specific groups of users        perspectives on how attitudes to alternatives are reinforced
that will bring about change towards more sustainable            by housing type and location. The cross-city comparison
travel.                                                          recognises how travel attitudes and behaviour differ from
                                                                 place to place, and how local mobility cultures shape
The key trends promoting new urban mobility are:                 attitudes towards alternative forms of transport. The survey
                                                                 provides a comprehensive overview of current user
Urban change – denser, mixed use cities and a greater            attitudes towards transport from diverse backgrounds. The
interest in urban living have lowered car dependency and         findings are relevant for more effective urban transport
increased the number of residents benefiting from greater        policy aimed at encouraging sustainable travel by involving
accessibility.                                                   a wider section of urban residents.
New alternatives to the automobile – car use and
ownership have levelled off in most cities with advanced         New Urban Mobility in Berlin and London
economies as public transport, pedestrian and cycling
infrastructure is upgraded.                                      Berlin and London share considerable shifts away from
                                                                 traditional patterns of urban mobility. They are dynamic
Digital technologies and transport innovations –                 cities, experiencing extensive socio-economic pressures
the mobile internet and smartphones have opened up new           with high levels of national and international in-migration
opportunities for accessing the city. The digitalisation of      and related processes of inner-city gentrification. Both
consumption is encouraging access-based services over            cities have forward-thinking city governments that have
more traditional ownership models, opening up hybrid             implemented progressive land-use and transport planning
forms of public transport, taxi services and shared car use.     policies through investing heavily in public transport,
                                                                 walking, cycling and the public realm. Furthermore,
                                                                 both cities have thriving tech industries and are using
                                                                 this economic specialisation to foster innovation in
2
electric vehicles, car sharing schemes, smart cards and          Mobility attitude groups
mobile travel apps.
                                                                 Attitudes towards travel, the environment, technology use
The combination of these shared factors means London             and residential preferences were used to identify mobility
and Berlin can be considered to be ‘ahead of the curve’ in       attitude groups. Attitudes and values are key factors in the
terms of changing travel patterns. Both cities are therefore     choice of transport modes since they reflect group specific
interesting research exemplars for identifying new travel        needs, constraints and preferences in travel. This study
behaviours and lifestyle dynamics, and changing patterns         identified six mobility attitude groups – similar in each city –
in relation to car ownership and information and                 which can be characterised as follows:
communications technology (ICT) innovation.
                                                                 Traditional car-oriented (1) – This group rates
Despite having much in common, there are also clear              driving highly. Digital technology is not valued and alterna-
differences between the two cities in urban form, policies       tive modes are rejected as impractical or uncomfortable.
and histories. The contrasts between Berlin and London           Further characteristics:
also extend to mobility and transport patterns and can be        – Medium to higher ages and medium to higher incomes
used to identify in which areas each city has been relatively    – Highest car and home ownership rate
successful or had the greatest problems, and to see where        – Car is main mode with highest annual vehicle kilometres
best practices can be shared between them. For instance,         – Tend to live on the outskirts of cities
Berlin’s long existing culture of cycling has shaped compre-     – Not amenable to new travel modes and transport services
hensive cycling plans, while London has made significant           (electric car, travel apps, smart cards)
advances in areas such as congestion charging.
                                                                 Pragmatic transit sceptics (2) – While this group rates
The survey highlights common patterns and trends across          driving highly, it expresses diverse attitudes towards the
Berlin and London with the following key findings:               use of other modes. Technology is disliked and travel habits
                                                                 tend to reflect a pragmatic orientation emphasising
Travel behaviour and use of alternative modes –                  convenience and individual travel. Further characteristics:
The choice of transport modes in both cities correspond to       – Higher ages and lower incomes
respondents’ preferences, indicating the cities’ capacities      – High car ownership rate
to accommodate a wide range of travel demands. Cycling           – Car and public transport are main modes
in Berlin is more popular than in London, which suggests         – Dispersed throughout the urban area
potential for increased uptake if London’s cycling               – Modestly amenable to using electric cars; not amenable
conditions can be improved.                                        to other services
Car ownership and car sharing – Higher costs,                    Green travel oriented (3) – This group is environmen-
adequate alternatives and environmental concerns are             tally conscious and prefers modes of transport that are
cited as the top reasons for not owning a car. Car sharing       understood to be more sustainable. While this may include
is increasing but its overall future relevance is difficult to   innovative use of alternatives, technology is not widely
predict at this point.                                           appreciated. Further characteristics:
ICT and travel behaviour – Travel applications are used          – Medium to higher ages and lower incomes
almost daily by one in four respondents who own smart-           – Low car ownership rate
phones. The use of ICT may be an extremely effective             – Low car use, higher share of walking
channel in opening up alternative modal choice as smart-         – Located more centrally or close to rail stations
phone penetration increases.                                     – Responsive to social norms in travel choice, but not
                                                                   amenable to electric cars or other travel services
Residential preferences – Residential preferences
among respondents are diverse but reflect current trends         Pragmatic transit-oriented (4) – This group rates
towards urban living. Accessibility and travel opportunities     various aspects of public transport positively, but not
are strongly influenced by residential location, and an          necessarily for environmental reasons. There is some
understanding of residential patterns and preferences            modest dislike of digital technology. Further
appears essential for understanding travel behaviour.            characteristics:
                                                                 – Medium ages and lower to medium incomes
                                                                 – Low car ownership rate
                                                                 – Low car use and highest use of public transport
                                                                 – Centrally located
                                                                 – Modestly amenable to using travel apps
                                                                                                                                3
Technology focused individualists (5) – This group            mobility services may enable them to even better satisfy
values autonomy highly, and enjoy driving, cycling and        their needs and prevent them from switching to cars when
using digital technology to reinforce independence. Further   personal circumstances change (e.g. relocation, children).
characteristics:                                              Information that is readily available in these situations will
– Younger with higher incomes                                 help this group maintain travel that is consistent with their
– Higher car ownership rate                                   environmental awareness.
– Car and public transport main modes, cycling in Berlin
– Distributed across urban area                               Pragmatic transit-oriented (4) – Affirming and further
– Not responsive to social norms, but amenable to using       encouraging public transport use will support the travel
  electric cars and digital travel services                   decisions of this group. In addition, promoting more cycling
                                                              and alternative transport services such as car sharing (when
Innovative access-oriented (6) – This group is well           needed) may have a long-term impact, even if life circum-
aware of transport alternatives and use digital technology    stances change. Care should be taken that public transport
to support innovative travel choices. They have a strong      and cycling remain affordable and convenient to use.
desire to live centrally. Further characteristics:
– Younger with higher incomes                                 Technology focused individualists (5) – Switching from
– Lower car ownership rate                                    driving to low emission mobility – car sharing, electric car,
– Public transport as main mode as well as car and cycling    cycling – should be the policy priority for this group. As this
– Located in central and accessible locations                 group values personal freedom, autonomy and flexibility
– Strongly amenable to new travel modes and services,         in travel, mode switching may be best achieved through
  strong response to social norms                             programmes that allow this group to test alternatives and
                                                              discover smart and creative aspects of travelling while also
                                                              enjoying health and fitness benefits. High smartphone
Policy implications                                           ownership and amenability to digital technology offers a
This report argues that policy interventions sensitive to     promising channel to encourage alternative forms of travel.
group attitudes are more likely to result in behavioural      Innovative access-oriented (6) – Further uptake of
change towards transport alternatives. This includes under-   alternative modes of travel and reducing car ownership
standing which transport alternatives are more acceptable     should be encouraged. As this group is open to experiment
to each group and how best to target communication.           with new transport modes and services, policy should
Traditional car-oriented (1) – The environmental              ensure this group is kept informed about new travel
impact of mobility choices of this group should be            options. The extensive use of mobile technology and
addressed through fiscal policy mechanisms (e.g.              willingness to access digital services suggests this as a
congestion charging, parking restrictions) and mitigated by   channel for communicative policy. Electric cars may be an
encouraging the use of low emission vehicles. As their more   effective alternative if personal circumstances make more
dispersed and suburban residential location makes             sustainable mode choices no longer viable.
physical provision of alternatives more difficult, extra      This study highlights the diverse preferences, needs and
charges or banning high emission vehicles in city centres     constraints that are specific to different mobility attitude
may be necessary. A weaker intervention would be to           groups (see page 40). Blanket transport policy targeting all
provide guidance on eco-driving.                              of these groups in the same way may be less effective
Pragmatic transit sceptics (2) – Policy focusing on this      in achieving behavioural change than a more tailored
group should encourage the reduction of car use. The          approach. Policies to reduce conventional car use in cities
pragmatic orientation suggests allowing users to              will continue to rely on a range of different parallel
temporarily test alternative modes (electric cars, car        strategies: ‘pull-policies’ such as making alternative modes
sharing, public transport) for free may be the most effec-    more attractive, encouraging shared mobility, and support-
tive way to make this group experience low emission travel    ing a shift to electric vehicles as well as ‘push-policies’ such
modes as feasible and convenient. These interventions will    as road pricing, parking fees and other restrictive measures.
likely be successful in combination with fiscal policy        However, a greater consideration of mobility attitude
instruments (e.g. congestion charging).                       groups and where they live can help in identifying a more
                                                              effective mix of policy interventions. This may then support
Green travel oriented (3) – The policy goal for this group    further guiding the shift towards new urban mobility by
is to affirm and further expand the uptake of walking,        moving members of each attitudinal group towards more
cycling and public transport. The promotion of alternative    sustainable transport modes.

4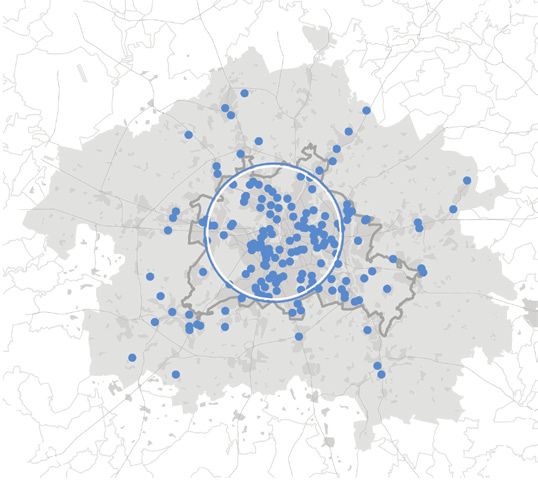
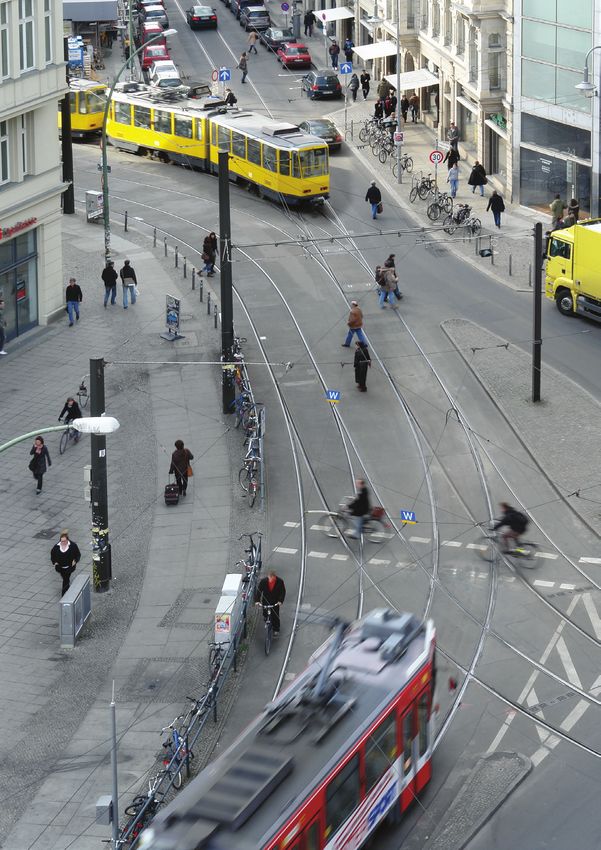
New urban mobility
Sharing scarce road space between
trucks, cars, trams, cyclists and
pedestrians illustrates Berlin’s effort
to more fairly allocate space for
alternative forms of transport.
Photography: Marcus Bredt

                                          5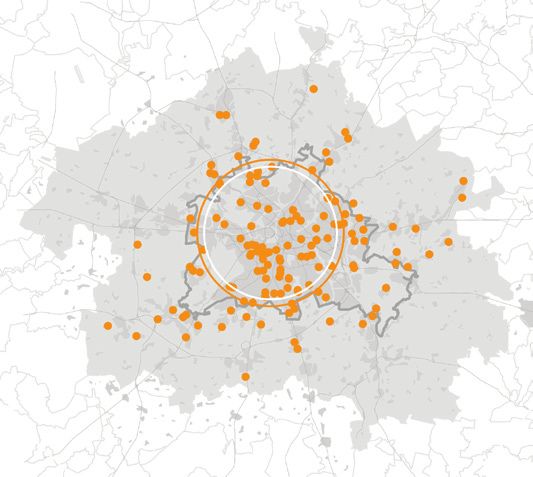
1. Introduction

Urban mobility in most cities of the developed world is          densification and mixed-use, with these policies supporting
changing. And, more importantly, these changes are no            inner-city revival.
longer associated with the continuation of past linear
trends such as the substantial increase in motorisation          Complementing the evolution of urban form, there have
seen in the second half of the 20th century. Instead, cities     also been significant changes in how urban populations
are increasingly witnessing the impact of more disruptive        travel. Renewed investment in public transport has
change, whether as a result of technological innovation,         reversed the decline in passenger levels, with expanding
socio-economic change or new policy interventions. The           urban rail, light-rail and bus networks. New technology is
considerable and unexpected growth in urban cycling; the         transforming the customer experience of public transport
increasing relevance of car and bike sharing; multimodal         through route finding, real-time passenger information and
travel assisted by smartphone travel applications; and the       ticketing accessible through mobile devices. Furthermore,
re-discovery of urban walking are not only the shared            technological changes are enabling new forms of urban
experiences for many cities, they have become a central          travel to emerge through the sharing of transport services
focus of urban transport policy in cities around the world.      and advances in more efficient engine technologies. Finally,
                                                                 a renewed focus on health, wellbeing and quality of life in
The principal objective of this study is to contribute to a      cities means we are rediscovering the benefits of traditional
better understanding of attitudes and behaviours of urban        active travel modes such as walking and cycling.
residents in relation to daily travel, and to use this knowl-
edge to assess the potential for behavioural change and to       This report refers to these varied transportation trends
identify more targeted policy intervention. The evidence         and innovations as “new urban mobility”. Together they
presented in this report is based on an in-depth household       have the potential to transform urban travel and help tackle
survey of 2,000 residents, almost evenly divided between         the most pressing challenges of urban transport planning:
the Berlin and London metropolitan region. It focuses on         reducing greenhouse gas emissions and fossil fuel depend-
mobility attitudes and behaviour in the context of new           ence; improving poor air quality in cities; reducing conges-
and emerging urban transport opportunities, such as those        tion and improving urban public space and quality of life.
related to smartphone travel applications, bike and car          At present, however, there is considerable uncertainty over
sharing, electric vehicles and increasing support for urban      how far-reaching changes to travel and lifestyles in cities
cycling and walking.                                             are likely to be. Are current trends in new urban mobility
                                                                 restricted to particular demographic and social groups in
                                                                 cities? To what extent are urban residents keen to adopt
1.1. Contemporary changes in urban travel                        new travel opportunities, or are car-dependent lifestyles
                                                                 and related attitudes entrenched and resistant to change?
In recent years, and particularly over the past decade,          Are current changes towards more sustainable travel
significant change in relation to urban travel, lifestyles and   patterns limited to inner cities or can these changes also be
the spatial structure of cities in developed countries has       transferred to suburbs and more widely across city-regions?
become apparent. In the 20th century, urban development
was overwhelmingly defined by the rise of the automobile         Answering these questions requires improving our under-
and spatial dispersion. In the UK the total vehicle miles        standing of urban travel patterns and lifestyles, and the
travelled by car increased fivefold between 1960 and 2000,       attitudes and behaviours of different demographic groups
while public transport use fell significantly. As populations    to changes and innovations in travel opportunities. This
left for the suburbs and urban industrial jobs vanished,         research addresses this task by improving the evidence
inner cities experienced long-term decline: in Inner             base of attitudes and behaviours towards new urban
London, for example, the population fell in every decade         mobility trends. An in-depth telephone survey was
from the 1930s to the 1980s. Similar patterns of suburban        conducted with 1,184 respondents in London and 2,400 in
dispersion and increased car use occurred across the cities      four German cities, of which 987 respondents live in Berlin.
of Western Europe and North America.                             The survey investigates the demographics, residential
                                                                 situation, travel behaviour patterns, and attitudes towards
Yet these seemingly unstoppable trends of urban                  current mobility and housing opportunities. Furthermore
dispersion and automobile dependence have been                   the survey focuses on attitudes and behaviours in relation
increasingly disrupted over the last few decades. After          to new urban mobility opportunities, including bike and car
experiencing widespread population loss in the second half       sharing, electric cars, cycling and smartphone travel apps.
of the 20th century, many inner cities have staged a revival,    These more novel aspects of travel behaviour are at the
attracting residents and businesses back to city centres.        forefront of current travel behaviour dynamics, yet are less
Planning policy has changed towards compact city ideals of       well understood and their future potential is uncertain.

6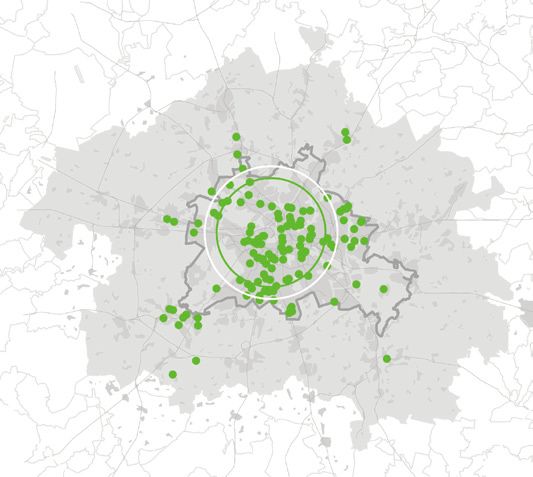
This report presents the results from a comparative             them. For instance Berlin’s long existing culture of cycling
investigation on travel behaviour and attitudes in Berlin       has shaped comprehensive cycling plans, while London
and London in six sections. Following the Introduction,         has made significant advances in areas such as congestion
Section 2 gives an overview of new urban mobility trends        charging.
in Europe, providing the context for the case study cities of
Berlin and London. It also introduces characteristics
of the survey and sample used in this investigation.
Section 3 summarises the most important descriptive
trends in Berlin and London. Section 4 presents the
mobility attitude groups derived from sample segmentation,
describes their characteristics and what they reveal about
prevalent travel behaviours and potential to embrace new
mobility opportunities. Section 5 provides policy
recommendations for each attitudinal group followed
by a conclusion in Section 6.

1.2. The case study cities: Berlin and London

This study focuses on two case study cities and their
metropolitan region, London and Berlin, with the intention
of capturing the contemporary patterns and trends of new
urban mobility. As well as having historical aspects in
common, principally their heritage as European capitals
built around large public transport systems, London and
Berlin share many contemporary trends in relation to new
urban mobility. Both cities are highly dynamic and are
experiencing extensive socio-economic pressures, with
high levels of national and international in-migration and
related processes of inner-city gentrification. Both cities
have forward-thinking city governments that have
implemented a series of progressive land-use and transport
planning policies through investing heavily in public
transport, walking, cycling and the public realm. Further-
more, both cities have thriving tech industries and are using
this economic specialisation to foster innovation in electric
vehicles, car sharing schemes, smart cards and mobile
travel apps.

The combination of these shared factors means that
London and Berlin can be considered to be ahead of the
curve in terms of changing travel patterns and lifestyles.
Both cities are therefore interesting research exemplars for
identifying new travel behaviours and lifestyle dynamics,
and changing patterns in relation to car ownership and ICT
innovation.

Whilst London and Berlin have much in common, there
are also clear differences between the two cities in urban
form, policies and histories. The contrasts between Berlin
and London also extend to mobility and transport patterns
and can be used to identify in which areas each city has
been relatively successful or had the greatest problems,
and to see where best practices can be shared between

                                                                                                                               7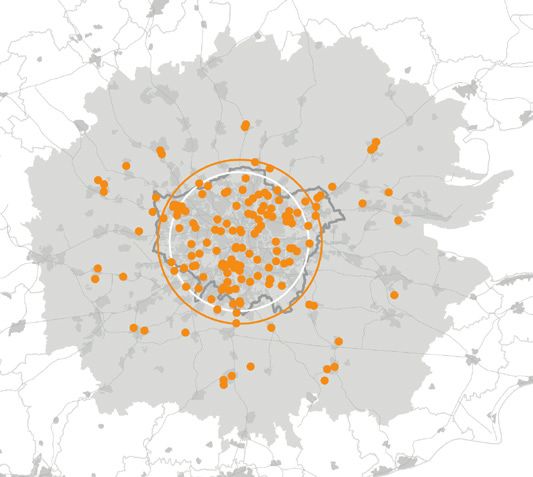
2. Towards New Urban Mobility

    2.1. Urban change                                                were established, promoting increased urban densities and
                                                                     mixed use development integrated with public transport
    In recent decades, many OECD cities have been affected           and pedestrian friendly urban neighbourhoods. These
    by significant socio-economic change. And several of these       policies aimed to reduce environmental impacts through
    changes have also impacted on the physical development of        reduced car use, improve the quality of life in vibrant urban
    the city, leading to a revived interest in re-developing inner   centres at multiple scales, and preserve land through higher
    city areas to accommodate increasing urban populations.          density development and reduced sprawl. As a result of all
    This ‘return to the city’ is informed by the agglomeration       of these factors, measurable change in urban development
    dynamics of post-industrial economic development;                is observable in many cities. For example, since 2000,
    changing demographics and family structures; greater             population growth in London has been concentrated within
    participation of women in the labour market; and related         a 10km radius of the city centre; and between 2004 and
    lifestyle changes. These have all been identified as signifi-    2011, 53 per cent of all newly constructed floor area was
    cantly reducing the attraction to suburban living (Aguiléra,     located within walking distance (0-500 metres) of a rail or
    Wenglenski et al. 2009, Lovejoy, Handy et al. 2010, Rérat        underground station (Burdett and Rode 2012).
    2012). In addition, many of the historical reasons that
    underpinned the decline of inner-city areas - such as
    pollution from factories and coal fires, overpopulation and      2.2. New alternatives to the automobile
    poor sanitation - no longer persist in many contemporary
    cities in the developed world.                                   In parallel with the densification of cities and socio-spatial
                                                                     change, there have also been very significant shifts in car
    The densification and revival of inner cities has also been      use and attitudes towards car ownership (Canzler and Knie
    facilitated by changes in urban planning policy. Since the       2015). After car use in developed world cities and countries
    early 1990s, broader concerns about the effects of urban         increased substantially throughout the 20th century, data
    sprawl and the decline of city centres became aligned with       indicates that around the early 2000s, a plateau in vehicle
    an improved understanding of their negative environmen-          miles travelled was reached. This pattern can be seen in
    tal impacts. As a result, compact city planning concepts         the USA, Canada, Japan, France, Germany and the UK as

   Fig. 2.1. Annual vehicle kilometres against wealth levels: 1970-2008
   Source: Goodwin 2012b

                      15,000

                                                                                                              US cars and household light trucks
                      13,500

                      12,000
Vehicle - km/capita

                      10,500

                                                                                                     Australia
                      9,000

                       7,500
                                                                                      Germany
                                                                                                         UK

                      6,000                                                                France
                                                                                  Italy

                                                                          Spain
                      4,500

                                                                                          Japan
                      3,000

                       1,500
                               10.0   15.0         20.0                   25.0                    30.0                    35.0                40.0
                                               GDP/capita, Thousand Real 2000$ at PPP, 1970 – 2008

   8
shown in Fig. 2.1. Note that the trend is quite different in Transport has also been greatly affected by ICT and with
emerging economies such as China and India, where car the current pace of innovation further change seems
use continues to rise. inevitable. In the last two decades public transport has been
transformed by real-time information, online route find-
There does not appear to be a dominant factor to explain ing and ticketing available through mobile devices. This
why car use is levelling out in advanced economies. Instead has significantly improved the experience of using public
a range of factors are likely to be influencing behaviour. transport for passengers, minimising uncertainty and
Price has been a significant factor, with increases in fuel improving flexibility. ICT has similarly affected the experi-
prices coupled with squeezed incomes, particularly since ence of driving, through satnav devices and online services
the recession which began in 2007. These income pressures such as parking availability platforms. Yet the potential of
have reduced household budgets and many have cut back digital innovation in transport is not only to improve exist-
on driving. Demographic factors may also be significant ing transport services but to create entirely new mobility
as groups with traditionally lower car ownership, such as amenities. The most prominent recent trend has been the
students and the elderly, represent increasing proportions way in which ICT platforms have enabled efficient and
of advanced economy populations. convenient provision of transport services such as car
Car ownership and use also interact with the other factors sharing and new taxi services. These new possibilities are
discussed above, such as increasing urban density and new challenging traditional concepts of ownership and access in
transport technology. Inner-city populations have relation to transport services, and are creating new hybrid
expanded, allowing residents access to a wide range of forms of public-private transport.
services and jobs without the need to own a car. New Beyond digitisation, new technology more directly tailored
transport services, such as car and bike sharing, give urban to urban transport focuses mainly on further electrifica-
residents increased flexibility. The Internet may also be tion of urban mobility systems. Unlike the introduction
contributing to reduced passenger trip rates, as activities of electric railways, trams and elevators at the turn of the
such as shopping, socialising and many work tasks can be last century, this second wave of electrification is focused
conveniently performed online. primarily on allowing electric vehicles to operate with
In addition to the pollution impacts of urban car travel, stored electricity, eliminating the requirement for constant
critics have pointed to the way in which driving isolates grid connection. High energy conversion rates (around 80
urban residents both from each other and the urban per cent for electric vehicles compared to 25-30 per cent
environment (see InnoZ 2014). Important aspects of the for internal combustion engines (ADB 2014, IPCC 2014)),
social role of cities and maintaining urban community elimination of local air pollution and the reduction of noise
can be undermined by excessive car use through the are among the key advantages of further electrifying urban
deterioration of urban interaction and public space. transport. Several European and North American cities
Furthermore, car use has been linked to a range of negative have also combined electric vehicle strategies with car
health impacts. The current promotion of ‘active travel’ or sharing services (Grebert 2014). The largest of this kind is
the ‘slow modes’ of walking and cycling has been a Paris’s Autolib’ programme, with 3,000 vehicles and 1,200
response to these concerns. Reclaiming road space is a key stations (Huré 2012). In addition, the electrification of
aspect of this change and cuts across design interventions public transport is being driven by the increasing adoption
such as the pedestrianisation of city streets, pavement of hybrid and electric bus technologies which have been
widening and cycle lanes. shown to deliver on average a 37 per cent improvement in
fuel economy and energy production through regenerative
braking systems (Chandler and Walkowicz 2006).
2.3. Digital technologies and transport innovations
One particularly important factor that has led to changes in
urban mobility is the role of digital technologies. Digitisa-
tion and ICT have already brought transformative social
and economic change, starting with the development of
the Internet, to social media platforms and subsequently
widespread smartphone and mobile computing device
adoption. These changes have radically affected how we
communicate, socialise, shop and consume media. Entire
industries, particularly relating to traditional media, have
been profoundly challenged by these changes.
9Fig. 2.2 2.4. The knowledge gap
False projections of car traffic growth
Source: Goodwin 2012a (top) and Williams-Derry 2013 (bottom) Given the disruptive force of the innovations outlined
above, which are undoubtedly impacting on urban
Forecasts and actual car traffic growth
transport and mobility, it has become increasingly difficult
(Dept for Transport, UK) to operate with a traditional ‘predict-and-provide’ model
200 of urban transport planning. Most importantly, it should be
noted that there is a considerable risk of overestimating the
175
growth of private vehicle stock and car use, as most growth
projections simply extrapolate historic trends without
adequately incorporating evidence on changing patterns
Index of car traffic (2003=100)
150
of mobility and their relationship to income and economic
growth (Goodwin 2012, Williams-Derry 2013, Green and
125 Naughton 2014). For example, analysis of recent traffic
forecasting in both the UK and US has indicated that
transport planners have consistently overestimated future
100
car traffic growth in the previous two decades, with signifi-
cant distortive effects on transport planning investments
75 (see Fig. 2.2).
1989 GB forecast high 1989 GB forecast low
More useful analysis to assist urban transport planning
50
1997 GB forecast high 1997 GB forecast low will have to better capture the underlying forces that affect
2008 England forecast 2009 England forecast
urban travel. This study will consider one aspect of these
25
2011 England forecast
underlying forces: the broader attitudinal characteristics
GB actual England actual of urban residents with regards to different urban transport
0
modes; and the degree to which these attitudes may be an
1970 1980 1990 2000 2010 2020 2030 2040 important factor in anticipating future changes in travel
behaviour.
Forecasts and actual vehicle traffic growth
(Dept of Transport, US)
4.5
4
Vehicle miles travelled (trillions)
3.5
3
2.5
1999 2004 2008 actual
2002 2006 2010
2
1997 2000 2005 2010 2015
102.5. Travel attitudes and behaviour: Residential preferences – Where we live is a product of
a study of mobility styles complex decisions informed by preferences with regards to
travel, type of housing and the residential environment. Yet
Given the current trends in transport and the knowledge residential selection has rarely been considered in studies
gaps in travel and mobility research, this study focuses on of travel attitudes. In this study we are interested in captur-
a number of aspects to understand the personal motives ing the interactions between residential preferences and
behind travel behaviour. choice of travel.
Subjective orientations – The psychological dimension Geographic context – We geocoded respondents by their
of behavioural change in transport has been poorly under- residential location in order to describe residential context
stood to date, although the field has seen an increase in more formally through urban form descriptors or social
transport studies applying psychological models to explain indicators of neighbourhoods. Contextual constraints and
mobility choices and other aspects of daily travel. The most opportunities play an important part in the way we travel
widely applied model is the theory of planned behaviour and our attitudes towards daily mobility.
(TPB), which was developed in the context of behavioural
psychology, and states that individual behaviour results Cross-city comparison – Travel attitudes and behaviour
from beliefs as to anticipated consequences of an action. differ from place to place and are often shaped by local
These beliefs are further influenced by personal values, mobility cultures. In cities such as Amsterdam, Berlin or
perceived social norms and the perceived feasibility of an Copenhagen, new developments without provision for
action (Ajzen 1991). Questionnaires on attitudes towards extensive cycling infrastructure would be unthinkable
aspects of travel mode and travel experience make it because cycling is perceived as a central element in travel.
possible to measure the social constructs that influence Local transport policy regimes also affect the way residents
travel behaviour (Schäfer et al. 2012, Möser and Bamberg think and go about their daily mobility. Comparison
2008). These constructs can be extended to wider, socio- designs are novel in the study of travel attitudes, but
logical constructs of lifestyles, symbolic values of mobility, have the potential to capture the macro forces influencing
social values and environmental attitudes. By drawing on urban travel.
our representative survey of the residents of Berlin and
London, we build on these constructs and seek to extend
the study of attitudes through four additional aspects:
Technology – Information and communications
technology (ICT) is seldom acknowledged as an aspect
affecting travel, although it increasingly shapes the decision
context of daily mobility. Real-time information on
arrival and departures, electronic journey planners, book-
ing systems transmitted through smartphone applications
and online platforms are widespread services facilitating
instant access to information and inter-modal travel. We
argue that capturing attitudes towards technology may
provide important insights into the most appropriate
channels for intervention to spur behavioural change.
11Fig. 2.3. Sampling regions in Berlin and London
Source: LSE Cities
60 km
40 km
20 km
20 km
Berlin Greater London
40 km
sampling region
local authority districts
built−up land
commuter rail
2.6. Sample
Computer-aided telephone interviews (the so-called CATI
method) were conducted with 987 individuals in Berlin and
1,184 individuals in London who were aged 18 or over. The
sample was drawn from the two administratively defined
cities as well as the wider metropolitan region, which in
London roughly corresponds to the inner commuter belt
(see Fig. 2.3). The samples represent a population of
approximately 12 million people in London and four million
people in Berlin. Sample weights ensured that respondents
were representative for the administrative urban areas and
the surroundings.
Sampling routines differ in Germany and the UK. In
Germany, it is common to use random sampling with
random digital dialling (RDD) as the sampling frame. In
the UK, sampling is typically achieved by quota sampling.
123. New Urban Mobility in Berlin and London
This section discusses current travel patterns and provides Berlin has only recently begun to reverse a trend of little
a general picture of mobility in Berlin and London: how or no growth. In 2013, Berlin registered a population 5.6
they are similar and how they differ. This is followed by a per cent larger than compared to 2000. In the same time
descriptive analysis of the LSE Cities/Innoz survey data, period, the city also witnessed an increase in one-person
which provides an observation of general patterns in travel households (Brandenburg State Office for Building and
attitudes and behaviours in the two cities. The question- Transport 2014; Senate Department for Urban Develop-
naire asked broadly about socio-demographics, car own- ment and the Environment 2013; Senate Chancellery Berlin
ership, residential location and any intentions to use new and State Chancellery Brandenburg 2015). The surrounding
forms of travel, including electric vehicles. local authority areas have grown more rapidly, with popula-
tion growth registered at 14.2 per cent over the same time
period (see Fig. 3.2). This trend towards suburbanisation
3.1. Berlin
has been observable across Germany since reunification,
Context: urban form and public transport trends and to some extent before this in former West Germany.
The metropolitan region of Berlin comprises the city of The impact of suburbanisation on travel and mobility can
Berlin as well as a further 18 local authorities in the city’s be seen in the form of rising commuter travel distances.
vicinity. In 2013, the metropolitan region had a population This emerging travel demand has generated investments in
of 4.4 million people, of which 3.5 million people (80%) both the road network and public transport infrastructure
lived within the city boundaries of Berlin (Statistical Office in the region. One of the most significant, large-scale
Berlin-Brandenburg 2015). Within the city of Berlin, developments to enhance regional connectivity is the so-
residential densities tend to be high in the inner-city called “mushroom concept” (Pilzkonzept), a project set to
districts of Mitte, Friedrichshain and Kreuzberg; these increase rail capacity both within and through Berlin.
areas are also home to major commercial and business The recently constructed Berlin Hauptbahnof (main
activities and constitute the main destination of daily station) is perhaps one of the best known landmark
commuting and shopping trips. project of this scheme. The station created a new
Fig. 3.1. Urban density and recent additions to the rail network in Berlin
Sources: LSE Cities based on LandScan 2010 (left) and Senate Department for Urban Development and the Environment 2013 (right)
Residential and workplace density Rail network
regional and intercity rail underground (U-Bahn)
Red: Berlin administrative territory Grey: Areas outside Berlin regional and intercity rail underground (U-Bahn)
localcommuter
local commuterrail
rail(S-Bahn)
(S-Bahn) tramway
tramway
residents per km2
19r 1f9te erd
19 f9te9 rd
r a1 doe
te a d o
0
90 r0interchange between wider east-west and north-south rail Between 2001 and 2011, annual public transport passengers
services. Further elements of the scheme included a new increased from 1.14 to 1.38 million (+20%). During the same
southern high-capacity rail extension as well as a northern period, the relative share of public transport remained the
tangential connection. The impact on regional connectivity same while cycling and walking increased considerably.
and commuter flows is said to have been considerable: the The decrease in car use was the most significant change.
newly constructed infrastructure allowed increased service During this period, the motorisation rate also decreased.
levels (regional commuter train services more than tripled The share of zero car households was approximately 40
after inauguration in 2006), as well as shortened travel per cent in 2013 and tended to be higher in Berlin’s denser,
times (by up to 35 minutes) and more opportunities for inner-city neighbourhoods where the proportion of one-
regional-local interchange (punkt 3 Magazine 2007). person households is higher too. The introduction of a low
emission zone (Umweltzone) in 2008 restricted inner-city
neighbourhoods to certified low-emission vehicles.
Fig. 3.2. Population development in the metropolitan region of Berlin
Sources: Brandenburg State Office for Building and Transport 2014, Senate Chancellery Berlin
and State Chancellery Brandenburg 2014
population population net change net change (%) average annual
(thousands) 2000 (thousands) 2013 (thousands) growth rate
Berlin 3,331.2 3,517.4 186.2 +5.6 +0.4
Berlin surroundings 805.11 919.8 114.6 +14.2 +1.0
Total region 4,136.3 4,437.2 300.8 +7.3 +0.5
Fig. 3.3. Modal share for all trips and all trips to work in Berlin
Sources: Senate Department for Urban Development and the Environment 2013 and
Technische Universität Dresden 2014
modal share 1998 (%) modal share 2013 (%) net change (%) work trips 2013 (%)
public transport 27 27 -0.1 39
driving 38 30 -8.4 34
walking 25 31 +6.0 14
cycling 10 13 +2.5 14
Fig. 3.4. Development of motorisation in Berlin city
Source: Senate Department for Urban Development and the Environment 2013
2000 2013 net change net change (%)
cars 1,191,994 1,149,520 -42,513 -3.6
motorisation rate (per 1,000) 358 327 -31 -8.7
zero car households n/a 40%
14The ambition was to reduce pollution in Berlin and the Travel behaviour and use of alternative modes
policy may also have contributed to a further concentration
of zero-car households in Berlin’s centre. Moving to the results of the LSE Cities/InnoZ survey
conducted for this study of the metropolitan population,
An important component of Berlin’s transport policy has the most commonly used modes for daily travel among
been planning for cycling and walking. On average, Berlin survey participants are shown in Fig. 3.5. Car travel is the
residents walk or cycle four out of ten trips. Berlin has built most common with 37 per cent, followed by public
over 1,000 km of cycling infrastructure and the number of transport at 30 per cent and a remarkably high cycling rate
cyclists has been rising at a constant rate since the 1970s at 17 per cent. Walking comes in at eight per cent. This
(+40% between 2004 and 2012). The impact of cycling makes an interesting comparison to the follow-up question
investment is reflected in the comparatively higher share of of which travel mode Berlin participants most prefer to use.
cycling for all trips and for work trips within Berlin. Here, preference for car travel increases to 45 per cent and
Fig. 3.5. Selected descriptive statistics of travel behaviour
among Berlin respondents
Method of transport used for most daily travel Preferred method of travel
Weighted n: 918 Weighted n: 913
0 5 10 15 20 25 30 35 40 % 0 10 20 30 40 50 %
car car
public transport
bicycle
on foot
local public
transport
bicycle
local rail
motorcycle or moped
long-distance rail
a combination
varies considerably a combination
other other
Proportion of daily travel only possible by car for Frequency of cycling
car users only Weighted n: 919
Weighted n: 650
0 10 20 30 40 50 % 0 5 10 15 20 25 30 %
daily or
almost all, almost daily
only possible by car
one to three
days per week
more than half
one to three days
per month
less than half
less than monthly
none, it
would be possible
without a car never or
almost never
15cycling also increases to 21 per cent, while public transport Fig. 3.6. Car ownership in Berlin
drops to 22 per cent.
Survey participants who are car users were also asked how Household car ownership among all Berlin respondents
Weighted n: 917
much of their daily travel was only possible by car, or could
have been achieved using other modes. The response 0 10 20 30 40 50 60 %
reveals that half of car users felt that all their daily travel
would have been possible without a car. Only 16 per cent none
answered that almost all their travel was only possible by
car. This indicates that many car users live in locations that
are accessible by alternative modes. It also demonstrates one
awareness among car users of these alternatives. It does,
however, mean that many residents use their car regard-
less of other options, and clearly have a preference for car
two
travel.
High levels of cycling are clearly one of the main success
stories of sustainable transport planning in Berlin. More three or more
than half of survey participants (52%) cycle at least once a
week, and only 29 per cent of participants do not cycle at
all. Clearly cycling use has permeated through a wide range
of demographic groups in the city. One common factor that
Reasons for not owning a car among zero-car households
tends to restrict urban cycling is road safety and the percep- Weighted n: 249 - multiple choice question
tion of danger when cycling. Nearly one in two Berlin
respondents (48%) agreed that cycling is dangerous in 0 10 20 30 40 50 60 %
Berlin. Clearly this remains an issue in Berlin, with three
quarters of participants tending to agree more than no car needed
disagree with this statement.
environment
Car ownership and car sharing
cost
Availability of cars is relatively high in Berlin. Households
that do not own a car make up 27 per cent of households
surveyed and are in the minority (Fig. 3.6); yet they are still health/age
a substantial proportion of respondents. A related ques-
tion revealed that three in four respondents who possess a
other
driver’s licence have a car available to drive at all times.
The survey asked non-car owning households what their
main reasons for choosing not to own a car were. The
most common reasons were ‘Cost’ and ‘No Car Needed’ –
reported by 53 and 47 per cent respectively – indicating that
convenience and budgeting issues seem to be most strongly
influencing behaviour. Environmental reasons were cited
by 22 per cent of participants and health reasons by 18 per
cent.
16Car sharing is an increasingly popular option for those who Fig. 3.7. Smartphone use in Berlin
want car access in cities without having to own a vehicle.
Yet only 3.4 per cent of respondents had at least one car
Smartphone ownership among Berlin respondents
sharing member in the household. This is low, indicating Weighted n: 918
that there is still a long way to go before car sharing makes
a widespread impact on current travel in Berlin. Most of the
respondents who indicated membership, however, joined
after 2011; this may hint at the beginning of an upward no
trend in car sharing uptake albeit on statistically uncertain smartphone
63%
terms.
owns
smartphone
ICT and travel behaviour 37%
ICT is playing an increasingly important role in travel
behaviour, particularly in relation to public transport.
The survey included a number of questions to gauge how
significant aspects of ICT were in travel choices. The extent
of smartphone ownership amongst survey participants is
shown in Fig. 3.7, with 37 per cent of participants owning
a smartphone with internet access. This is relatively low,
and may reflect the exclusion of people younger than 18 Frequency of travel app use among owners of
from the survey. Among smartphone owners, travel apps mobile devices
are used frequently. Daily use was recorded by 28 per cent Weighted n: 421
of participants. A further 22 per cent used travel apps one to 0 5 10 15 20 25 30 %
three days per week. daily or
almost daily
one to three
days per week
one to three
days per month
less than monthly
never or
almost never
17Residential preferences of respondents. Although higher density housing is the
most common form in Berlin, responses to ideal residen-
Accessibility and travel opportunities are strongly tial location are more evenly divided between urban and
influenced by residential location, and so understanding more suburban locations. Prevalent high density housing in
residential patterns and preferences are a vital part of the sample does not translate into perceived strong public
understanding travel behaviour. This questionnaire covered transport accessibility. While one in two respondents (53%)
housing types, residential preferences, public transport are very satisfied with their current residence, the same
accessibility and housing satisfaction. degree of satisfaction with current travel opportunities is
lower at 30 per cent (Fig. 3.8).
The housing type recorded by survey participants is shown
in Fig. 3.8. High density forms of housing are prominent
among Berlin respondents, with large apartment build-
ings being the most common housing type at 38 per cent.
Detached or semi-detached housing comprises 24 per cent
Fig. 3.8. Selected descriptive statistics in relation to respondents’ place of residence in Berlin
Type of accommodation Stated preferred residential location
Weighted n: 919 Weighted n: 919
0 5 10 15 20 25 30 35 40 % 0 5 10 15 20 25 30 %
detached or semi house in the
countryside
terraced house house on the
city outskirts
small apartment
building within the city
in a residential area
large apartment
building
city centre
apartment
high rise building
other
other
Walk access time to public transport Satisfaction with transport service at their residence
Weighted n: 919 Weighted n: 919
0 10 20 30 40 50 % 0 5 10 15 20 25 30 35 %
very satisfied
less than 5 mins
2
5 to 10 mins
3
10-20 mins
4
20-30 mins
5
30 mins or more not at all satisfied
183.2. London compared to a 12 per cent increase in Outer London, and a
marginally higher absolute population rise in Inner
Context: urban form and public transport trends London. This is consistent with the inner-city densification
patterns discussed in Section 2.1. Rapid population growth
Drawing on data from the 2001 and 2011 censuses, the has further widened the differences in scale between
overall story of change in London is one of significant London and other UK city regions.
growth, densification and reinvestment in public transport
infrastructure. Between 2001 and 2011 Greater London The substantial population growth in London is linked to
grew at a rapid rate, gaining one million new residents in changes in urban form, with inner-city densification and
that period leading to a total population of 8.17 million. In high demand for new housing. Changes in population have
early 2015, London’s population surpassed its historic 1939 been most dramatic in Inner East London, where major
peak of 8.6 million. Fig. 3.9 also highlights that London’s regeneration programmes at Docklands and the Olympic
population growth was concentrated in the inner-city, Park have been located. Inner East London boroughs have
with a 17 per cent population increase in Inner London experienced very high population increases, including the
Fig. 3.9. Inner and Outer London population development
Source: NOMIS 2014
population population net change net change (%) average annual
(thousands) 2001 (thousands) 2011 (thousands) growth rate
Inner London 2,980.5 3,486.5 +505.9 +17.0 +1.6
Outer London 4,191.6 4,687.5 +495.9 +11.8 +1.1
Greater London total 7,172.0 8,173.9 +1,001.9 +14.0 +1.3
Fig. 3.10. Urban density and recent additions to the rail network in London
Sources: LSE Cities based on LandScan 2010 (left) and Greater London Authority 2011, Open Street Map 2014 (right)
Residential and workplace density Rail network
0 5 10 km
Red: Greater London administrative territory Grey: Areas outside London
local
local and
and intercity
intercity railrail London
London Underground
Underground
Crossrail
Crossrail (in constr.)
(under construction) Docklands
Docklands LightLight Railway
Railway
residents per km2 London Overground London Tramlink
London Overground London TramlinkYou can also read