URBAN WATER SCARCITY GUIDANCE NOTE - PREVENTING DAY ZERO - Silvia Gaya
←
→
Page content transcription
If your browser does not render page correctly, please read the page content below
For further information, please contact:

Silvia Gaya
sgaya@unicef.org
Fiona Ward
fward@unicef.org
Jorge Alvarez-Sala
jalvarezsala@unicef.org
Bisi Agberemi
bagberemi@unicef.org

                                           URBAN WATER SCARCITY
                                              GUIDANCE NOTE
                                            PREVENTING DAY ZERO
URBAN WATER SCARCITY
© UNICEF/UN0314272/Madagascar

                                            GUIDANCE NOTE
                                            PREVENTING DAY ZERO

Published by
UNICEF
www.unicef.org

© United Nations Children’s Fund (UNICEF)
March 2021
2 URBAN WATER SCARCITY GUIDANCE NOTE: PREVENTING DAY ZERO BACKGROUND 3
ACRONYMS                                                            CONTENTS
C4D		          UNICEF’s ‘Communication for Development’ approach
CRWSP		        Climate-resilient water safety planning              SUMMARY                                                                6
DPR 		         Direct potable reuse
IDP		          Internally displaced people
JMP 		         Joint Monitoring Programme                           BACKGROUND                                                             9
L/capita/day   Litres per capita per day
                                                                    THE TRENDS IMPACTING ON URBAN WATER SCARCITY
ML		           Megalitre (1 million litres, or 1,000 m3 of water)
MLD 		         Megalitres (million litres) per day                  URBAN WATER SCARCITY – THE SAME CHALLENGE, DIFFERENT CITY RESPONSES
PBC		          Performance-based contracts
PPP 		         Public-private partnerships
NRW 		         Non-revenue water                                    INTRODUCTION                                                          19
SMQ		          Strategic Monitoring Questions (SMQs)
WASH 		        Water, sanitation and hygiene
WCWDM          Water conservation and water demand management
                                                                    1. THE CAPE TOWN ‘DAY ZERO’ CRISIS                                    25

                                                                    2. EXPERIENCES FROM OTHER WATER-SCARCE CITIES                         37

                                                                    3. WHAT CAN UNICEF DO? SUGGESTED                                      45
                                                                       INTERVENTIONS THROUGH WASH PROGRAMMES

                                                                    FURTHER RESOURCES                                                     58

                                                                    REFERENCES                                                            59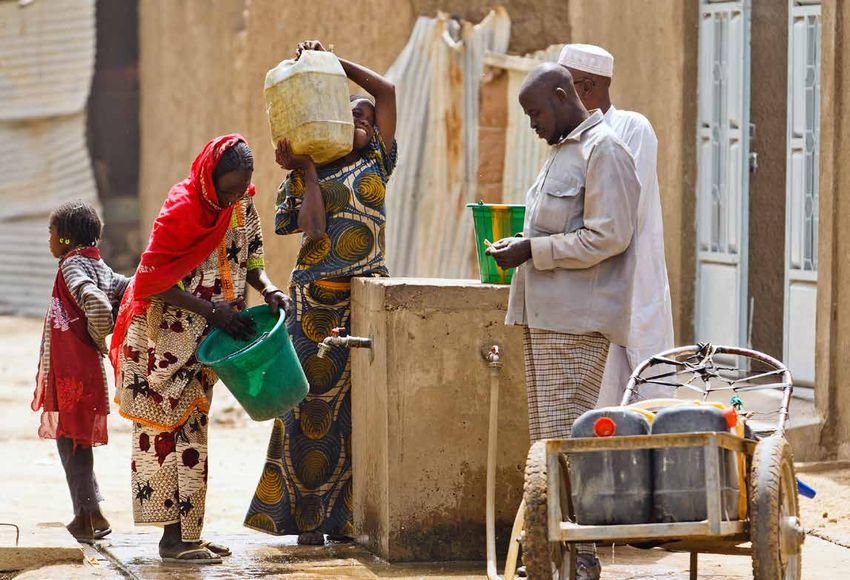
SUMMARY
                                                                                                    Note is accompanied by the Water                on the most vulnerable children and their
                                                                                                    Scarcity Guidance Note: Programmatic            families.
                                                                                                    Approaches, which contains broader
                                                                                                    guidance on WASH programming and                In this context, UNICEF has many roles to
    Water shortages are a major risk in urban    and future available safe water against            water scarcity.                                 play. They include advocacy on the value
    areas – including secondary towns and        projected water demand. The Guidance                                                               of water, and the impacts of water scarcity
    cities – around the world. This Guidance     Note also explores the impact of water             Building on its long history of successful      on the most vulnerable children. They also
    Note was created in response to that         scarcity on the affordability, sustainability      rural WASH interventions, UNICEF is             include promoting and supporting water-
    risk and describes the implications on       and quality of urban WASH services. Water          increasingly supporting marginalised urban      and energy-efficient approaches, behaviour
    water, sanitation and hygiene (WASH)         scarcity in a variety of different urban           populations towards the achievement of          change initiatives, and providing wider
    programming for UNICEF staff and partners,   contexts is illustrated in this note, with         the Sustainable Development Goals.1 The         support to the enabling environment. This
    with suggested programmatic interventions.   special attention given to Cape Town’s 2018        imperative for engaging on urban WASH           Guidance Note summarises three types of
    This Guidance Note highlights the dynamic    water crisis, including identifying what the       is rapidly strengthening; urban water           actions grounded in these various roles,      1 For example, see UNICEF’s
    threat of urban water scarcity and the       most effective initiatives were in practice        shortages are increasing in both frequency      which can take place at different times.        Strategy for WASH 2016-2030,
                                                                                                                                                                                                    available here, and its Global
    importance of assessing the resilience of    to reduce water demand and conserve                and severity, often due to rapid urbanisation   These are preparedness actions, immediate       Framework for Urban WASH,
    urban WASH services by considering current   available water resources. This Guidance           – and these have a disproportionate impact      actions and long-term actions.                  published in 2019, available here.

                                                                                                                                                                                                  © UNICEF/UN0119005/Nigeria

6                                         URBAN WATER SCARCITY GUIDANCE NOTE: PREVENTING DAY ZERO   BACKGROUND                                                                                                                     7
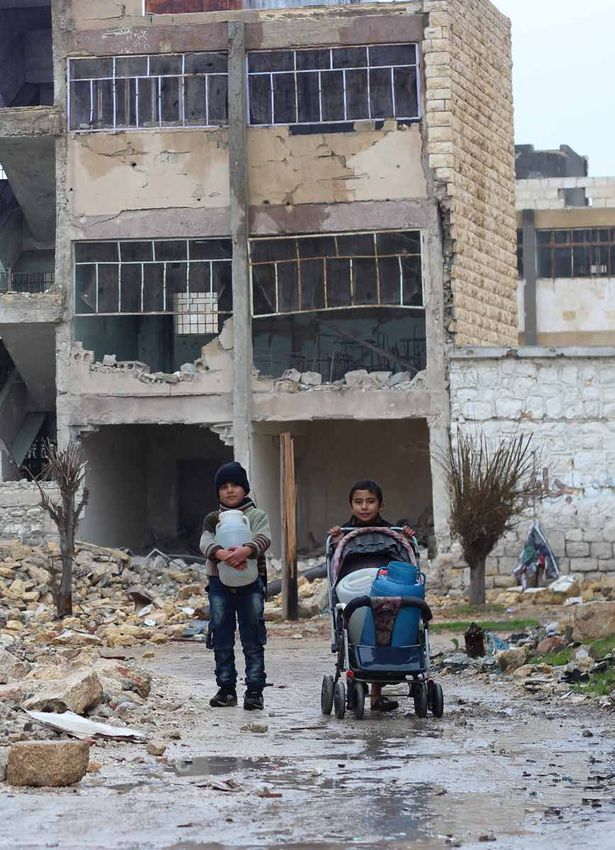
© UNICEF/UN046894/Syria
                                                                                        BACKGROUND

8   URBAN WATER SCARCITY GUIDANCE NOTE: PREVENTING DAY ZERO                             BACKGROUND   9
Urban areas2 around the world are facing extreme water shortages,                      Physical scarcity of water is not the only     less. Such urban water shortages have a
                                                                                                                              factor creating urban water shortages. Poor    knock-on effect on sanitation and hygiene;
                                       with one in four cities described as being ‘water stressed’.3 Cape
                                                                                                                              urban water governance and associated          sufficient and predictable water volumes
                                       Town’s ‘Day Zero’, or the day the city was predicted to run out                        limitations on service delivery are also key   are needed for the effective operation of
                                       of water, alerted the world to the stark threat posed by urban                         factors. Increasingly, urban services are      wastewater systems and to ensure basic
2 This Guidance Note includes          water scarcity. In the future, urban water shortages – seasonal,                       becoming more unreliable, providing water      hygiene practices, including handwashing.
  secondary and tertiary cities                                                                                               for only a few hours per day, week or even
  under the broad framing of ‘urban    intermittent or prolonged – are predicted to increasingly become
  areas’.
                                       the norm.4 In fact, the reality is that in many of the urban areas
3 McDonald, R., et al. (2014) –
  according to a survey of 500         where UNICEF works – from Karachi to Maputo to La Paz – water
  cities.
                                       shortages are already happening. These shortages may not
4 McDonald, R., et al. (2011) states
  that seasonable water shortages
                                       make global headlines, but they all affect children and youth,
  are expected to affect 1.9 billion   impacting the services they need to survive and thrive, and their
  people in 2050 from close to 500
  million people in 2000.              future opportunities.                                                                      SUMMARY
                                                                                                                                  OF KEY TERMS
                                                                                                                                  Water scarcity is defined as the lack of available water resources
                                                                                                                                  to meet the demands of a specific population. Water scarcity
                                                                                                                                  can be experienced by a community, region or country and may
                                                                                                                                  be temporary (for example over several months of the year),
                                                                                                                                  or increase and decrease over time. Water scarcity can either
                                                                                                                                  be physical or economic. Physical water scarcity occurs where
                                                                                                                                  water resources can no longer meet the needs of the population.
                                                                                                                                  Such scarcity may be related to the mismanagement or poor
                                                                                                                                  governance of water services and/or limited recharge of surface
                                                                                                                                  or groundwater resources. Economic water scarcity may occur
                                                                                                                                  in countries with adequate water reserves, but where access
                                                                                                                                  remains poor. It can be due to poor governance, limited human
                                                                                                                                  capacity and limited investments. Whatever the cause, water
                                                                                                                                  scarcity is a major barrier towards the achievement of all
                                                                                                                                  aspects of SDG 6.

                                                                                                                                  Water stress is an outcome of water scarcity amongst other
                                                                                                                                  variables. Water stress occurs where water scarcity leads to
                                                                                                                                  poor accessibility and poor water quality. Water stress may
                                                                                                                                  manifest as conflict over water resources, over-extraction of
                                                                                                                                  aquifers, or poor health and disease.5

                                                                                                                                  Water shortages can result from a range of causes, and can be
                                                                                                                                  experienced as highly variable or intermittent water supply (i.e.
                                                                                                                                  water that is supplied less than 24 hours a day). Water shortages
                                                                                                                                  can occur frequently (e.g. every day) or for a prolonged period
                                                                                                                                  of time.

                                                                                                                                  Water scarce cities are cities that are facing challenges to supply      5 The Institute of Civil Engineers,
                                                                                                                                  adequate water to inhabitants.                                             Oxfam and WaterAid (2011).

                                                                                                                                                                             © UNICEF/UNI121921/Chad

10                                                                  URBAN WATER SCARCITY GUIDANCE NOTE: PREVENTING DAY ZERO   BACKGROUND                                                                                                         11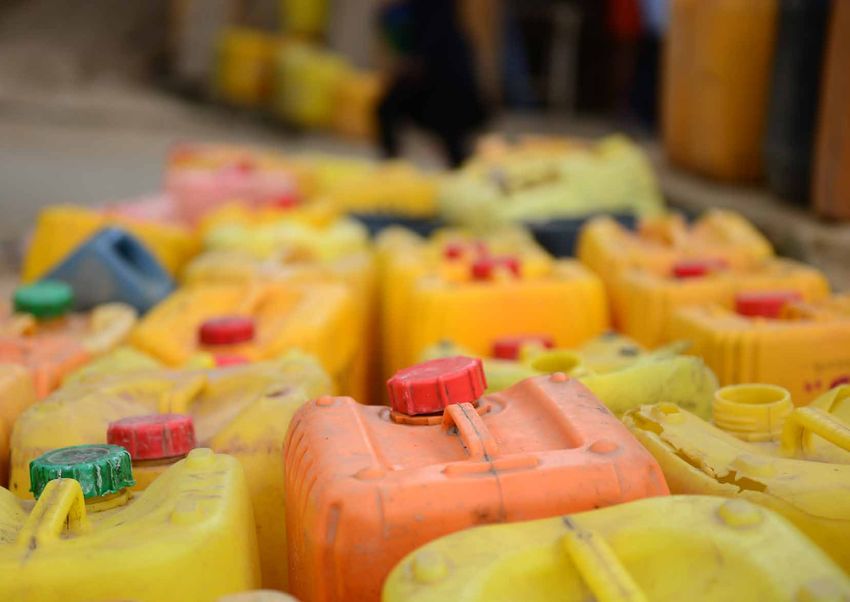
FIGURE 1: Proportion of global population using drinking water sources meeting SDG criteria for safely managed services FIGURE 2: Inequalities in the proportion of population with at least basic water services, between urban and rural areas
– rural and urban, 2015 (from Progress on Drinking Water, Sanitation and Hygiene. WHO/UNICEF, 2017) and richest and poorest wealth quintiles, 2017 (%) (from Progress on Household Drinking Water, Sanitation and Hygiene
2000-2017: Special Focus on Inequalities. WHO/UNICEF, 2019)
In many countries, Urban/Rural Wealth quintile
disparities in basic drinking Rural Urban Poorest quintile Richest quintile
water services by residence Democratic Republic of the Congo
Angola
and wealth persist Somalia
Chad
Ethiopia
Burkina Faso
Madagascar
FIGURE 28 Inequalities in the Cameroon
Mozambique
proportion of population Uganda
Zambia
with at least basic water United Republic of Tanzania
Haiti
services, between urban Niger
Congo
and rural areas and Togo
richest and poorest Guinea
Kenya
wealth quintiles, 2017 (%) Zimbabwe
Mauritania
Sierra Leone
Rwanda
Sudan
Guinea-Bissau
Yemen
Gabon
Nigeria
Mongolia
Burundi
The scale of the challenge, and in particular, The focus of UNICEF’s urban WASH Afghanistan
Côte d'Ivoire
the exposure of the most vulnerable programming is to ensure equitable Benin
Nicaragua
children and their families to water scarcity, access to sustainable, affordable and safe Lesotho
Eswatini
Liberia
requires new approaches and a sharpened WASH services for the most vulnerable Gambia
Malawi
focus. Even in areas not affected by water households. In times of water crises, Ghana
Mali
scarcity, the poorest households often have a common solution is the use of water Namibia
Senegal
the lowest levels of service. This is due tankers. While tankering does provide a Cambodia
Peru
to a variety of reasons, including the land short-term emergency option, it is not a Lao People's Democratic Republic
Tajikistan
tenure status of their home, as well as their sustainable solution for the most vulnerable. Comoros
Sao Tome and Principe
limited ability to pay for, and maintain, water Drawbacks of tankering include the amount Bolivia (Plurinational State of)
South Africa
© UNICEF/UNI325732/Kenya network connections. of time required to collect the water, the Kyrgyzstan
Indonesia
Republic of Moldova
Jamaica
Colombia
Serbia
Tunisia
Nepal
Honduras
Albania
Pakistan
Philippines
Dominican Republic
Guatemala
India
Iraq
Kazakhstan
Viet Nam
Guyana
Uruguay
West Bank and Gaza Strip
Georgia
Mexico
North Macedonia
Bangladesh
Belize
Bosnia and Herzegovina
Turkmenistan
Jordan
Saint Lucia
Belarus
Egypt
Paraguay
Montenegro
Ukraine
Turkey
Armenia
Thailand
0 20 40 60 80 100 0 20 40 60 80 100
12 URBAN WATER SCARCITY GUIDANCE NOTE: PREVENTING DAY ZERO BACKGROUND 13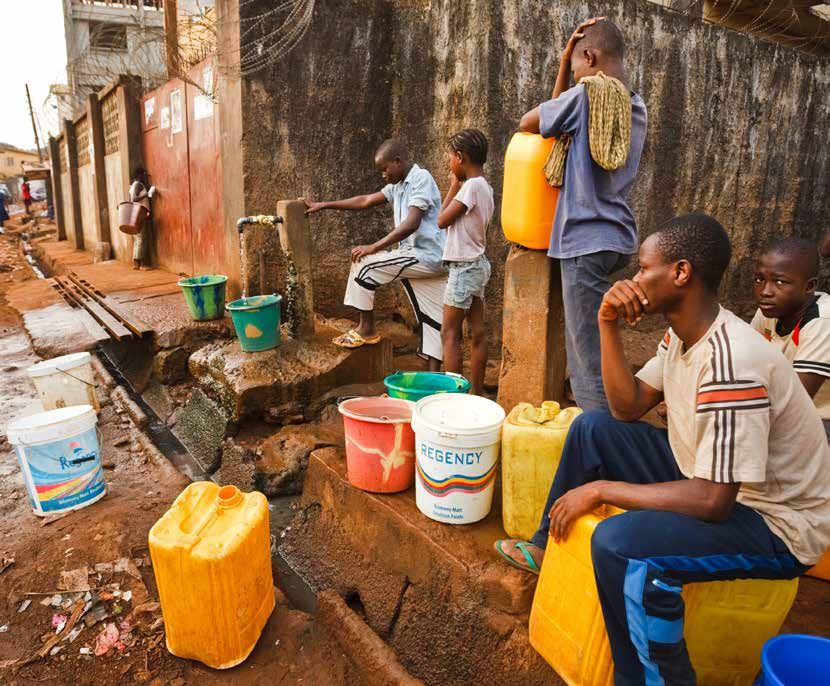
limitations in volume and quality, the higher      The reasons for unimproved and unreliable         of infectious diseases. The current JMP           unable to maintain a social distance while
                                   cost, and the challenges faced when trying        water services in urban areas are numerous,        data estimates that only 75 per cent of           queueing and filling – a particular challenge
                                   to phase tankering out, in order to move          complex and dynamic. What is certain               the world’s population (5.7 billion people)       in crowded urban contexts. An effective
                                   to a more sustainable solution. A recent          though, is that urban water scarcity is            use an improved drinking water source8            COVID-19 response for the long-term
                                   report6 indicated that households which           compounding already challenging situations         located on premises – indicating that             will fundamentally rely on improving such
                                   have to purchase water from water tankers         and threatening the progress made in               a staggering 1.9 billion people do not            access for urban populations – including
                                   to supplement the insufficient amounts            recent years to improve WASH services              have such access. The risk of COVID-19            through the optimum and sustainable use
                                   delivered through their piped system can          for households, communities, schools and           transmission increases when people have           of water (and energy) resources, and the
                                   pay up to 52 times more than the cost of          healthcare facilities. Water scarcity impedes      to leave the relative safety of their home to     efficient operation of utilities and systems.
                                   piped water. In addition, the same report         progress up the service ladder in terms of         collect water, especially as they are often                                                       8 Ibid.
                                   indicated that out of 15 cities analysed,         water, sanitation and hygiene, and threatens
                                   12     received     water     ‘intermittently’.   the progress made towards the SDG targets
                                   Clearly, while tankering can help provide         for 6.1 and 6.2. To ensure the continued
                                   emergency water supplies to communities           progression towards SDG 6.1 and 6.2, and
                                                                                                                                          TRENDS IMPACTING ON URBAN WATER SCARCITY
                                   in times of water scarcity crises, it cannot      the sustaining of these, progress towards
                                   be a long-term solution for urban WASH            the other SDG6 targets is also required.           Urban water shortages can be the result           use, and increasing competition for water
6 Mitlin, D., et al. (2019).
                                   programming.                                                                                         of major intersecting trends, including           between different sectors. A changing
7 Progress on household drinking                                                     The COVID-19 crisis has reminded the               population        growth,        unsustainable    climate with increasing temperatures and
  water, sanitation and hygiene
  2000-2017. Special focus on      In 2017, 151 million people were using            world that access to reliable WASH facilities      water management, poor governance,                unpredictable precipitation patterns adds
  inequalities. UNICEF/WHO, 2019   unimproved water sources in urban areas.7         and services are vital to stem transmission        deteriorating infrastructure, inefficient water   significantly to these trends, contributing

© UNICEF/UN0314269/Madagascar

14                                                                            URBAN WATER SCARCITY GUIDANCE NOTE: PREVENTING DAY ZERO   BACKGROUND                                                                                                  15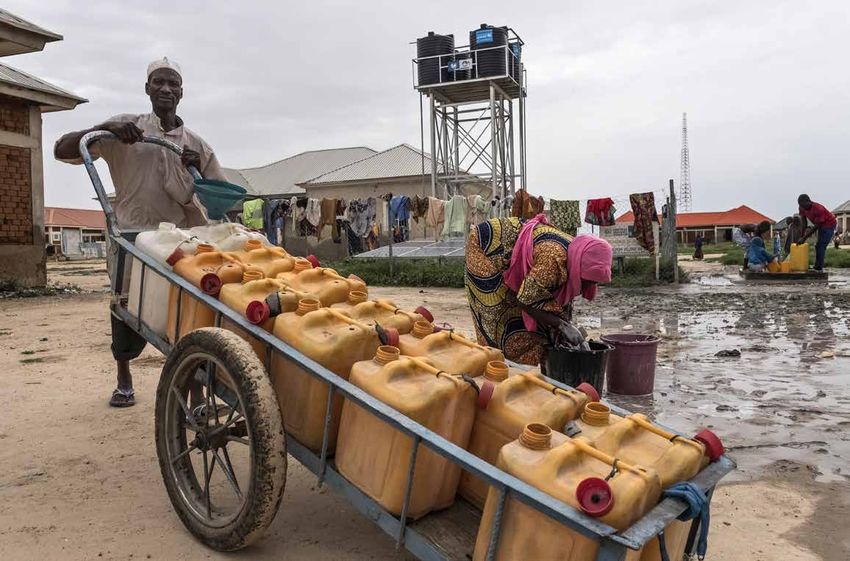
change and the needs of the most and sanitation services in urban areas,
vulnerable, developing service regulations opportunities can be identified and positive
and transparency, and creating a culture change can be achieved. Increased water
of continuous monitoring, data collection, and energy efficiency, replacing carbon-
analysis and planning. dependent systems with renewable energy,
developing longer-term water conservation
Current global trends point to an alarming strategies, and positive behaviour change
outlook for urban water resources. must all be used to help build the resilience
However, by acknowledging these trends of the world’s urban water resources in
and assessing the resilience of water what will be challenging years ahead.
WHAT IS
WATER DEMAND
MANAGEMENT?
© UNICEF/UN0314269/Madagascar to more frequent and severe drought better understand that previous patterns
Water demand management is the adoption of a strategy, policy
periods, and increased water demand. of water recharge cannot be relied upon
or programme that promotes a more efficient use of water,
Climate change is also contributing to the in the future, and that storage facility
either within the water supply system or by the end-user.
deterioration of urban water quality; more capacities are increasingly insufficient as
Typical water demand management activities may include:
pollutants are flushed into water systems precipitation patterns change. One of the
customer/water user efficiency behaviour change campaigns;
during storm events, and reduced summer key lessons from the Cape Town water
reducing physical losses, including leakage in networks;
precipitation means more concentrated crisis (explored in Section 2 below) was that
reducing illegal connections; improving tariff modalities (while
and lower summer flows.9 Increasing the assumption that there would be time to
balancing equity with a sense of resource valuation); water
urbanisation, and the associated increase adapt to the impacts of climate change was
reuse; and implementing water use restrictions. Water demand
in paved surfaces, results in reduced levels dangerously unfounded; in reality, the crisis
management approaches are more effective when targeted
of recharge and increased runoff. For the unfolded more suddenly and severely than
at specific populations and sectors that use large quantities of
most vulnerable urban residents, who are expected.12
water that can be reduced. Demand management approaches
often living in informal settlements, water
are likely to be less effective when targeted at marginalised
shortages are accentuated by a widespread Building resilient and sustainable urban
populations with already limited access to water, sanitation and
lack of access to piped water services.10 water services which can cope with current
hygiene services.
Water scarcity in urban areas is often even and future climate change, water scarcity
more pronounced in fragile and conflict- and increased demand, is a critical element
affected situations, due to infrastructure of any strategy for addressing urban water
damage and the increased difficulties to scarcity. The sustainability of services
maintain functional services. Fragility and relates not just to the infrastructure, but
conflict also increase urban migration – also to the mode of delivery and operation URBAN WATER SCARCITY - THE SAME
swelling the numbers already moving to of the systems, as well as the enabling CHALLENGE, DIFFERENT CITY RESPONSES
urban settings to escape the impact of environment for the sector and other, wider
9 Watts & Anderson (2016) water scarcity on water-dependent rural considerations such as tariff structures. This
livelihoods adding additional pressure to will require collaboration and coordination Arguably, some of the most water- growing cities which are limited in terms of
10 Mitlin, D., et al. (2019). Recent
research in 15 major cities over-burdened systems. with stakeholders across a range of scarce cities are the most successful in water availability, some of the cities have
shows that almost half of urban sectors in order to address water scarcity meeting water needs,13 especially where demonstrated effective solutions to adapt
residents lacked access to piped The World Bank projects that in the next successfully. Sustainable, resilient services they have the financial resources and to water stress. Singapore is typically hailed
utility water. Access is lowest in
Sub-Saharan Africa, where only three decades, demand for water in cities depend not just on physical systems and technical capacity to develop solutions. as an example of a city that is physically
22% of households received piped will increase by 50 to 70 per cent.11 The their reliability, but on broader objectives. Research has identified Tokyo as the water scarce, but has overcome its water
water
depletion of surface and groundwater This means, for example, initiating policy most water stressed city globally,14 scarcity through implementing a set of
11 World Bank (2018) resources have led water service providers changes, strengthening WASH strategies followed by New Delhi, Mexico City and highly effective policies and initiatives (see 13 World Bank, 2018b.
(typically referred to as ‘water utilities’) to so they recognise the impact of climate Shanghai. While all of these are fast- Section 2 below for more details). 14 McDonald, R., et al. (2014)
12 Winter (2018)
16 URBAN WATER SCARCITY GUIDANCE NOTE: PREVENTING DAY ZERO BACKGROUND 17© UNICEF/UN0278889/India
INTRODUCTION
18 URBAN WATER SCARCITY GUIDANCE NOTE: PREVENTING DAY ZERO INTRODUCTION 19Cities around the world face a growing threat of urban water
shortages. The complexities of urban water scarcity mean that
the affordability, sustainability, safety and quality of urban
WASH services are all likely to be impacted on a large scale
if nothing is done to mitigate the risks. The objective of this
Guidance Note is to highlight the importance of assessing the
current and future resilience of urban WASH systems, and to
consider actions which may help mitigate the impacts of water
scarcity on these. To avert potential crises in the years ahead,
every urban WASH programme will need to ensure it includes
a thorough understanding of its own context and associated
risks. This means building local and accessible knowledge on
the available and projected demand for safe water (from a range
of sectors); the different technologies/sources available to meet
that demand, and the range of current and future risks urban
© UNICEF/UN046879/Syria WASH services will face.
This Guidance Note complements UNICEF’s lessons urban authorities, UNICEF, the © UNICEF/UNI108283/Sierra Leone
global Strategy for WASH (2016-2030) and broader WASH sector, and other partners
its Global Framework for Urban WASH, may learn from them.
which outlines UNICEF’s commitment to
increase its focus on urban WASH in order Not all elements of the Cape Town
to reach the most vulnerable children. The crisis response are applicable to the
note accompanies a second Guidance programming contexts of secondary and
Note on water scarcity – Water Scarcity tertiary cities where UNICEF’s urban
Guidance Note: Programmatic Approaches, programming primarily takes place, or to
which contains broader guidance on WASH densely populated camps for refugees or
programming and water scarcity. internally displaced people (IDP). However,
there are many aspects of the Cape Town
This note illustrates the experiences of experience, such as the communication and
different cities and contexts in Sections 1 behaviour change aspects of the response
and 2 below, including the 2018 Cape Town and the wider strategic approach, which can
water crisis. It demonstrates some of the provide inspiration for UNICEF urban WASH
steps and initiatives taken to mitigate urban programmes looking to tackle the effects of
water scarcity crises – and suggests what urban water scarcity.
20 URBAN WATER SCARCITY GUIDANCE NOTE: PREVENTING DAY ZERO INTRODUCTION 21The Guidance Note builds on the note categorises these actions into three
experiences of cities that have faced water types of action: preparedness actions;
scarcity crises to outline some specific immediate actions; and long-term actions
actions that can be considered to mitigate (which includes mitigation), summarised
the effects of urban water scarcity. The briefly in Figure 3 below.
UNICEF’S URBAN
WASH RESULTS IN 2020
FIGURE 3: The three types of action to address water shortages
In 2020, UNICEF implemented urban water programmes in
42 countries15 and reached an estimated 21.9 million people,
PREPAREDNESS ACTIONS IMMEDIATE ACTIONS LONG-TERM ACTIONS
according to data collected from UNICEF’s Strategic Monitoring
Risk management actions undertaken to Simultaneous actions to drastically reduce Including mitigation actions, to reduce Questions (SMQs).
prepare for the risk of water shortages, water usage in the city by, for example, or eliminate long-term risk. Support to Water programmes were implemented in 17 countries in
including protecting the most vulnerable aggressive demand management and supply augmentation, resilience-based development contexts, 37 countries in humanitarian contexts,
restrictions, while protecting access for approaches which includes equitable and and 12 countries implementing urban water programmes in
the most vulnerable sustainable water resource management. both development and humanitarian contexts. Over 88 per
Strategies to improve access to unserved cent of the people reached by urban programmes were in
marginalised communities humanitarian contexts, with a significant proportion coming 15 As reported in the 2020 Strategic
from conflict emergency settings. Monitoring Questions (SMQs)
FIGURE 4: Reported beneficiaries for water servcies in 202016 16 Taken from the 2019 UNICEF
Global annual results report 2019:
Goal Area 4. Available here.
< © UNICEF Mongolia
22 URBAN WATER SCARCITY GUIDANCE NOTE: PREVENTING DAY ZERO INTRODUCTION 23Wikimedia Commons/Cape Town
1. THE CAPE TOWN
‘DAY ZERO’ CRISIS
https://commons.wikimedia.org/wiki/File:Theewaterskloof_sandscape_2018-03-11.jpg
24 URBAN WATER SCARCITY GUIDANCE NOTE: PREVENTING DAY ZERO Chapter 1. THE CAPE TOWN ‘DAY ZERO’ CRISIS 25In 2018, severe drought conditions over three successive years led
to a major water shortage in Cape Town, a city with a population
of over four million people. At the start of the 2018 crisis, almost
all of the water supplied to Cape Town was from surface water
collected from six dams.17 In 2014, the six dams were full, but
after successive years of lower than average rainfall, the water
levels in the dams progressively declined, eventually to 20 per
cent capacity in 2018. The combined inflow between 2015 and
2017 was lower than any other consecutive three-year period
in the 90-year record, resulting in an estimated 1-in-590 year
event.18 In early 2018, it was predicted that if no changes were
made, Cape Town would experience ‘Day Zero’ – the day when SOUTH AFRICA
the city would run out of water – before the rainy season started.
17 A small proportion of the water
is also sourced from small dams,
This led to the initiation of Level 6 restrictions (see Box 5 below) CAPE TOWN
groundwater and springs to avoid the reservoirs running empty, prompting widespread
18 Cape Town Water Strategy, 2019. efforts to reduce water use.
As early as 1995, the City of Cape Town projects were implemented and some
The scale and speed of the crisis was and the development of a tariff structure committed itself to a 10 per cent saving of the projects, such as the Khayelitsha
unexpected, particularly because the City requiring large water users to pay more for on the historical demand growth of 4 per Pressure Management Project, were very
of Cape Town had long recognised the the larger quantities of water they consume. cent per annum. An integrated water successful and received wide recognition.
growing threat of water scarcity and, prior Despite population growth of three per cent resource planning (IWRP) study carried However, the implementation of the full
to the crisis, had made great progress in per year, Cape Town’s water demand in out in 2001 also indicated that various strategy proved unsustainable; numerous
reducing water consumption. Beginning in 2017, for example, was lower than it had water conservation and water demand institutional challenges meant that the initial
the 1990s, the city progressively introduced been in the year 2000 (see Figure 5 below). management (WCWDM) initiatives were commitment and resources to WCWDM
a range of measures to reduce the amount The City had won several international water the most feasible water augmentation were significantly reduced during 2003,
of water consumed and to promote water management and conservation awards for options to meet the growing water demand 2004 and again during 2006. In 2007, a
efficiency. These included public awareness its extensive efforts, and it was confidently of the city in the medium term. revised WCWDM strategy was approved
campaigns, leakage reduction initiatives, predicted at the start of the crisis that a for inclusion in the existing ‘Raw water
development and enforcement of well-managed city like Cape Town would In 2001, the City developed a WCWDM supply agreement’ between the City and
restriction levels, alternative water source never run out of water. policy and strategy based on the outcome the national Department of Water and
identification, the installation of meters, of the IWRP study. A number of WCWDM Sanitation, which had also finalised funding
arrangements for the construction of the
Berg River dam.20
19 Taken from Cape Town’s Water FIGURE 5: Total water use in Cape Town since 1970. Water use as measured by the treated
Strategy, 2019. Available here.
water supplied, including losses, on average for each year in megalitres per day (MLD)19 WATER In the end ‘Day Zero’ never arrived for Cape
CONSUMPTION Town. But there are many lessons to be
learned from policy, engineering, behaviour
IN CAPE TOWN
change and communication perspectives
Water consumption in 1998: about the factors that led to, and averted,
330 L/person/day the crisis.
Water consumption in 2014:
220 L/person/day Despite the successes reducing the city’s
Water consumption in 2018: water demand during the crisis (see Box
120 L/person/day (with restrictions) 4), many believed that restrictions were
Water reduction between 2015 and implemented too late in the drought cycle
2018: 50% considering the city’s complete dependence
Water use in informal settlements: on surface water (the restrictions were
5% of total use in entire city introduced in the third year of drought), and 20 The Berg River dam, completed
in 2007, was the last dam to add
that they should have been applied to all capacity to the regional water
(Source: Cape Town’s Water Strategy, 2020)
sectors for greater effect. system.
26 URBAN WATER SCARCITY GUIDANCE NOTE: PREVENTING DAY ZERO Chapter 1. THE CAPE TOWN ‘DAY ZERO’ CRISIS 27Outlined below are some of the more prepare for the risk of water shortages), The plan outlined that the drought effort usage (detailed in the following section).
effective actions that were implemented Immediate (actions undertaken during the would entail three overarching actions:
in response to the ‘Day Zero’ water crisis crisis to drastically reduce water usage in ⋅⋅ Keep and manage as much water in the The plan identified a critical principle that
in Cape Town. They are organised into the city) and Long-term (actions taken to dams as possible proved to be critical during the crisis: the
the three types of action for mitigating reduce or eliminate long-term risks of water importance of having publicly accessible
urban water scarcity: Preparedness (risk shortages, including mitigation actions). ⋅⋅ Ensure that the public is aware of, and
information. This was critical to building trust
management actions undertaken to follows, the measures (through the city’s
with communities, and establishing public
website)
trust and confidence in the management
⋅⋅ Provide public access to information of water resources is key to achieving
on dam levels, which coincided with widespread cooperation in water-saving
PREPAREDNESS ACTIONS implementing restrictions on water behaviour.
Leading up to the crisis, the City of Cape three phases of the plan are summarised as
Town developed a ‘Critical Water Shortages follows:
Disaster Plan’. The full plan was published Phase 1
IMMEDIATE ACTIONS
in October 2017 and comprised three PRESERVATION RESTRICTIONS - RATIONING:
phases, with supporting sector operational this outlines possible disruption to water Opportunities to reduce the amount of tap, and water use averages about 50 litres
plans and protocols, and served as a guide supply in some areas where demand water consumed are significantly larger per person per day.21
to City operations in the event of critical remains excessive, while introducing in inefficient systems, where relatively
water shortages. The disaster plan adopted pressure management and limiting supply. moderate interventions can often create
what it called a ‘pessimistic’ approach to large impacts. Since Cape Town’s water
ensure that the city was prepared for a Phase 2
system was already relatively efficient,
worst-case scenario, assuming very little DISASTER RESTRICTIONS: this involves
identifying large-scale improvements
additional water would be available from intensive water rationing through closing
over short timeframes was increasingly
either rainfall or augmentation measures, off the reticulation network in suburban
difficult. This meant that the city’s existing,
such as desalination and groundwater areas at the final (or Level 6) restriction (the
more moderate interventions needed to
abstraction. It detailed the steps to be different levels of restrictions under Phase
be supplemented with some immediate
taken, including partially shutting down the 2 are given in Table 1). (from the City of Cape Town’s ‘Water Dashboard’)
and drastic actions, in order to achieve the
network and restriction levels, and outlined Phase 3 levels of water savings the city needed to
the responsibilities of various stakeholders FULL-SCALE DISASTER IMPLEMENTATION: this address the crisis. The City of Cape Town frequently
in managing critical water shortages. The outlines full-scale disaster implementation. released updated public information on
The actions taken by the City of Cape Town dam levels supplying the city on a ‘Water
included a number of drastic measures Dashboard’, which also outlined the water
which built on previous efforts to improve restrictions in effect, in addition to water
TABLE 1: Cape Town’s water restriction levels water demand management. The City usage by sector, and actual weekly water
worked with diverse stakeholders and usage compared to targeted water use.
across multiple sectors to implement the Information was also freely available to
Restriction levels refer to the saving required to reduce supplied water volumes to meet the measures, enabling a reduction of 50 per the public on the improvements relating to
Department of Water and Sanitation (DWS) restrictions in times of drought, targeted at all domestic cent in net domestic water consumption water augmentation. When improvements
uses of water throughout the city. The City of Cape Town must meet DWS usage targets. To enable rate by March 2018 (after 26 months in dam levels were evident, the City
these targets to be met, the city council has to approve tariffs and measures for the different of restrictions), as shown in Figure 5. reduced restrictions incrementally. Some
restriction levels. Once approved, the City can move between restriction levels as long as they meet Several existing demand management of the immediate actions which were used
the DWS target, and adhere to the approved restriction tariffs. initiatives which were scaled-up during the on demand management are summarised
crisis primarily, but not entirely, targeted below.
LEVEL 1 Requires a saving of 10%
domestic households. The measures did
LEVEL 2 Requires a saving of 20% not impact informal settlements; the City WATER RATIONING AND USE
LEVEL 3 Requires a saving of 30% ensured that the half a million people living OF COMMUNICATION CAMPAIGNS:
in informal settlements continued to have The water rationing measures introduced
LEVEL 4 Allows for an urban demand of 600 MLD (megalitres per day) (aimed at 100 l/p/d, access to water services, and the provision during the crisis were enforced, with Level
and 87 l/p/d at Level 4B) of a free minimum volume of water per 6 restrictions and tariffs aimed at limiting
LEVEL 5 Allows for an urban demand of 500 MLD household per day was not affected. In consumption to 50 L per person per day.
informal settlements, water is supplied Households using more than 10,000 L per
LEVEL 6 Allows for an urban demand of 450 MLD (aimed at 50 l/p/d) for free through public taps at a ratio of month were restricted through physical 21 Cape Town’s Water Strategy
approximately 25 households or fewer per installation of flow-restricting water meters. (2019)
(Source: City of Cape Town Water Outlook 2018)
28 URBAN WATER SCARCITY GUIDANCE NOTE: PREVENTING DAY ZERO Chapter 1. THE CAPE TOWN ‘DAY ZERO’ CRISIS 29A campaign targeted at the wider population based on the number of people (Cape Town FIGURE 6: Number of water pipe bursts per month in Cape Town26 26 Ibid.
provided water conservation guidance on has guidance on water use based on the
how to reduce consumption, including how number of occupants22). If a household
to use 50 L per person per day, and this continued to exceed its allocation after
continues to be publicly available (see ‘A a second warning, the City installed a
social norms approach’ section below and household flow restrictor (which was
‘Water-saving tips’). externally visible). In the first six months of
2018, the number of households consuming
RESTRICTION TARIFFS: more than their allocation, reduced by 61
Prior to the crisis, a stepped tariff model was per cent. By 2019, approximately 220,000
already based on the ‘more you use, the household flow restrictors had been
more you pay’ principle, with progressively installed by the City.23
more expensive tariffs at higher blocks A SOCIAL NORMS APPROACH27: report and the government, organisations
to encourage water conservation while The City of Cape Town frequently published and businesses promoted water-saving
providing subsidised tariffs at low levels
PRESSURE MANAGEMENT:
data to promote water saving by residents techniques. Businesses made efforts
of consumption. During the crisis, While water pressure is used to ensure that
through a drought awareness campaign. to communicate such techniques to
progressively more punitive tariffs (up to all parts of a water network receive water
The use of data helped to promote a wide employees. People also shared tips on water
‘Level 6’ tariffs) were introduced so that irrespective of the elevation or network
discussion and a social norms approach saving, including reuse of water, bucket
higher rates of consumption (e.g. volumes diameter, high water pressure can lead
to water saving, where groups including showers and restricted toilet flushing, on
over 50 L per person per day or 10,000 L to damaged water pipes, and as a result,
communities, businesses and peers used social media. Interestingly, techniques used
per household per month) were priced at an higher rates of leakage. Although pressure in the poorer informal settlements gained
the urgent messages of the water crisis
even higher rate. The rates were extremely reduction initiatives had been introduced a traction in wealthier areas.28
to influence others to save water. The 27 Alexander (2019)
punitive above 35,000 L per household per decade earlier, and water losses, estimated
media disseminated the weekly water 28 Ibid.
month, even for wealthier households. at 15 per cent across the network,24 were
The high tariffs were effective at reducing low compared to similar cities, actions were
household water consumption, and accelerated to further reduce the water
volumes billed at the higher ‘blocks’ shrunk pressure. Such actions included using smart
considerably. pressure controllers, proactive leak detection, From the City of Cape Town’s From the City of Cape Town’s
pipe and meter replacement. These website on suggestions website on suggestions
For a more detailed description of the
tariffs implemented in Cape Town, it is
interventions were informed by a network- ON WHAT HOUSEHOLDS WHAT THE CITY
wide asset management strategy, reducing
recommended to read Section 4 of the city’s CAN DO TO SAVE WATER: IS DOING TO SAVE WATER:
the amount of time between leak detection
Water Outlook Report 2018, which contains
and repair, managing water pressure on a ⋅⋅ Check and fix all leaks on your property ⋅⋅ Finding and repairing underground water leaks
detailed tariff calculations at different usage
zone-by-zone basis, and retrofitting public ⋅⋅ Use municipal drinking water to irrigate on ⋅⋅ Continuing with pressure reduction programmes
levels.
buildings with water-efficient fittings.25 Tuesdays, Thursdays and Saturdays before 09:00 or to reduce the flow of water at one time, as well as
Importantly, leak detection initiatives after 18:00 for a maximum of one hour per property water losses through leakage in the pipework of the
FLOW RESTRICTIONS:
were implemented at the household and and only if using a bucket or watering can distribution system
Household flow restrictors had been
network scale; guidelines (for example, ⋅⋅ Use of a dripper, drip line or soaker hose for ⋅⋅ Making more money available for our first line
installed prior to the crisis, and once the
see the City’s Find and Fix Leaks leaflet) irrigation on Tuesdays, Thursdays and Saturdays response teams to attend to reported water faults
crisis hit, households which had been
were made publicly available to inform ⋅⋅ Use of sprinklers or a hosepipe fitted with a self- ⋅⋅ Improving response times for water complaints
deemed not to have reduced consumption
households of how to identify leaks in their closing spray nozzle on Saturdays ⋅⋅ Increasing staff numbers to deal with water
sufficiently, and/or had not conducted
leak safeguarding, were subjected to flow property’s pipes. The restricted per capita ⋅⋅ Use municipal drinking water to fill swimming pools management device complaints and faults
water allocations encouraged households if the pool is covered with a non-permeable solid ⋅⋅ Promoting the use of treated effluent (recycled
restrictions. Importantly, water allowances
to identify leaks and fix them. It has been pool cover when not in use and the pool is topped up water) or borehole water instead of drinking water
22 Available here. were applied to households, as well as to
with rainwater where practically possible for irrigation purposes
23 Cape Town Water Strategy (2019) schools and business. Larger households estimated that pressure management and
leak detection measures led to savings of ⋅⋅ Vehicles, trailers, caravans and boats can be washed ⋅⋅ Offering plumbing repairs for indigent households
24 Ibid. could apply for additional allocations per
with municipal drinking water using a bucket free of charge
25 Ibid. month as the household allowances were 70 MLD in Cape Town.
⋅⋅ Convert to water-wise landscaping. Use water-wise ⋅⋅ Reducing water losses from our systems
plant species, limit lawn areas and mulch flowerbeds
⋅⋅ Replacing ageing water mains
to help retain moisture in the soil
⋅⋅ Creating awareness for water saving through school
EXTERNAL RESOURCES ⋅⋅ Install water-efficient taps or fit existing taps with
visits and communication
aerators – these can reduce water flow from 20-30
Think Water’ page Water Saving checklist (shot on p. 30) litres per minute to 6-10 litres per minute
How to fix a leak page Water saving tips
⋅⋅ Install new water-saving toilets
30 URBAN WATER SCARCITY GUIDANCE NOTE: PREVENTING DAY ZERO Chapter 1. THE CAPE TOWN ‘DAY ZERO’ CRISIS 31From the City of Cape Town website:
Water-saving tips:
The more you save, the less you pay – and more water remains in our dams.
SHARE THIS with others, and visit www.capetown.gov.za/thinkwater
for more information and guidelines.
Toilet flushing and sanitation A NOTE ON THE SUSTAINABILITY The actions described above were
AND CHALLENGES OF WATER SAVING: considered to be key initiatives contributing
Following the crisis (i.e. when dam levels to the reduction in water demand and
Place a full glass bottle in your cistern to
Let were recharged by rains), water restrictions consumption during the period of the
the ‘yellow mellow’ at home, work, school, immediate crisis. It is hoped the interventions
(if you have no choice but to use municipal continued, although on a less stringent
gym, shops, etc. Don't use it as a dustbin.
drinking water). basis, and focused on particular activities, will also have longer-term impacts and
including watering gardens. Water behaviour changes. The Cape Town crisis
Flush with greywater only (laundry, bath Use less toilet paper to minimise the risk restrictions and guidelines on the amount of (as well as other examples, including the
and shower water) or with rain, borehole of sewer blockages and do not use your water use per household (depending on the Melbourne case study set out later in this
or well-point water. toilet as a dustbin. document) demonstrates the importance
number of occupants) remain in effect as
of 2020. The City of Cape Town continues of sustaining intensive engagement and
Use bleach or disinfectant to regularly to encourage residents to work together to communication to drive a long-term water
Close toilet stopcock (angle valve). sanitise toilets and surrounding areas
change the way water is consumed. Despite saving culture, and promoting a sense of
You will save municipal drinking water. and keep hands sanitised to prevent
health risks. this, the city’s daily water consumption has individual responsibility and accountability.
increased somewhat over the past year
Please note: The use of water from alternative sources has some health and hygiene risks you must avoid. with a summer peak of approximately 750 While ‘Day Zero’ was averted and the City
Keep hands and surface areas sanitised and disinfected. Don't keep greywater for longer than 24 hours. MLD (compared to 600 MLD in 2018) and of Cape Town earned the trust of many
Keep water containers in a safe place as children can drown in them. winter peak around 650 MLD (compared of its residents, many challenges were
to 550 MLD in 2018).29 However, water encountered to achieve overall water
usage is significantly lower than before the savings, including wealthier residents
crisis, suggesting there may be longer-term drilling boreholes on their properly to access
Body washing and personal hygiene effects of demand reduction interventions groundwater to bypass the municipal
at household and business levels. volume restrictions. 29 Alexander (2019)
Take short, stop-start showers. Don’t let taps run for too long or at full
Wet your body. Turn off the tap. Soap. Use a cup for shaving, brushing
Rinse quickly. teeth, etc.
LONG-TERM ACTIONS
No shower? Take a sponge bath.
Use waterless hand sanitiser instead
Use minimal water in a basin, bowl
of washing your hands.
or washtub (‘waskom’). For longer-term planning, water demand May 2019, the City Council of Cape Town
approaches in Cape Town moved from approved Cape Town’s Water Strategy,
Don’t let water run while you wait for Collect as much washing water as possible focusing on disaster management to which outlines five commitments in the
it to heat. If possible, use cold water as a priority. resilience, with the City continuing its efforts context of a ‘whole-of-society’ approach.
or heat your water for a sponge bath, Excess greywater can be used for plants
to reduce consumption across all sectors. In The five commitments are set out below.
in a kettle or on the stove. or washing vehicles.
City of Cape Town website: Water saving tips
32 URBAN WATER SCARCITY GUIDANCE NOTE: PREVENTING DAY ZERO Chapter 1. THE CAPE TOWN ‘DAY ZERO’ CRISIS 33FIGURE 7: Cape Town’s five water commitments, from the City’s 2019 Water Strategy.
As water resources in the Western Cape per cent of the city’s water supply has been governments with constitutional protection population residing in informal settlements
are shared with many other sectors, the provided from alternative sources to the for the human right to water. Despite this, used 50 litres per person per day on average
City of Cape Town is building on multi- rain-fed dams, and the city has committed high levels of inequality persist in Cape both before and during the crisis.
stakeholder collaboration with different to increasing its available supply through Town and there are still many marginalised Prior to the crisis, households within
groups, particularly in the agriculture such alternative sources by 300 MLD by communities living in informal settlements. recognised informal settlement communities
sector, to ensure that water efficiency 2029.31 This includes newly emerging settlements were provided with 6,000 litres of free water
continues to improve. This collaborative which are not officially recognised by the per household per month (which equates to
approach is essential as the city’s water THE IMPACT OF THE WATER CRISIS City, which have an impact on access to 50 litres per person per day in a four-person
catchment area is mostly from outside of ON INFORMAL SETTLEMENTS: water and the City’s obligations to provide household), delivered largely via public
the city’s boundaries, where agriculture The impact of the water crisis on informal a water service34. Although the population standpipes. Basic allocations continued
is concentrated. During restrictions, the settlements: The National Water Act (1998) residing in informal settlements in Cape with no physical restrictions imposed in
agriculture sector had to reduce their water recognised that water resources provide Town represents an estimated 10 to 15 informal settlements. The free allocation
consumption by 60 per cent30 and many benefits for all people32, and the Water per cent of the city’s overall population, continued throughout the crisis; owing to
the population uses only five per cent of their already low levels of consumption, the 34 Water connections were not
farmers are now considering permanent Services Act (1997) established clear
30 Cape Town Water Outlook (2018) provided to newly occupied
31 Cape Town Water Strategy (2019) changes to their water use practices to rights of access and the delivery of water total city water consumption. Water use in provision of water to informal settlements (informal) but instead to existing
32 The National Water Act (1998) ensure their operations are more efficient as a service33 under a legal framework. informal settlements is constrained by the was not affected by water restrictions, even service areas
33 The Water Services Act (1997) in the future. In addition, since 2019, five South Africa is one of the few national volume of water that can be carried;35 the at Level 6 restrictions. 35 Cape Town Water Strategy (2019)
34 URBAN WATER SCARCITY GUIDANCE NOTE: PREVENTING DAY ZERO Chapter 1. THE CAPE TOWN ‘DAY ZERO’ CRISIS 35© UNICEF Iraq
2. EXPERIENCES FROM OTHER
WATER-SCARCE CITIES
36 URBAN WATER SCARCITY GUIDANCE NOTE: PREVENTING DAY ZERO Chapter 2. EXPERIENCES FROM OTHER WATER-SCARCE CITIES 37Some water-scarce cities’ experiences, and how they have capacities, water resource monitoring, enormous quantities of groundwater, will
efficient water use (including improving need to be actively included in any such
attempted to safeguard their water supplies, are set out below.
leakages) and behaviour change. The reforms to ensure that water is used
agriculture sector, currently abstracting efficiently and appropriately.
SINGAPORE
The Asian city state has long been hailed as a ⋅⋅ Collect every drop of water (authorities
success in terms of balancing its very limited explore ways to collect every drop
water availability against its water demand. of water that falls on Singapore)
This is despite the island country having one which includes rainwater harvesting,
of the highest population densities in the green infrastructure and storm water
world, with numbers increasing every year. management;
ORANGE COUNTY AMMAN Due to concerted efforts at a number of ⋅⋅ Reuse water endlessly – including for
levels, the city’s per capita household water drinking water (reused water provides
consumption reduced from 165 litres per 40 per cent of demand through the
CHENNAI day in 2003 to 143 litres per day in 2017.37 To ‘NEWater’ programme);
BOGOTÀ ensure the optimum management of water
SINGAPORE ⋅⋅ Desalinate seawater (aiming to provide
resources38, there have been substantial
30 per cent of water demand); and
investments in research and technology to
LA PAZ conserve, treat, recycle and supply water ⋅⋅ Import water from the Johor River 37 ‘Singapore Water Story’, www.
WINDHOEK pub.gov.sg/watersupply/
(see Figure 8). Singapore’s water demand is in Malaysia through the 1962 Water singaporewaterstory. [accessed 1
met through four main sources, outlined in Agreement which allows withdrawal September 2019]
MELBOURNE the ‘Four National Taps’ programme: from the Johor River until 2061. 38 Ibid.
FIGURE 8: Singapore’s holistic approach to water management 39 39 Ibid.
Treated
CHENNAI, INDIA
use
water
Stormwater management Rain Sea Treatment of used
Following successive years of unsustainable locations outside of the city, but as demand water at 4 water
groundwater extraction and poor water increased, borehole owners were forced to
management, many of India’s largest cities drill deeper to find water. The government
are facing continuous water shortages. provided water through tankers, but Indirect potable use
In June 2019, nearly 65 per cent of the residents had to queue for long periods,
5 NEWater factories
country’s reservoirs were almost empty.36 which greatly affected their time for other
livelihood opportunities. Residents who Direct non-
potable use
In Chennai, a city of nine million, there was could afford it had to pay exorbitant sums through 515km
transmission
no water available in the network during the to private water providers for additional 3 Desalination plants network Collection of used water in
Collection of rainfall in
summer of 2019 as the city faced heatwaves water deliveries. 3,500km of sewers and DTSS
and severe drought. Public toilets were India’s long-term planning for water supply
closed and employees were forced to augmentation has included investing in
work from home due to insufficient water desalination plants and transporting water
to ensure functional hygiene facilities at from distant watersheds. Such options
workplaces. are likely to relieve only a small part of the Industries
Shortages of water affected the surrounding water shortage problem and are unlikely Transmission and
distribution network
areas of Chennai, where communities were to provide a sustainable water supply for
(5,500km)
already dependent on water tankers for their everyone. Alleviating the crisis will require Treatment of raw to
potable water at 8 PUB
drinking water supply. Tankers collected solutions addressing many different factors, water treatment plants
36 NASA Earth Observatory (2019) their water from wells and boreholes in such as the enabling environment, technical Households
38 URBAN WATER SCARCITY GUIDANCE NOTE: PREVENTING DAY ZERO Chapter 2. EXPERIENCES FROM OTHER WATER-SCARCE CITIES 39LA PAZ, BOLIVIA
In November 2016, the worst drought in also been blamed for reducing the city’s
25 years combined with impacts from El- valuable and limited water resources even
Nino to create water shortages throughout further.42
Bolivia. An emergency was declared by the
national government and La Paz, the capital, The immediate response in La Paz was for
was forced to enact strict water rationing the city’s water service provider to halt the
measures in 94 neighbourhoods.40 distribution of water through the network
and instead use water trucks and communal
The reasons behind the city’s water crisis water tanks, in addition to the introduction of
were multifaceted. The glaciers that once a strict water rationing system. Community
fed the city’s reservoirs are disappearing members lined up at the communal water
due to higher temperatures over the past 20 tanks and were limited to collecting two
years, as a result of climate change. Bolivian containers of water. In other areas, water
cities are highly dependent on glaciers for was available in the network for three hours
their water supply, especially during dry every three days. Over the course of the
months. In addition to this, poor water crisis, an estimated 400,000 people in 100
management was highlighted as a key factor neighbourhoods in La Paz and neighbouring
contributing to the crisis. Bolivian water El Alto were affected.43
infrastructure has been in decline for many
years; leaking pipes and illegal connections While the city is launching several
have led to high rates of non-revenue water infrastructure projects to enhance water
and water losses being reported, of up to supply, including a new dam and reservoir
50 per cent.41 Inadequate investment in to capture more rainwater, a broad range
new infrastructure or water sources has of additional initiatives will be needed to
40
41
Miranda (2018)
Farthing (2016) meant continued dependence on inefficient address future water crises that the city will
AMMAN, JORDAN
42 Martinez (2017) water and energy infrastructure. Mining inevitably face.
43 Kaufman (2017) operations near La Paz’s reservoirs have Jordan is reported to be the fifth-most in Jordan, which include the rehabilitation
water stressed country in the world.44 or replacement of leaking sections of the
Amman continues to struggle with drastic network, alongside support for increased
© UNICEF/UNI189337/Bolivia levels of water scarcity, which have seen energy efficiency and the use of renewable
the Government develop policies which energy.
set clearly defined rules to better manage
water resources efficiently and sustainably. UNICEF has supported the Government of
The ‘Water Substitution and Reuse Policy Jordan to develop water and wastewater
(2016)’45 recognises wastewater as a vulnerability maps at a sub-district level,
potential water source, for example, and as a planning tool to aid policy and
sets out specific strategies to increase prioritisation. The water vulnerability maps
the amounts of wastewater treated. As were developed using a number of criteria,
a result, Jordan has one of the highest including the age of the network, the
rates of wastewater reuse in the region. In amount of water consumed (compared to
2014, 125 million cubic metres of treated the planned amounts) and poverty, and as
wastewater were reused after either being flagged areas in most need of additional
blended with fresh water for irrigation or support, including network extension.
used for other purposes without blending. The wastewater vulnerability maps were Wikimedia Commons/Amman
Despite this progress, water leakage in developed using a range of criteria, including
44 https://www.wri.org/
the network is still a major challenge; non- the sewage network coverage, data on applications/aqueduct/country-
revenue water is estimated at 52 per cent, wastewater treatment plant assessments, rankings/
largely due to leakage in the distribution the age of the sewage network, and levels 45 Government of Jordan,
‘Wastewater substitution and
system,46 as well as illegal network of poverty. The maps identified sub-districts reuse policy (2016), Ministry of
connections and boreholes. To address this, most in need of additional treatment Water and Irrigation, 2016.
a range of projects targeted at promoting infrastructure and capacity.
water efficiency are being implemented 46 Ibid.
40 URBAN WATER SCARCITY GUIDANCE NOTE: PREVENTING DAY ZERO Chapter 2. EXPERIENCES FROM OTHER WATER-SCARCE CITIES 41You can also read