Contribution of the Automotive Industry to the Economies of All Fifty States and the United States
←
→
Page content transcription
If your browser does not render page correctly, please read the page content below
Contribution of the Automotive Industry
  to the Economies of All Fifty States
         and the United States

                          3005 Boardwalk Drive
                          Ann Arbor, MI 48108
                           www.cargroup.org

                               January 2015

 All statements, findings, and conclusions in this report are those of the authors
and do not necessarily reflect those of the Alliance of Automobile Manufacturers.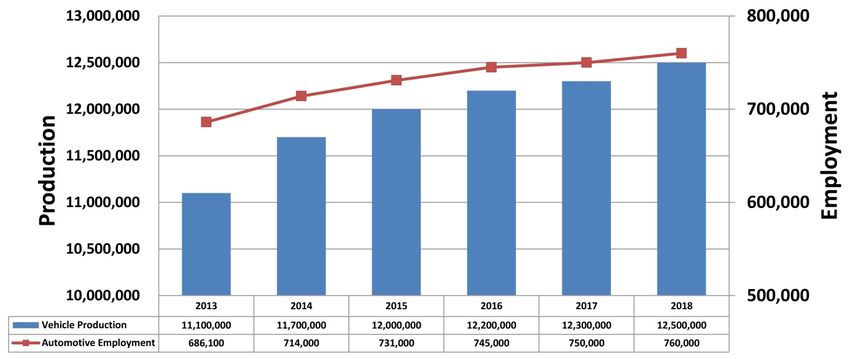
Contribution of the Automotive Industry
to the Economies of All Fifty States
and the United States

Center for Automotive Research

Report Prepared by:

Kim Hill, Director, Sustainability & Economic Development Strategies Group
Director, Automotive Communities Partnership
Associate Director, Research

Debra Maranger Menk
Joshua Cregger
Michael Schultz

Report Prepared for:

Alliance of Automobile Manufacturers
1401 Eye Street, N.W., Suite 900
Washington, DC 20005

January 2015

©Center for Automotive Research 2015                                         i
ACKNOWLEDGEMENTS

The Center for Automotive Research (CAR) would like to thank the Alliance of Automobile
Manufacturers for support of this work.

This study is the result of a group effort. The authors would like to thank our colleagues at CAR
for their assistance with this study, in particular, Bernard Swiecki for his assistance with
organizing and conducting interviews and Yen Chen for his input and guidance on economic
modeling. Additional assistance was provided by Diana Douglass, who contributed greatly to
the coordination of the project and the production of this document.

The authors would also like to thank the representatives from all of the companies that
provided employment and compensation data to inform this study. In particular, the authors
would like to thank representatives at all of the automakers that contributed to this study,
including BMW, Chrysler, Ford, General Motors, Honda, Hyundai, Kia, Mazda, Mercedes,
Mitsubishi, Nissan, Subaru, Toyota, and Volkswagen. The authors would also like to thank
representatives at Balluff, Hitachi Automotive Systems Americas, Johnson Controls, Kentucky
Automotive Industry Association, Kyosan Denso Manufacturing Kentucky, Toyoda Gosei, and ZF
Steering Systems for meeting with CAR researchers and providing insight into the automotive
supplier sector.

Kim Hill

Center for Automotive Research
www.cargroup.org

©Center for Automotive Research 2015                                                                ii
TABLE OF CONTENTS

ACKNOWLEDGEMENTS ........................................................................................................................... II
TABLE OF CONTENTS ............................................................................................................................. III
EXECUTIVE SUMMARY ........................................................................................................................... 1
INTRODUCTION .................................................................................................................................... 3
SECTION I ‐ AUTOMOTIVE INDUSTRY BACKGROUND .................................................................................... 5
   Overview of the Automotive Industry ........................................................................................ 5
     U.S. Automotive Geography.................................................................................................... 5
   Recent Developments in the Automotive Industry .................................................................... 7
   Economic Significance of Automotive Industry .......................................................................... 9
     Sales, Production, and Employment Forecasts ..................................................................... 10
     Automotive Investment......................................................................................................... 11
   Research, Development, and Innovation in the Automotive Industry ..................................... 13
   Technology Trends in the Automotive Industry ....................................................................... 15
     Advanced and Alternative Powertrains ................................................................................ 15
     Materials and Joining ............................................................................................................ 17
     Connected and Automated Vehicles .................................................................................... 18
   Sectors of the Automotive Industry.......................................................................................... 20
     Suppliers ................................................................................................................................ 20
     Dealers .................................................................................................................................. 21
     Medium and Heavy Duty....................................................................................................... 22
     Aftermarket Suppliers ........................................................................................................... 24
   Role of Small‐ and Medium‐sized Businesses in the Automotive Industry .............................. 25
   Kentucky Case Study ................................................................................................................. 26
SECTION II ‐ ESTIMATES OF THE ECONOMIC CONTRIBUTION OF THE MOTOR VEHICLE INDUSTRY TO THE UNITED
STATES ECONOMY .............................................................................................................................. 29
   Vehicle Manufacturer Activities ............................................................................................... 30
   Automobile Dealerships............................................................................................................ 33
SECTION III ‐ ESTIMATES OF THE ECONOMIC CONTRIBUTION OF THE MOTOR VEHICLE INDUSTRY TO INDIVIDUAL
STATE ECONOMIES ............................................................................................................................. 37
SECTION IV ‐ METHODOLOGY OVERVIEW................................................................................................ 43
       The Macroeconomic Model .................................................................................................. 43
       Methods & Assumptions ....................................................................................................... 44
BIBLIOGRAPHY ................................................................................................................................... 45
APPENDIX A ...................................................................................................................................... 51

©Center for Automotive Research 2015                                                                                                             iii
©Center for Automotive Research 2015 iv
EXECUTIVE SUMMARY
Over 7 million private sector jobs supported by auto manufacturers, suppliers and dealers
in the United States
$500 billion paid in annual compensation to employees supported by the automotive
industry
Every vehicle manufacturer job creates almost 7 other jobs in industries across the
economy
All direct auto industry employment creates almost 4 additional jobs in other industries
across the economy
The automotive industry continues to be one of the most important industries in the U.S.
economy, supporting more than seven million private sector jobs and $500 billion in
compensation, along with attracting foreign direct investment (FDI) currently valued at $74
billion—approximately 3 percent of all FDI in the United States.1 Additionally, the industry has
collectively invested almost $46 billion expanding and retooling U.S.‐based facilities since 2010.
Fourteen automotive companies have numerous facilities in the United States, with some
companies supporting fully integrated operations in the country including research,
development, design, engineering, headquarters, and manufacturing operations, while others
have a much smaller footprint. Beyond the number of jobs created, the industry contributes
substantially to federal, state and local tax revenues, providing more than $200 billion to the
federal and state governments. This study highlights these contributions to the U.S. economy.
Only half a dozen years after the worst recession in the U.S. since the 1930s, the American
economy demonstrates many signs of strengthening, and the auto industry is helping to drive
the recovery. Despite recent economic hardships, auto manufacturers, suppliers and dealers
themselves employ over 1.5 million people and directly contribute to the creation of another
5.7 million jobs. In total, the auto industry is now responsible for 7.25 million private sector
jobs, according to Center for Automotive Research (CAR) analysis.
CAR researchers also found the millions of employees whose jobs are supported by the auto
industry collect almost $500 billion in annual compensation, delivering nearly $65 billion in
personal tax revenues to government entities. This figure underscores another recent CAR
study, which found that motor vehicle manufacturing and use generated at least $110 billion in
state government tax revenue and another $96 billion in federal government tax revenue,
amounting to about $206 billion in taxes – or more than the Gross National Product of 142
countries across the globe.2
1
BEA. (2015). “Foreign Direct Investment in the United States: Selected Items by Detailed Industry of U.S. Affiliate, 2008–2013.” Bureau of
Economic Analysis, U.S. Department of Commerce. Accessed January 16, 2015. .
2
Hill, Kim, Debra Maranger Menk, and Joshua Cregger. (2015). “Assessment of Tax Revenue Generated by the Automotive Sector for the Year
2013.” Center for Automotive Research. January 2015. . and World Bank. (2014). “GDP Ranking.” The World Bank.
Website. Accessed December 16, 2014. .
©Center for Automotive Research 2015 1The industry as a whole employs about 1,553,000 people directly engaged in designing,
engineering, manufacturing, and supplying parts and components to assemble, sell and service
new motor vehicles. CAR found vehicle manufacturers—automakers, also known as original
equipment manufacturers (OEMs)—directly employed 322,000 people in the U.S. in their
respective headquarters and in other operational facilities, such as assembly and manufacturing
plants and on research and development campuses. Additionally, there are 521,000 people
employed in the automotive parts sector, including workers in the rubber, plastics, battery,
aftermarket, and parts export sectors, and another 710,000 people employed in the dealer
network selling and servicing new vehicles.
But jobs related to the auto industry go far beyond designing, building and selling vehicles.
America’s automakers are also among the largest purchasers of aluminum, copper, iron, lead,
plastics, rubber, textiles, vinyl, steel and computer chips. CAR models discerned that every OEM
employee had an employment multiplier effect of 7.6 (or 6.6 additional jobs for every direct
OEM job), while the employment multiplier for the entire industry is 4.7.3 There are many
workers in intermediate and spinoff jobs from the auto industry due to the complex
manufacturing supply network with many tiers of suppliers across a wide array of industries.
Breakout of the employment and economic contributions by OEM, all automotive
manufacturing, and dealer sectors are as follows:
Direct, intermediate, and spin‐off employment from OEM activities estimated at 2.4 million
Total compensation of $168 billion
Estimated personal tax payments of nearly $23 billion
Total employment generated by all automotive manufacturing (including automakers) is
estimated to be 5.6 million
Total compensation of $375 billion
Estimated personal tax payments of nearly $45 billion
Total employment generated by the dealership network is estimated to be 1.65 million
Total compensation of $116 billion
Estimated personal tax payments of approximately $20 billion
These figures are likely to rise as well. CAR’s U.S. automotive employment forecast projects
hiring will increase by approximately 10.8 percent, with a compound average growth rate of 2.1
percent from 2013 to 2018. U.S. production is forecast to continue expanding, growing at a
compound average growth rate of 2.4 percent, resulting in a projected rise of 12.6 percent in
production from 2013 to 2018. CAR’s econometric analysis also suggests auto sales over the
next several years will continue to increase, from 15.6 million units in 2013 to 17.6 million units
in 2018.
3
The employment multiplier derived from manufacturing vehicles is lower than the previous study completed in 2010, while the parts
manufacturing, sales and total industry multipliers are slightly higher than multipliers seen in previous studies. The authors believe that since
the recession, increases in productivity, as well as the tendency for manufacturing operations to run three shifts, have dampened the
employment contribution, as day‐time, office and business services jobs provide support for around‐the‐clock production.
©Center for Automotive Research 2015 2INTRODUCTION The automotive industry is a critical component of economic growth, with extensive connections across the industrial and cultural fabric of the United States. This report outlines many known elements and highlights tremendously important associations beyond the market space of automotive manufacturing. National and regional employment; research, development and innovation; state and local government revenues; foreign direct investment; education; health care; U.S. trade; and quality of life are all tied to the automotive industry. This report reviews many of the factors that support the auto industry’s importance and standing in the national economy, and provides a current estimate of the industry’s employment and economic contribution to the national economy and to each of the 50 states and the District of Columbia. The paper is organized into several sections: Section I provides qualitative context and current market metrics for the automotive industry, both of which are needed to truly appreciate the contributions of the industry to the broader economy and gauge where the industry may be heading. Section II features an in‐depth quantitative analysis of employment and personal income associated with the automotive industry. Section II captures the distinct contributions of assemblers, motor vehicle and parts manufacturing, and dealers to the national economy. Section III describes the state‐level employment associated with the automotive industry. Section IV discusses the methodology of the economic modeling used to produce the results discussed in Section II and Section III. This study updates the economic contribution estimates from a 2010 study published by the Center for Automotive Research (CAR) on the national contribution of the automotive industry in the United States.4 The auto industry is one of the most important industries in the United States. It historically has contributed 3.0 – 3.5 percent to the overall Gross Domestic Product (GDP). The industry directly employs more than 1.5 million people engaged in designing, engineering, manufacturing, and supplying parts and components to assemble, sell and service new motor vehicles. In addition, the industry is a huge consumer of goods and services from many other sectors, including raw materials, construction, machinery, legal, computers and semi‐conductors, financial, advertising, and healthcare. Automakers spend an average of $1,200 for research and development (R&D) per vehicle5 – 99 percent of which is funded by the industry itself. Due to the industry’s consumption of products from many other manufacturing sectors, it is a major 4 Hill, Kim, Debra Maranger Menk, and Adam Cooper. (2010). “Contribution of the Automotive Industry to the Economies of all Fifty State and the United States.” Center for Automotive Research. Prepared for the Alliance of Automobile Manufacturers, the Association of International Automobile Manufacturers, the Motor and Equipment Manufacturers Association, the National Automobile Dealers Association, and the American International Automobile Dealers Association. April 2010. . 5 Hill, Kim, Debra Menk, Bernard Swiecki, and Joshua Cregger. (2014). “Just How High‐Tech is the Automotive Industry?” Center for Automotive Research. Page 9. January 8, 2014. . ©Center for Automotive Research 2015 3
driver of the 12 percent manufacturing contribution to GDP. Without the automotive industry,
it is difficult to imagine manufacturing surviving in this country.

During the recession, North American vehicle sales and production fell sharply. In 2007, U.S.
automotive plants built nearly 11 million vehicles; by 2009, production had fallen to slightly
more than half of that, 5.8 million vehicles. To add pressure to the supply chain, prior to the
recession, many suppliers were competing for automaker business primarily on price, leading
them to operate at very narrow margins. The loss of business coupled with razor‐thin margins
led to a reduction in the number of supplier companies. Some companies restructures or
consolidated, but many simply went out of business.6

The U.S. turnaround in vehicle sales happened much more quickly than recovery in other
sectors of the economy. After a low point of 10.4 million vehicles sold in 2009, sales in the
United States have steadily increased and exceeded 16 million units in 2014. Correspondingly,
U.S. automotive production is expected to exceed 11 million vehicles. As production has
increased, suppliers are operating their facilities at very high capacity utilization levels. With the
financial pain of the recession fresh in memory, most suppliers have been reluctant to reopen
closed plants or build new facilities.

As a result of transformation of the automotive industry at the highest levels, coupled with a
faster than expected resurgence in sales, many auto suppliers now find themselves under
intense customer pressure to increase their capacity and capabilities by investing capital,
adding new technologies, increasing efficiency, improving quality, upgrading workforce skills,
and collaborating with other firms.7

As previously mentioned, more than 1.5 million people are employed by the auto industry. In
addition, the industry is a huge consumer of goods and services from many other sectors and
contributes to a net employment contribution in the U.S. economy of more than 7 million jobs.
Approximately 3.8 percent of all U.S. private sector jobs are supported by the strong presence
of the auto industry in the U.S. economy. People in these jobs collectively earn nearly $500
billion annually in compensation and generate $65 billion in tax revenues. Going forward,
motor vehicle sales, production and employment in the industry are expected to continue to
rise. Coupled with relentless technological advances, the automotive industry will continue to
be a significant sector of the U.S. economy.

6
 Ibid. Hill, Kim, Debra Maranger Menk, and Adam Cooper. (2010).
7
 OESA. (2014). “Automotive Supplier Barometer.” Original Equipment Suppliers Association. November 3‐5, 2014.
.

©Center for Automotive Research 2015                                                                                          4
SECTION I ‐ AUTOMOTIVE INDUSTRY BACKGROUND

This section gives a brief overview of the U.S. automotive industry. It discusses the changing
market share and geography of the industry, the effects of the recent recession and subsequent
recovery, near‐term forecasts, recently announced investments, automotive innovation, and
important sectors within the automotive industry, including suppliers, dealers, medium‐ and
heavy‐duty vehicle manufacturers, and automotive aftermarket firms.

Overview of the Automotive Industry
The U.S. automotive landscape is dynamic and constantly shifting. Traditionally, the “Detroit 3”
(D3) domestic automotive assembly firms (Chrysler, Ford, and General Motors) were the
dominant industry force particularly in the U.S. Midwest, the undisputed home of the industry.
However, with the entry of international firms (BMW, Honda, Hyundai‐Kia, Mercedes, Nissan,
Toyota, and Volkswagen) and their investments across the country, the industry is now more
vibrant and complex. Decades of intense competition from many rival automakers have led to
increased quality and choice for consumers. These changes have also led to new job
opportunities and expanded production to new locations.

U.S. Automotive Geography
Within the United States, the top three states for establishments related to automotive
production (including companies producing vehicles, bodies, and parts) are Michigan, Indiana,
and Ohio. Texas is also high on the list, as are other Midwestern (Illinois and Missouri) and
Southern (Tennessee, Kentucky, Alabama, and Mississippi) states. Table 1.1 shows the
establishment count for the top 10 states in the United States, and provides total establishment
counts for the United States, Canada, and Mexico.

©Center for Automotive Research 2015                                                           5
Table 1.1: North American Automotive Manufacturing Establishments, by State and Country
                                                          Body and                                            All
                                Motor Vehicle                                       Parts
                                                          Trailer                                             Establishments
    State / Country             Manufacturing                                       Manufacturing
                                                          Manufacturing                                       (NAICS 3361‐
                                (NAICS 3361)                                        (NAICS 3363)
                                                          (NAICS 3362)                                        3363)

    Michigan                                      90                       95                       790                           975
    Ohio                                          24                       96                       479                           599
    Indiana                                       23                      165                       331                           519
    Texas                                         31                      178                       293                           502
    Illinois                                      24                       55                       292                           371
    Tennessee                                      9                       53                       218                           280
    Missouri                                      15                       74                       136                           225
    Kentucky                                      11                       26                       179                           216
    Alabama                                       10                       41                       149                           200
    Mississippi                                    8                       22                        55                            85
    All Other U.S.                               221                    1,183                     2,659                         4,063
    United States                                466                    1,988                     5,581                         8,035

    Canada                                       157                       600                    1,080                         1,837
    Mexico                                        23                        61                      670                           754
Sources: Bureau of Labor Statistics, Statistics Canada, Instituto Nacional de Estadistica y Geographia, 2014
Note: U.S. and Canadian figures represent 2013 data. Mexican figures are for 2012.

Traditionally, the geographic center of the automotive industry has been located in the
Midwestern states of Illinois, Indiana, Michigan, Missouri, and Ohio, as well as the province of
Ontario in Canada. U.S. automakers have also historically had assembly capacity in other states
in the form of branch assembly plants (e.g., General Motors and Ford assembly plants in states
such as California, Georgia, New York, and Texas),8 though most of those plants have since
closed.9 U.S. foreign direct investment has facilitated the expansion of the automotive industry
beyond the industrial Midwest, as international automakers are largely located in the Southern
states of Alabama, Georgia, Mississippi, and Tennessee. The current automotive footprint,
sometimes referred to as the “automotive corridor” in North America, which can be seen in
Figure 1.1, stretches from the upper Midwest to the Gulf of Mexico.

8
 Rubenstein, James M. (1992). “The Changing U.S. Auto Industry: A Geographical Analysis.” Routledge, New York, New York. 1992.
9
 Brugeman, Valerie Sathe, Kim Hill, and Joshua Cregger. (2011). “Repurposing Former Automotive Manufacturing Sites: A report on closed auto
manufacturing facilities in the United States, and what communities have done to repurpose the sites.” Center for Automotive Research.
Prepared for the Office of Recovery for Auto Communities and Workers, U.S. Department of Labor. November 2011.
.

©Center for Automotive Research 2015                                                                                                     6
Figure 1.1: North Americcan Automakerr and Automotiive Supplier Prroduction Faciility Locations
Sources: Cen
nter for Automo
otive Research, 2014
2 (supplier loccations from ELM
M Analytics andd MarkLines)
The supp
plier footprinnt follows ro
oughly the saame course aas the autommaker plant footprint,
though itt is more fully developedd in areas that have beeen engaged wwith automo otive
manufacturing for a longer perio od of time. The
T greatest density of suppliers is loocated in
Michigan
n, which also o hosts moree automotive e assembly pplants than aany other state.
Recent Developmen
D nts in the Automotive In
ndustry
In the early part of th
his century, annual U.S. light vehiclee sales peakeed at 17.4 m
million, and
sustainedd levels of 16
6 million uniits or more through
t 20007. This unprrecedented ssales activityy was
supporteed by a boom ming stock market,
m housing develop ment patterrns necessitaating increassed
vehicle ownership,
o an enhanced sense of pe ersonal wealtth, and geneerous vehiclee purchasingg
incentive
es.
In 2008 and
a 2009 the e financial crrisis and sub
bsequent reccession resulted in a shaarp contraction
of autom
motive sales. Vehicle asseemblers, sup ppliers and ddealers assemblers that had expand ded
capacity during the early
e part of the decade were vulnerrable when vvehicle saless fell 40 perccent
©Center fo
or Automotive Research 2015
5 7in 2009. While the U.S. automotive industry had been restructuring for many years, the 2009 market crash—and subsequent bankruptcy of two automakers and scores of suppliers— provided impetus for further reductions in U.S. automakers’ and suppliers’ production capacity. Since 2010 the U.S. automobile industry has steadily recovered. Many of the leading economic indicators have come back to pre‐crisis levels.10 Cumulative vehicle sales have registered double‐digit growth rates each year since the crash, and 2014 U.S. auto sales through December have increased by 5.8 percent compared to figures from 2013.11 During the recession, automakers and suppliers reduced their liabilities and rationalized capacity by closing, selling, or consolidating plants. As the economy began to recover, automakers and automotive suppliers were reluctant to over‐expand and met industry demands by running extra shifts and overtime at existing facilities rather than building new capacity. With higher levels of capacity utilization, many companies are now looking to invest in incremental capacity expansion both in the United States and abroad.12 Many manufacturing companies are also “reshoring” jobs, or bringing previously outsourced jobs back to the United States.13 A major reason for reshoring jobs is that the wages in formerly low‐cost countries have increased while real wages have seen little growth in the United States. A more flexible and productive workforce and intensive use of automated manufacturing methods has reduced the importance of labor cost when choosing to produce domestically or abroad, while other factors such as freight and energy costs have become more important. One example of reshoring in the automotive industry is Ford’s recent decision to relocate some production from China and Mexico to Ohio and Michigan.14 Concerns with logistics, as well as freight‐in and freight‐out costs, have resulted in pressure on supplier firms to locate facilities near their customers. Manufacturing firms are also sensitive to indirect costs, such as the risk associated with more distant supply chains. These concerns have not only resulted in some companies bringing manufacturing back to the United States, but also encouraged a re‐agglomeration of automotive suppliers to core automotive‐producing regions. 10 FRED. (2014). “Federal Reserve Economic Data.” Economic Research, Federal Reserve Bank of St. Louis. Accessed June 6, 2014. . 11 Automotive News. (2014). “U.S. Car and Light‐truck Sales by Make – Dec. 2014 (Ranked by Total Sales).” Automotive News Data Center. January 5, 2015. . 12 CAR. (2015). “Book of Deals.” Center for Automotive Research. January 2015. 13 Northam, Jackie. (2014). “As Overseas Costs Rise, More U.S. Companies Are 'Reshoring'.” National Public Radio. January 27, 2014. .; CSG. (2014). “’Made in the USA’ Reshoring Brings Manufacturing Back.” Capitol Ideas: Council of State Governments – Insights & Innovations. March/April 2014. .; and Economist. (2013). “Reshoring Manufacturing – Coming Home.” Special report: Outsourcing and offshoring. The Economist. January 18, 2013. . 14 Ibid. Economist. (2013). ©Center for Automotive Research 2015 8
Economic Significance of Automotive Industry
For more than a century, the automotive industry has been a major contributor in shaping the
U.S. economy, and has generated and supported millions of jobs. As of September 2014, the
U.S. motor vehicle and parts manufacturing industry employed more than 870,000 workers.15
Beyond those direct employees working in assembly, body/trailer, and parts plants, there are
many more workers in intermediate and spin‐off jobs that are supported through automotive
production activities.

The economic performance of the automotive industry, as well as manufacturing more broadly,
is important for the continued development and growth of national and regional economies.
Manufacturing and automotive industry trends can be indicators of the state of the economy,
with periods of growth in automotive manufacturing closely linked to periods of growth in the
economy as a whole. As of the second quarter of 2014, the value of U.S. light vehicle sales was
$519 billion on an annualized rate; this is the highest rate ever recorded.16

The economic implications of the automotive industry’s activities extend beyond people
directly employed in the industry, due to the complex manufacturing supply network with
many tiers of suppliers across a wide array of industries. A few of the more obvious industries
supported by automotive manufacturing include motor vehicle parts, primary and fabricated
metal, plastics, and rubber products. Outside of manufacturing, the automotive industry
supports jobs in professional and technical services, administration and services, wholesale and
retail trade, transportation and warehousing, finance and insurance, and management of
companies.

In January 2015, the Center for Automotive Research (CAR) published the study, “Assessment
of Tax Revenue Generated by the Automotive Sector for the Year 2013” for the Alliance of
Automobile Manufacturers.17 The study examined multiple instruments of tax revenue
generation and focused primarily on state and federal tax revenues. Taxes are generated at
various points in the automotive product lifecycle. For instance, in addition to the sales taxes
generated when vehicles are purchased, government agencies collect taxes from a variety of
sources—payroll taxes from employees working in the automotive industry, fuel taxes from gas
stations, registration and license taxes from drivers and vehicle owners, and corporate income
taxes and licensing fees from the automakers, automotive suppliers, and dealerships. These
taxes support a variety of government services throughout the country, such as constructing
and maintaining the highway system, and support a number of jobs in a variety of other
industries.

15
  BLS. (2014). Bureau of Labor Statistics, U.S. Department of Labor. Website. Accessed October 24, 2014. .
16
  BEA. (2014). Bureau of Economic Analysis, U.S. Department of Commerce. Website. Accessed October 24, 2014. .
17
  Hill, Kim, Debbie Maranger Menk, and Joshua Cregger. (2015). “Assessment of Tax Revenue Generated by the Automotive Sector for the Year
2013.” Center for Automotive Research. January 2015. .

©Center for Automotive Research 2015                                                                                                    9
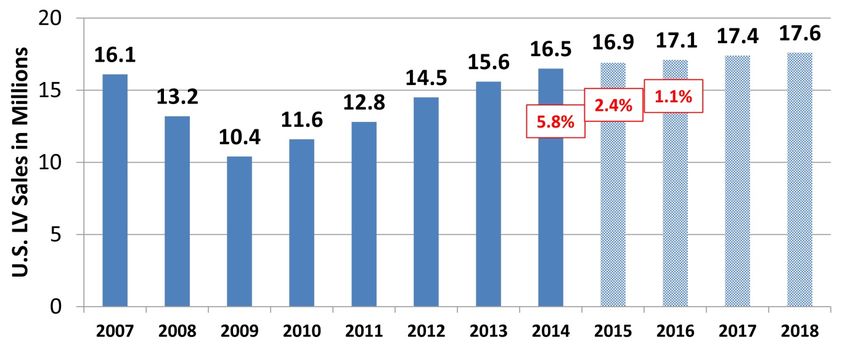
As a result of the depth and breadth of the automotive industry, every state in the nation
generates tax revenues related to motor vehicle production and use. CAR researchers produced
estimates18 of taxes that are generated by operations related to motor vehicles. In 2013, the
automotive industry generated at least $110.0 billion in state government tax revenue (This
represents approximately 13 percent of state government revenues).19 The estimates of the
federal tax revenues in the tax study do not exhaust all of the contributions made by the
automotive industry, and therefore, the estimates serve as a lower‐bound estimate. In 2013,
the automotive industry generated at least $95.5 billion in federal government tax revenue
(This represents approximately 3.4 percent of federal government revenues).20

Sales, Production, and Employment Forecasts
CAR produces an annual vehicle sales forecast based on an econometric analysis of key
variables of automotive demand. From 2013 to 2018, sales are forecast to increase by
approximately 12.8 percent. Figure 1.2 displays historical and forecasted sales for the U.S.
automotive industry. The forecast suggests that automobile sales over the next several years
will continue to increase, returning to the long‐term trend from 16.9 to 17.6 million units
annually.

Figure 1.2: U.S. Automotive Sales and Forecast, 2007-2018

Source: Center for Automotive Research, January 2015

CAR’s U.S. automotive employment forecast projects that from 2013 to 2018, employment will
increase by approximately 10.8 percent, with a compound average growth rate of 2.1 percent.
U.S. production is forecast to continue expanding, growing at a compound average growth rate

18
   All modeled numbers used in the text are rounded.
19
   Total state revenues for 2013 were approximately $846 billion. See Census. (2013). “State Government Tax Collections: 2013.” United States
Census Bureau, U.S. Department of Commerce. March 2013.
.
20
   Total federal revenues for 2013 were approximately $2.8 trillion. See CBO. (2013). “Monthly Budget Review—Summary for Fiscal Year 2013.”
Congressional Budget Office. November 7, 2013. .

©Center for Automotive Research 2015                                                                                                      10
of 2.4 percent; the result is a projected increase of 12.6 percent in production from 2013 to
2018. These forecasted trends are displayed in Figure 1.3.

Figure 1.3: U.S. Vehicle Production & Automotive Employment Forecasts, 2013-2018

Sources: Center for Automotive Research, Automotive News, Bureau of Labor Statistics, October 2014

Automotive Investment
Though the 2008‐2009 recession hampered new investments and led many automakers and
suppliers to temporarily idle or permanently close many factories, in subsequent years,
automakers and suppliers have invested and reinvested in their U.S. facilities. From the
beginning of 2010 through the end of 2014, automakers have announced investments totaling
nearly $70 billion in North America (see Figure 1.4). These investments include new facilities as
well as expanding and retooling existing facilities. The facilities include assembly, engine,
transmission, stamping, and parts plants along with other facilities. Of the North American
investments made during that period, two thirds of the investment dollars went to facilities
located in the United States.

©Center for Automotive Research 2015                                                                 11
Figure 1.4: Announced North
                      N     American
                                   n Automaker In
                                                nvestments, 20010 – 2014

Source: Center for Automottive Research, January 2015

Of the $6 69.6 billion in announced d North Ame  erican autommaker investtments from m 2010 to 20  014,21
$18.2 billion was ann  nounced in 2014.
                                   2      Of that total, $10.55 billion, or 58 percent o
                                                                                       of the total
North Am merican anno   ounced autoomaker investments from 2014 are within the U      United States.
Many of the individu  ual investments and their locations ccan be seen in Figure 1.5   5. Foreign diirect
investme  ent in the Unnited States is currently valued at $774 billion—aapproximateely 3 percentt of
                               22
all FDI in the United States.
                        S

21
   The investmment totals include
                                e announcementss for building new and retooling or eexpanding existingg facilities. The totaals also cover a range of
facility types, including assemb
                               bly, engine, transm
                                                 mission, stamping, and parts plants.
22
   BEA. (2015). “Foreign Direct Investment in the United States: Selected Items by Deetailed Industry off U.S. Affiliate, 20008–2013.” Bureau of
Economic Analysis, U.S. Departtment of Commercce. Accessed Januaary 16, 2015. .

©Center fo
         or Automotive Research 2015
                                   5                                                                                                               12
Figure 1.5: Announced Automaker
A Inveestments in Norrth America, Ja
January – Deceember 2014
Source: Center for Automottive Research, January 2015
Other U.SS. investmen
nt announce
ements not shown
s in thee map (but included in the 2014 totaal)
include:
BMW opening a new regional parts distribution
d ccenter in Texxas
Fo
ord openingg new technical support center for F ord Racing in North Carolina
Mercedes
M building a new w vehicle preparation cennter and oth her offices in
n California
Mercedes
M exppanding its Tuscaloosa
T assembly
a plaant in Alabamma
Toyota conso olidating its manufacturi
m ng, sales andd marketingg, and corporrate operations
nto a single new
in n headqu uarters in Texxas (moving operations from Kentuccky and
California)
Tesla establisshing a smalll manufacturing site at a former Chrrysler servicee parts
operation in California
C
Tesla buildingg a $5 billion
n battery “Giigafactory” in Nevada
Research h, Developmment, and Inn novation in the Automo otive Industry
The autoomotive indu ustry invests heavily in re
esearch and developmeent. Unlike otther industrries,
automotive research h and develoopment efforrts are largely funded byy the industrry, rather than
through public sourcces. In 2007, the last yeaar when fedeeral funding for the auto omotive indu ustry
was discllosed, only one
o percent of R&D in th he automotivve industry was funded through thee
federal government,
g leaving the industry to bear essenttially the full cost of creaating, design
ning,
testing, and
a impleme enting new technologies
t s (see Figuree 1.6).
©Center fo
or Automotive Research 2015
5 13Figure 1.6: R&D Funding Sources by Industry, 2007
Company and Other Federal
R&D Funding Source (Percent of Total)
100% 1%
15% 15% 10% 10% 10%
90%
32% 29% 27%
80%
70%
60%
50% 99%
85% 85% 90% 90% 90%
40%
68% 71% 73%
30%
20%
10%
0%
Architectural Scientific Aerospace Computer Utilities Non‐Mfg. All Mfg. Automotive
& Eng. R&D Svcs. Products & Electronic Industries Industries Industries
& Parts Products
Industry
Source: National Science Foundation, 2009
In 2011, the U.S. automotive industry, responding to the need to improve safety in vehicles,
consumer demands for new model types with enhanced cosmetic and drive performance
characteristics, and regulation of emissions, invested $11.7 billion into R&D. From 1999 to
2007, automotive R&D spending levels ranged between $15 billion and $18 billion. In 2008, U.S.
automotive R&D spending fell to $11.7 billion and in 2009 it continued to decline to just under
$10 billion. Annual automotive R&D expenditures can be seen in Figure 1.7. Several other
industries, all of which comprise a smaller share of GDP and national employment than
automotive, often receive a substantial amount of R&D funding from the federal government.23
23
NSF. (2014). “Business R&D and Innovation Survey,” and “Survey of Industrial Research and Development.” National Science Foundation.
Multiple Years. Accessed December 8, 2014. .
©Center for Automotive Research 2015 14Figure 1.7: U.S. Automotive R&D Spending, 1999-2011
$20.0 $18.3 $18.4
$18.0 $16.9 $16.7
$16.1 $15.7 $16.0 $16.0
$15.2
Automotive R&D Spending
$16.0
$14.0
$11.7 $11.7
$12.0
$10.0 $10.1
$10.0
$8.0
$6.0
$4.0
$2.0
$0.0
1999 2000 2001 2002 2003 2004 2005 2006 2007 2008 2009 2010 2011
Year
Source: National Science Foundation, 2014
Motor vehicle manufacturing is complex and requires a highly‐skilled, highly‐educated labor
force. Diversity in skill sets, education, and equipment also affords parts suppliers the
opportunity to diversify and develop products for a variety of industries outside of automotive.
If it were not for the R&D investments within the automotive industry, this dynamic cross‐
fertilization of the R&D process would not be available to other industries.
Technology Trends in the Automotive Industry
Automotive R&D spending and requirements are expanding rapidly to keep pace with the
demands for ever more sophisticated and effective new technologies. Automakers spend an
average of $1,200 for R&D per vehicle.24 Improved fuel economy and emissions targets
continue to drive automaker improvements in vehicle powertrain, lightweighting,
aerodynamics, and other vehicle attributes. Consumer preferences, increasing congestion, and
more mobility choices mean that cars have to incorporate a variety of creative technologies to
attract buyers. Areas of particular focus are powertrain, materials, and electronics. A
combination of powertrain improvements, new materials, and new material processes
comprise the strategies for automakers to achieve greater performance and provide better
utility while still improving fuel economy.
Advanced and Alternative Powertrains
The powertrain continues to be an important vehicle system for fuel economy improvements.
Vehicle manufacturers are developing a wide range of advanced powertrain technology options
24
Hill, Kim, Debra Maranger Menk, Bernard Swiecki, and Joshua Cregger. (2014). “Just How High‐Tech is the Automotive Industry?” Center for
Automotive Research. Page 9. January 8, 2014. .
©Center for Automotive Research 2015 15to meet environmental regulations, consumer preferences, and energy‐saving goals. While the spark‐ignited internal combustion engine (ICE) will remain the dominant technology for the foreseeable future, other powertrain options will see increased market acceptance, and no single option is expected to emerge as the best solution. Areas of technology growth related to powertrain systems include advanced internal combustion engines (gasoline and diesel), transmissions, vehicle electrification, and alternative fuels. Each of these categories presents a wide range of technology options and cost considerations. The internal combustion engine (ICE) has undergone remarkable change in the past decade and newly developed advanced internal combustion engines are expected to improve ICE environmental performance and also have a cost advantage vis‐à‐vis other powertrain options. Automakers continue to improve fuel economy of ICE engines using advanced technologies such as downsizing, turbocharging, variable compression ratio capability, and lean‐burn engine operation. Automatic transmissions will remain the dominant choice for U.S. consumers. In coming years, consumers should expect to see more vehicles with dual clutch transmissions (DCT), continuously variable transmissions (CVT), and higher‐geared (seven‐speed or higher) transmissions. Electrified vehicles hold both promise and uncertainty. Electric vehicles such as the Chevrolet Volt, Nissan Leaf, Ford Focus Electric, and Tesla Model S have entered the mainstream—but certainly not mass market. Vehicle electrification—including mild hybrids, hybrid electric vehicles, plug in hybrid electric vehicles, and battery electric vehicles—is highly dependent upon further battery development and consumer acceptance. Alternative fuels, such as natural gas, hydrogen, and biofuels, will also have a place in the advanced powertrain mix. Natural gas has been used in vehicles for many years, but has been mostly limited to heavy‐duty and fleet applications. Promoters of natural gas suggest that its abundance and relatively clean burning characteristics make it an ideal candidate for increased usage in motor vehicles. Hydrogen is another alternative fuel that has been researched for decades. Some automakers are already selling or leasing fuel cell electric vehicles, and s everal others have announced they will introduce fuel cell electric vehicles in the near future. Biofuels had strong government support in recent years with tax incentives and a national Renewable Fuels Standard geared towards increasing biofuels production and use. Issues with the 10 percent ethanol “blend wall” have resulted in regulators reducing biofuels production ©Center for Automotive Research 2015 16
requirements.25 All alternative fuels face infrastructure availability issues as well as the
challenge of relatively inexpensive gasoline.

Materials and Joining
Vehicle weight is a considerable factor in vehicle fuel economy; it is estimated that a 10 percent
reduction in vehicle mass can result in a fuel economy improvement of up to 5‐7 percent.26
Though achieving greater fuel economy is a main driver for many lightweighting material and
process technologies, there are other benefits. Weight reduction is also appealing to
automakers because it tends to increase other performance factors valued by consumers: ride
and handling, braking, and acceleration. Another key motivation for using new and more highly
engineered materials is to improve vehicle safety and crashworthiness.

By switching to lightweighting materials, such as high strength steel, aluminum, magnesium,
and composites, and adopting new forming (e.g., hot stamping and high integrity casting) and
advanced joining (e.g., adhesives, friction stir welding, fasteners, and laser welding)
technologies, automakers will be able to significantly reduce the weight of new vehicles. By
2025, automakers are expected to reduce the average vehicle mass by 10 percent or greater
versus 2010 vehicles.27

Automakers have historically concentrated on improving the materials used to create vehicles.
In the last few decades, there has been increased use of advanced high strength steel (AHSS),
composites, and aluminum, as well as a decrease in the use of iron castings and regular (mild)
steel. These trends can be seen in Figure 1.8. As automakers continue to implement
lightweighting strategies, these material trends will persist and may even accelerate.

25
   CBO. (2014). “The Renewable Fuel Standard: Issues for 2014 and Beyond” Congressional Budget Office. June 2014.
.
26
   NHTSA. (2012). “Corporate Average Fuel Economy for MY 2017‐MY 2025 Passenger Cars and Light Trucks.” National Highway Transportation
Safety Administration, U.S. Department of Transportation. Pages 435‐436. August 2012.
.
27
   This expectation is based on conversations between CAR and representatives from the automotive industry.

©Center for Automotive Research 2015                                                                                                 17
Figure 1.8: Vehicle Mateerial Compositiion in U.S. Ma
                                                    arket, 1978 – 20012

Sources: Wa
          ard’s Auto and American
                         A        Chemisstry Council, 201
                                                        14

In additio
         on to the maaterials themmselves, mucch of the advvancement in the autom      motive materials
relates to
         o manufactuuring and design method    ds. Some of tthe biggest d   developmen  nts in materiials
technoloogy involves application technologies
                                    t           s such as joi ning (e.g., reesistance spot welding,
fastenerss, adhesives,, weld bond adhesive, laaser weldingg) and fabricaation (hot fo  orming, thin‐‐wall
die castin
         ng, compositte molds, an nd aluminum m forming) teechniques. M    Material asseessment is aalso
importan nt, and compputer‐aided engineeringg (CAE) is useed to model new materials (e.g., mo       old
flow analysis, formabbility, and crrash simulatiions).

Connecteed and Autom   mated Vehiccles
Road transportation continues to      o undergo siignificant te chnological transformattions as wireeless
technoloogy increasinngly enables vehicles to communicat
                                                    c          te with each h other and w with surroun nding
infrastructure while advanced drriver assistan      nce systemss enable warrnings and lim mited amou  unts
of autommation. This transformat
                      t                ion is driven
                                                   n by the prol iferation of sensors, acttuators, wireeless
connectivvity, and arttificial intelliggence systemms that are eenabling veh hicles to perrceive and reeact
to their environment
         e            t in ways thaat human drivers cannott. Connected       d vehicle tecchnology will
enable veehicles to instantaneoussly communicate with eaach other an         nd the roadw way—provid  ding
information to make  e transportattion safer an    nd more efficcient. Autommated vehicle technologgy
can sensee dangerouss situations and  a issue driver warninggs or even acctively contrrol vehicle
                       28
systems in response..

28
  Wallace, Richard and Gary Silberg. (2012). “Sellf‐driving Cars: The
                                                                    e Next Revolution..” Center for Autoomotive Research aand KPMG. Augusst 2012.
.

©Center fo
         or Automotive Research 2015
                                   5                                                                                                          18
Connected vehicle technology will enable vehicles to communicate with each other (vehicle‐to‐ vehicle ‐ V2V) and with the roadway, traffic signals, bridges, and other pieces of infrastructure (vehicle‐to‐infrastructure ‐ V2I) using technologies such as dedicated short‐range communications (DSRC) and cellular networks (i.e., 4G LTE connectivity). DSRC is a wireless channel using the 5.9 GHz spectrum that was specifically designed for use in vehicular communications. Connected vehicle systems can be embedded, as with factory installed units, or may be brought into the vehicle in the form of a mobile device that can be plugged into or wirelessly connected to the vehicle. Many vehicles in operation have some form of connectivity (such as Chrysler Uconnect, Ford Sync/MyFord Touch, GM OnStar, Hyundai BlueLink, or Toyota Entune), and vehicles equipped with DSRC will become commercially available in the next two years. Vehicles equipped with V2V and V2I communication capabilities broadcast information (brake status, location, direction, speed, and other vehicle data) as they are driven, and the systems use cues such as sounds, lights, displays, and seat vibrations to alert drivers of various threats. Automated vehicle technologies use sensor inputs such as video cameras, radar, and LiDAR (a laser‐based ranging system) along with computing power and detailed digital maps to issue warnings or actively react to hazards. Several automated features already exist in many vehicles sold today, such as automated emergency braking, lane‐keeping assist systems, adaptive cruise control, and active parking assistance. Automakers may soon offer vehicles that combine some of these existing systems, allowing a vehicle's speed, steering, and brakes to be automatically controlled. In the near future, several automakers, including General Motors, Ford, Mercedes, and Volvo, are set to release systems capable of semi‐automated driving in certain situations, such as expressway or low‐speed stop‐and‐go (traffic jam) conditions. The final frontier of automated vehicle technology is the self‐driving, fully‐automated vehicle capable of operating on the road in mixed‐traffic. Despite the complexity involved, multiple stakeholders are working to develop such vehicles. Google is testing fully‐automated vehicles on public roads in Nevada and California, and has logged hundreds of thousands of miles in its test vehicles. Traditional automakers, such as General Motors, Toyota, and Volkswagen, are developing advanced automated functionality as well. Additionally, high‐tech automotive supplier firms such as Bosch, TRW, Delphi, and others are developing advanced technologies both in cooperation with, and independent from, the automakers. Currently four states (Nevada, Florida, California, and Michigan) and the District of Columbia have passed laws addressing fully automated vehicles on public roads, and several other states throughout the country have considered similar legislation. In May 2013, the National Highway Traffic Safety Administration released guidelines for states issuing licenses for testing fully automated vehicles on public roads. ©Center for Automotive Research 2015 19
Sectors of the Automotive Industry
The automotive industry consists of several different sectors upstream and downstream of the
automakers. These other sectors include automotive suppliers, auto dealers, medium‐ and
heavy‐duty vehicle manufacturers, and automotive aftermarket suppliers.

Suppliers
In this report, the automotive supplier sector is defined as a large group of independent, non‐
automaker, parts producers that sell finished goods to both domestic and international
automakers, as well as aftermarket parts replacement retailers. For the purpose of this study,
the automotive supplier group includes employees beyond NAICS 3363 (the industry
classification code for motor vehicle parts) to account for products developed by other
manufacturing industries that are used in the production of vehicles.

The total direct employment count at supplier companies is 521,000 workers;29 this figure
includes employees associated with manufacturing tires, hoses, hardware, lighting, batteries,
and plastics for motor vehicles as well as firms producing aftermarket parts and parts for
export. Without the inclusion of products such as rubber hoses and tires, NAICS 3363 would not
be sufficient to fully describe all products used to manufacture a finished vehicle.30

In recent years, the suppliers’ responsibility to add technology and value to the automobile has
grown. Parts R&D, production, and sub‐assembly have been shifted onto suppliers, as
automakers –facing declining profits and other business operation issues—have spun off many
of their in‐house parts operations. This transition is significant for two reasons: 1) 28‐40 percent
of R&D spending undertaken by the suppliers and approximately 40 percent of all R&D
scientists and engineers in the automotive industry are employed by suppliers,31 and 2) the cost
of R&D was transferred into an industry sector with a large proportion of small‐ to medium‐
sized businesses.

Even though the majority of automotive suppliers are small businesses, many parts
manufacturers have considerable engineering capability to continue refining their products,
develop new products, and integrate those products into automakers’ vehicles.32 The
combination of the added pressure to invest in research without an immediately recognizable
revenue stream and the size make‐up of suppliers has had substantial effect on the viability of
the supplier sector. Not all automotive R&D has been transferred to the supplier sector;
however, automakers still largely fund vehicle engine, body, and transmission design, as well as
parts integration R&D for the development of future model lines.

29
   This number represents all automotive manufacturing employees less those employed by the automakers. See Table 2.1.
30
   Data from organizations such as Battery Council International and the Rubber Manufacturers Association were used by CAR researchers to
determine what percentage of employees in those industries serve the automotive industry.
31
   Ibid. NSF. (2014).
32
   This assessment is based on conversations between CAR and representatives from the automotive industry.

©Center for Automotive Research 2015                                                                                                        20
Innovation is key to productivity, yet breakthroughs do not always occur in a timely manner.
The responsibility to design new products has put great financial strain on suppliers. In addition,
the return of vehicle production volumes to their pre‐recession levels has put a tremendous
strain on suppliers as they struggle to meet demand after having reduced their production
capacity just a few short years ago.

Dealers
To the lay person, the automobile dealership is the most visible and tangible component of the
sophisticated automotive manufacturing and distribution system. Dealerships are a perfect
reflection of the fabric of the U.S.—family‐owned businesses operating in communities across
the nation, for generation after generation. Beyond their heartfelt “American Story” aspect, it is
important to understand the contribution of dealerships to the regional economies and
government revenues, especially given the decline and recovery in automobile sales in recent
years and dealership closures during the recession.

Even though the bankruptcies of General Motors and Chrysler were structured, their
occurrence shook the foundation of the automotive industry to its core. As assembly facility
operations slowed and ultimately stopped, the fate of franchise dealerships was closely
followed in communities across the nation. According to company restructuring plans, during
2009‐2010, approximately 2,000‐plus GM and Chrysler dealerships closed.33 Even before the
financial crisis and subsequent bankruptcies, the number of dealerships in the United States
had been declining for decades (from 1988 to 2007, on average, the number of operating
dealerships declined by nearly 200 per year).34 By January 2008, there were 20,770 new‐vehicle
dealerships operating in the United States, but by January 2012, the number had declined by
3,230 and only 17,540 dealerships were operating. Since January 2012, the number of
dealerships has been expanding, albeit slowly. As of January 2014, there were 17,665 new‐
vehicle dealerships in operation.

Even after the closing of thousands of dealerships in recent years, new and used vehicle
dealerships still employ more than 1,000,000 workers (an average of nearly 60 workers per
dealership).35 In 2013, total dealership revenues in the United States were $730 billion, with
57.1 percent of those revenues associated with new vehicles, 31.3 percent with used vehicles,
and 11.6 percent with service and parts. The average pretax profit of a dealership was more

33
   Hill, Kim, Debbie Maranger Menk, and Adam Cooper. (2010) “Contribution of the Automotive Industry to the Economies of all Fifty State and
the United States.” Center for Automotive Research. April 2010. .
34
   NADA. (2006). “NADA Data 2006: Economic Impact of America’s New‐Car and New‐Truck Dealers.” NADA Data. National Automobile Dealers
Association. May 17, 2006. .
and NADA. (2013). NADA Data 2013: State‐of‐the‐Industry Report.” NADA Data. National Automobile Dealers Association. July 1, 2013.
.
35
   NADA. (2014). “NADA Data 2014: Annual Financial Profile of America’s Franchised New‐Car Dealerships.” NADA Data. National Automobile
Dealers Association. May 28, 2014. .

©Center for Automotive Research 2015                                                                                                      21
You can also read