A PROFILE OF MONTANA'S HIGH-TECH INDUSTRIES - APRIL 2021 BUREAU OF BUSINESS AND ECONOMIC RESEARCH
←
→
Page content transcription
If your browser does not render page correctly, please read the page content below

A PROFILE OF
MONTANA’S
HIGH-TECH
INDUSTRIES
APRIL 2021

    BUREAU OF BUSINESS AND
    ECONOMIC RESEARCH
    U N I V E R S I T Y O F M O N TA N A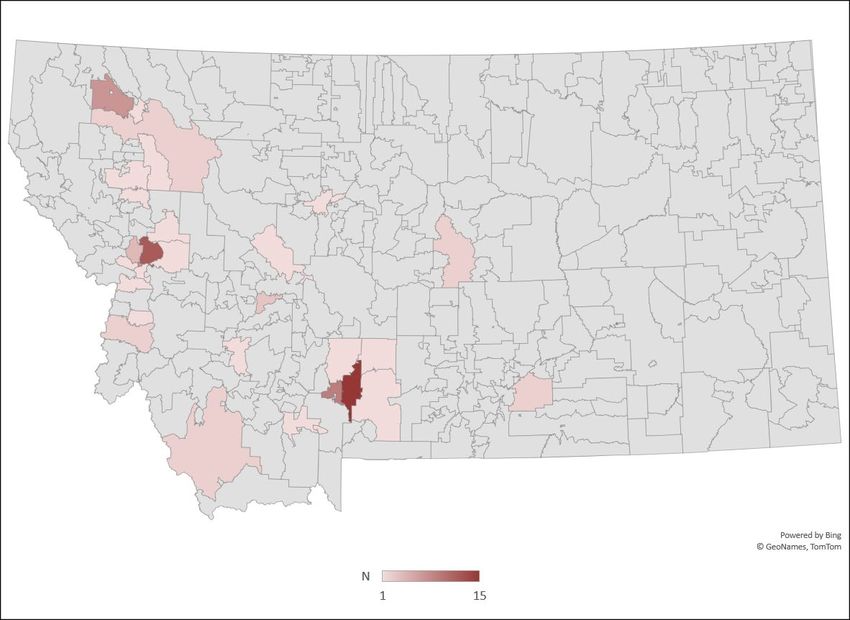
Acknowledgements
The members of the Montana High Tech Business Alliance worked hard to provide the
thorough information presented here, for that they are due sincere thanks.

The Board of Directors of the Montana High Tech Business Alliance commissioned this
report and provided a clear vision for its implementation. They are:

Kelly Schwager, Vice President, Global Communications for Oracle, Columbia Falls (Board
Chair)

Randy Chesler, President and CEO, Glacier Bancorp, Kalispell

Leland Johnson, Founder and CEO, ExcelliMatrix, Kalispell

Sam Lucas, Co-Founder and CEO, Special, Bozeman

Liz Marchi, Head of Community Engagement, Two Bear Capital, Whitefish and Founder,
Frontier Angel Fund

Jason Mittelstaedt, Co-founder, Yellowstone Growth Partners, Bozeman (Founding Board
Member)

Tom Stergios, SVP Strategy and Corporate Development for Advanced Technology Group
(ATG), a Cognizant Company, Missoula

This study would not have been possible, nor would it have achieved so much without
patience and tireless efforts of Ms. Christina Henderson, executive director of the Montana
High Tech Business Alliance. In addition, Martina Pansze, communications director and
Christina Olivieri, billing and membership coordinator of the Alliance put forth excellent
effort in guiding this project to a successful conclusion.

John Baldridge and Janet Stevens
Bureau of Business and Economic Research, University of Montana
April 20, 2021

    UNIVERSITY OF MONTANA BUREAU OF BUSINESS AND ECONOMIC RESEARCH                       2
Contents
Acknowledgements ............................................................................................................................2
List of Tables ........................................................................................................................................4
List of Figures .......................................................................................................................................4
Key Findings.........................................................................................................................................6
Background of the Project .................................................................................................................7
The Montana High Tech Business Alliance ..................................................................................7
The Bureau of Business and Economic Research ........................................................................9
About This Study ..........................................................................................................................9
Measuring High Tech Business Activity......................................................................................... 10
Results ................................................................................................................................................ 13
High Tech Firm Trends..................................................................................................................... 33
Annual Wage ................................................................................................................................. 33
Montana Employment ................................................................................................................. 34
Total Annual Montana-Generated Revenue ............................................................................. 34
Total Capital Expenditures in Montana ..................................................................................... 35
Montana’s Top Tech Regions.......................................................................................................... 36
Bozeman Area ............................................................................................................................... 36
Missoula Area ................................................................................................................................ 37
Kalispell Area ................................................................................................................................ 38
Appendix 1: Questionnaire............................................................................................................. 39
Appendix 2: Survey Methods ......................................................................................................... 45
Data Collection Methods ............................................................................................................. 45
Data Collection Outcomes .......................................................................................................... 45
Data Processing and Analysis ..................................................................................................... 45
Appendix 3: UM Bureau of Business and Economic Research and the Researchers ............. 46
Researchers ................................................................................................................................... 47
Director ...................................................................................................................................... 47
Senior Economist ...................................................................................................................... 47
Director of Survey Research .................................................................................................... 47
UNIVERSITY OF MONTANA BUREAU OF BUSINESS AND ECONOMIC RESEARCH 3Appendix 4: Detailed Responses to Open-Ended Questions ................................................... 48
Appendix 5: 2018 BLS Standard Occupation Codes of positions most frequently hired ..... 86
List of Tables
Table 1: Characteristics of Montana’s High Tech Industries, 2020 ........................................... 10
Table 2: 2005 BLS-Defined High Tech Industries ........................................................................ 12
Table 3: Top Bozeman Area Industry Subsectors ........................................................................ 36
Table 4: Bozeman Area Employment and Revenue Estimates .................................................. 36
Table 5: Top Missoula Area Industry Subsectors ......................................................................... 37
Table 6: Missoula Area Employment and Revenue Estimates ................................................... 37
Table 7: Top Kalispell Area Industry Subsectors ......................................................................... 38
Table 8: Kalispell Area Employment and Revenue Estimates ................................................... 38
Table 9: 2018 SOCs of Positions Most Frequently Hired ........................................................... 87
List of Figures
Figure 1: Locations of 2020 HTBA Members ..................................................................................8
Figure 2: Montana Earnings per Job, 2020 .................................................................................. 11
Figure 3: High Tech Business Types .............................................................................................. 13
Figure 4: Employment Distribution among High Tech Firms in Montana ............................... 14
Figure 5: HTBA Annual Wages ....................................................................................................... 15
Figure 6: 2020 HTBA Revenue by Firm......................................................................................... 16
Figure 7: Annual Revenue Growth Rate ........................................................................................ 17
Figure 8: Annual Employment Growth Rate................................................................................. 18
Figure 9: Most Often Hired Occupations...................................................................................... 19
Figure 10: Most Often Sought Skills in New Hires ...................................................................... 20
Figure 11: Additional Skills Needed by Existing Workforce...................................................... 21
Figure 12: 2020 Ease or Difficulty of Hiring Qualified Employees ........................................... 22
Figure 13: 2020 Hiring from within Montana .............................................................................. 23
Figure 14: Annual Pay Growth Rate .............................................................................................. 24
Figure 15: 2021 Planned Capital Investments in Montana ........................................................ 25
UNIVERSITY OF MONTANA BUREAU OF BUSINESS AND ECONOMIC RESEARCH 4Figure 16: 2020 Ease or Difficulty in Obtaining New Capital ................................................... 26
Figure 17: Advantages Montana Gives Firms .............................................................................. 27
Figure 18: Largest Impediment to Firm Growth .......................................................................... 28
Figure 19: Main Challenge Resulting from the COVID-19 Pandemic ...................................... 29
Figure 20: Main Opportunity Created by the COVID-19 Pandemic ......................................... 30
Figure 21: Most Important Membership Benefit ......................................................................... 31
Figure 22: Additional Respondent Observations ........................................................................ 32
Figure 23: Average Annual Wage ................................................................................................. 33
Figure 24: Total Montana Employment ........................................................................................ 34
Figure 25: Total Annual Revenue ................................................................................................... 34
Figure 26: Total Major Capital Expenditures in Montana .......................................................... 35
UNIVERSITY OF MONTANA BUREAU OF BUSINESS AND ECONOMIC RESEARCH 5Key Findings
This is the seventh annual report on the high tech industry in the state of Montana. The
Montana High Tech Business Alliance (HTBA or the Alliance), formed in 2014, is a member-
driven group of high tech businesses and other organizations statewide. The Alliance asked
the University of Montana Bureau of Business and Economic Research (BBER) to collect
information and insights from its members so that a better assessment of its economic
footprint and its prospects for continued growth could be made. This report presents the
findings of that research.
The BBER finds that on the basis of 100 HTBA member firm and 95 nonmember firm survey
completions:
• Alliance member firms and responding nonmember high tech firms report quite
similar characteristics and concerns, which adds credibility and depth to the findings
presented in this study;
• Alliance members expect to add 1,500 new jobs in 2021, making a significant
contribution to Montana’s recovery from the pandemic recession;
• Jobs with Alliance members pay considerably more than jobs elsewhere in the
economy. The average annual salary at HTBA businesses ($73,100) and nonmember
businesses ($59,500) was 59% larger than the average earnings per Montana
worker;
• By essentially any measure, growth projected in member and nonmember high tech
businesses significantly exceeds average statewide economic growth. Employment
and revenues are expected to grow roughly seven times BBER’s projected statewide
growth rate;
• The HTBA members expect to make at least $164 million in capital expenditures at
their Montana facilities in 2021. This represents a significant increase from
anticipated 2020 major capital expenditures ($133 million);
• HTBA members will raise wage rates by 5% in 2021, somewhat faster than the 4.2%
rate of growth realized in wage rates of all Montana employers in the most recent
data;
• The Montana-based activities of high tech firms were responsible for $2.9 billion in
gross sales in 2020, a robust increase over 2019 revenue ($2.5 billion);
• For the seventh year in a row, HTBA member respondents reported that Montana’s
quality of life – its lifestyle, the work/life balance available here, the recreation
opportunities, and the beauty of the landscape – provides them a significant
advantage in business. Nonmember respondents reported the same for the fifth year
in a row;
UNIVERSITY OF MONTANA BUREAU OF BUSINESS AND ECONOMIC RESEARCH 6• HTBA members and nonmembers report that finding capital, finding new customers
or raising firm visibility and hiring skilled technology workers are their firms’ largest
impediments to faster growth;
• For the first year in four years slightly more Alliance companies (12%) reported that
it was harder to obtain capital in 2020 compared to the previous year (9%);
• 20% of responding firms reported that the main COVID-related challenge they faced
was conducting internal communications and other management activities while
working remotely, while 16% of responding firms reported a loss of sales due to the
pandemic.
In addition to survey research, BBER also conducted research using data from federal
statistical agencies. While these data can only be used as a broad benchmark of high tech
economic activity, they are suggestive of the size of the high tech activity of businesses who
are not members of the Alliance. These data indicate that activity in the Montana economy
that fits a published high tech definition used in national-level research comprises about
5.8% of total wages, paying wages that approach double the overall average and are
higher than all but three other Montana industries. Based on this analysis, BBER concludes
that the aggregated responses of HTBA members reported here understate the actual size
of industry activity in Montana. While no precise estimate is possible, it is likely that the true
size of the industry is twice as large as what is reported in the survey results in this study.
Background of the Project
The Montana High Tech Business Alliance
Launched in April 2014, the Montana High Tech Business Alliance is a statewide
membership organization focused on creating more high tech jobs in Montana. The Alliance
currently has 249 member firms.
Full membership in the Alliance is available to firms engaged in high tech and
manufacturing that have operations in Montana. “High tech” is defined as firms that make
or sell high tech products, provide professional services or consulting related to high tech,
conduct e-commerce, or engage in manufacturing using skilled labor. Organizations that
are not in the high tech industry such as law firms, banks, government entities or economic
development agencies may join as affiliate members. The Alliance is recognized as a
501(c)(6) nonprofit trade association. Benefits of membership include:
• connecting with tech leaders across the state at quarterly networking events;
• promoting member companies and Montana's strong high tech and manufacturing
sector through a biweekly e-newsletter, website and other communications
channels;
• and accelerating growth by recruiting employees through a high tech jobs portal.
UNIVERSITY OF MONTANA BUREAU OF BUSINESS AND ECONOMIC RESEARCH 7The Alliance’s members are located throughout the state of Montana with more prominent
concentrations found in Gallatin, Missoula and Flathead counties, as indicated in Figure 1.
Figure 1: Locations of 2020 HTBA Members
Kalispell
(Flathead)
Missoula
(Missoula)
Bozeman
(Gallatin)
UNIVERSITY OF MONTANA BUREAU OF BUSINESS AND ECONOMIC RESEARCH 8The Bureau of Business and Economic Research
The Bureau of Business and Economic Research is the primary research unit of the University
of Montana’s College of Business. Founded in 1948, the Bureau regularly participates in
forecasting and economic analysis, survey research, industry studies, and information
dissemination. Since its founding, BBER has conducted hundreds of survey research projects
of both businesses and households, utilizing its state-of-the-art survey center.
About This Study
This is the seventh annual study conducted in order to objectively and accurately assess the
characteristics and the concerns of members of the Montana High Tech Business Alliance. Its
findings illustrate the rapidly evolving activities and concerns of the membership. It also
serves as an important assessment of one of Montana’s fastest-growing and highest-paying
industry clusters, addressing a gap in information that is available from public sources.
Because this is the seventh replication of this study, it is possible to observe some changes
that have occurred among Alliance membership and in the high tech industry as a whole.
This study also examines the characteristics and concerns of nonmember high tech firms
located in Montana. Including nonmember firms in the study provides data users a useful
glimpse into the broader population of high tech firms. Nonmember data also provide
helpful context that broadens data users’ understanding of Alliance member firms.
We begin this report with some insights on high tech activity in Montana that draw from
public data on industry aggregates. We then turn to the findings of the survey of HTBA
members, including data gathered on business activity as well as responses to open-ended
questions on their needs and concerns. Information on the methods used to derive the
results is found in an appendix.
The data presented here represent aggregated information on all HTBA members. BBER
fully respects the privacy of individual companies, and no data that might reveal individual
company information or viewpoints is contained in this report. For this study 176 of the 249
member firms, only those that work in the areas of high tech or manufacturing, were invited
to participate. In addition, 456 nonmember high tech firms were invited to participate.
This year’s survey contains two new additions. First, the study examines the main challenges
businesses faced due to the COVID-19 pandemic. Second, a brief description of the
opportunities provided to some businesses by the COVID-19 pandemic is presented. As
always, trends in wages, employment, revenue, and capital expenditures over the seven
years the survey has been conducted are examined at the end of this report.
UNIVERSITY OF MONTANA BUREAU OF BUSINESS AND ECONOMIC RESEARCH 9Measuring High Tech Business Activity
In this study, we present the results of a survey of high tech businesses in Montana. It is
instructive, however, to get a sense of the industry from the federal government statistical
data before turning to the survey-based results. Adopting a nationally-derived definition of
“high tech” (defined in the paragraphs that follow), the data suggest that the presence of
high-tech economic activity in Montana is considerable, as shown below in Table 1. To put
these broad estimates into context, Montana high-tech companies accounted for 5.8% of
total Montana wages, 3.4% of total Montana payroll jobs, and 5.9% of Montana business
establishments in 2020. The data suggest that high tech companies here are relatively
small-sized, but pay wages well above the state’s overall average.
Table 1: Characteristics of Montana’s High Tech Industries, 2020
Category 2020 2019 2020 Change
Wages ($ mill.) $1,242.68 $1,152.25 7.8%
Employment 15,772 15,580 1.2%
Establishments 3,004 2,776 8.2%
Wages per Job $78,791 $73,958 6.5%
Jobs per establishment 5.25 5.61 -6.4%
Note: Figures derived using Hecker (2005) definition of
industry described below. Source: U.S. Bureau of Labor
Statistics.
While broad, the estimates in Table 1 suggest that the high tech industry is a significant
economic contributor. Furthermore, the publicly available data suggest that the industry’s
presence continues to grow. When compared to 2019, the total number of establishments
in the state grew by 8.2% in 2020, while wages grew by 7.8% and employment grew by
1.2%. Montana’s high tech firms are becoming more numerous. They also are paying higher
wages. Wages per job grew by 6.5% in 2020.
The data also suggest that Montana’s high-tech employers pay considerably more in
FY2020 than the state average and rank among the highest paying Montana industries, as
shown in Figure 2. The average wages per job in Montana high tech companies was
$78,791 per year, or roughly 71% higher than the state average of $46,144 per year for all
Montana industries. The wages do not include the value of benefits. As is clear from Figure
2 below, only three industries in the state paid higher average wages.
UNIVERSITY OF MONTANA BUREAU OF BUSINESS AND ECONOMIC RESEARCH 10Figure 2: Montana Earnings per Job, 2020
All Industries $46,144
Mining $90,572
Utilities $89,833
Management $84,416
High Tech $78,791
Finance $72,080
Prof. & Tech. Services $68,445
Wholesale Trade $62,695
Information $58,279
Construction $55,039
Public Administration $54,886
Manufacturing $52,241
Health Care $51,979
Transp. & Warehousing $48,030
Education $42,673
Agriculture $39,868
Real Estate $39,583
Administrative Support $36,966
Other Services $32,903
Retail Trade $32,158
Arts and Entertain. $24,985
Accommodation & Food $19,672
$0 $25,000 $50,000 $75,000 $100,000
These data can only be considered as suggestive of the size of Montana’s high tech
industry. Much more refined analysis and better-defined data are needed to isolate and
identify the characteristics of our state’s high-tech producers. But the data clearly indicate
that Montana’s high tech sector is a sizable source of economic activity in the state.
The direct measurement of high tech business activity in the economy has always been
hampered by two issues: 1) the lack of a consistent definition, and 2) the shortcomings of
UNIVERSITY OF MONTANA BUREAU OF BUSINESS AND ECONOMIC RESEARCH 11publicly available data in adequately capturing whatever definitions are used. Simply put,
estimates of high tech business activity derived from the standard sources for economic
data shown above – the federal government statistical agencies – miss some activities that
are clearly high tech and count other activities that are not.
A study by the U.S. Bureau of Labor Statistics in 2005 used a very conservative definition of
the high tech industry, detailed in Table 2, to track national high tech growth. It was based
on a national-level analysis that considered industries to be high tech if they:
• Employed a high proportion of scientists, engineers, and technicians,
• Had a high proportion of R&D employment,
• Produced a high tech product, or
• Used high tech production methods.
Table 2: 2005 BLS-Defined High Tech Industries
NAICS Code Definition
3254 Pharmaceutical and medicine manufacturing
3341 Computer and peripheral equipment manufacturing
3342 Communications equipment manufacturing
3344 Semiconductor and electronic component
manufacturing
3345 Electronic instrument manufacturing
3364 Aerospace product and parts manufacturing
5112 Software publishers
516 Internet publishing and broadcasting
517 Telecommunications
518 Data processing, hosting and related services
5413 Architectural and engineering services
5415 Computer systems design and related services
5417 Scientific research and development services
Source: Hecker (2005).
We use this definition to identify high tech in the public data. Clearly such discrete
classifications miss some high tech firms and include others that are not high tech. It is
certain that the classification does not match the composition of HTBA membership. Thus,
we must examine the survey results to more fully reflect the composition of the high tech
industry in Montana.
UNIVERSITY OF MONTANA BUREAU OF BUSINESS AND ECONOMIC RESEARCH 12Results
The paragraphs that follow present the findings of the Montana High Tech Business Alliance
survey that was conducted from January 2021 to March 2021. This section of the report is
organized in the order that the questions appeared in the questionnaire, and the text of
each question is provided to assist the reader.
Q1. Which high tech sub-industry best represents your company?
Figure 3 describes the members of the High Tech Business Alliance as of December 2020
by their type of business. HTBA consists of businesses from a wide range of industry sectors.
Software, professional services, consulting and manufacturing firms are the four most
common firm types in the Alliance. Among nonmember firms, manufacturing and software
were the most common firm types.
Figure 3: High Tech Business Types
Software, SaaS 13% 25%
Professional Services 8% 10%
Consulting 6% 9%
Manufacturing 7% 23%
Advertising/Marketing 6%7%
Telecommunications 4%5%
Funding, Angel Investing, Venture Capital 0% 5%
Digital Media, Broadcasting, Publishing 5%
4%
Other 2% 4%
Financial Services, Payment Processing 2% 3%
Construction 2%3%
Consumer Products 3%
4%
Medical, Healthcare Devices 2%
2%
Engineering 2%
2%
Cyber Security 1%2%
Ecommerce 2%
1%
Data Storage 2%
2%
Aerospace, Automotive, Transportation 2%3%
Data Analytics 1%
2%
Biotechnology 1% 6%
Nanotechnology 1%
0%
Education, Training 1%2%
Photonics 2%
Energy, Extractive Minerals 3%
0% 5% 10% 15% 20% 25% 30%
Member Nonmember
UNIVERSITY OF MONTANA BUREAU OF BUSINESS AND ECONOMIC RESEARCH 13Q2. How many employees does your company have in total?
Q3. How many employees does your company have in Montana?
Almost three quarters (71%) of Alliance high tech firms employed 26 or fewer people in
Montana. Figure 4 describes the distribution of employment sizes among the Montana High
Tech Business Alliance. HTBA members employed 5,410 Montana workers as of December
2020. Nonmember firms employed an additional 12,050 Montana workers.
Figure 4: Employment Distribution among High Tech Firms in Montana
35% 33%
32%
30%
27%
24% 24%
25% 23%
19%
% of Firms
20%
17%
15%
10%
5%
0%Q4. What is your company’s average annual Montana wage?
The members of the HTBA and responding nonmember firms provide high-paying jobs for
Montanans. Figure 5 below illustrates that HTBA jobs pay 59% more than Montana’s
average annual wage per worker. 1
Figure 5: HTBA Annual Wages
$80,000
$73,100
$70,000 $67,700
$59,500
$60,000
$50,000 $46,100
$40,000
$30,000
$20,000
$10,000
$0
Average Alliance Average Nonmember Average Alliance MT Average Annual
Annual Wage (2020) Annual Wage (2020) Annual Wage (2019) Wage (2020)
2020 Changes. Average annual wages paid by Alliance member firms increased by 8%
from 2019 to 2020. The increase in average Alliance wages is essentially identical to the
wage increase of 7.8% found in publicly available data for all 3,004 Montana high tech
firms. In addition, Alliance annual wages increased at a rate that significantly exceeded the
2020 national inflation rate of 1.2%. 2
1
Sources: UM Bureau of Business and Economic Research and U.S. Bureau of Labor Statistics State
and Area Employment, Hours, and Earnings, Total 2020 Private Earnings in Montana.
2
Source: Bureau of Labor Statistics, U.S. Department of Labor. The Consumer Price Index – All was
1.2 percent for 2020.
UNIVERSITY OF MONTANA BUREAU OF BUSINESS AND ECONOMIC RESEARCH 15Q5. What were your company’s annual revenues in 2020?
Montana high tech companies (Alliance members and nonmembers) are a very important
component of Montana’s economy in terms of revenue. The Montana-based portions of
high tech firms generated an estimated $2.9 billion in 2020 revenue. Examining company
revenue, Figure 6 shows that Alliance members and nonmembers range from start-ups with
very little, if any, revenue to Fortune 500 companies.
Figure 6: 2020 HTBA Revenue by Firm
50%
40%
29%
30% 28%
27% 26%
24% 23%
23%
20%
20%
10%
0%Q6. By what percentage do you estimate your company’s annual revenues will increase or
decrease next year (2021)?
Montana’s high tech companies still anticipate growing very quickly. Figure 7 demonstrates
that Montana HTBA firms anticipate growing more than 7 times faster than the Montana
economy as a whole. 3 Responding nonmember firms anticipate growing at four times the
rate of the entire Montana economy.
Figure 7: Annual Revenue Growth Rate
25%
20% 20%
20%
15%
10%
10%
5%
3%
0%
Median Projected Median Projected Median Projected Montana's Projected
Revenue Growth per Revenue Growth per Revenue Growth per Growth in Nonfarm
Alliance Firm 2021 Nonmember Firm 2021 Alliance Firm 2020 Earnings 2020
2020 Changes. 2021 projected median Alliance revenue growth per firm (20%) stayed
steady when compared to 2020 projected growth (20%). 2021 projected revenue growth
aligns well with projected 2021 employment growth presented on the next page. The
continuing anticipation of fast growth is an indication of the entrepreneurial nature of the
firms in the Alliance.
3
Bureau of Business and Economic Research. Economic Outlook Seminar 2021: The Economic
Outlook for Montana.
UNIVERSITY OF MONTANA BUREAU OF BUSINESS AND ECONOMIC RESEARCH 17Q7. About how many new jobs do you expect your company will create in Montana next
year (2020)?
Montana’s high tech firms anticipate adding an estimated 1,500 new jobs in Montana in
2021. This annual industry employment growth rate (9%) is significantly faster than
Montana’s COVID-influenced 2020 total employment growth rate of -2.7% (see Figure 8
below) 4.
Figure 8: Annual Employment Growth Rate
25.0%
20.0%
20.0%
16.0%
15.0%
10.0%
5.0%
5.0%
0.0%
Alliance Firms 2021 Nonmember Firms Alliance Firms 2020 All MT Employers
2021 2020
-2.7%
-5.0%
2020 Changes. 2021 projected employment growth is slightly lower than 2020 projected
employment growth. 2021 employment growth aligns well with projected 2021 revenue
growth presented on the previous page.
4
Montana Department of Labor and Industry. Employment and Unemployment Statistics – LAUS, 3rd
quarter 2020 to 3rd quarter 2019, accessed April 20, 2021.
UNIVERSITY OF MONTANA BUREAU OF BUSINESS AND ECONOMIC RESEARCH 18Q8. What are the job titles of the three job types that your firm most often hires?
Of the 397 responses given to this question, the most frequently cited job title was software
developer or computer programmer, which was cited in 23% of all responses (see Figure 9).
Engineers (10% of responses) were next most often cited. Sales representatives were cited
in 8% of responses. Respondents mentioned a total of 75 distinct job titles.
Figure 9: Most Often Hired Occupations
Software developer or computer programmer 17% 5%
Engineers other 4% 6%
Sales representatives 6% 2%
Facilities managers 2% 3%
Securities, commodities and financial services sales
Standard Occupation Code
2% 1%
agents
Public relations and fundraising managers 3% 1%
Chief executives 2% 1%
Business operations specialists 2%1%
Assemblers and fabricators 1%1%
Customer service representatives 2%
Medical scientists 1%1%
Administrative services managers 1%2%
Accountants 1%
1%
0% 5% 10% 15% 20% 25%
% of All Responses
Member Nonmember
All answers to this question were coded by U.S. Bureau of Labor Statistics 2018 Standard
Occupational Classification (SOC). 5 The complete table presenting the frequency of
responses by 2018 SOC may be found in Appendix 5.
5
The 2018 direct match file may be found here:
https://www.bls.gov/soc/2018/soc_2018_direct_match_title_file.pdf
UNIVERSITY OF MONTANA BUREAU OF BUSINESS AND ECONOMIC RESEARCH 19Q9. What are the three job-related skills your firm looks for most in new hires?
Of the 416 responses received for this question, coding or programming skills in new hires
was cited most often (7% of responses) as Figure 10 illustrates. Sales or marketing skills (6%
of responses) and communication skills (6% of responses) were next most frequently
mentioned. Experience in general (5% of responses) and problem solving skills (5% of
responses) were the 3rd most often cited skills.
Figure 10: Most Often Sought Skills in New Hires
Coding, programming, software development 5% 2%
Sales or marketing 4% 2%
Communication skills 4% 2%
Experience general 2% 3%
Problem solving, decision making, planning 2% 3%
Technical skill 3% 1%
Job Skill
Customer service skills 2% 1%
Software use 1% 2%
General soft skills 1% 1%
Science or math knowledge 1% 2%
Attitude, personality 1% 2%
Writing, editing 1% 1%
Engineering 1% 1%
Ability to work with people, develop relationships,
1% 1%
networking
0% 2% 4% 6% 8% 10%
% of All Responses
Member Nonmember
UNIVERSITY OF MONTANA BUREAU OF BUSINESS AND ECONOMIC RESEARCH 20Q10. Thinking now about your existing workforce, what are the three job-related skills that
you would like to add to, or improve, in your current workforce?
Respondents provided a total of 309 answers to question 10. Respondents (16% of all
responses) most often said they would like to add or improve sales or marketing skills
among their existing workforce. Next most frequently cited (10% of responses) was adding
or improving business management or project management skills in their existing
workforce. The third most often cited skill needed by the existing workforce was leadership
or supervisory skill (7% of responses). Figure 11 below presents the answers to question 10.
Figure 11: Additional Skills Needed by Existing Workforce
Sales or marketing 10% 6%
Business management or project management 5% 5%
Leadership, supervisory 4% 3%
Coding, programming, software development 5% 1%
Communication skills 3% 3%
Additional Skill
Accounting, financial 2% 2%
Technical skill 3% 1%
Problem solving, decision making, planning 1% 3%
General soft skills 1% 3%
Server or system administration 2% 1%
Data networking, data science, database, cloud 2% 1%
0% 5% 10% 15% 20%
% of All Responses
Member Nonmember
UNIVERSITY OF MONTANA BUREAU OF BUSINESS AND ECONOMIC RESEARCH 21Q11. Some Montana employers say that it is hard for their firm to find qualified new
employees. Other Montana employers say that it isn't hard for their firm. Over the course of
calendar year 2020 would you say that for your firm it has become easier, there has been no
change, or it is harder to hire qualified new employees?
Two of every 10 Alliance employers (22%) reported that it became harder for their firm to
hire qualified workers over the course of 2020 (see Figure 12). A larger fraction (37%) of
nonmembers said that hiring got harder during 2020. A majority of Alliance members (64%)
and nonmembers (52%) observed no change in hiring ease or difficulty. About 14% of
Alliance employers and 11% of nonmember employers said hiring qualified workers
became easier during 2020.
Figure 12: 2020 Ease or Difficulty of Hiring Qualified Employees
70%
64%
59%
60%
52% 53%
50%
40% 37%
35%
32%
30%
22%
20%
14% 15%
11%
10% 6%
0%
Easier to hire in Easier to hire in No change in No change in Harder to hire Harder to hire
2020 2019 hiring ability in hiring ability in in 2020 in 2019
2020 2019
Member Nonmember
2020 Changes. Fewer Alliance members (22%) reported that it was harder to hire in 2020
when compared to 2019 (32%).
UNIVERSITY OF MONTANA BUREAU OF BUSINESS AND ECONOMIC RESEARCH 22Q12. Over the course of calendar year 2020 what percentage of your firm's new hires came
from within Montana and what percentage came from out of state?
Alliance firms reported hiring 70% of their new employees from within Montana during
2020 (see Figure 13). About 30% of new Alliance company employees came from outside
Montana. Nonmember firms reported a slightly higher within Montana hiring rate, 76%.
This survey result represents the fourth year of the Alliance’s attempt to measure state of
origin for new hires among Montana businesses. This effort is providing consistent
estimates that indicate that Montana’s high tech industries hire Montana workers.
Figure 13: 2020 Hiring from within Montana
100%
80%
76% 75%
75% 70%
50%
30%
24% 25%
25% 20%
0%
% 2020 new hires from % 2019 new hires from % 2020 new hires from % 2019 new hires from
within Montana within Montana outside Montana outside Montana
Member Nonmember
2020 Changes. Alliance members’ in-state hiring rate in 2020 declined slightly when
compared to 2019 (75%) and 2018 (75%).
UNIVERSITY OF MONTANA BUREAU OF BUSINESS AND ECONOMIC RESEARCH 23Q13. By what percentage do you estimate your company’s annual Montana wages may
increase or decrease next year (2021)?
The annual pay of Montana’s HTBA employees and nonmember firm employees in 2021 is
projected to grow somewhat faster than that of all Montanans. Figure 14 shows that HTBA
and nonmember tech firm wages are projected to grow by 5% in 2021 while in 2020
Montana annual wages grew 4.2% 6.
Figure 14: Annual Pay Growth Rate
6.0%
5.0% 5.0%
5.0%
4.2%
4.0% 4.0%
4.0%
3.0%
2.0%
1.0%
0.0%
Alliance Firms Nonmember Firms Alliance Firms Nonmember Firms All MT Employers
2021 2021 2020 2020 2020
2020 Changes. 2021 projected Alliance annual wage growth per firm is the same as 2020
projected wage growth.
6
U.S. Bureau of Labor Statistics. Occupational Employment and Wage Statistics. Annual mean wage
for all occupations in Montana, downloaded April 21, 2021.
UNIVERSITY OF MONTANA BUREAU OF BUSINESS AND ECONOMIC RESEARCH 24Q14. About how much money do you anticipate your company will invest in major capital
expenditures in Montana next year (2021)?
HTBA companies plan to make $164 million in major capital investments in Montana in
2021, which will add a significant number of additional construction and support jobs in the
state (see Figure 15). The responding nonmember firms reported plans to spend an
additional $59 million in major capital investments in Montana in 2021.
Figure 15: 2021 Planned Capital Investments in Montana
$180
$164
$160
$140 $133
$120
Millions ($)
$100
$80
$59
$60 $54
$40
$20
$0
Alliance Firms 2021 Nonmember Firms Alliance Firms 2020 Nonmember Firms
2021 2020
2020 Changes. 2021 anticipated Alliance major capital expenditures ($164 million)
increased over 2020 anticipated major capital expenditures ($133 million).
UNIVERSITY OF MONTANA BUREAU OF BUSINESS AND ECONOMIC RESEARCH 25Q15. Some Montana employers say that it is hard for their firm to acquire new capital. Other
Montana employers say that it isn't hard for their firm. Over the course of calendar year
2020 would you say that for your firm it has become easier, there has been no change, or it
is harder to acquire new capital?
In 2020, 12% of Alliance firms reported that it was more difficult for their firm to obtain new
capital (see Figure 16). A large majority (72%) observed no change in the ease or difficulty
of obtaining capital. About 16% said that obtaining new capital was easier in 2019. More
nonmember firms reported that it was easier to obtain capital in 2020 (19%) than did
Alliance member firms.
Figure 16: 2020 Ease or Difficulty in Obtaining New Capital
80%
72%
69%
70%
60%
50%
40%
30%
19%
20% 16%
12% 12%
10%
0%
Easier to acquire capital in 2020 No change in ability to acquire Harder to acquire capital in 2020
capital 2020
Members Nonmembers
2020 Changes. For the first year in the last four years, the proportion of 2020 Alliance
companies (12%) that reported it was harder to obtain capital increased slightly when
compared to the previous year (9%).
UNIVERSITY OF MONTANA BUREAU OF BUSINESS AND ECONOMIC RESEARCH 26Q16. What advantage does Montana give you in business?
HTBA members and nonmember high tech firms provided 179 responses to this question.
The most often reported advantage (32% of all responses) was quality of life in Montana
(see Figure 17). Montana’s high quality workforce was next the most frequently cited
advantage. There was no change in the percentage of 2020 Alliance members responses
(11% of Alliance member responses) stating that Montana gives them no advantage
compared with 2019.
Figure 17: Advantages Montana Gives Firms
QOL in general, great place to live 20% 12%
None, negative comment, disadvantage mentioned 6% 7%
Work force quality, work ethic 6% 4%
Access to other businesses 6% 1%
Client base is here, small population helps marketing 2% 4%
Advantage
Funding access 2% 2%
Access to legislators, etc., government support 1% 3%
Access to educational institutions 2% 2%
Affordable rent, cost of living low 2% 1%
Low labor costs 2%1%
Reputation, international reputation 2%1%
0% 10% 20% 30% 40%
% of All Responses
Member Nonmember
The following are selected comments that provide the reader additional insight into HTBA
members’ opinions.
• “Montana provides a great environment to live and raise a family.”
• “Good work ethic among employees, and when dealing internationally, Montana has
a reputation for being an honest place so there's an immediate degree of trust.”
• “We prefer people who are already in Montana as they stay longer, stronger work
ethic, better cultural fit to our lifestyle.”
UNIVERSITY OF MONTANA BUREAU OF BUSINESS AND ECONOMIC RESEARCH 27Q17. What is your largest impediment to faster growth?
Question 17 received 165 answers. HTBA members most often reported a need for access
to capital (12% of responses) as their firm’s largest impediment to growth (see Figure 18). A
need for new customers, visibility or marketing was next most frequently mentioned (10%
of responses) followed by quality worker availability (8%). Nonmembers most often
reported lack of access to capital (8%) and lack of quality available workers (8%).
Figure 18: Largest Impediment to Firm Growth
Capital access 12% 8%
New customers needed, visibility, marketing 10% 7%
Quality worker availability 8% 8%
Internal issue 4% 3%
COVID-19 1% 4%
Impediment
Hiring ability 2% 4%
Other 2% 2%
Real estate cost, availability 2% 2%
Market conditions, competition 1% 4%
Regulations 2% 1%
Travel cost, shipping cost 2% 1%
Labor, benefits cost 1%2%
0% 5% 10% 15% 20% 25%
% of All Responses
Member Nonmember
The comments displayed below give more perspective on HTBA members’ opinions.
• “Capital, traditional or otherwise. There is not enough support with substantial
capital for new and fast growing companies that don't fit the traditional 'tech'
mold.”
• “The challenge to acquire early seed funding has been our greatest impediment
thus far.”
• “For our product line of business, effective marketing was the largest
impediment.”
UNIVERSITY OF MONTANA BUREAU OF BUSINESS AND ECONOMIC RESEARCH 28Q18. What is the main challenge your business has faced as a result of the COVID-19
pandemic?
Respondents gave 175 responses to this question. Alliance members and nonmember firms
combined (20% of all responses) most often said that the main COVID-related challenge
their business faced was conducting non-client (internal) communications and other
management difficulties resulting from remote working. Figure 19 presents the main
challenges high tech businesses faced as a result of the pandemic. Loss of sales or economic
uncertainty was the next most frequently cited challenge (16% of all responses).
Figure 19: Main Challenge Resulting from the COVID-19 Pandemic
Non-client communications and management difficulties
9% 11%
resulting from remote working
Loss of sales, economic uncertainty 9% 7%
Marketing, sales, client communications difficult due to no
6% 5%
conferences, etc.
Absenteeism, loss of employees 3% 7%
COVID-19 Challenge
General safety concerns 3% 5%
Clients shutting down 4% 2%
Sourcing components 2% 4%
None 4% 2%
Travel hindered 2% 2%
Keeping up with increased demand 3% 1%
Shutdown or partial shutdown or switch to different product 2% 2%
Shipping and receiving delays 1%2%
0% 5% 10% 15% 20% 25%
% of All Responses
Member Nonmember
The comments below illustrate HTBA members’ experiences.
• “Zoom calls, the majority of our previous creative development meetings were
always in person which gave us maximum communication.”
• “Collaboration with a partitioned workforce - between working in plant vs
remote.”
• “Lack of sales to places that are closed, universities, businesses, etc.”
• “Clients are slow to pay. Many clients went out of business. “
UNIVERSITY OF MONTANA BUREAU OF BUSINESS AND ECONOMIC RESEARCH 29Q19. What is the main opportunity for your business created by the COVID-19 pandemic (if
any)?
Fewer respondents (148) cited opportunities created by COVID-19 compared to challenges
(175). Both Alliance members and nonmembers reported two main opportunities created
by the COVID-19 pandemic. First, 25% of all responses cited an increased acceptance of or
need for digital or other technology. Second, 25% of all responses said the firm
experienced increased sales. Figure 20 displays respondents’ reports on the opportunities
created by the pandemic.
Figure 20: Main Opportunity Created by the COVID-19 Pandemic
Increased acceptance of or need for digital or other tech 16% 9%
Increased sales, business 14% 11%
None 5% 10%
Remote working 7% 4%
COVID-19 Opportunity
Extra funding available 3% 3%
Pursuit of new markets, clients 3% 3%
Other 2% 2%
Improved communication 2% 1%
Restructuring 1%
Fewer extra meetings 1%1%
Moved production to Montana 1%
0% 5% 10% 15% 20% 25%
Member Nonmember % of All Responses
The following are examples of respondents’ descriptions of the opportunities they
encountered.
• “People working from home creating demand for networking and remote
offices.”
• “Increase in service revenue and system upgrades. More people are spending
more time at home and need high performance networks. They also want more
entertainment systems.”
• “Covid provided a tailwind for our business due to social distancing and focus on
recreation.”
UNIVERSITY OF MONTANA BUREAU OF BUSINESS AND ECONOMIC RESEARCH 30Q20. What is the one most important thing you would like to get out of your Montana High
Tech Business Alliance membership?
This question was asked of Alliance members only, who provided 84 responses. Alliance
members most often said that they want networking opportunities (31% of responses).
Figure 21 examines the membership benefits that respondents said are most important.
Another 18% of responding Alliance members want mentoring or assistance programs or
learning opportunities. The next ranked benefit (14% of responses) was obtaining new
clients or business opportunities or collaboration.
Figure 21: Most Important Membership Benefit
Networking or contact in general 31%
Mentor or assistance programs or problem solving
18%
or learning opportunities
New clients or business opportunity or
14%
collaboration
Most Important Benefit
Unified legislative voice 8%
Community involvement or growing tech in
8%
Montana or unified voice for tech
Hiring issues discussed or access to employee
8%
candidates
Investment or capital access 5%
News of other high tech in MT 2%
0% 10% 20% 30% 40%
% of All Responses
The comments below illustrate members’ opinions.
• “Networking with other MT based CEOs, diversity plans and workshops,
materials for relocating employees to MT, sell packages.”
• “Mentorship from seasoned business leaders and entrepreneurs.”
• “Getting to meet people who may have potential interest in our work.”
UNIVERSITY OF MONTANA BUREAU OF BUSINESS AND ECONOMIC RESEARCH 31Q21. What additional comments do you have? The Montana High Tech Business Alliance is
particularly interested in your observations about improving Montana's business climate
and creating new Montana jobs.
Please see Figure 22 for a summary of the most common observations by members and
nonmembers, out of a total of 65 responses.
Figure 22: Additional Respondent Observations
General positive statement about Alliance 11% 2%
Lack of qualified workers, need for good
3% 9%
employees, training
Real estate cost, affordable housing 5% 6%
Additional Observation
General description of their business 5% 6%
Travel transport needs 3% 5%
Smaller company needs, want less regulation 5%
Need for diversity in hiring 5%
Want networking and meetings to come back 3%
Economic damage of high-paying jobs driving
2% 2%
up prices
0% 5% 10% 15%
% of All Responses
Member Nonmember
The following comments illustrate respondents’ opinions.
• “MHTBA has been a great partner for us. Keep up the good work.”
• “Even though we are a high paying employer, there is still a lack of qualified
machinists in Montana that have a desire to be employed.”
• “It has been difficult to find housing for employees when they want to move here
from other parts of the state or from out of state.”
• “I have the work to expand but real estate for anything commercial is ridiculously
priced right now!”
UNIVERSITY OF MONTANA BUREAU OF BUSINESS AND ECONOMIC RESEARCH 32High Tech Firm Trends
This section presents four charts that illustrate trends in key indicators among Montana high
tech firms. Three of the four indicators (total Montana employment, total Montana-
generated revenue, and total Montana capital expenditures) are influenced not only by
overall growth in Montana’s high tech industry sector but by changes in the number of
Alliance member firms over the seven years of data collection.
Annual Wage
Average annual wages paid by Alliance members have increased each year since the annual
survey first started.
Figure 23: Average Annual Wage
$80,000
$73,100
$70,000 $67,700
$65,000
$63,000
$60,000
$60,000
$56,800
$50,700
$50,000
$40,000
2014 2015 2016 2017 2018 2019 2020
Source: Annual High Tech Business Survey
UNIVERSITY OF MONTANA BUREAU OF BUSINESS AND ECONOMIC RESEARCH 33Montana Employment
Total Montana employment of all firms has also increased each year.
Figure 24: Total Montana Employment
16,000 15,770
15,580
15,210
15,069
15,000
14,581
14,055
13,934
14,000
13,000
2014 2015 2016 2017 2018 2019 2020
Source: U.S. Bureau of Labor Statistics
Total Annual Montana-Generated Revenue
Revenue generated in Montana by high tech firms grew steadily each year the survey was
administered.
Figure 25: Total Annual Revenue
$3,000,000,000 $2,900,000,000
$2,500,000,000
$2,500,000,000
$2,000,000,000
$2,000,000,000
$1,667,000,000
$1,579,000,000
$1,500,000,000
$867,000,000
$1,000,000,000
$632,000,000
$500,000,000
$0
2014* 2015* 2016 2017 2018 2019 2020
Source: Annual High Tech Business Survey,
nonmember firms surveyed starting in 2016
UNIVERSITY OF MONTANA BUREAU OF BUSINESS AND ECONOMIC RESEARCH 34Total Capital Expenditures in Montana
Major capital expenditures in Montana by high tech firms have been more volatile than
annual wages or employment.
Figure 26: Total Major Capital Expenditures in Montana
$240,000,000 $223,000,000
$200,000,000 $187,000,000
$159,000,000
$160,000,000
$123,000,000
$120,000,000 $107,000,000
$95,000,000
$80,000,000
$35,000,000
$40,000,000
$0
2014* 2015* 2016 2017 2018 2019 2020
Source: Annual High Tech Business Survey,
nonmember firms surveyed starting in 2016
UNIVERSITY OF MONTANA BUREAU OF BUSINESS AND ECONOMIC RESEARCH 35Montana’s Top Tech Regions
This section of the report presents information about the three areas of Montana that
contain the highest concentrations of tech firms: Bozeman, Missoula, and Kalispell. For each
of these areas the report lists the top high tech firms in the area (in alphabetical order), the
top industry subsectors in the area ranked by number of firms. Readers should keep in mind
that the information reported below represents only sampled firms.
Bozeman Area
Table 3: Top Bozeman Area Industry Subsectors
% of
Top Industry Subsectors Rank Sampled
Firms
Manufacturing 1 18%
Software/SaaS 2 15%
Biotechnology 4 9%
Professional Services 4 9%
Advertising/Marketing 5 6%
Consulting 6 6%
Digital
8 4%
Media/Broadcasting/Publishing
Photonics 8 4%
Consumer Products 13 3%
Engineering 13 3%
Funding/Angel Investing/Venture
13 3%
Capital
Aerospace/Automotive/Transportation 13 3%
Telecommunications 13 3%
Cyber Security 17 2%
Data Storage 17 2%
Education/Training 17 2%
Financial Services/Payment Processing 17 2%
Ecommerce 19 2%
Medical/Healthcare Devices 19 2%
Data Analytics 20 1%
Table 4: Bozeman Area Employment and Revenue Estimates
Total number of 2020 MT
5,300
employees
Total 2020 MT Revenue $1 billion
UNIVERSITY OF MONTANA BUREAU OF BUSINESS AND ECONOMIC RESEARCH 36Missoula Area
Table 5: Top Missoula Area Industry Subsectors
% of
Top Industry Subsectors Rank Sampled
Firms
Software/SaaS 1 18%
Manufacturing 2 15%
Professional Services 3 10%
Consulting 4 8%
Advertising/Marketing 5 7%
Biotechnology 6 6%
Digital
8 5%
Media/Broadcasting/Publishing
Medical/Healthcare Devices 8 5%
Consumer Products 11 3%
Energy/Extractive Minerals 11 3%
Telecommunications 11 3%
Data Storage 14 2%
Data Analytics 14 2%
Construction 14 2%
Cyber Security 15 1%
Table 6: Missoula Area Employment and Revenue Estimates
Total number of 2020 MT
5,100
employees
Total 2020 MT Revenue $940,000,000
UNIVERSITY OF MONTANA BUREAU OF BUSINESS AND ECONOMIC RESEARCH 37Kalispell Area
Table 7: Top Kalispell Area Industry Subsectors
% of
Top Industry Subsectors Rank Sampled
Firms
Manufacturing 1 29%
Software/SaaS 2 18%
Consulting 3 9%
Advertising/Marketing 5 6%
Aerospace/Automotive/Transportation 5 6%
Digital
6 4%
Media/Broadcasting/Publishing
Biotechnology 12 3%
Energy/Extractive Minerals 12 3%
Engineering 12 3%
Financial Services/Payment Processing 12 3%
Medical/Healthcare Devices 12 3%
Telecommunications 12 3%
Table 8: Kalispell Area Employment and Revenue Estimates
Total number of 2020 MT
2,100
employees
Total 2020 MT Revenue $309,000,000
UNIVERSITY OF MONTANA BUREAU OF BUSINESS AND ECONOMIC RESEARCH 38Appendix 1: Questionnaire
Q1 Which high tech sub industry best represents your company? Please click only one
response.
Advertising/Marketing (1)
Aerospace/Automotive/Transportation (2)
Biotechnology (3)
Consulting (4)
Consumer Products (5)
Cyber Security (6)
Data Analytics (7)
Data Storage (8)
Digital Media/Broadcasting/Publishing (9)
Ecommerce (10)
Education/Training (11)
Energy/Extractive Minerals (12)
Engineering (13)
Financial Services/Payment Processing (14)
Funding/Angel Investing/Venture Capital (15)
Manufacturing (16)
Medical/Healthcare Devices (17)
Nanotechnology (18)
Professional Services (19)
Software/SaaS (20)
Telecommunications (21)
Other (please specify below:) (22)
________________________________________________
Construction (23)
Page Break
UNIVERSITY OF MONTANA BUREAU OF BUSINESS AND ECONOMIC RESEARCH 39Q2 How many employees does your company have total? Please include all states and
countries. If self-employed, indicate one employee. Your best guess is ok.
Total number of employees (1) ________________________________________________
Page Break
Q3 How many employees does your company have in Montana?
Number of Montana employees (1)
________________________________________________
Page Break
Q4 What is your company’s average annual Montana wage?
Average annual wage ($) (1) ________________________________________________
Page Break
Q5 What were your company’s annual revenues in 2020? Your best guess is ok.
Annual 2020 revenues ($) (1) ________________________________________________
Page Break
Q6 By what percentage do you estimate your company’s annual revenues will increase or
decrease next year (2021)? Your best guess is ok.
Expected 2021 revenue increase (%) (1)
________________________________________________
Expected 2021 revenue decrease (%) (2)
________________________________________________
UNIVERSITY OF MONTANA BUREAU OF BUSINESS AND ECONOMIC RESEARCH 40You can also read