BREEDS: BENCHMARKS FOR SUBPOPULATION SHIFT - OpenReview
←
→
Page content transcription
If your browser does not render page correctly, please read the page content below
Under review as a conference paper at ICLR 2021

B REEDS : B ENCHMARKS FOR S UBPOPULATION S HIFT
 Anonymous authors
 Paper under double-blind review

                                             A BSTRACT
         We develop a methodology for assessing the robustness of models to subpopulation
         shift—specifically, their ability to generalize to novel data subpopulations that were
         not observed during training. Our approach leverages the class structure underlying
         existing datasets to control the data subpopulations that comprise the training and
         test distributions. This enables us to synthesize realistic distribution shifts whose
         sources can be precisely controlled and characterized, within existing large-scale
         datasets. Applying this methodology to the ImageNet dataset, we create a suite
         of subpopulation shift benchmarks of varying granularity. We then validate that
         the corresponding shifts are tractable by obtaining human baselines. Finally, we
         utilize these benchmarks to measure the sensitivity of standard model architectures
         as well as the effectiveness of existing train-time robustness interventions.

1    I NTRODUCTION
Robustness to distribution shift has been the focus of a long line of work in machine learning (Schlim-
mer & Granger, 1986; Widmer & Kubat, 1993; Kelly et al., 1999; Shimodaira, 2000; Sugiyama et al.,
2007; Quionero-Candela et al., 2009; Moreno-Torres et al., 2012; Sugiyama & Kawanabe, 2012).
At a high-level, the goal is to ensure that models perform well not only on unseen samples from the
datasets they are trained on, but also on the diverse set of inputs they are likely to encounter in the
real world. However, building benchmarks for evaluating such robustness is challenging—it requires
modeling realistic data variations in a way that is well-defined, controllable, and easy to simulate.
Prior work in this context has focused on building benchmarks that capture distribution shifts caused
by natural or adversarial input corruptions (Szegedy et al., 2014; Fawzi & Frossard, 2015; Fawzi et al.,
2016; Engstrom et al., 2019b; Ford et al., 2019; Hendrycks & Dietterich, 2019; Kang et al., 2019),
differences in data sources (Saenko et al., 2010; Torralba & Efros, 2011; Khosla et al., 2012; Tommasi
& Tuytelaars, 2014; Recht et al., 2019), and changes in the frequencies of data subpopulations (Oren
et al., 2019; Sagawa et al., 2020). While each of these approaches captures a different source of
real-world distribution shift, we cannot expect any single benchmark to be comprehensive. Thus,
to obtain a holistic understanding of model robustness, we need to keep expanding our testbed to
encompass more natural modes of variation. In this work, we take another step in that direction by
studying the following question:

    How well do models generalize to data subpopulations they have not seen during training?

The notion of subpopulation shift this question refers to is quite pervasive. After all, our training
datasets will inevitably fail to perfectly capture the diversity of the real word. Hence, during
deployment, our models are bound to encounter unseen subpopulations—for instance, unexpected
weather conditions in the self-driving car context or different diagnostic setups in medical applications.

O UR CONTRIBUTIONS

The goal of our work is to create large-scale subpopulation shift benchmarks wherein the data
subpopulations present during model training and evaluation differ. These benchmarks aim to
assess how effectively models generalize beyond the limited diversity of their training datasets—
e.g., whether models can recognize Dalmatians as “dogs” even when their training data for “dogs”
comprises only Poodles and Terriers. We show how one can simulate such shifts, fairly naturally,
within existing datasets, hence eliminating the need for (and the potential biases introduced by)
crafting synthetic transformations or collecting additional data.

                                                    1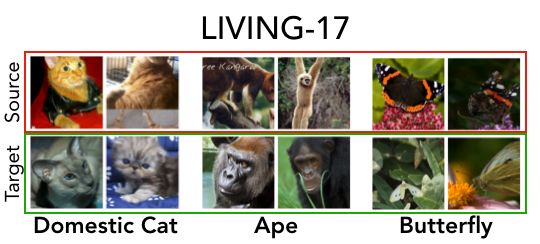
Under review as a conference paper at ICLR 2021

B REEDS benchmarks. The crux of our approach is to leverage existing dataset labels and use them
to identify superclasses—i.e., groups of semantically similar classes. This allows us to construct
classification tasks over such superclasses, and repurpose the original dataset classes to be the
subpopulations of interest. This, in turn, enables us to induce a subpopulation shift by directly making
the subpopulations present in the training and test distributions disjoint. By applying this methodology
to the ImageNet dataset (Deng et al., 2009), we create a suite of subpopulation shift benchmarks of
varying difficulty. This involves modifying the existing ImageNet class hierarchy—WordNet (Miller,
1995)—to ensure that superclasses comprise visually coherent subpopulations. We conduct human
studies to validate that the resulting benchmarks capture meaningful subpopulation shifts.

Model robustness to subpopulation shift. In order to demonstrate the utility of our benchmarks,
we employ them to evaluate the robustness of standard models to subpopulation shift. In general, we
find that model performance drops significantly on the shifted distribution—even when this shift does
not significantly affect humans. Still, models that are more accurate on the original distribution tend
to also be more robust to these subpopulation shifts. Moreover, adapting models to the shifted domain,
by retraining their last layer on this domain, only partially recovers the original model performance.

Impact of robustness interventions. Finally, we examine whether various train-time interventions,
designed to decrease model sensitivity to synthetic data corruptions (e.g., `2 -bounded perturbations)
make models more robust to subpopulation shift. We find that many of these methods offer small, yet
non-trivial, improvements along this axis—at times, at the expense of performance on the original
distribution. Often, these improvements become more pronounced after retraining the last layer of
the model on the shifted distribution. Nevertheless, the increase in model robustness to subpopulation
shifts due to these interventions is much smaller than what is observed for other families of input
variations such as data corruptions (Hendrycks & Dietterich, 2019; Ford et al., 2019; Kang et al.,
2019; Taori et al., 2020). This indicates that handling subpopulation shifts, such as those present in
the B REEDS benchmarks, might require a different set of robustness tools.

2    D ESIGNING B ENCHMARKS FOR D ISTRIBUTION S HIFT

When constructing distribution shift benchmarks, the key design choice lies in specifying the target
distribution to be used during model evaluation. This distribution is meant to be a realistic variation
of the source distribution, that was used for training. Typically, studies focus on variations due to:

       • Data corruptions: The target distribution is obtained by modifying inputs from the source
         distribution via a family of transformations that mimic real-world corruptions, as in Fawzi
         & Frossard (2015); Fawzi et al. (2016); Engstrom et al. (2019b); Hendrycks & Dietterich
         (2019); Ford et al. (2019); Kang et al. (2019); Shankar et al. (2019).
       • Differences in data sources: Here, the target distribution is an independent dataset for the
         same task (Saenko et al., 2010; Torralba & Efros, 2011; Tommasi & Tuytelaars, 2014; Recht
         et al., 2019)—e.g., collected at a different geographic location (Beery et al., 2018), time
         frame (Kumar et al., 2020) or user population (Caldas et al., 2018). For instance, this could
         involve using PASCAL VOC (Everingham et al., 2010) to evaluate Caltech101-trained
         classifiers (Fei-Fei et al., 2006). The goal is to test whether models are overly reliant on the
         idiosyncrasies of their training datasets (Ponce et al., 2006; Torralba & Efros, 2011).
       • Subpopulation representation: The source and target distributions differ in terms of how
         well-represented each subpopulation is. Work in this area typically studies whether models
         perform equally well across all subpopulations from the perspective of reliability (Mein-
         shausen et al., 2015; Hu et al., 2018; Duchi & Namkoong, 2018; Caldas et al., 2018; Oren
         et al., 2019; Sagawa et al., 2020) or algorithmic fairness (Dwork et al., 2012; Kleinberg
         et al., 2017; Jurgens et al., 2017; Buolamwini & Gebru, 2018; Hashimoto et al., 2018).

These variations simulate realistic ways in which the data encountered during deployment can deviate
from training conditions. However, each of the aforementioned benchmarks capture only one facet of
real-world distribution shifts. It is not clear a priori that robustness to any subset of these variations
will necessarily translate to robustness with respect to the rest. Thus, to effectively assess and improve
model robustness, we require a varied suite of distribution shift benchmarks.

                                                    2
Under review as a conference paper at ICLR 2021

Figure 1: Illustration of our pipeline to create subpopulation shift benchmarks. Given a dataset,
we define superclasses based on the semantic hierarchy of dataset classes. This allows us to treat
the dataset labels as subpopulation annotations. Then, we construct a B REEDS task of specified
granularity (i.e., depth in the hierarchy) by posing the classification task in terms of superclasses at
that depth and then partitioning their respective subpopulations into the source and target domains.

3    T HE B REEDS M ETHODOLOGY
In this work, we focus on modeling a pertinent, yet less studied, form of subpopulation shift: one
wherein the target distribution (used for testing) contains subpopulations that are entirely absent from
the source distribution that the model was trained on. To simulate such shifts, we need to precisely
control the data subpopulations present in the source and target data distributions. Our procedure
for doing this comprises two stages that are outlined below—see Figure 1 for an illustration and
Appendix A.2 for pseudocode.

Devising subpopulation structure. Typical datasets do not contain annotations for individual
subpopulations. Since collecting such annotations would be challenging, we take an alternative
approach: we bootstrap the existing dataset labels to simulate subpopulations. That is, we group
semantically similar classes into broader superclasses which, in turn, allows us to re-purpose existing
class labels as the desired subpopulation annotations. Moreover, we can group classes in a hierarchical
manner, obtaining superclasses of different specificity. As we will see in Section 4, such class
hierarchies are already present in large-scale benchmarks (Deng et al., 2009; Kuznetsova et al., 2018).

Simulating subpopulation shifts. Given a set of superclasses, we can define a classification task
over them: the inputs of each superclass correspond to pooling together the inputs of its subclasses
(i.e., the original dataset classes). Within this setup, we can simulate subpopulation shift in a
relatively straightforward manner. Specifically, for each superclass, we split its subclasses into two
random and disjoint sets, and assign one of them to the source and the other to the target domain.
Then, we can evaluate model robustness under subpopulation shift by simply training on the source
domain and testing on the target domain. Note that the classification task remains identical between
domains—both domains contain the same (super)classes but the subpopulations that comprise each
(super)class differ. 1 Intuitively, this corresponds to using different dog breeds to represent the class
“dog” during training and testing—hence the name of our toolkit.

This methodology is quite general and can be applied to a variety of setting to simulate realistic
distribution shifts. Moreover, it has a number of additional benefits:

       • Flexibility: Different semantic groupings of a fixed set of classes lead to B REEDS tasks of
         varying granularity. For instance, by only grouping together classes that are quite similar
         one can reduce the severity of the subpopulation shift. Alternatively, one can consider broad
         superclasses, each having multiple subclasses, resulting in a more challenging benchmark.
       • Precise characterization: The exact subpopulation shift between the source and target
         domains is known. Since both domains are constructed from the same dataset, the impact
         of any external factors (e.g., differences in data collection pipelines) is minimized. Note
         that such external factors can significantly impact the difficulty of the task (Ponce et al.,
         2006; Torralba & Efros, 2011; Tsipras et al., 2020). In fact, minimizing these effects and
    1
      Note that this approach can be extended to simulate milder subpopulation shifts where the source and target
distributions overlap but the relative subpopulation frequencies vary, similar to the setting of Oren et al. (2019).

                                                         3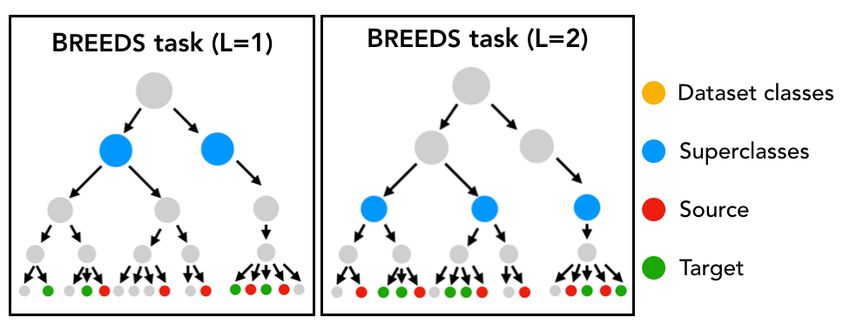
Under review as a conference paper at ICLR 2021

         ensuring that the shift between the source and target domain is caused solely by the intended
         input variations is one of the major challenges in building distribution shift benchmarks. For
         instance, recent work (Engstrom et al., 2020) demonstrates that statistical biases during data
         collection can significantly skew the intended target distribution.
       • Symmetry: Since subpopulations are split into the source and test domains randomly, we
         expect the resulting tasks to have comparable difficulty.
       • Reuse of existing datasets: No additional data collection or annotation is required other
         than choosing the class grouping. This approach can thus be used to also re-purpose other
         existing large-scale datasets—even beyond image recognition—with minimal effort.

4     S IMULATING S UBPOPULATION S HIFTS W ITHIN I MAGE N ET

We now describe how our methodology can be applied to ImageNet (Deng et al., 2009)—specifically,
the ILSVRC2012 subset (Russakovsky et al., 2015)—to create a suite of B REEDS benchmarks.
ImageNet contains a large number of classes, making it particularly well-suited for our purpose.

4.1   U TILIZING THE I MAGE N ET CLASS HIERARCHY

Recall that creating B REEDS tasks requires grouping together similar classes. For ImageNet, such a
semantic grouping already exists—ImageNet classes are a part of the WordNet hierarchy (Miller,
1995). However, WordNet is not a hierarchy of objects but rather one of word meanings. Thus,
intermediate hierarchy nodes are not always well-suited for object recognition due to:

       • Abstract groupings: WordNet nodes often correspond to abstract concepts, e.g., related
         to the functionality of an object. Children of such nodes might thus share little visual
         similarity—e.g., “umbrella” and “roof” are visually different, despite both being “coverings”.
       • Non-uniform categorization: The granularity of object categorization is vastly different
         across the WordNet hierarchy—e.g., the subtree rooted at “dog” is 25-times larger than the
         one rooted at “cat”. Hence, the depth of a node in this hierarchy does not always reflect the
         specificity of the corresponding object category.
       • Lack of tree structure: Nodes in WordNet can have multiple parents and thus the resulting
         classification task would contain overlapping classes, making it inherently ambiguous.

Due to these issues, we cannot directly use WordNet to identify superclasses that correspond to a
well-calibrated classification task. To illustrate this, we present some of the superclasses that Huh
et al. (2016) constructed by applying clustering algorithms directly to the WordNet hierarchy in
Appendix Table 2. Even putting the issue of overlapping classes aside, a B REEDS task based on these
superclasses would induce a very skewed subpopulation shift across classes—e.g., varying the types
of “bread” is very different that doing the same for different “mammal” species.
To better align the WordNet hierarchy with the task of object recognition in general, and B REEDS
benchmarks in particular, we manually modify it according to the following two principles: (i) nodes
should be grouped together based on their visual characteristics rather than abstract relationships
like functionality, and (ii) nodes of similar specificity should be at the same distance from the root,
irrespective of how detailed their categorization within WordNet is. Details of this procedure along
with the resulting hierarchy are presented in Appendix A.4.

4.2   C REATING B REEDS TASKS

Once the modified version of the WordNet hierarchy is in place, B REEDS tasks can be created in
an automated manner. Specifically, we first choose the desired granularity of the task by specifying
the distance from the root (“entity”) and retrieving all superclasses at that distance in a top-down
manner. Each resulting superclass corresponds to a subtree of our hierarchy, with ImageNet classes
as its leaves. Note that these superclasses are roughly of the same specificity, due to our hierarchy
restructuring process. Then, we randomly sample a fixed number of subclasses for each superclass to

                                                  4
Under review as a conference paper at ICLR 2021
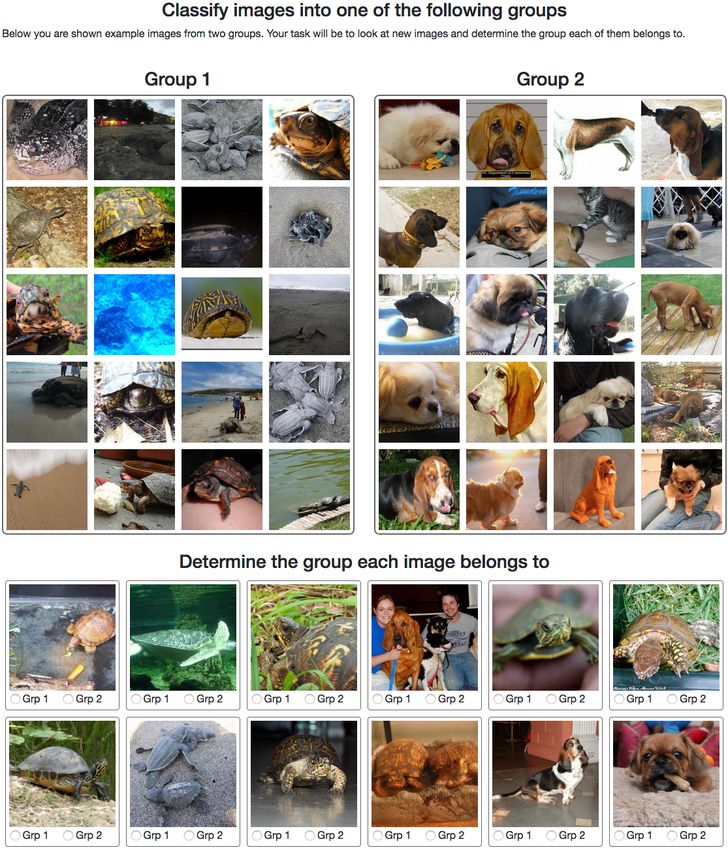
Figure 2: Sample images from random object categories for the E NTITY-13 and L IVING -17 tasks.
For each task, the top and bottom row correspond to the source and target distributions respectively.
produce a balanced dataset (omitting superclasses with an insufficient number of subclasses). Finally,
as described in Section 3, we randomly split these subclasses into the source and target domain. 2
For our analysis, we create four tasks (cf. Table 1) based on different levels/parts of the hierarchy. To
illustrate what the corresponding subpopulation shifts look like, we present (random) image samples
for a subset of the tasks in Figure 2. Note that while we focus on the tasks in Table 1 in our study, our
methodology readily enables us to create other variants of these tasks in an automated manner.
Name Subtree Level Subpopulations Examples
E NTITY-13 “entity” (root) 3 20 “mammal”, “appliance”
E NTITY-30 “entity” (root) 4 8 “fruit”, “carnivore”
L IVING -17 “living thing” 5 4 “ape”, “bear”
N ON - LIVING -26 “non-living thing” 5 4 “fence”, “ball”
Table 1: B REEDS benchmarks constructed using ImageNet. Here, “level” indicates the depth of
the superclasses in the class hierarchy (task granularity), and the number of “subpopulations” (per
superclass) is fixed to create balanced datasets. We also construct specialized tasks by focusing on
subtrees in the hierarchy, e.g., only living (L IVING -17) or non-living (N ON - LIVING -26) objects.
Datasets naming reflects the root of the subtree and the number of superclasses they contain.
B REEDS benchmarks beyond ImageNet. It is worth nothing that the methodology we described
is not restricted to ImageNet and can be readily applied to other datasets as well. The only requirement
is that we have access to a semantic grouping of the dataset classes, which is the case for many
popular vision datasets—e.g., CIFAR-100 (Krizhevsky, 2009), Pascal-VOC (Everingham et al., 2010),
OpenImages (Kuznetsova et al., 2018), COCO-Stuff (Caesar et al., 2018). Moreover, even when a
class hierarchy is entirely absent, the needed semantic class grouping can be manually constructed
with relatively little effort (proportional to the number of classes, not the number of datapoints).
More broadly, the methodology of utilizing existing dataset annotations to construct data subpop-
ulations goes beyond image classification tasks. In particular, by splitting inputs into a source and
target domain based on some attribute, we can measure how well models generalize along this axis.
Examples would include grouping by brand in Amazon reviews (McAuley et al., 2015), by location
in Berkeley DeepDrive (Yu et al., 2020), and by facial attributes in CelebA (Liu et al., 2015).
4.3 C ALIBRATING B REEDS BENCHMARKS VIA HUMAN STUDIES
For a distribution shift benchmark to be meaningful, it is essential that the source and target domains
capture the same high-level task—otherwise generalizing from one domain to the other would be
impossible. To ensure that this is the case for the B REEDS task, we assess how significant the resulting
distribution shifts are for human annotators (crowd-sourced via MTurk).
Annotator task. To obtain meaningful performance estimates, it is crucial that annotators perform
the task based only on the visual content of the images, without leveraging prior knowledge. To
2
We also consider more benign or adversarial subpopulation splits for these tasks in Appendix C.2.1.
5Under review as a conference paper at ICLR 2021
achieve this, we design the following annotation task. First, annotators are shown images from the
source domain, grouped by superclass, without being aware of the superclass name (i.e., the grouping
it corresponds to). Then, they are presented with images from the target domain and are asked to
assign each of them to one of the groups. For simplicity, we present two random superclasses at a
time, effectively simulating binary classification. Annotator accuracy can be measured directly as the
fraction of images that they assign to the superclass to which they belong. We perform this experiment
for each of the B REEDS tasks constructed in Section 4.2. For comparison, we repeat this experiment
without subpopulation shift (test images are sampled from the source domain) and for the superclasses
constructed by Huh et al. (2016) using the WordNet hierarchy directly (cf. Appendix A.6).
ENTITY-13 ENTITY-30 LIVING-17 NON-LIVING-26
100
Annotator accuracy (%)
80
60
40
20
0
) ) ) ) ) ) ) ) ) ) ) ) ) ) ) ) ) ) ) ) ) ) ) )
s (S s (T t (S t (T s (S s (T s (S s (T t (S t (T s (S s (T s (S s (T t (S t (T s (S s (T s (S s (T t (S t (T s (S s (T
eed eed dNe dNe eed eed eed eed dNe dNe eed eed eed eed dNe dNe eed eed eed eed dNe dNe eed eed
a n : Br an: Br n: Wor n: Wor 21 : Br 21 : Br a n: Br an: Br n: Wor n: Wor 21 : Br 21 : Br a n : Br an: Br n: Wor n: Wor 21 : Br 21 : Br an : Br an: Br n: Wor n: Wor 21 : Br 21 : Br
Hum Hum Huma Huma seNet1 seNet1 Hum Hum Huma Huma seNet1 seNet1 Hum Hum Huma Huma seNet1 seNet1 Hum Hum Huma Huma seNet1 seNet1
Den Den Den Den Den Den Den Den
Figure 3: Human performance on (binary) B REEDS tasks. Annotators are provided with labeled
images from the source distribution for a pair of (undisclosed) superclasses, and asked to classify
samples from the target domain (‘T’) into one of the two groups. As a baseline we also measure
annotator performance without subpopulation shift (i.e., on test images from the source domain, ‘S’)
and tasks created via the WordNet hierarchy (cf. Appendix A.6). We observe that annotators are fairly
robust to subpopulation shift. Further, they consistently perform better on B REEDS task compared
to those based on WordNet directly—indicating that our modified class hierarchy is indeed better
calibrated for object recognition. (We discuss model performance in Section 5.)
Human performance. We find that, across all tasks, annotators perform well on unseen data from
the source domain, as expected. More importantly, annotators also appear to be quite robust to
subpopulation shift, experiencing only a small accuracy drop between the source and target domains
(cf. Figure 4). This indicates that the source and target domains are indeed perceptually similar
for humans, making these benchmarks suitable for studying model robustness. Finally, across all
benchmarks, annotators perform better on B REEDS tasks, compared to their WordNet equivalents—
even on source domain samples. This indicates that our modified class hierarchy is indeed better
aligned with the underlying visual recognition task.
5 E VALUATING M ODEL P ERFORMANCE UNDER S UBPOPULATION S HIFT
We can now use our suite of B REEDS tasks as a testbed for assessing model robustness to subpopula-
tion shift as well as gauging the effectiveness of various train-time robustness interventions. Specifics
of the evaluation setup and additional experimental results are provided in Appendices A.7 and C.2.
5.1 S TANDARD TRAINING
We start by evaluating the performance of various model architectures trained in the standard fashion:
empirical risk minimization (ERM) on the source distribution (cf. Appendix A.7.1). While models
perform well on unseen inputs from the domain they are trained on, i.e., they achieve high source
accuracy, their accuracy considerably drops under subpopulation shift—more than 30% in most
cases (cf. Figure 4). At the same time, models that are more accurate on the source domain also
appear to be more robust to subpopulation shift. Specifically, the fraction of source accuracy that is
preserved in the target domain typically increases with source accuracy. (If this were not the case, i.e.,
the model accuracy dropped by a constant fraction under distribution shift, the target accuracy would
match the baseline in Figure 4.) This indicates that, improvements in source accuracy do correlate
with models generalizing better to variations in testing conditions.
6Under review as a conference paper at ICLR 2021
Train: Source | Test: Source (y=x) Train: Target | Test: Target (reference) Baseline
Train: Source | Test: Target Train: Source + retrain last layer | Test: Target
ENTITY-13 ENTITY-30 NON-LIVING-26 LIVING-17
90 90
90 90
85 80 80
Accuracy (%)
80
80 70
70
75 70
60
70 60
60
65 50
50 50
60 40
55 40
84 86 88 90 92 80 82 84 86 88 90 80 82 84 86 88 90 84 86 88 90 92 94
Source Accuracy (%) Source Accuracy (%) Source Accuracy (%) Source Accuracy (%)
Figure 4: Robustness of standard models to subpopulation shifts. For each task, we plot the accuracy
of various model architectures (denoted by different symbols) on the target domain as a function of
their source accuracy. We find that model accuracy drops significantly between domains (orange vs.
dashed line). Still, models that are more accurate on the source domain seem to also be more robust
(the improvements exceed the baseline (grey) which would correspond to a constant accuracy drop
relative to AlexNet). Moreover, the drop in model performance can be significantly (but not fully)
reduced by retraining the final model layer with data from the target domain (green).
Models vs. Humans. We compare the best performing model (DenseNet-121 in this case) to our
previously obtained human baselines in Figure 3. To allow for a fair comparison, model accuracy is
measured on pairwise superclass classification tasks (cf. Appendix A.7). We observe that models do
exceedingly well on unseen samples from the source domain—significantly outperforming annotators
under our task setup. At the same time, models also appear to be more brittle, performing worse than
humans on the target domain of these binary B REEDS tasks, despite their higher source accuracy.
Adapting models to the target domain. Finally, we focus on the intermediate data representations
learned by these models, to assess how suitable they are for distinguishing classes in the target
domain. To evaluate this, we retrain the last (fully-connected) layer of models trained on the source
domain with data from the target domain. We find that the target accuracy of these models increases
significantly after retraining, indicating that the learned representations indeed generalize to the target
domain. However, we cannot match the accuracy of models trained directly (end-to-end) on the target
domain—see Figure 4—demonstrating that there is significant room for improvement.
5.2 ROBUSTNESS INTERVENTIONS
We now turn our attention to existing methods for decreasing model sensitivity to specific synthetic
perturbations. Our goal is to assess if these methods enhance model robustness to subpopulation shift
too. Concretely, we consider the following families of interventions (cf. Appendix A.7.3 for details):
(i) adversarial training to enhance robustness to worst-case `p -bounded perturbations (in our case
`2 ) (Madry et al., 2018), (ii) training on a stylized version of ImageNet to encourage models to rely
more on shape rather than texture (Geirhos et al., 2019), and (iii) training with random noise to make
models robust to data corruptions (here, Gaussian and Erase noise (Zhong et al., 2020)).
Note that these methods can be viewed as imposing a prior on the features that the model relies
on (Heinze-Deml & Meinshausen, 2017; Geirhos et al., 2019; Engstrom et al., 2019a). That is, by
rendering certain features ineffective during training (e.g., texture) they incentivize the model to
utilize alternative ones (e.g., shape). Since different feature families may manifest differently in the
target domain, such interventions could significantly impact model robustness to subpopulation shift.
Relative accuracy. To measure the impact of these interventions, we will focus on the models’
relative accuracy—the ratio of target accuracy to source accuracy. This metric accounts for the fact
that train-time interventions can impact model accuracy on the source domain itself. By measuring
relative performance, we are able to compare different training methods on an equal footing.
We find that robustness interventions do have a small, yet non-trivial, impact on the robustness of
a model to subpopulation shift—see Figure 5. Specifically, for the case of adversarial training and
erase noise, models often retain a larger fraction of their accuracy on the target domain compared
to standard training, hence lying on the Pareto frontier of a robustness-accuracy trade-off. In fact,
7Under review as a conference paper at ICLR 2021
Std Adv ( = 0.5) Adv ( = 1.0) Erase Gaussian Stylized
71
ENTITY-13 60
ENTITY-30 67
LIVING-17 50
NON-LIVING-26
Relative Accuracy(%)
68 56
62 47
64 51 58
44
61 47 54 42
77.5 80.0 82.5 85.0 87.5 90.0 92.5 70 75 80 85 90 80.0 82.5 85.0 87.5 90.0 92.5 75 80 85 90
Source Accuracy (%) Source Accuracy (%) Source Accuracy (%) Source Accuracy (%)
Figure 5: Effect of train-time interventions on model robustness to subpopulation shift. We measure
model performance in terms of relative accuracy–i.e., the ratio between its target and source accu-
racies. This allows us to visualize the accuracy-robustness trade-off along with the corresponding
Pareto frontier (dashed). (Also shown are 95% confidence intervals computed via bootstrapping.) We
observe that some interventions do improve model robustness to subpopulation shift—specifically,
erase noise and adversarial training—albeit by a small amount and often at the cost of source accuracy.
for some of these interventions, the target accuracy is slightly higher than models obtained via
standard training, even without adjusting for their lower source accuracy (raw accuracies are in
Appendix C.2.2). Nonetheless, it is important to note that none of these methods offer significant
subpopulation robustness—relative accuracy is not improved by more than a few percentage points.
Adapting models to the target domain. The impact of these interventions is more pronounced if
we consider the accuracy of models after their last layer is retrained on the target domain (cf. Appendix
Figure 13). In particular, we find that for adversarially robust models, retraining significantly boosts
accuracy on the target domain—e.g., for L IVING -17 it is almost comparable to the initial source
accuracy. This suggests that the feature priors imposed by these interventions incentivize models
to learn representations that generalize to other domains—in line with recent results of Utrera et al.
(2020); Salman et al. (2020). Moreover, we observe that models trained on stylized inputs perform
consistently worse, suggesting that texture might be an important feature for these tasks.
6 R ELATED W ORK
In Section 2, we surveyed prior work on distribution shift benchmarks. Here, we discuss further the
benchmarks most closely related to ours and defer discussing additional related work to Appendix B.
Our benchmarks can be viewed as an instance of domain generalization. However, we focus on
generalizing between different distributions of real-world images (photographs). This is in contrast
to typical domain generalization benchmarks that focus on generalizing between different stylistic
representations, e.g., from cartoons to drawings. Hence, the only comparable benchmark would be
VLCS (Ghifary et al., 2015), which is however significantly smaller in scale and granularity than our
benchmarks. In a similar vein, datasets used in federated learning (Caldas et al., 2018) can be viewed
as subpopulation shift benchmarks since the users present during training and testing might differ.
However, to the best of our knowledge, there has been no large-scale vision benchmark in this setting.
Hendrycks & Dietterich (2019), in Appendix G, also (manually) construct a classification task over
superclasses and use ImageNet classes outside of ILSVRC2012 (ImageNet-1k) to measure “subtype
robustness”. (Unfortunately, these classes are no longer publicly available (Yang et al., 2019).)
Compared to their work, we use a general methodology to create a broader suite of benchmarks. Also,
our analysis of architectures and robustness interventions is significantly more extensive.
7 C ONCLUSION
In this work, we develop a methodology for constructing large-scale subpopulation shift benchmarks.
The motivation behind our B REEDS benchmarks is to test if models can generalize beyond the limited
diversity of their training datasets—specifically, to novel data subpopulations. A major advantage
of our approach is its generality. It can be applied to any dataset with a meaningful class structure—
8Under review as a conference paper at ICLR 2021
including tasks beyond classification (e.g., object detection) and domains other than computer vision
(e.g., natural language processing). Moreover, the subpopulation shifts are induced in a manner that
is both controlled and natural, without altering inputs synthetically or requiring new data.
By applying this approach to the ImageNet dataset, we construct a suite of benchmarks of varying
difficulty, that we then use to assess model robustness and the efficacy of various train-time interven-
tions. Further, we obtain human baselines for these tasks to both put model performance in context
and validate that the corresponding subpopulation shifts do not significantly affect humans.
Overall, our results indicate that existing models still have a long way to go before they can fully
tackle B REEDS subpopulation shifts, even using current robustness interventions. We thus believe that
our methodology provides a useful tool for studying and improving model robustness to distribution
shift—an increasingly pertinent topic for real-world deployments of machine learning models.
R EFERENCES
Martin Arjovsky, Léon Bottou, Ishaan Gulrajani, and David Lopez-Paz. Invariant risk minimization.
arXiv preprint arXiv:1907.02893, 2019.
Sara Beery, Grant Van Horn, and Pietro Perona. Recognition in terra incognita. In European
Conference on Computer Vision (ECCV), 2018.
Shai Ben-David, John Blitzer, Koby Crammer, and Fernando Pereira. Analysis of representations for
domain adaptation. In Neural Information Processing Systems (NeurIPS), 2007.
Aharon Ben-Tal, Dick Den Hertog, Anja De Waegenaere, Bertrand Melenberg, and Gijs Rennen.
Robust solutions of optimization problems affected by uncertain probabilities. In Management
Science, 2013.
Joy Buolamwini and Timnit Gebru. Gender shades: Intersectional accuracy disparities in commercial
gender classification. In Conference on fairness, accountability and transparency (FAccT), 2018.
Holger Caesar, Jasper Uijlings, and Vittorio Ferrari. Coco-stuff: Thing and stuff classes in context.
In Computer vision and pattern recognition (CVPR), 2018, 2018.
Sebastian Caldas, Peter Wu, Tian Li, Jakub Konečnỳ, H Brendan McMahan, Virginia Smith, and
Ameet Talwalkar. Leaf: A benchmark for federated settings. arXiv preprint arXiv:1812.01097,
2018.
Nicolas Courty, Rémi Flamary, Devis Tuia, and Alain Rakotomamonjy. Optimal transport for domain
adaptation. In transactions on pattern analysis and machine intelligence, 2016.
Jia Deng, Wei Dong, Richard Socher, Li-Jia Li, Kai Li, and Li Fei-Fei. Imagenet: A large-scale
hierarchical image database. In computer vision and pattern recognition (CVPR), 2009.
Jeff Donahue, Yangqing Jia, Oriol Vinyals, Judy Hoffman, Ning Zhang, Eric Tzeng, and Trevor
Darrell. Decaf: A deep convolutional activation feature for generic visual recognition. In
International conference on machine learning (ICML), 2014.
John Duchi and Hongseok Namkoong. Learning models with uniform performance via distributionally
robust optimization. In arXiv preprint arXiv:1810.08750, 2018.
John Duchi, Peter Glynn, and Hongseok Namkoong. Statistics of robust optimization: A generalized
empirical likelihood approach. Mathematics of Operations Research, 2016.
Cynthia Dwork, Moritz Hardt, Toniann Pitassi, Omer Reingold, and Richard Zemel. Fairness through
awareness. In innovations in theoretical computer science conference (ITCS), 2012.
Logan Engstrom, Andrew Ilyas, Shibani Santurkar, Dimitris Tsipras, Brandon Tran, and Alek-
sander Madry. Adversarial robustness as a prior for learned representations. In ArXiv preprint
arXiv:1906.00945, 2019a.
Logan Engstrom, Brandon Tran, Dimitris Tsipras, Ludwig Schmidt, and Aleksander Madry. Exploring
the landscape of spatial robustness. In International Conference on Machine Learning (ICML),
2019b.
9Under review as a conference paper at ICLR 2021
Logan Engstrom, Andrew Ilyas, Shibani Santurkar, Dimitris Tsipras, Jacob Steinhardt, and Alek-
sander Madry. Identifying statistical bias in dataset replication. In International Conference on
Machine Learning (ICML), 2020.
Peyman Mohajerin Esfahani and Daniel Kuhn. Data-driven distributionally robust optimization
using the wasserstein metric: Performance guarantees and tractable reformulations. Mathematical
Programming, 2018.
M. Everingham, L. Van Gool, C. K. I. Williams, J. Winn, and A. Zisserman. The pascal visual object
classes (voc) challenge. In International Journal of Computer Vision, 2010.
Alhussein Fawzi and Pascal Frossard. Manitest: Are classifiers really invariant? In British Machine
Vision Conference (BMVC), 2015.
Alhussein Fawzi, Seyed-Mohsen Moosavi-Dezfooli, and Pascal Frossard. Robustness of classifiers:
from adversarial to random noise. In Advances in Neural Information Processing Systems, 2016.
Li Fei-Fei, Rob Fergus, and Pietro Perona. One-shot learning of object categories. pattern analysis
and machine intelligence (PAMI), 2006.
Nic Ford, Justin Gilmer, Nicolas Carlini, and Dogus Cubuk. Adversarial examples are a natural
consequence of test error in noise. In arXiv preprint arXiv:1901.10513, 2019.
Andrea Frome, Greg S Corrado, Jon Shlens, Samy Bengio, Jeff Dean, Marc’Aurelio Ranzato, and
Tomas Mikolov. Devise: A deep visual-semantic embedding model. In neural information
processing systems (NeurIPS), 2013.
Yaroslav Ganin and Victor Lempitsky. Unsupervised domain adaptation by backpropagation. 2015.
Robert Geirhos, Patricia Rubisch, Claudio Michaelis, Matthias Bethge, Felix A. Wichmann, and
Wieland Brendel. Imagenet-trained CNNs are biased towards texture; increasing shape bias
improves accuracy and robustness. In International Conference on Learning Representations,
2019.
Muhammad Ghifary, W Bastiaan Kleijn, Mengjie Zhang, and David Balduzzi. Domain generalization
for object recognition with multi-task autoencoders. In Proceedings of the IEEE international
conference on computer vision, pp. 2551–2559, 2015.
Mingming Gong, Kun Zhang, Tongliang Liu, Dacheng Tao, Clark Glymour, and Bernhard Schölkopf.
Domain adaptation with conditional transferable components. In International conference on
machine learning (ICML), 2016.
Tatsunori Hashimoto, Megha Srivastava, Hongseok Namkoong, and Percy Liang. Fairness without
demographics in repeated loss minimization. In International Conference on Machine Learning
(ICML), 2018.
Christina Heinze-Deml and Nicolai Meinshausen. Conditional variance penalties and domain shift
robustness. arXiv preprint arXiv:1710.11469, 2017.
Dan Hendrycks and Thomas G. Dietterich. Benchmarking neural network robustness to common
corruptions and surface variations. In International Conference on Learning Representations
(ICLR), 2019.
Weihua Hu, Gang Niu, Issei Sato, and Masashi Sugiyama. Does distributionally robust supervised
learning give robust classifiers? In International Conference on Machine Learning (ICML), 2018.
Minyoung Huh, Pulkit Agrawal, and Alexei A Efros. What makes imagenet good for transfer
learning? arXiv preprint arXiv:1608.08614, 2016.
David Jurgens, Yulia Tsvetkov, and Dan Jurafsky. Incorporating dialectal variability for socially
equitable language identification. In Association for Computational Linguistics (ACL), 2017.
Daniel Kang, Yi Sun, Dan Hendrycks, Tom Brown, and Jacob Steinhardt. Testing robustness against
unforeseen adversaries. In ArXiv preprint arxiv:1908.08016, 2019.
10Under review as a conference paper at ICLR 2021
Mark G Kelly, David J Hand, and Niall M Adams. The impact of changing populations on classifier
performance. In international conference on Knowledge discovery and data mining (SIGKDD),
1999.
Aditya Khosla, Tinghui Zhou, Tomasz Malisiewicz, Alexei A Efros, and Antonio Torralba. Undoing
the damage of dataset bias. In European Conference on Computer Vision (ECCV), 2012.
Jon Kleinberg, Sendhil Mullainathan, and Manish Raghavan. Inherent trade-offs in the fair determi-
nation of risk scores. In Innovations in Theoretical Computer Science (ITCS), 2017.
Alex Krizhevsky. Learning multiple layers of features from tiny images. In Technical report, 2009.
Ananya Kumar, Tengyu Ma, and Percy Liang. Understanding self-training for gradual domain
adaptation. In International Conference on Machine Learning (ICML), 2020.
Alina Kuznetsova, Hassan Rom, Neil Alldrin, Jasper Uijlings, Ivan Krasin, Jordi Pont-Tuset, Shahab
Kamali, Stefan Popov, Matteo Malloci, Tom Duerig, et al. The open images dataset v4: Unified
image classification, object detection, and visual relationship detection at scale. arXiv preprint
arXiv:1811.00982, 2018.
Christoph H Lampert, Hannes Nickisch, and Stefan Harmeling. Learning to detect unseen object
classes by between-class attribute transfer. In Computer Vision and Pattern Recognition (CVPR),
2009.
Da Li, Yongxin Yang, Yi-Zhe Song, and Timothy M Hospedales. Deeper, broader and artier domain
generalization. In international conference on computer vision (ICCV), 2017.
Ziwei Liu, Ping Luo, Xiaogang Wang, and Xiaoou Tang. Deep learning face attributes in the wild. In
International Conference on Computer Vision (ICCV), 2015.
Aleksander Madry, Aleksandar Makelov, Ludwig Schmidt, Dimitris Tsipras, and Adrian Vladu.
Towards deep learning models resistant to adversarial attacks. In International Conference on
Learning Representations (ICLR), 2018.
Julian McAuley, Christopher Targett, Qinfeng Shi, and Anton Van Den Hengel. Image-based
recommendations on styles and substitutes. In Research and development in Information Retrieval
(SIGIR), 2015.
Nicolai Meinshausen. Causality from a distributional robustness point of view. In Data Science
Workshop (DSW), 2018.
Nicolai Meinshausen, Peter Bühlmann, et al. Maximin effects in inhomogeneous large-scale data.
The Annals of Statistics, 2015.
Tomas Mikolov, Ilya Sutskever, Kai Chen, Greg S Corrado, and Jeff Dean. Distributed representations
of words and phrases and their compositionality. In Advances in neural information processing
systems, pp. 3111–3119, 2013.
George A Miller. Wordnet: a lexical database for english. Communications of the ACM, 1995.
Jose G Moreno-Torres, Troy Raeder, RocíO Alaiz-RodríGuez, Nitesh V Chawla, and Francisco
Herrera. A unifying view on dataset shift in classification. Pattern recognition, 2012.
Krikamol Muandet, David Balduzzi, and Bernhard Schölkopf. Domain generalization via invariant
feature representation. In International Conference on Machine Learning (ICML), 2013.
Hongseok Namkoong and John C Duchi. Stochastic gradient methods for distributionally robust
optimization with f-divergences. In neural information processing systems (NeurIPS), 2016.
Yonatan Oren, Shiori Sagawa, Tatsunori Hashimoto, and Percy Liang. Distributionally robust
language modeling. In Empirical Methods in Natural Language Processing (EMNLP), 2019.
Xingchao Peng, Qinxun Bai, Xide Xia, Zijun Huang, Kate Saenko, and Bo Wang. Moment matching
for multi-source domain adaptation. In International Conference on Computer Vision (ICCV),
2019.
11Under review as a conference paper at ICLR 2021
Jean Ponce, Tamara L Berg, Mark Everingham, David A Forsyth, Martial Hebert, Svetlana Lazebnik,
Marcin Marszalek, Cordelia Schmid, Bryan C Russell, Antonio Torralba, et al. Dataset issues in
object recognition. In Toward category-level object recognition, 2006.
Joaquin Quionero-Candela, Masashi Sugiyama, Anton Schwaighofer, and Neil D Lawrence. Dataset
shift in machine learning. The MIT Press, 2009.
Benjamin Recht, Rebecca Roelofs, Ludwig Schmidt, and Vaishaal Shankar. Do imagenet classifiers
generalize to imagenet? In International Conference on Machine Learning (ICML), 2019.
Bernardino Romera-Paredes and Philip Torr. An embarrassingly simple approach to zero-shot
learning. In International Conference on Machine Learning (ICML), 2015.
Olga Russakovsky, Jia Deng, Hao Su, Jonathan Krause, Sanjeev Satheesh, Sean Ma, Zhiheng Huang,
Andrej Karpathy, Aditya Khosla, Michael Bernstein, Alexander C. Berg, and Li Fei-Fei. ImageNet
Large Scale Visual Recognition Challenge. In International Journal of Computer Vision (IJCV),
2015.
Kate Saenko, Brian Kulis, Mario Fritz, and Trevor Darrell. Adapting visual category models to new
domains. In European conference on computer vision (ECCV), 2010.
Shiori Sagawa, Pang Wei Koh, Tatsunori B. Hashimoto, and Percy Liang. Distributionally robust
neural networks for group shifts: On the importance of regularization for worst-case generalization.
In International Conference on Learning Representations, 2020.
Hadi Salman, Andrew Ilyas, Logan Engstrom, Ashish Kapoor, and Aleksander Madry. Do adver-
sarially robust imagenet models transfer better? In Advances in Neural Information Processing
Systems, 2020.
Jeffrey C Schlimmer and Richard H Granger. Beyond incremental processing: Tracking concept drift.
In AAAI, 1986.
Vaishaal Shankar, Achal Dave, Rebecca Roelofs, Deva Ramanan, Benjamin Recht, and Ludwig
Schmidt. Do image classifiers generalize across time? arXiv preprint arXiv:1906.02168, 2019.
Ali Sharif Razavian, Hossein Azizpour, Josephine Sullivan, and Stefan Carlsson. Cnn features
off-the-shelf: an astounding baseline for recognition. In conference on computer vision and pattern
recognition (CVPR) workshops, 2014.
Hidetoshi Shimodaira. Improving predictive inference under covariate shift by weighting the log-
likelihood function. Journal of statistical planning and inference, 2000.
Richard Socher, Milind Ganjoo, Christopher D Manning, and Andrew Ng. Zero-shot learning through
cross-modal transfer. In neural information processing systems (NeurIPS), 2013.
Masashi Sugiyama and Motoaki Kawanabe. Machine learning in non-stationary environments:
Introduction to covariate shift adaptation. MIT press, 2012.
Masashi Sugiyama, Matthias Krauledat, and Klaus-Robert MÞller. Covariate shift adaptation by
importance weighted cross validation. Journal of Machine Learning Research (JMLR), 2007.
Christian Szegedy, Wojciech Zaremba, Ilya Sutskever, Joan Bruna, Dumitru Erhan, Ian Goodfellow,
and Rob Fergus. Intriguing properties of neural networks. In International Conference on Learning
Representations (ICLR), 2014.
Rohan Taori, Achal Dave, Vaishaal Shankar, Nicholas Carlini, Benjamin Recht, and Ludwig
Schmidt. Measuring robustness to natural distribution shifts in image classification. arXiv
preprint arXiv:2007.00644, 2020.
Tatiana Tommasi and Tinne Tuytelaars. A testbed for cross-dataset analysis. In European Conference
on Computer Vision (ECCV), 2014.
Antonio Torralba and Alexei A Efros. Unbiased look at dataset bias. In CVPR 2011, 2011.
12Under review as a conference paper at ICLR 2021
Dimitris Tsipras, Shibani Santurkar, Logan Engstrom, Andrew Ilyas, and Aleksander Madry. From
imagenet to image classification: Contextualizing progress on benchmarks. In International
Conference on Machine Learning (ICML), 2020.
Francisco Utrera, Evan Kravitz, N. Benjamin Erichson, Rajiv Khanna, and Michael W. Mahoney.
Adversarially-trained deep nets transfer better. In ArXiv preprint arXiv:2007.05869, 2020.
Gerhard Widmer and Miroslav Kubat. Effective learning in dynamic environments by explicit context
tracking. In European Conference on Machine Learning, 1993.
Yongqin Xian, Bernt Schiele, and Zeynep Akata. Zero-shot learning-the good, the bad and the ugly.
In Computer Vision and Pattern Recognition (CVPR), 2017.
Kaiyu Yang, Klint Qinami, Li Fei-Fei, Jia Deng, and Olga Russakovsky. Towards fairer datasets:
Filtering and balancing the distribution of the people subtree in the imagenet hierarchy. http:
//image-net.org/update-sep-17-2019, 2019. Accessed: 2020-10-01.
Fisher Yu, Haofeng Chen, Xin Wang, Wenqi Xian, Yingying Chen, Fangchen Liu, Vashisht Madhavan,
and Trevor Darrell. Bdd100k: A diverse driving dataset for heterogeneous multitask learning. In
Computer Vision and Pattern Recognition (CVPR), 2020.
Zhun Zhong, Liang Zheng, Guoliang Kang, Shaozi Li, and Yi Yang. Random erasing data augmenta-
tion. In AAAI, 2020.
13Under review as a conference paper at ICLR 2021
A E XPERIMENTAL S ETUP
A.1 DATASET
We perform our analysis on the ILSVRC2012 dataset (Russakovsky et al., 2015). This dataset
contains a thousand classes from the ImageNet dataset (Deng et al., 2009) with an independently
collected validation set. The classes are part of the broader hierarchy, WordNet (Miller, 1995),
through which words are organized based on their semantic meaning. We use this hierarchy as a
starting point of our investigation but modify it as described in Appendix A.5.
For all the B REEDS superclass classification tasks, the train and validation sets are obtained by
aggregating the train and validation sets of the descendant ImageNet classes (i.e., subpopulations).
Specifically, for a given subpopulation, the training and test splits from the original ImageNet dataset
are used as is.
A.2 P IPELINE FORMALIZATION
Recall that our process for evaluating model robustness under subpopulation shift (cf. Section 3) is as
follows. We present the pseudocode for this process in Algorithm 1.
1. Choose a level in the hierarchy and use it to define a set of superclasses by grouping the
corresponding dataset classes together. Note that the original dataset classes form the
subpopulations of the superclasses.
2. For every superclass, select a (random) set of subpopulations (i.e., classes in the original
dataset) and use them to train the model to distinguish between superclasses (we call this
the source domain).
3. For every superclass, use the remaining unseen subpopulations (i.e., classes in the original
dataset) to test how well the model can distinguish between the superclasses (target domain).
Algorithm 1 The B REEDS methodology. Evaluating the training method train on level L of the
hierarchy H—restricted to the subtree under root—using Nsub subpopulations per superclass.
function createDatasets(H, L, Nsub , root):
source, target ← [], []
for node ∈ H do
if node.depth = L and root ∈ node.ancestors and len(node.leaves) ≥ Nsub then
y ← node.label
subclasses ← random.choice(node.leaves, Nsub )
for (i, c) ∈ enumerate(subclasses) do
if i ≤ Nsub / 2 then
domain ← source
else
domain ← target
for x ∈ c.inputs do
domain.append((x, y))
return (source, target)
function evaluateMethod(train, H, L, Nsub , root):
source, target ← createDatasets (H, L, Nsub , root)
model ← train(source)
correct, total ← 0, 0
for (x, y) ∈ target do
correct += (model(x) = y)
total += 1
targetAccuracy ← correct
total
return targetAccuracy
14Under review as a conference paper at ICLR 2021
A.3 W ORD N ET ISSUES
As discussed in Section 4, WordNet is a semantic rather than a visual hierarchy. That is, object classes
are arranged based on their meaning rather than their visual appearance. Thus, using intermediate
nodes for a visual object recognition task is not straightforward. To illustrate this, we examine a
sample superclass grouping created by Huh et al. (2016) via automated bottom-up clustering in
Table 2.
Superclass Random ImageNet classes
instrumentality fire engine, basketball, electric fan, wok, thresher, horse cart, harvester,
balloon, racket, can opener, carton, gong, unicycle, toilet seat, carousel,
hard disc, cello, mousetrap, neck brace, barrel
man-made structure beacon, yurt, picket fence, barbershop, fountain, steel arch bridge,
library, cinema, stone wall, worm fence, palace, suspension bridge,
planetarium, monastery, mountain tent, sliding door, dam, bakery,
megalith, pedestal
covering window shade, vestment, running shoe, diaper, sweatshirt, breastplate,
shower curtain, shoji, miniskirt, knee pad, apron, pajama, military
uniform, theater curtain, jersey, football helmet, book jacket, bow tie,
suit, cloak
commodity espresso maker, maillot, iron, bath towel, lab coat, bow tie, washer, jer-
sey, mask, waffle iron, mortarboard, diaper, bolo tie, seat belt, cowboy
hat, wig, knee pad, vacuum, microwave, abaya
organism thunder snake, stingray, grasshopper, barracouta, Newfoundland,
Mexican hairless, Welsh springer spaniel, bluetick, golden retriever,
keeshond, African chameleon, jacamar, water snake, Staffordshire bull-
terrier, Old English sheepdog, pelican, sea lion, wire-haired fox terrier,
flamingo, green mamba
produce spaghetti squash, fig, cardoon, mashed potato, pineapple, zucchini,
broccoli, cauliflower, butternut squash, custard apple, pomegranate,
strawberry, Granny Smith, lemon, head cabbage, artichoke, cucumber,
banana, bell pepper, acorn squash
Table 2: Superclasses constructed by Huh et al. (2016) via bottom-up clustering of WordNet to obtain
36 superclasses—for brevity, we only show superclasses with at least 20 ImageNet classes each.
First, we can notice that these superclasses have vastly different granularities. For instance, “organism”
contains the entire animal kingdom, hence being much broader than “produce”. Moreover, “covering”
is rather abstract class, and hence its subclasses often share little visual similarity (e.g., “window
shade”, “pajama”). Finally, due to the abstract nature of these superclasses, a large number of
subclasses overlap—“covering” and “commodity” share 49 ImageNet descendants.
A.4 M ANUAL CALIBRATION
We manually modify the WordNet hierarchy according to the following two principles so as to make
it better aligned for visual object recognition.
1. Nodes should be grouped together based on their visual characteristics, rather than ab-
stract relationships like functionality—e.g., we eliminate nodes that do not convey visual
information such as “covering”.
2. Nodes of similar specificity should be at the same distance from the root, irrespective of
how detailed their categorization within WordNet is—for instance, we placed “dog” at the
same level as “cat” and “flower”, even though the “dog” sub-tree in WordNet is much larger.
15Under review as a conference paper at ICLR 2021
Finally, we removed a number of ImageNet classes that did not naturally fit into the hierarchy.
Concretely, we modified the WordNet hierarchy by applying the following operations:
• Collapse node: Delete a node from the hierarchy and add edges from each parent to each
child. Allows us to remove redundant or overly specific categorization while preserving the
overall structure.
• Insert node above: Add a dummy parent to push a node further down the hierarchy. Allows
us to ensure that nodes of similar granularity are at the same level.
• Delete node: Remove a node and all of its edges. Used to remove abstract nodes that do not
reveal visual characteristics.
• Add edge: Connect a node to a parent. Used to reassign the children of nodes deleted by the
operation above.
We manually examined the hierarchy and implemented these actions in order to produce superclasses
that are calibrated for classification. The resulting hierarchy contains nodes of comparable granularity
at the same level. Moreover, as a result of this process, each node ends up having a single parent and
thus the resulting hierarchy is a tree. The full hierarchy can be explored using the notebooks provided
with the hierarchy in the Supplementary Material.
A.5 R ESULTING HIERARCHY
The parameters for constructing the B REEDS benchmarks (hierarchy level, number of subclasses, and
tree root) are given in Table 1. The resulting tasks—obtained by sampling disjoint ImageNet classes
(i.e., subpopulations) for the source and target domain—are shown in Tables 3, 4, 5, and 6. Recall
that for each superclass we randomly sample a fixed number of subclasses per superclass to ensure
that the dataset is approximately balanced.
16You can also read