VTI-Baseline 2011 - 2021: Agri-economic projections for Germany - Thünen-Institut
←
→
Page content transcription
If your browser does not render page correctly, please read the page content below
Sonderheft 358
Special Issue

vTI-Baseline 2011 – 2021:
Agri-economic projections
for Germany

Frank Offermann, Martin Banse,
Markus Ehrmann, Alexander Gocht,
Horst Gömann, Hans-Dieter Haenel,
Werner Kleinhanß, Peter Kreins,
Oliver von Ledebur, Bernhard Osterburg,
Janine Pelikan, Claus Rösemann,
Petra Salamon, Jürn Sanders

Bibliographic information published by
the German National Library
The German National Library lists this
publication in the German National
Bibliography; detailed bibliographic data
are available in the internet at
http://www.d-nb.de/

Bibliografische Information
der Deutschen Bibliothek
Die Deutsche Bibliothek verzeichnet diese
Publikation in der Deutschen Nationalbiblio-
grafie; detaillierte bibliografische Daten sind
im Internet über http:// www.d-nb.de/
abrufbar.

2012

Landbauforschung
vTI Agriculture and
Forestry Research

Johann Heinrich von Thünen-Institut
Federal Research Institute for Rural Areas,
Forestry and Fisheries,
Johann Heinrich von Thünen-Institut
Bundesforschungsinstitut für
Ländliche Räume, Wald und Fischerei (vTI)
Bundesallee 50, D-38116 Braunschweig,
Germany

Responsibility for the content rests
exclusively with the authors.
Die Verantwortung für die Inhalte liegt
bei den jeweiligen Verfassern bzw.
Verfasserinnen.

landbauforschung@vti.bund.de
www.vti.bund.de

Preis / Price 10 €
ISSN 0376-0723
ISBN 978 -3- 86576-084-5
Landbauforschung
vTI Agriculture and
Forestry Research

Sonderheft 358
Special Issue

vTI-Baseline 2011 – 2021:
Agri-economic projections
for Germany
Contents                                                                                           I

Contents

1    Introduction                                                                              1

2    Assumptions                                                                               3
     2.1     General   economic framework                                                      3
             2.1.1     Macroeconomic developments                                              3
             2.1.2     World market prices of agricultural products                            4
             2.1.3     Price developments for agricultural inputs in Germany                   8
             2.1.4     Input endowment and structural changes in German agriculture           10
             2.1.5     Assumptions for organic farming                                        11
     2.2     Policy framework conditions                                                      12
             2.2.1     Trade policy framework conditions                                      12
             2.2.2     Price policy                                                           13
             2.2.3     Quotas and production limits                                           13
             2.2.4     Direct payments of the first pillar of EU agricultural policy          13
             2.2.5     Measures of the second pillar of EU agricultural policy                14
             2.2.6     The subsidisation and use of biofuels and biogas                       15

3    Results                                                                                  17

3.1 Development of agricultural trade                                                         17
     3.2     Producer price developments for agricultural products                            20
     3.3     Demand development                                                               23
     3.4     The development of agricultural production                                       25
     3.5     Income development                                                               28
     3.6     The development of selected environmental indicators                             33
             3.6.1   Environmental policy framework conditions                                33
             3.6.2   The development of the nitrogen balance surpluses                        34
             3.6.3   The development of gaseous emissions                                     37

4    Discussion                                                                               41
     4.1     A comparison of the vTI-Baseline with price projections of other organisations   41
     4.2     A comparison with the vTI-Baseline 2009 – 2019                                   43
     4.3     Reflections on the assumptions and model limits                                  45

5    Summary                                                                                  47

References                                                                                    49

Annex 1        Database and models                                                            53
Annex 2        The development of selected statistics for agricultural trade                  59

Annex 3        Agricultural price developments in Germany                                     63

Annex 4        Regional developments of selected statistics                                   67
Annex 5        The development of selected farm indicators                                    71
II Abbreviations and Acronyms Abbreviations and Acronyms ACP countries African, Caribbean and Pacific Group of States AWU Annual work unit BMELV German Ministry for Food, Agriculture and Consumer Protection BMWi Federal Ministry of Economics and Technology CH4 Methane CO2 Carbon dioxide EAFRD European Agricultural Fund for Rural Development EBA Everything-But-Arms Initiative EEG Renewable Energy Law FADN Farm accountancy data network FAPRI Food and Agricultural Policy Research Institute FAPRI-ISU Food and Agricultural Policy Research Institute of Iowa State University FAPRI-MU Food and Agricultural Policy Research Institute of Missouri University FNVA Farm net value added FNVA/AWU Farm net value added per annual work unit GDP Gross Domestic Product Gg Gigagrams LDCs Least Developed Countries N Nitrogen NEC National emission limits for certain air pollutants NH3 Ammonia N2O Nitrous Oxide NVA Net value added at factor costs UAA Utilised agricultural area USDA United States Department of Agriculture WTO World Trade Organisation
List of Figures                                                                                      III

List of Figures

Figure 2.1:       Projections of world market prices by FAPRI                                         7
Figure 2.2:       Index of the purchase prices of agricultural inputs                                 9
Figure 2.3:       The development of utilised agricultural area in Germany                           10
Figure 3.1:       Agricultural exports of the EU-27 in billions of Euros and share of the EU-27 in
                  global agricultural trade (exports)                                                17
Figure 3.2:       A comparison of agricultural exports of the EU-27 in the years 2007 and 2021       18
Figure 3.3:       A comparison of EU-27 agricultural imports between the years 2007 and 2021         18
Figure 3.4:       Trade balance changes in the EU-27 for selected product groups                     19
Figure 3.5:       The development of agricultural prices in Germany in the vTI-Baseline              21
Figure 3.6:       The development of domestic uses in Germany                                        24
Figure 3.7:       The development of milk production in different farm groups                        28
Figure 3.8:       The development of farm net value added per annual work unit over time
                  (in real terms, 2007 prices)                                                       29
Figure 3.9:       The development of farm net value added per annual work unit over
                  time by farm type (in real terms, 2007 prices)                                     30
Figure 3.10:      The development of farm net value added per annual work unit in the
                  vTI-Baseline, by farm type (in real terms, 2007 prices)                            31
Figure 3.11:      The development of farm net value added per annual work unit in the
                  vTI-Baseline by farm type and size class (in real terms, 2007 prices)              32
Figure 3.12:      The development of family farm income plus wages per annual work unit
                  in the vTI-Baseline by farm type and size class (in real terms, 2007 prices)       32
Figure 3.13:      The development of farm net value added per annual work unit in organic farms
                  (in real terms, 2007 prices)                                                       33
Figure 3.14:      The development of N Inputs and N Outputs per hectare of agriculturally
                  used area                                                                          35
Figure 3.15:      The distribution of the net N balance per hectare in the vTI-Baseline
                  by farm type                                                                       37
Figure 3.16:      The development of methane and nitrous gas emissions of the German
                  agricultural sector from 1990 to 2010 and projections for the year 2020.           38
Figure 3.17:      The development of the ammonia emissions of the German agricultural
                  sector from 1990 to 2010 and projections for the year 2020                         39
Figure 4.1:       A comparison of different price projections for crop products                      42
Figure 4.2:       A comparison of different price projections for meat and dairy products.           43
IV List of Tables
List of Tables
Table 2.1: Assumptions for annual population growth (in %) 3
Table 2.2: Assumptions for annual changes in the gross domestic products (in %) 4
Table 2.3: Assumptions for the price developments of agricultural inputs in Germany 10
Table 2.4 Assumptions for the development of producer price premiums (price
differences) for organic products in comparison to conventionally
produced products 12
Table 2.5: Assumptions for the level of the decoupled direct payments in 2021 (in €/ha) 14
Table 2.6: Changes in the funding of selected measures of the second pillar 15
Table 3.1: Developments in the land use, production and income derived from German
agriculture 25List of Maps V
List of Maps
Map 3.1: Regional significance and changes in milk production in Germany 27
Map 3.2: Regional N-balance and regional stocking rates 36
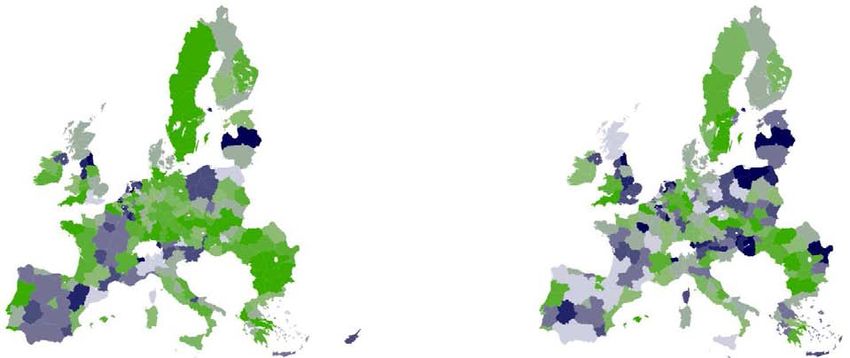
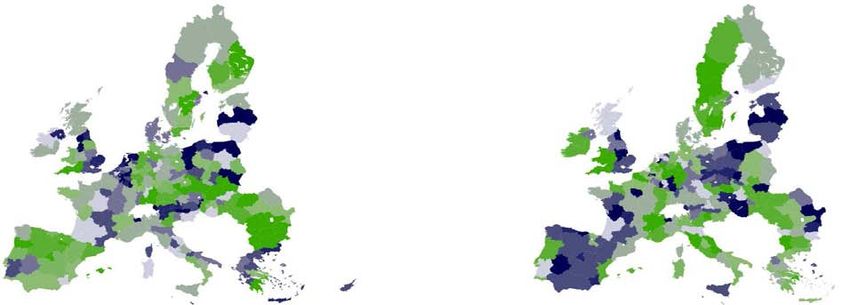
Map 3.3: Environmental indicators for greenhouse gases and ammonia
for the EU-27 40VI List of Figures, Tables and Maps in the Annex
List of Figures, Tables and Maps in the Annex
Figure A1.1: The use of models of the vTI Model Network for the vTI-Baseline
2011 – 2021 55
Table A2.1: The share of the EU-27 in global agricultural trade 61
Table A2.2: Agricultural trade in the EU-27 in a comparison of the years 2004 to 2021 61
Table A2.3: Trade balance changes in the EU-27 for selected agricultural products 61
Table A3.1: Producer Prices in Germany in the vTI-Baseline (€/100 kg) 65
Table A4.1: The extent of selected production processes (2021) 69
Table A4.2: The production quantities of selected production processes (2021) 69
Table A5.1: The development of farm economic indicators by farm type 73
Table A5.2: The development of farm economic indicators, arable crop farms
by region and size of land area used 74
Table A5.3: The development of farm economic indicators, dairy farms by region
and size of land area used 75
Table A5.4: The development of farm economic indicators, other grazing livestock
farms by region and economic size class 76
Table A5.5: The development of farm economic indicators, mixed (compound) farms
by region and economic size class 77
Table A5.6: The development of farm economic indicators, pig and poultry farms by region
and economic size class 78
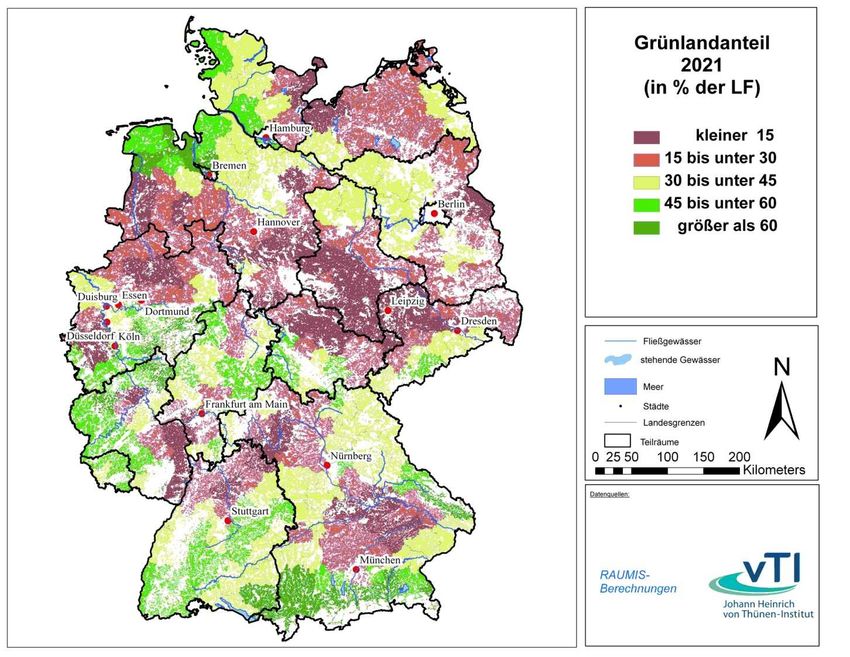
Map A4.1: Regional grassland shares of agricultural land areas (2021) 70vTI-Baseline 2011 – 2021 – Agriculture and Forestry Research Special Issue 358 1 1 Introduction This report presents selected results of the vTI-Baseline 2011 – 2021 as well as the assumptions upon which these results are based. The projections are based on data and information available as of spring 2011. At that point in time the prognoses for the development of the world economy and the prices of oil and agricultural products were marked by moderate optimism. The results of the vTI-Baseline should be considered in this context. The vTI-Baseline projection is not a forecast about the future but rather a description of expected developments should the current agricultural policy be continued in accordance with specific as- sumptions about the development of exogenous influences. The vTI-Baseline thus serves as a reference scenario for analyses of the impacts of alternative policies and developments. Five models were linked to create the vTI-Baseline: the general equilibrium model GTAP, the par- tial equilibrium model AGMEMOD, the model system CAPRI, the regionalised programming model RAUMIS and the farm group model FARMIS (see Annex 1). The target year of the projection is the year 2021. The presentation of the results is mainly concentrated on developments in the German agricultural sector. The assumptions for the development of the exogenous factors and the agricultural policy condi- tions selected for the baseline were chosen in close consultation with experts from the German Ministry for Food, Agriculture and Consumer Protection (BMELV). The discussion of preliminary results based on model calculations was drafted with representatives from the federal states as well as with BMELV representatives. This approach enabled the integration of expert knowledge as well as the definition of a scenario that is accepted as a relevant basis for further policy impact analyses. The vTI-Baseline is drafted and published every two years to provide a reliable and up-to-date ba- sis for policy impact analyses of the vTI and other scientific agencies in Germany. In the case of sudden major changes in the underlying conditions, an update of the vTI-Baseline is carried out as needed. The vTI-Baseline 2011 – 2021 includes, for the first time, a separate chapter on the devel- opment of important environmental impacts of the agricultural sector and thus reflects the increas- ing importance of the climate-relevant impacts of agriculture as well as international obligations to reduce harmful gas emissions.
vTI-Baseline 2011 – 2021 – Agriculture and Forestry Research Special Issue 358                    3

2       Assumptions

The vTI-Baseline is based on exogenous projections of general global economic development gen-
erated by the World Bank, the EU Commission and the “Project Group Common Diagnosis” com-
missioned on behalf of the Federal Ministry of Economics and Technology (BMWi). In addition,
projections of the Food and Agricultural Policy Research Institute (FAPRI) for world agricultural
prices, as well as assumptions on the development of factor prices and factor availability in Ger-
man agriculture, influence the calculations. For the vTI-Baseline, current agricultural policies and
the implementation of approved policy changes are assumed.

2.1           General economic framework

2.1.1         Macroeconomic developments

In the vTI-Baseline 2011 – 2021, macroeconomic developments until the year 2021 are reflected in
simulations, and both historical and projected values are considered. In comparison to the vTI-
Baseline 2009 – 2019 (OFFERMANN et al., 2010), the assumptions made in vTI-Baseline 2011 –
2021 diverge, particularly in the case of the Gross Domestic Product. These changes were induced
by the recent recession and the subsequent recovery of the world economy.

For the projections of population development and the availability of unskilled and skilled labour, a
secondary USDA source (2011a) was incorporated. Here, macroeconomic variables from various
sources, such as the “World Development Report” of the World Bank, are compiled in a common
format and prepared for further use in economic models. Table 2.1 illustrates the assumptions of
population development for Germany, the EU-15, the EU-12 and the world. In Germany, a drop in
population is projected. In the time period from 2007 to 2010, the population in Germany dropped
annually by 0.2 %. It is assumed that this trend will continue in the coming years, and from the year
2013 on, an annual population drop of 0.1 % is expected. Worldwide, population is growing annual-
ly by approximately 1 %. The growth rates of more than two percent in parts of Africa are compen-
sated by drops in population, for example, in Russia.

Table 2.1:                  Assumptions for annual population growth (in %)

                                            2007-2010                 2010-2013     2013-2021

    Germany                                    -0.2                      -0.1          -0.1
    EU-15                                       0.3                       0.2           0.2
    EU-12                                      -0.2                      -0.2          -0.3
    World                                       1.1                       0.9           1.0

    Source: USDA (2011a).

Over the projection period, the real gross domestic product (GDP) in Germany fluctuates between
annual rates of -0.1 and 2.0 % (Table 2.2). As a consequence of the worldwide financial and eco-
nomic crisis, the GDP growth was low in the period from 2007 to 2010. For the subsequent years,
from 2010 to 2013, the “Project Group Common Diagnosis” (BMWi, 2011) predicts an annual in-
crease in the GDP of 2 % per year. Compared to the rest of Europe, Germany was less affected by
the recession. For the time period from 2010 to 2013, the average annual growth rates for the EU-
15 are forecasted to be slightly below the expected GDP growth of Germany. For the group of new
4 vTI-Baseline 2011 – 2021 – Agriculture and Forestry Research Special Issue 358
EU Member States, the forecasts are above the values for the EU-15; thus, a continuation of the
slow harmonisation of economic performance is assumed within the EU. For the time period from
2013 to 2021, it is assumed that economic development will be largely stabilised and that the GDP
for the EU-27 will increase by 2 % annually. For the time period from 2007 to 2010, the average
GDP increases for all 226 countries considered in the vTI-Baseline (aggregated in Table 2.2 under
the “World” category); the average GDP grew by 1.1 %, positively influenced by the growth rates in
China. For the projection period of this baseline, an average worldwide increase of GDPs of 3.4 %
is assumed.
Table 2.2: Assumptions for annual changes in the gross domestic products (in %)
2007-2010 2010-2013 2013-2021
Germany -0.1 2.1 1.6
EU-15 -0.7 1.7 1.9
EU-12 0.9 3.7 3.9
World 1.1 3.4 3.4
Source: USDA (2011b); BMWi (2011).
In addition to changes in policy framework and productivity, also the future exchange rates affect
the competitiveness of imports and exports between different countries or regions. A consequence
of appreciation is, ceteris paribus, that prices in a considered country increase for exports and de-
cline for imports. Thus, the competitiveness of exports declines relative to regions with unchanged
exchange rates or regions with depreciation. In contrast, countries with appreciation must spend
less on imported products. Despite the international financial crisis, international transactions are
always conducted in US dollars; thus, the parity of the US dollar against other currencies plays a
significant role. However, changes in exchange rates are often accompanied by adjustments in the
world market prices. Over the last few years, due to the fundamental changes in commodity mar-
kets, the US dollar has continually lost value against most currencies, including the Euro. For the
projection time period of 2011 to 2021, it is assumed that the phase of increased volatility of the
Euro-US-dollar exchange rate had not yet passed. For the projection time period, a relatively stable
Euro-US-dollar exchange rate of €1.32 €/$ is assumed, with an increase to 1.50 €/$ by 2021.
2.1.2 World market prices of agricultural products
Within the partial model AGMEMOD, world market prices for agricultural products are exogenous.
In the year 2011, the Food and Agricultural Policy Research Institute of Iowa State University (FA-
PRI-ISU) published a projection of world market prices that was used to establish the vTI-Baseline
1
2011 – 2021 (FAPRI-ISU, 2011).
In general, current projections for the world market prices of agricultural products exceed the price
levels of the year 2010. Higher economic growth implies a significantly higher demand on a world-
1
In contrast to FAPRI-projections from previous years, this projection was not developed cooperatively with the Food
and Agricultural Policy Research Institute of Missouri University (FAPRI-MU) or other institutions due to budget re-
strictions of the concerned institutions. A revised version of the projections for the US market was issued by FAPRI MU
at the end of August but could not be considered in the vTI-Baseline (FAPRI-MU 2011). In the projections for August,
the prices of plant products for the period from 2011 to 2021 are between 10 % and 20 % higher than those projected
by FAPRI-ISU.vTI-Baseline 2011 – 2021 – Agriculture and Forestry Research Special Issue 358 5
wide basis. In particular, the driving forces are the prominent economic recovery, beginning in
Asian countries, tied with comparably low inflation rates. In addition, the economy in South America
has begun to gain momentum, but this improvement is accompanied by higher inflation rates. A
further demand factor in both the USA and the EU are the political targets for bioenergy. It is im-
portant to consider that international trading is conducted in US dollars. Concerning the future de-
velopment of the exchange rate in contrast to the Euro, the FAPRI-ISU projections forecast a de-
preciation of the US dollar (see Chapter 2.1.1). These assumptions imply that despite increasing
world market price projections in US Dollars, world market prices in Euros yield slightly lower in the
second half of the projection period.
The projections provided here are not short-term forecasts but rather mid-term projections depend-
ing on the exogenous assumptions made on macroeconomic development, policy measures and
average weather conditions. In reality, however, world market prices have always been affected by
significant fluctuations resulting from a variety of factors: weather-influenced changes in yield devi-
ating from long-term trends cause that supply is different than expected. Exogenous influences
(e.g., financial crises) may cause faster or slower growth, and the exchange rates between the
currencies may fluctuate. Worldwide policy measures in the agricultural or other policy sectors
have an effect (e.g., an export stop by one country), or consumers react with reduced demand to
food-related scandals or other undesirable developments. All of these factors occur in the short
term and are exogenous to the system, meaning that the models employed here are unable to pro-
ject them.
In this context, recent years can be seen as exemplary: the worldwide demand for bioenergy has
created a further demand for raw materials in addition to the existing demands for food and feed. At
times, the demand could only barely be fulfilled due to reduced stocks. However, short- to mid-term
setbacks in economic development led to drops in demand. Thus, for example, the period from the
beginning of 2007 to the middle of 2008 was characterised by high prices in the world agricultural
markets driven by rapidly rising demand due to high economic growth in emerging countries, high
2
energy prices and increasing inflation. However, the politically induced demand for biogenic fuels ,
in addition to weather, also induced production cutbacks by important players (e.g., milk production
in Australia) and led to price peaks (Figure 2.1). Optimal weather conditions in many regions in the
subsequent marketing year 2008/09 and price-induced production expansion led to an excellent
harvest and an abundant supply. This high supply faced a reduced demand due to the global finan-
cial crisis. Accordingly, the price trend from 2009 to the second half of 2010 was, after the price
peak, significantly downward.
In contrast, the world market prices for oil seeds increased in 2010/11 because in some important
production regions (e.g., soybeans in Argentina, Brazil and the USA; rapeseed in the EU), produc-
tion was limited due to weather influences such that, globally, it could not catch up with the growing
demand. A recovery of the yields and a minimal price-based area expansion led to weak expecta-
tions for oil seeds in 2011/12. This development was compensated for by the increasingly dynamic
3
economy in 2011/12. In the mid- to long term, the demand, and thus prices, remain at a relatively
high level. The high demand for vegetable oils for food and biodiesel precipitated an accordingly
high processing rate of oil seed and accordingly high prices in US dollars, which, due to the ex-
2
This demand led to a high level of competition between food and non-food production in agricultural areas.
3
The assumptions on economic growth do not reflect any future impacts of the national debt crisis.6 vTI-Baseline 2011 – 2021 – Agriculture and Forestry Research Special Issue 358 change rate development, did not result in increases in Euro prices. Due to the high prices, a large amount of oil meal, especially rape meal, is available. Additionally, the production expansion in the animal sector led to an increasing demand for feed but only if the prices for oil meals dropped be- low average in contrast to those for vegetable oils. Due to the existing demand for the use of soy meal in feeding, soy meal prices were higher than the prices of rape or sunflower meal. The prices for oil seeds are derived from the prices for their oil and protein components, which leads the pric- es for rapeseed to be somewhere between the prices for sunflower seeds and soy beans because soy meal is valued more highly. Prices in Euros are expected to decrease in 2013/14 due to cur- rency influences. In the year 2011/12, the greater demand for grains in Asia is linked to a reduced supply because the US crop production, particularly of wheat, did not meet expectations due to floods and drought. This situation implies increasing prices for wheat. In comparison, the corn prices will drop in 2011/12. However, due to changes in the exchange rate, the impact in Euros will be relatively low. Over the mid- and long term, the grain prices in US dollars will remain high, whereas the price in Euros will decline in 2013/14. A price difference between wheat and the coarse grains maize and barley continues over the long term. In the areas of feeding, coarse grains may substitute partially for meals and vice versa. In contrast, in the case of maize, there is also competition between the use of raw material for food processing, animal feed and ethanol as a biofuel; thus, depending on economic developments, the prices may also tend to follow wheat prices.
vTI-Baseline 2011 – 2021 – Agriculture and Forestry Research Special Issue 358                                                                       7

Figure 2.1:              Projections of world market prices by FAPRI

                                Cereals (€/t)                                                              Oilseeds (€/t)
300                                                                          600

250                                                                          500

200                                                                          400

150                                                                          300

100                                                                          200

  50                                                                         100

   0                                                                           0
       2000     2003     2006   2009     2012     2015      2018     2021           2000   2003    2006     2009    2012      2015     2018       2021

               Wheat,               Barley,                Corn,                           Rapeseed,         Soybeans,          Sunflower,
               US Golf              US Portland            US Golf                         cif Hamburg       cif Rotterdam      cif Niederrhein

                           Oilseed meals (€/t)                                                        Vegetable oils (€/t)
400                                                                         1.400

350                                                                         1.200
300
                                                                            1.000
250
                                                                             800
200
                                                                             600
150
                                                                             400
100

  50                                                                         200

   0                                                                           0
       2000     2003     2006   2009     2012     2015      2018     2021           2000   2003    2006     2009    2012      2015     2018       2021

              Rapeseed meal,       Soybean meal,          Sunflower meal,                  Rapeseed oil,      Soybean oil,         Sunflower oil,
              fob Hamburg          cif Rotterdam          cif Rotterdam                    cif Hamburg        cif Rotterdam        fob NW Europe

                         Meat prices (€/100 kg)                                                   Dairy products (€/100 kg)
300                                                                          400

                                                                             350
250
                                                                             300
200
                                                                             250

150                                                                          200

                                                                             150
100
                                                                             100
  50
                                                                              50

   0                                                                           0
       2000     2003     2006   2009     2012     2015      2018     2021           2000   2003    2006     2009    2012      2015     2018       2021

              Steer, Nebraska       Broiler, US 12-city        Lamb                 Skimmed milk powder, fob N Europ.         Cheese, fob N Europ.
              Pork, Base 51-52 % Lean Equivalent                                    Whole milk powder, fob N Europ.           Butter, fob N Europ.

Source: FAPRI (2011).
8 vTI-Baseline 2011 – 2021 – Agriculture and Forestry Research Special Issue 358
4
Following the financial crisis of 2007/08 , increasing income and worldwide population growth led
to higher demand for all animal products. Especially prominent were the production and demand
increases in pork. Rising production costs due to higher cereal and soy meal prices, as well as
increasing opportunity costs for land, induced, in the mid-term, higher prices for animal products
worldwide. However, the price increases in Euros were comparably moderate; accordingly, the
profit margins for producers were under pressure. Thus, in animal breeding, the prices in the pro-
jection period drop only temporarily in 2014 and 2015. In contrast, the price increases for ruminants
are somewhat higher and drop in Euros, similar to the developments in the plant sector, after 2013.
Clearly defined are the mid-term increases in the global milk product prices. For most dairy prod-
ucts (with the exception of butter), the prices in Euros through 2013 remain at a high level. After
2013, prices drop due to currency effects until 2017, but they remain at a high level compared to
the period from 2000 to 2006. This trend also holds true for butter, for which the Euro prices, which
begin at a very high level, drop by the end of the projection period. In accordance with demand, the
prices for products with higher protein content, such as cheeses, are higher than for products with
higher fat content, such as butter. Due to the demand from Asian countries, the prices for whole
milk powder are higher than those for skim milk powder. World market prices of milk derived from
butter and skim milk powder are projected to be approximately 30 €/100 kg for 2021. However, this
price calculation does not consider better returns from other milk usages. In recent years, the world
market prices for milk products were marked by significant price fluctuations within one year. These
price fluctuations were often due to yield fluctuations caused by weather conditions in regions more
dependent on their roughage basis. The price increases induce production expansions in other
regions; however, fluctuations within a single year cannot be adequately projected within the mod-
els currently available.
In summary, international prices, noted in Euros, will plateau at comparably high levels.
2.1.3 Price developments for agricultural inputs in Germany
The development of prices for agricultural inputs in the past differed greatly depending on product
group (Figure 2.2). Energy prices have increased disproportionately for several years. These in-
creases have impacted the prices of other production factors, especially fertilisers, in recent years.
In addition, in the past few years, the increase in producer prices for agricultural products has led
to an increase in the demand for agricultural inputs, which, in turn, increased the prices of these
inputs.
4
The national debt crisis is not yet reflected in the projections .vTI-Baseline 2011 – 2021 – Agriculture and Forestry Research Special Issue 358 9
Figure 2.2: Index of the purchase prices of agricultural inputs
140
Plant protection
130 Agricultural buildings - maintenance
Machinery - maintenance
120
Agricultural buildings - new acquisition
Machinery - new acquisition
2000 = 100
110
100
90
80
70
60
95 96 97 98 99 00 01 02 03 04 05 06 07 08 09 10
400
Fertilisers, total
350
Nitrogen fertiliser a)
300 Phosphorus fertiliser a)
Potash a)
2000 = 100
250 Energy and lubricants
200
150
100
50
0
01/95 01/96 01/97 01/98 01/99 01/00 01/01 01/02 01/03 01/04 01/05 01/06 01/07 01/08 01/09 01/10 01/11
a) Publication of price indices of single nutrient fertilisers was discontinued in 1/2010.
Source: Stat. Bundesamt (diff. years), own assumptions and calculations.
A projection of the prices for farm inputs in future years is extremely difficult in light of existing mul-
tiple uncertainties, for example with regard to crude oil prices and energy policies. For the vTI-
Baseline 2011 – 2021, a pragmatic trend projection on the basis of the period from 2000 to 2010
was selected for most farm inputs. For energy, the price developments were coupled to the crude
oil price projections by FAPRI. A different approach was selected for fertilisers because their ex-
treme price fluctuations in recent years do not make a trend projection seem reasonable. For the
price development of fertilisers, it was assumed that, over the long term, fertiliser prices will follow
the increasing prices of energy because energy costs make up the greater part of the manufactur-
ing costs for nitrogen fertilisers.10 vTI-Baseline 2011 – 2021 – Agriculture and Forestry Research Special Issue 358
Table 2.3: Assumptions for the price developments of agricultural inputs in Germany
Observed Assumption vTI-Baseline
2000-2010 2011-2021 2021 zu 2006-08
% p.a. % p.a. % p.a. % total
Consumer price index (inflation rate) 1.6 1.6 1.5 24
Plant protection -0.3 0.0 0.3 4
Agricultural buildings - new acquisition 1.9 2.2 2.2 36
Machinery - new acquisition 2.4 2.2 2.4 40
Agricultural buildings - maintenance 1.6 2.5 2.4 40
Machinery - maintenance 3.3 2.5 2.6 44
Energy Crude oil 103 $/bbl in 2021 2.4 40
Nitrogen fertiliser 2.8 a) 3.9 70
Phosphorus fertiliser 2.8 a) 4.7 89
Potash 2.8 a) 3.8 68
Other fertiliser 2.8 a) 4.0 72
Prices of all other inputs and wages projected to increase with inflation rate.
a) From 1/2010.
Source: Stat. Bundesamt (diff. years), own assumptions and calculations.
2.1.4 Input endowment and structural changes in German agriculture
The utilised agricultural area (UAA) in Germany in the period from 1999 to 2009 showed a continu-
ous decline of approximately 26,200 ha annually. Because the lowest limit for farm documentation
in the framework of the agricultural survey in 1999 and 2010 was increased from 1 to 2 ha and then
from 2 to 5 ha, approximately 200,000 ha and then 160,000 ha of UAA were no longer document-
ed. The documented UAA in 2010 overall was approximately 16.7 million ha (Figure 2.3). Should
the average annual decline of 26,200 ha in the period from 2009 to 2021 continue, the expected
UAA will be approximately 16.5 million ha in 2021.
Figure 2.3: The development of utilised agricultural area in Germany
18.5
18.0
17.5
Million ha
17.0
16.5
16.0
15.5
15.0
1990 1992 1994 1996 1998 2000 2002 2004 2006 2008 2010 2012 2014 2016 2018 2020
Source: Federal Statistic Agency; own assum ptions and calculations.vTI-Baseline 2011 – 2021 – Agriculture and Forestry Research Special Issue 358 11
The structural change in agriculture can be seen in the constantly decreasing number of farms and
farm employees. Thus, the number of farms in the former German states over the past 30 years
has declined annually by 3.4 %, and the number of family members working on the farms has
dropped annually by 3.2 %. However, great differences exist depending on region, farm size, and
farm type. The structural change is thus differentiated in the vTI-Baseline scenario according to
federal state, size, and main production type and based on the continuation of existing trends. For
farms represented by the farm accountancy data network, this approach results in an annual de-
crease in the number of farms of 2 % overall.
2.1.5 Assumptions for organic farming
For the vTI-Baseline 2011 – 2021, expert estimates were used to develop specific assumptions
5
about the development of important exogenous model parameters for organic farming. The focus
was on future yield and price development for organic products in Germany. According to expert
estimates, the development of the yield gap between conventional and organic farming depends
primarily on incentives for the intensification or extensification of conventional farming as well as on
advances in organic plant breeding. For the vTI-Baseline scenario, experts developed the following
assumptions with regard to yield development in organic farming:
– For plant products, yield increases are 50 % lower than in conventional farming (exceptions:
oilseed and legumes, with 25 % lower yield increases).
– For egg-laying performance, yield increases are 25 % less than in conventional farming.
– Milk yield increase depends on the initial milk yield level (higher yield increase for low initial levels).
With regard to future price developments, the experts assumed that the very high price difference
between organic and conventionally produced products seen in 2008 would not be maintained and
that, essentially, the prices for organically produced products can be assumed to develop in paral-
lel to the prices of conventionally produced products over the mid- and long term.
On the basis of expert discussions and a subsequent written survey of market experts in the field of
organic products, a slight reduction of the price premium for crops was assumed for the vTI-
Baseline in general, and an increase in price premiums (or, rather, the share of organically pro-
duced products that can be marketed with a price premium) was assumed for animal products.
Table 2.4 presents an overview of the assumptions for producer price developments of important
organic products in the vTI-Baseline scenario.
5
The expert based projections of yield and price developments in organic farming were established within the research
project „Economic performance of organic farming in Germany under changed agricultural policy framework conditions”
(supported within the federal programme for organic farming, project 06OE224).12 vTI-Baseline 2011 – 2021 – Agriculture and Forestry Research Special Issue 358
Table 2.4 Assumptions for the development of producer price premiums (price differences)
for organic products in comparison to conventionally produced products
Price premium Assumption on price premium
in 2005-2007 in the baseline
Wheat 100 % 100 %
Rye 76 % 70 %
Barley 55 % 50 %
Beef 10 % 20 %
Milk 24 % 28 %
Source: National FADN and Sanders et al., 2011.
No differences were assumed between organic and conventional farm groups with respect to tech-
nical progress, resource availability and structural change. With regard to structural change, this
means that the conversion from previously conventional farms to organic farms is not explicitly
considered. The absolute number of organic farms drops by 1,100 farms in the vTI-Baseline from
the basis period. In contrast, the relative share of organic farms in all agricultural holdings increas-
es by 0.2 %.
2.2 Policy framework conditions
2.2.1 Trade policy framework conditions
Only slight adjustments in trade policy conditions were made in the context of this vTI-Baseline for
the EU, for which the expansion to 27 Member States concluded in 2007, and also for the WTO.
The adjustments in the vTI-Baseline were concentrated on trade policies that directly affect the EU-
27. In addition, the accession of the Ukraine to the WTO is considered because the EU is the most
important trading partner for the Ukraine. Through its accession on February 5, 2008, the Ukraine
obligated itself to decrease its tariffs stepwise until the year 2013. Through the opening of the
Ukraine market, trade-diverting and -creating impacts influenced world agricultural markets that
were already considered in the vTI-Baseline 2009 – 2019 and also in the current vTI-Baseline.
In addition, it is assumed that the 2010 Everything-But-Arms Initiative (EBA-Initiative) was com-
pletely implemented. Since 2001, the EU has provided the 49 poorest countries in the world (LDCs,
Least Developed Countries) with tariff and quota-free market access for all products (except weap-
ons) in the context of this initiative. For bananas, sugar and rice, the temporary privileges expired
6.
in 2009.
6
As the EU has not yet finalised treaties with all countries in Africa and the Caribbean and Pacific region (ACP coun-
tries), the baseline assumes that no quota- and tariff free access between the EU and the ACP exists in 2021.vTI-Baseline 2011 – 2021 – Agriculture and Forestry Research Special Issue 358 13
2.2.2 Price policy
Interventions for pork, corn and barley have been eliminated, or, rather, the intervention amounts
have been reduced to zero. Due to the market conditions at this time, the export-promoting
measures for the dairy sector were removed from the vTI-Baseline; however, should world market
prices drop, these measures can be re-activated. In regard to the substitution of normal fuels with
biofuels, it was assumed that the goal of 10 % of total fuel use to be biofuels would be reached by
7
2021 under the new framework conditions for the field of liquid biofuels.
2.2.3 Quotas and production limits
The vTI-Baseline scenario considers the increase of milk quotas by 2 percent from April 1, 2008, as
well as the further stepwise increases by a total of 5 percent mandated by the Health Check in the
time periods of 2009/10 and 2013/14. The adjustment of the fat-correction factors as of 2009/10
allows Germany a further increase in the delivery amounts of approximately 1.5 %. Based on cur-
rent decisions, an expiration of the milk quota is assumed for the year 2015.
With regard to sugar market regulation, the returns of delivery rights in the framework of a restruc-
turing program through March 6, 2009, are taken into account. In addition, in the framework of the
vTI-Baseline, no further cuts are expected until 2021; thus, the sugar quotas in Germany in the
target year are at 2.9 million tons of sugar. The obligatory area set aside was repealed with the
Health Check mandates.
2.2.4 Direct payments of the first pillar of EU agricultural policy
In the vTI-Baseline, it is assumed that funds available for direct payments will be continued through
2013 and that no budget cuts will be necessary. In Germany, the implementation of the farm pre-
mium regulations led to standard state-area premiums. The regional averages for the values as-
8
sumed for the target year include the direct payments still to be decoupled by 2013. The direct
payments range from 296 €/ha for Saarland and Rhineland Palatinate up to 366 €/ha in Lower
Saxony/Bremen (Table 2.5).
7
The targets were recalculated for the demand for biodiesel and ethanol based on the expected use of fuel.
8
In Germany, this refers to payments for protein crops, starch potatoes, dry feed, flax and hemp.14 vTI-Baseline 2011 – 2021 – Agriculture and Forestry Research Special Issue 358
Table 2.5: Assumptions for the level of the decoupled direct payments in 2021 (in €/ha)
Regional Regional Regional
Target value Mark up value Value
(estimated) (estimated)
Region €/ha
Baden-Württemberg 308.05 0.7 309
Bavaria 354.55 6.4 361
Brandenburg/Berlin 300.30 5.3 306
Hesse 299.58 0.3 300
Mecklenburg-West Pomerania 329.44 3.5 333
Lower Saxony/Bremen 352.28 14.1 366
North Rhine-Westphalia 359.44 0.3 360
Rhineland-Palatinate 294.54 1.0 296
Saarland 258.96 36.5 296
Saxony 357.26 1.5 359
Saxony-Anhalt 354.97 3.2 358
Schleswig-Holstein/Hamburg 358.83 0.1 359
Thuringia 346.35 1.2 348
National average 339.23 4.8 344
Source: BMELV (2011).
2.2.5 Measures of the second pillar of EU agricultural policy
For the projection of the funding of measures for rural development, the current expenses in the
previous programme period from 2000 to 2006 are compared with those of the approved budget for
the new period. This comparison should reflect long-term trends in the focus of the programmes.
Because 2007 is not suited for use as the first year of the new programme period, the planned de-
velopment of the programmes in the period from 2007 to 2013 is reflected. Furthermore, in 2007,
existing obligations from the previous period played an important role. Because of their relevance
for farm support, the following measures were selected for comparison: investment aid, area pay-
ments for less-favoured areas, and payments in the context of Natura 2000 and the agri-
environment. Budget expenses from the EU, national and state governments for the measures un-
der Regulation (EG) 1257/1999 for the time period from 2000 to 2006 are compared with planning
data for the implementation of measures according to Regulation 1698/2005 (European Agricultural
Fund for Rural Development (EAFRD) Regulation; see TIETZ, 2007), and specific federal state
trends are identified.
Due to cuts in the EU co-financing funds, additional national funding, according to Article 89 of the
ELER-Regulations, played an important role in the new programme period. For this reason, purely
national support measures are considered for the period 2000 to 2006 as well. Complete data were
available for investment aid and payments for less-favoured areas; for agri-environment measures,
in contrast, available data on expenses for the period from 2000-2006 were not complete for those
measures exclusively financed by federal states. In the current programme period, the average
investment aid will be further increased, whereas the budgets for less-favoured areas and agri-
environmental measures will be reduced, according to the data. However, the developments in
individual federal states differ substantially.
Additional EU funds, which were made available to increase the budget for EAFRD Measures in
2013 in accordance with the Health Check decision to increase modulation, are considered. It is
assumed that 80 percent of the fund increases will be used for a proportional increase in invest-vTI-Baseline 2011 – 2021 – Agriculture and Forestry Research Special Issue 358 15
ment aid, payments in less-favoured areas and agri-environmental measures. In accordance with
these assumptions, no additional increase in the EAFRD budget will occur because there are still
sufficient national funds in the existing EAFRD budgets of the federal states for co-financing. In the
modified financial planning of 12 of the 13 federal states for the current EAFRD period, an increase
in investment aid as well as in the budget for less-favoured areas is planned. The agri-
environmental budget was increased in 10 federal states (see TIETZ, 2010). For the baseline pro-
jection, it is assumed that budgets will continue through the year 2020 on the basis of changes
shown in Table 2.6.
Table 2.6: Changes in the funding of selected measures of the second pillar
EAFRD measure Investment aid Less favoured areas Agri-environmental
measures
Region Planned budget for 2013 in percent of budget spent in 2000-2006 a)
Baden-Württemberg 91 56 85
Bavaria 74 94 79
Brandenburg/Berlin 44 89 82
Hamburg 104 366 174
Hesse 137 84 111
Lower Saxony/Bremen 174 132 209
Mecklenburg-West Pomerania 130 32 126
North Rhine-Westphalia 96 78 116
Rhineland-Palatinate 116 70 104
Saarland 77 0 73
Saxony 190 103 39
Saxony-Anhalt 120 187 129
Schleswig-Holstein/Hamburg 120 230 229
Thuringia 53 100 110
National average 141 88 92
a) Including planned EAFRD art. 89 measures (2007-2013) (i.e. financed without EU), for 2000-2006 nationally financed measures are
considered as fas as data are available.
Source: Tietz (2007).
2.2.6 The subsidisation and use of biofuels and biogas
The expansion of biogas production will be promoted through the Renewable Energy Laws (EEG),
the revision of which took effect on January 1, 2012. The extent to which the revision affects the in-
vestment behaviour of biogas facilities, upon which the regional biomass crops largely depend, can
hardly be estimated. For this reason, the current regional investment dynamic was continued for two
years to consider the biogas facilities already under construction or in planning and to estimate their
biomass requirements. The status thus achieved will be maintained until the target year 2021 due to
the 20-year guaranteed protection of interests and the crop areas required for the production of the
biomass.
The present vTI-Baseline takes the observance of the fuel-blending goals of the EU and their im-
plementation into account. Here, however, for the total projection period, the implementation of the
mandatory blending proportions for fuels is assumed. The conversion of the substitution quotas of
fossil fuels with biofuels on the basis of energy content in a climate protection quota from 2015 is,
however, not considered. In addition, no consideration is given to the use of second-generation
biofuels.vTI-Baseline 2011 – 2021 – Agriculture and Forestry Research Special Issue 358 17
3 Results
3.1 Development of agricultural trade
The implementation of the mixture quotas for biofuels, the (minimal) adjustments to trade policy
and the changes in the macroeconomic framework conditions lead to a change in the trade flows in
the vTI-Baseline. Figure 3.1 shows how global agricultural trade develops from 2007 to 2021. Here,
the EU exports are related to the trade values of other exporters. Additionally, a differentiation is
drawn between internal EU trade and EU exports in non-EU-countries. In the base year 2007, the
internal trade of the EU was worth almost three times more than trade with non-EU-countries. Over
time, the importance of EU trade with non-EU-countries increases. In 2007, the EU exported agri-
cultural products with a value of 37 billion Euros to other countries; this value increases by the year
2021 to 41 billion Euros. The participation of the EU in global agricultural trade decreases from
16 % to 13 %. The question arises as to the causes of this decline in the export portion of the EU.
In Figure 3.2, the countries and regions to which the EU exports are presented. In the base year
2007, the USA, European countries, including Russia and Turkey, and Asia are the most important
importers of EU agricultural products. Over time, trade with some of these countries and groups of
countries increases only slightly, whereas trade with other countries remains at a relatively con-
stant level or even decreases.
Figure 3.1: Agricultural exports of the EU-27 in billions of Euros and share of the EU-27 in
global agricultural trade (exports)
500 25
Share of EU-27 on world trade
Intra EU-27 trade
Extra EU-27 trade
400 20
Other exporter
300 15
Sharel in %
Billion €
200 10
100 5
0 0
2007 2010 2013 2021
Source: Own calculations with GTAP (2011).
It can be seen in a sector disaggregation of agricultural trade that the increase in exports from the
EU to Asia (and here particularly to China) is due to the increasing demand for poultry meat and
pork as well as beef. The exports of plant products to China hardly rise. Additionally, the EU can
increase its export of milk products to Africa and Asia.18 vTI-Baseline 2011 – 2021 – Agriculture and Forestry Research Special Issue 358
Figure 3.2: A comparison of agricultural exports of the EU-27 in the years 2007 and 2021
16
14 2007
2021
12
10
Billion €
8
6
4
2
0
North Central & Russia, Trukey Africa Asia Oceania
America South America and other Europe
Source: Own calculations with GTAP (2011).
How is the import situation in the EU? What are the most important countries or regions from which
the EU purchases its agricultural products? In Figure 3.3, the EU-27 imports for the year 2007 are
compared to the imports in 2021. It can be seen that the EU imports from virtually all countries in-
crease. This effect is caused, particularly in the vTI-Baseline, by the implementation of the fuel
mixture obligations in the framework of the EU biofuel regulations. The declining population devel-
opment in the EU tends to contribute to the declining import values of the EU, but the vTI-Baseline
results clearly describe that the EU cannot fulfil the mixture requirements of the biofuel regulations
from domestic production of the necessary raw materials and is dependent on imports. The results
show that imports from North and South America (oilseeds and coarse grains), but also from Asia,
increase significantly in the considered time period of 2007 to 2021.
Figure 3.3: A comparison of EU-27 agricultural imports between the years 2007 and 2021
30
2007
25
2021
20
Billion €
15
10
5
0
North Central & Russia, Trukey Africa Asia Oceania
America South America and other Europe
Source: Own calculations with GTAP (2011).vTI-Baseline 2011 – 2021 – Agriculture and Forestry Research Special Issue 358 19
Figure 3.2 and Figure 3.3 show that EU exports to most countries stagnate or increase only slight-
ly, whereas the import values increase significantly. However, how do the imports develop in rela-
tion to the exports? To answer this question, Figure 3.4 shows the changes in the trade balance.
The trade balance is defined here as the changes in exports minus the changes in imports. A dif-
ferentiation between the individual product groups provides additional information on the develop-
ment of the agricultural trade of the EU. For all products, the trade balance considered for the en-
tire time period of the vTI-Baseline is negative. This negative balance indicates that the imports
increase strongly in comparison to the exports, or rather that they decrease less. The strongest
increase in the trade balance deficits in the agricultural product and food sectors is attributable to
the crops used for biofuel production (oil seeds and coarse grains). For animal products and pro-
cessed foods, there is only a slight change in the trade balance. The negative development of the
EU trade balance is mainly due to the assumptions of energy policy measures (biofuel regulations)
and to macroeconomic variables. In the vTI-Baseline 2009 – 2019, the decline in the EU population
and the increase in per capita income in other parts of the world led to a significant increase in the
EU's net exports, this increase was overshadowed by the implementation of biofuel regulations.
Through the more rapidly increasing GDP in countries such as China, Brazil, Russia and India,
there is a greater demand for processed agricultural products and meat. In comparison to the ad-
justment of macroeconomic variables, the implemented trade policies in the vTI-Baseline have only
a slight effect on most products. An exception is sugar; the implementation of the EBA-Initiative led
to an increase in sugar imports from the poorest countries in the world, the so-called LDCs. Also, in
the case of beef, the EBA-Initiative led to an increase of imports from the LDCs. This effect, how-
ever, is overcompensated by the growth in demand in countries outside of the EU, causing the
trade balance changes to show positive signs.
Figure 3.4: Trade balance changes in the EU-27 for selected product groups
0
-5
-10
-15
Billion €
-20
-25
2007
-30 2021
-35
-40
Agricultural products Agricultural Arable hereof Livestock Processed
and processed food products crops used in biofuel processing and dairy food
Source: Own calculations with GTAP (2011).20 vTI-Baseline 2011 – 2021 – Agriculture and Forestry Research Special Issue 358 In the interpretation of these results, it is important to note that only approved trade policies are considered in the vTI-Baseline. The current WTO negotiations were, for example, not implemented. Thus, it will be possible in later analyses to quantify the impacts of the WTO trade liberalisation on the basis of the vTI-Baseline. The presented results thus reflect a situation in which the EU still pays export refunds and collects, for example, tariffs of an average of 134 % on sugar or 66 % on beef imports. With a further trade liberalisation in the framework of a successful conclusion of the current WTO round, the EU will more strongly export products for which it is internationally compet- itive with minimal external protection. Trade liberalisation will be a challenge for sectors that have profited from external protection, such as beef or sugar. For other sectors, in contrast, new export possibilities will emerge because external protection against the EU will be reduced. 3.2 Producer price developments for agricultural products The vTI-Baseline 2011 – 2021 is marked by strong economic growth following the financial crisis and an increasing world market price level. The increase in the world market prices in US dollars does not lead to an increase in Euro prices because the anticipated development of exchange rates implies a slight revaluation of the Euro vs. the US dollar. The German price level will also be influenced by energy policy requirements. In this concern, the politically induced demand for bioen- ergy and the input reimbursement according to the Renewable Energy Laws (EEG) should be men- tioned. Thus, the demand for appropriate products such as rapeseed oil and wheat is largely inde- pendent of changes to the prices of these products. In addition, the development of overall fuel demand has an influence because, with fixed blending rates, the required amounts of raw material are based on the demand for biofuel. Depending on the price relation, the product mixture of raw materials can change. On the one hand, the relation between gasoline and diesel can shift; on the other hand, different oils can be used, either from domestic or imported oil seeds. In addition, oil can be directly imported. The same holds true for ethanol. In Germany, the main raw materials are rapeseed for the production of vegetable oil, imported rapeseed oil and maize for the production of biogas, and wheat for the production of ethanol. These additional sales limit possible feedstock price drops, or rather, induce price increases; however, they do not appear to reduce the relatively volatile grain and oil seed prices of the past years. Also in the future, product prices can vary signif- icantly either up or down depending on supply and demand fluctuations in contrast to the annual average or multiple-year average. A decrease would be limited, to a certain extent, through inter- vention. In the vTI-Baseline 2011 – 2021, the high global market prices in the projections also tend to lead to higher domestic market prices. In Germany, the price level has risen significantly for grain since 2008/09 (see Figure 3.5) and is thus above the intervention price level for wheat. Since the produc- tion of grain in 2010 did not meet the expected levels, but demand and export were comparatively high, the grain prices in 2010/11 generally increased. This development was driven by a price- related limit of the crop areas in Germany, and the weather conditions were unfavourable to the yields. Maize was the exception to the yield reductions. Due to the price development in Euros on the global market and improved production, the prices for the main grain varieties decreased. After a slight recovery in 2012/13, the prices plateau but at a comparatively high level. In the vTI- Baseline projection, wheat, in particular, profits from the demand for raw materials for ethanol pro- duction. The situation differs by feed grain variety. According to the world market price develop- ment, feed grain prices tend to be weaker, and particularly barley is affected. The effective extent of price differences will be largely dependent on general economic development and thus on the demand for biofuels coupled with fuel developments.
vTI-Baseline 2011 – 2021 – Agriculture and Forestry Research Special Issue 358                                                                 21

Figure 3.5:                 The development of agricultural prices in Germany in the vTI-Baseline

                           Cereals (€/100 kg)                                                          Oilseeds (€/100 kg)
  20                                                                      50

                                                                          40
  15

                                                                           30
  10
                                                                           20

   5
                                                                          10

   0                                                                       0
    2000    2003     2006     2009     2012     2015     2018      2021         2000     2003    2006      2009   2012      2015     2018      2021

              Soft wheat               Barley           Corn                              Rapeseed            Soybeans             Sunflower

                     Oilseed meals (€/100 kg)                                                    Vegetable oils (€/100 kg)
 35                                                                       120

 30                                                                       100

 25
                                                                          80
 20
                                                                          60
 15
                                                                          40
 10

   5                                                                      20

   0                                                                       0
    2000    2003     2006     2009     2012     2015     2018      2021         2000     2003    2006      2009   2012      2015     2018      2021

           Rapeseed meal        Soybean meal           Sunflower meal                    Rapeseed oil        Soybean oil       Sunflower oil

                      Meat prices (€/100 kg)                                           Dairy products wholesale prices (€/100 kg)
350                                                                       500

300
                                                                          400
250
                                                                          300
200

150                                                                       200

100
                                                                          100
 50

   0                                                                        0
    2000    2003     2006     2009     2012     2015     2018      2021         2000     2003    2006      2009   2012      2015     2018      2021

              Beef                   Pork                Broiler                         Skimmed              Whole                   Cheese
                                                                                         milk powder          milk powder             Butter
Source: Own calculations with AGMEMOD (2011).

The situation with regard to oilseed development is comparable to that of grains. In addition to the
world market prices, the strongly increasing demand for rapeseed oil for biofuels plays a very im-
portant role, whereas in recent years, the demand has not shown quite the expected growth. In
2010/11, high rapeseed oil prices had a depressant effect. The cause for the high prices was EU-
wide rapeseed production that did not meet expectations. On the one hand, seeded areas had to
You can also read