Searching for the Holy Grail? Making FDI work for Sustainable Development - Analytical Paper, March 2003
←
→
Page content transcription
If your browser does not render page correctly, please read the page content below
Searching for the Holy Grail?
Making FDI work for
Sustainable Development

Analytical Paper, March 2003
WWF commissioned Lyuba Zarksy and Kevin Gallagher of the Global Development and Environment
Institute, Tufts University to prepare 'Searching for the Holy Grail? Making FDI work for sustainable
development' as a background analytical paper to the meeting International Investment Frameworks
for Sustainable Development: Framing the Debate (London 10 March, 2003). The paper drew
partly from a previous unpublished manuscript on ' Environmental Governance and Foreign Direct
Investment: Out of Balance' written by Tony Zamparutti, an independent consultant for WWF. Keith
Tyrell of WWF, European Policy Office (EPO), supervised the development of this paper.
The views expressed in the paper are those of the authors.
For other publications on trade and investment, please contact:
Sabine Granger
WWF International
Ave du Mont Blanc
1196 Gland, Switzerland
Tel: +41 22 364 9012
Fax: +41 22 364 8219
Email: Sgranger@wwfint.org
Website: www.panda.org/trade
Published May 2003 by WWF-
World Wide Fund for Nature
(Formerly World Wildlife Fund),
Gland, Switzerland.
Any reproduction in full or in part
of this publication must mention the
title and credit the above-mentioned
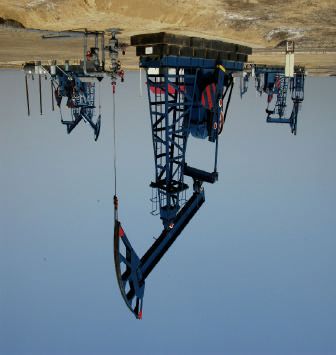
publishers as the copyright owners. Cover Illustration © WWF Canon / Michel Gunther
Petrol fields, exploitation area near Dagang, on the coast of
©Text 2003. All rights reserved.
the Yellow Sea, Jiangsu Province, China
The material and the geographical
designations in this report do not
imply the expression of an opinion
whatsover on the part of WWF,
concerning the legal status of any
country, territory, or area, or
concerning the delimitation of its
frontiers or boundaries.TABLE OF CONTENTS
I. Introduction 1
II. The Promise of Foreign Direct Investment (FDI ) 2
1. Global FDI Trends 3
2. Does FDI Promote Economic Development? Yes, No, Maybe 6
3. FDI and the Environment 7
4. Mixed Record: The Mexican Experience 11
5. Indicators for “Sustainable FDI”? 12
III. Pointing in the Right Direction: Case Studies 14
1. Promoting Productive Capacities 14
Case Study One: DaimlerChrysler-- Sisal Fiber Project South Africa 14
Case Study Two: Lafarge DuJiangYan Cement Company 16
Case Study Three: Beijing Bergey Windpower Co. 17
2. Improving Environmental Performance 18
Case Study Four: Foreign Companies and Environmental Performance
in Chile 19
Case Study Five: British Airways Holidays 20
Case Study Six: Finnair Travel Services 21
IV. Making FDI Work for Sustainable Development 21
1. National Governments: The Centrality of a Development Strategy 22
2. MNCs: The Importance of Cooperation and Good Practice 22
3. Global Investment Rules: Corporate Citizenship Standards
and Policy Diversity 23
4. Need for More Research 23
Endnotes 24
Appendix One 25
References 26SEARCHING FOR THE HOLY GRAIL?
MAKING FDI WORK FOR SUSTAINABLE DEVELOPMENT
I. Introduction
Global development and environment communities increasingly look--with hope or concern--
at the growing level of foreign direct investment (FDI) flows to developing countries as an
arena for advocacy.
Fears centre on the potential for greater FDI flows, under a neo-liberal investment regime, to
accelerate environmental degradation and widen gaps between rich and poor. Hopes centre on
the potential for FDI to be a “lead driver” for sustainable development, especially in the
context of stagnating levels of overseas development assistance.
For the hopeful, the starting point is typically the assumption that FDI brings economic
growth, income and employment, and technology transfer. If so, the objective of sustainable
development advocates is to work to reduce the environmental and social impacts of FDI
while increasing the quantity of FDI flows.
There is increasing evidence, however, that FDI may not consistently deliver on its core
promise of economic growth. In larger developing and transition economies, FDI has worked
generally to boost economic growth. But for many other developing countries, including the
poorest, FDI inflows have correlated with decreases in national economic growth.
In this framework, advocates of sustainable development have a more daunting task: to search
for projects, policies and global rules which improve both the development and environment
performance of FDI. An understanding of the conditions and components--at the level of the
company, the local government and global regime--which are likely to generate a consistently
positive relationship between FDI flows and sustainable development is largely uncharted
territory.
This paper takes a small step in that direction. Part Two describes FDI trends in developing
countries; outlines arguments and evaluates evidence on the promise and perils of FDI for
economic development and for environmental performance; and develops a broad set of
indicators for what constitutes “sustainable investment”. Part Three presents summaries of
six case studies of private sector-driven projects and industry initiatives which “point in the
right direction” in terms of promoting local productive capacities and/or improving
environmental performance. Part Four draws some lessons from the case studies and review
of the evidence about “sustainable FDI”. In each case, the “triggering mechanism” was
different, ranging from local pro-development policies to MNC embrace of best practice to
industry-UNEP partnership.
Overall, the case studies and review of the evidence point to three conclusions and arenas for
further research: 1) the importance of a coherent development strategy and effective policies
to promote it; 2) the willingness of MNCs to set high internal standards throughout their
global operations and to cooperate with partners in achieving sustainable development goals;
and 3) the need to include “corporate citizenship standards” in investment regimes and to
design investment rules to allow for policy diversity and institutional innovation at the
national level.
Searching for the Holy Grail? Making FDI work for Sustainable Development 1II. The Promise of Foreign Direct Investment (FDI ) The promise of FDI as an engine for economic development has gained momentum over the last twenty years. In the 1970s, many developing countries were mistrustful of multinational corporations (MNCs), fearing a loss of sovereignty and preferring to borrow from banks to finance development projects. After the debt crisis of the 1980s, FDI became highly sought after, especially with the widespread embrace of export-oriented development strategies in the 1990s. Competition for FDI, among both developing and developed countries, is intense. To attract it, developing countries were told in the 1980s to “get the prices right,” that is, to eliminate micro policies, such as energy and food subsidies, which create a cleavage between domestic and global prices. In the 1990s, the prescription preferred by the IMF was to “get the policies right”: developing countries should embrace macro-economic policies, especially financial market deregulation, which promote global integration. Currently, the focus is on fashioning the right “enabling environment” for FDI: legal, regulatory and political institutions which provide transparency, protection and stability to foreign (and domestic) investors; and social infrastructure, such as education, which increase the skills of the local workforce. Developing countries which have such an “enabling environment” are, indeed, quite successful in attracting FDI, though usually with high attendant environmental costs. Most developing countries, however, especially the poorest, do not. The promise of FDI for sustainable development is precisely that it could be a useful tool in creating an enabling environment for ecologically sound economic and social development. The potential of FDI, in other words, is to help nurture local conditions and capacities— productive, social, regulatory and institutional. This section outlines trends in global FDI flows and explores links between FDI and economic development and FDI and the environment. The final section considers indicators for “sustainable FDI”. Searching for the Holy Grail? Making FDI work for Sustainable Development 2
1. Global FDI Trends

Global foreign direct investment inflows soared to unprecedented levels during the late 1990s.
From 1970 to 1990, average annual global FDI inflows amounted to $58 billion, or less than
one half of one percent of global GDP. In 2000, global FDI inflows reached a total of $1.5
trillion, or 4 percent of global GDP (Figure 1).

In the 1990s, annual global flows of multi-lateral and bilateral development aid (ODA)
remained stagnant at $54 billion. Many analysts began to hope that FDI would “dwarf” or
replace ODA as the primary source of development capital. However, only a small part of
global FDI inflows—about 30 percent on average between 1990 and 2001--went to
developing countries. Indeed, the developing country share fell off sharply between 1997 and
2000, falling from 39 to 16 percent.

                                            Figure 1: FDI Inflows in the World Economy, 1990 to 2002

                           1,600,000

                           1,400,000

                           1,200,000

                           1,000,000
  Inflows ($US millions)

                                                                                                                               World
                            800,000                                                                                            Developed Countries
                                                                                                                               Developing Countries

                            600,000

                            400,000

                            200,000

                                   0
                                   1990   1991   1992   1993   1994   1995   1996   1997   1998   1999   2000   2001   2002*

Source:
*2002 data calculated by author based on a 0.85% estimated decline by World Bank Global Economic
Prospects, 2002

Searching for the Holy Grail? Making FDI work for Sustainable Development                                                                       3
Table 1. Ten Largest Developing Country Recipients of FDI inflows
($US millions)
Top 10 (1990-2000) Top 10 2001
ave
China* 43,428 China 69,680
Brazil 12,000 Mexico 24,731
Mexico 10,149 Brazil 22,457
Argentina 7,181 Bermuda 9,859
Singapore 7,058 Poland 8,830
Malaysia 4,722 Singapore 8,609
Bermuda 4,722 Chile 5,508
Poland 3,705 Czech Republic 4,916
Chile 3,307 Taiwan 4,109
South Korea 3,188 Thailand 3,759
Top 10 total: 99,460 162,458
Total for Developing 200,891
Countries:
Top 10 share: 76 % 81%
*China figures include Hong Kong
Source: UNCTAD, World Investment Report, 2002
FDI inflows are highly concentrated in ten, mostly large developing countries, led by China,
Brazil, and Mexico. Between 1990 and 2000, the “top ten” garnered 76 percent of the total
FDI flowing into developing countries. The trend towards concentration seems to be
intensifying: in 2001, the top ten share rose to 81 percent (Table 1).
Even though they are a small part of the world’s total, FDI inflows to developing countries
may comprise a large part of total national investment and/or GDP in a particular country.
Between 1996 and 1999, for example, FDI comprised about 10 percent of GDP in Bolivia, 26
percent in Lesotho, and 26 percent in Thailand. i
The promise of FDI as a replacement for ODA, however, largely remains to be fulfilled. For
55 of the world’s 70 poorest countries, ODA flows outstripped FDI in the late 1990s. For 42
poor countries, ODA flows were twice the size of FDI. Indeed, FDI “dwarfed” ODA in only
seven of the poorest countries.ii
Most troubling, the dramatic global FDI surge of the past decade may itself prove to be
unsustainable. Between 2000-2001, global FDI inflows declined sharply, falling by nearly 51
percent.iii Data for 2002 suggest that this trend will persist. While steady growth in global FDI
flows is a reasonable expectation, the FDI surge of the late 1990s increasingly appears to be a
bubble.
Searching for the Holy Grail? Making FDI work for Sustainable Development 4Composition and Determinants of FDI
FDI inflows to developing countries increasingly target the tertiary (service) sector. In 1999,
services accounted for 37.3 percent of FDI inflows, up from 20.7 percent in 1988. The
manufacturing sector, though shrinking in relative terms in all regions except Africa,
continues to account for the largest share (Table 2). In most regions, the share of FDI in
the “primary”, mostly agriculture and mining, sector decreased in the 1990s. The exception is
Latin America, where agriculture and mining received 9.6 percent of FDI in 1988, but 12
percent in 1999 (primarily in the mining sector).
The central players in FDI are multinational corporations (MNCs). Why does an MNC locate
production in a particular developing country, either by purchasing an existing, company
(“mergers and acquisitions”) or by building new plant and equipment (“Greenfield
investment”)?
Studies have found that the most unambiguous and consistent “pull” factor is the market size
of the host economy. For the most part, MNCs invest in order to get access to large markets.
There is also close to a consensus that macroeconomic stability is needed to attract FDI.
Countries with volatile exchange rates and high and growing trade deficits tend to be
negatively correlated with FDI.
Table 2. Sectoral Composition of FDI Inflows to Developing Countries
Primary Secondary Tertiary
(percent of total inflows)
All Developing 1988 13.7 65.0 20.7
Countries 1999 5.4 54.5 37.3
Africa 1988 51.8 20.8 27.4
1999 13.6 43.4 42.9
Asia 1988 13.1 68.9 17.1
1999 3.5 60.2 33.6
Latin America 1988 9.6 65.8 24.6
1999 12.0 32.8 52.2
Central and 1988 n.a. n.a. n.a.
Eastern Europe 1999 2.5 43.5 50.1
World 1988 10.7 42.4 43.9
1999 5.5 41.6 50.3
Source: UNCTAD, World Investment Report, 2000
Evidence on whether low (or high) labour costs attract FDI, on the other hand, is ambiguous.
A review of sixteen studies found that, in six studies, low wages attracted FDI, while four
studies found FDI to be correlated with higher wages and six found labour costs to be
insignificant.iv No statistical evidence has been found that environmental factors affect MNC
location decisions.
Searching for the Holy Grail? Making FDI work for Sustainable Development 52. Does FDI Promote Economic Development? Yes, No, Maybe
FDI can potentially bring substantial two broad kinds of economic benefits to developing
countries and communities:
• Economic growth
- increase in income;
- increase in local employment;
- increase in foreign exchange;
- improvements in income distribution;
• Productive capacities
- transfer of technology and management practices;
- spillovers (stimulation of local suppliers and subcontractors);
- externalities, including through agglomeration effects;
- stimulation of domestic investment;
- increases in productivity of domestic firms;
- increased integration in global markets
- decreased costs/increased rates of R&D and innovation.
FDI can also bring risks to host developing countries. Operating without global and often
inadequate local regulatory oversight, MNCs have been the target of criticism for inflicting
“direct harms”—pollution and natural resource degradation, toleration of worker abuse by
subcontractors, inadequate protection of worker health and safety, and complicity in the
violation of human rights.v
But there is also the risk that FDI will thwart the economic development process itself. In a
study for the International Institute for Economics, Theodore Moran cautions that “the
possibility that FDI might lead to fundamental economic distortion and pervasive damage to
the development prospects of the country is ever present.”vi
Risks stem from the possibility that FDI will lower, rather than raise, domestic savings and
investment, including via profit repatriation; “crowd out” domestic companies from capital
markets; increase demands for foreign exchange; support local oligopolies and be anti-
competitive; distort local politics and thwart regulation; and create instability through
increasing financial volatility. Moreover, MNCs may seek to protect technology rents rather
than transfer technology, reducing or eliminating hoped-for spillovers and externalities.
What is the more likely “face” of FDI? A host of studies over the past decade have examined
the nature of economic benefits and the conditions under which they are—or are not—
captured. Moran reports on the findings of three separate “net assessments” of the impact of
FDI covering 183 projects in some 30 countries over the past 15 years. Two studies found
that FDI had a positive impact in 55 to 75 percent of the projects they studied. But one study
found that FDI had “a clearly negative impact on the economic welfare of the host” in an
astonishing 75 percent of the projects studied. vii
Macroeconomic country studies generally have found a positive impact of FDI. For example,
a study by the Brookings Institution covering 58 countries in Latin America and Asia, as well
as Africa, found that a dollar provided by FDI generates another dollar in domestic
investment.viii An IMF study found evidence of positive effects, including productivity
increases through technology transfer, to be “overwhelming”.ix Several firm level studies, on
the other hand, found unequivocally that FDI did not accelerate economic growth or promote
positive spillovers from foreign to domestic firms.x
Searching for the Holy Grail? Making FDI work for Sustainable Development 6Many studies find that the impacts of FDI in developing countries may be positive or
negative, depending on a variety of variables, mostly having to do with host country policies.
One study found that the impact of FDI is significantly positive in “open” economies, and
significantly negative in “closed” economies. Others have found that positive impacts depend
on the effectiveness of domestic industry policies; and on tax, financial or macroeconomic
policies A World Bank study found that the impacts of FDI depend on the industry, as well as
host country policies (see Appendix One).
Several studies suggest that, to capture the benefits of FDI, a country must already have
reached some kind of “development threshold”. One found that FDI raises growth only in
countries where the labour force has achieved a minimum level of education (Borensztein et
al, 1998). Another found that “the positive impact of FDI on growth…vanishes when limited
to lower-income developing countries. ”xi In its recent report on the role of FDI in
development, the OECD concluded that the overall benefits, while “well-documented”,
depend on “the appropriate host-country policies and a basic level of development”.xii
What the “right policies” are, however, is a matter of some contention, as well as
investigation. While it is slowly changing, the conventional wisdom is that developing
countries should undertake policies which promote global integration, protect foreign
investors, and minimise government intervention. Moran found, however, that while
domestic content policies were not effective in promoting technology transfer, export
performance requirements were very effective.xiii
In a sweeping study of the industrialisation process in twelve emerging (or now “emerged)
developing countries, Alice Amsden argues that monitored performance requirements linked
to industry subsidies—for both domestic and foreign firms—were the key to the rapid growth
of local manufacturing capacities.xiv Rather than “buy” foreign know-how, their development
strategy aimed to “make” it, including through the strategic use of FDI. This kind of
development model is today more constrained by WTO rules.
3. FDI and the Environment
In the last decade, a surge of regional and bilateral investment agreements have promoted the
liberalisation of investment regimes. These agreements increase expand the rights of foreign
investors but, with few exceptions, articulate no environmental or social responsibilities of
either investors or governments. Many in the sustainable development community are
concerned that, without an environmental framework, liberalisation will accelerate
environmental degradation. xv
The impacts of FDI on the environment can be traced through three routes:
• Environmental performance of MNCS;
• Impacts of economic growth
• Impacts on national and global environmental regulation.
Performance of MNCs
Two key strategic and management decisions of MNCs affect their environmental
performance. First is the choice of technology, viz, whether to invest in newer, cleaner “best
available” or to “dump” older, dirtier technologies. In most industries, a range of
technologies are in use. Efficiency and “clean-ness” may be a function as much of industry
sector as of company choice: some industries are more technologically dynamic than others.
Searching for the Holy Grail? Making FDI work for Sustainable Development 7The second decision has to do with management practice, viz, whether the corporate parent has embraced a strong EMS (environment management system) and enforced it throughout its overseas subsidiaries and supply chains. NGO advocacy campaigns have increasingly and effectively prodded companies into compliance with existing environmental regulation, and to adopt “voluntary initiatives” to go “beyond compliance” in global operations. One of the promises of FDI for sustainable development is that MNCs, especially from the OECD, will help to drive up standards in developing countries by transferring both cleaner technology and better environmental management practices. Empirical studies, however, have failed to find evidence for such a trend. In statistical studies of Mexico (manufacturing) and Asia (pulp and paper), foreign firms and plants performed no better than domestic companies. Instead, environmental performance was found to depend on 1) the scale of the plant (bigger is better); and 2) the strength of local regulation, both government and “informal”.xvi Many developing countries lack the capacity and/or political will to enforce environmental oversight of industry. In this context, MNCs are able to “self-regulate” and have one of three choices: 1) follow local practice and norms; 2) adopt internal, company-wide standards, either an average or the highest of relevant home country standards; or 3) adopt international standards or “best practice” norms for corporate social responsibility. In the petroleum and mineral sector, a host of case studies suggest that, on average, MNCs have tended to follow—or even to worsen--local practice.xvii In all parts of the world, mining operations have generated severe environmental degradation and pollution, including the discharge of toxic substances into river systems, large volume waste disposal, the inadequate disposal of hazardous wastes, and the long run impacts of poorly planned mine closure.xviii Multinational oil companies have been the target of protest and criticism for widespread pollution and human rights violations in the Amazon region, Nigeria, Indonesia and, increasingly, the Caspian region. xix In the high tech sector, American and European MNCs tend to adopt either company-wide standards or international “best practice” for environmental management and community consultation. Within the industry, however, there are “leaders” and “laggards”. The US chipmaker Intel, for example, adopts the highest relevant standard as the company-wide standard, including for subsidiaries. National Semiconductor, on the other hand, adopts an average US standard for its newer plants, and follows local practice for its older plants.xx The evidence suggests that, overall, MNCs perform no better than domestic companies. The environmental performance of a particular MNC in a particular locale depends on: 1) the strength of local regulation; 2) the industry it is in; and 3) the particular company culture with respect to environmental commitment and corporate social responsibility. Economic Growth and the Environment One of the potential benefits of FDI is that stimulates economic growth. Without adequate regulation, however, economic growth is likely to accelerate environmental degradation— even if MNCs are good performers-through scale effects. The experience of East Asia, often described as an “economic success story,” provides a tragic example. According to the Asian Development Bank, resource degradation and environmental pollution in both East and South Asia is so “pervasive, accelerating, and unabated” that it risks human health and livelihood. xxi While acknowledging that environmental impacts can worsen with an increase in the rate of growth, some economists argue that, over time, economic growth generates environmental improvements. The “Environmental Kuznets Curve” posits that environmental quality first worsens and then improves as per capita income (GDP) rises.xxii Reasons include the Searching for the Holy Grail? Making FDI work for Sustainable Development 8
substitution of less polluting consumer goods; changes in the structure of industry; and
greater political demands for environmental regulation. Early studies put the “turning point”
at between US$3000 and US$5000.

If true, the EKC suggests that, to a large extent, the pursuit of economic growth is itself a
sustainable development strategy. One major concern, however, is that the environmental and
resource degradation at lower levels of income might result in irreversible losses. Examples
include loss of biological and genetic diversity and potable water due to degradation or
destruction of “old growth” forests; depletion or destruction of fish stocks due to coastal
degradation; and human deaths resulting from severe air pollution. Given the number of
people on the planet living today at very low levels of per capita income, the potential
environmental losses which must be endured before the global “turnaround” are staggering.

A number of studies question the validity of the EKC hypothesis for developing countries on
five counts:xxiii
•       Evidence for an EKC is limited to a small number of localised pollutants, primarily
        sulphur and particulate matter;
•       Evidence for the EKC relies mostly on data from developed nations.
        The handful of studies which rely on data from developing nations have found that
        evidence for an “inverted-U” relationship is ambiguous;
•       The “turning point” is significantly higher than original estimates and may recur.
        Recent studies have found turning points of $14,730 and $22,675 for sulphur, $9800
        for particulate matter, and $35,000 for carbon dioxide. In one study, a second wave
        of environmental degradation occurred when per capita income reached $10-15,000. .
•       Factors other than income important drivers of environmental quality.
        Many studies have found that political freedom and democracy, population density,
        industry structure, and historical events (such as the oil price shocks of the 1970s) are
        as or more important than income in determining environmental quality.
•       No evidence for the EKC has been found in historical studies.
        Most EKC studies utilise cross-sectional or panel data to estimate an average curve.
        A historical study of Malaysia found no evidence of an inverted-U shaped curve for
        six air and water pollutants.

Environmental Regulation: Stuck in the Mud?

Environmental and resource management is largely the preserve of nation-states. How does
FDI affect national (and-sub-national) environmental regulation? There is evidence that
MNCs themselves, wielding their substantial bargaining power, can help to drive local
standards up—or down. In Chile in the 1970s and 1980s, foreign mining companies pressed
for more coherent environmental regulation (see Case Study Seven, below). In the Russian
Far East, on the other hand, oil MNCs involved in obtaining leases for exploration and
drilling off of Sakhalin Island in the 1990s flouted and undermined Russia’s fledgling
environmental laws.xxiv

The asymmetric bargaining power of MNCs is most troublesome in the context of the intense
competition for FDI in both developed and developing countries. Given the absence of global
environmental standards, would-be host governments seeking to attract FDI are reluctant to
make higher-than-average environmental demands on individual MNCs. They may even be
tempted to offer lower-than-average environmental demands to enhance the attractiveness of
an overall package.

Searching for the Holy Grail? Making FDI work for Sustainable Development                      9
Dubbed the “stuck in the mud” problem, the impact of intense global competition for FDI—
absent common environmental norms--is thus to inhibit the rise of environmental standards.xxv
The problem afflicts both developed and developing countries: efforts in the 1990s to put a
modest tax on carbon were roundly defeated in both the US and Australia by worries that
investment would move offshore.
There is some evidence that, despite regulators’ fears, high environmental standards do not, in
fact, deter investors and in some cases, are even preferred by investors. Moreover, with the
rise of the global corporate social responsibility movement, MNC and host-government
expectations may be changing. The rate of change, however, is slow. According to the OECD,
MNC implementation of the Guidelines for Multinational Enterprises remains low. The
practice in government-MNC negotiations over environmental management, apparently, is to
not rock the boat.
Overall, an examination of all three of the channels linking FDI and the environment suggests
there is no determinate trend: FDI can improve, worsen or have no impact on environmental
quality. Other factors—government regulation, the rate of economic growth, company
culture, the particular industry in which the FDI takes place, the rules that govern FDI—are
key variables.
The lack of a consistent aggregate relationship between FDI and environmental quality is
shown below. Figure 2 plots the results of a regression of FDI per unit of GDP (vertical axis)
on an index of environmental quality (horizontal axis). The index is a subset of variables
(Table 3) used by the World Economic Forum to create the Environmental Sustainability
Index, which ranks nations on a scale of 1 (best) to 100 (worst). The scatter plot shows that
high levels of FDI are correlated with poor, good, or medium ranges of environmental quality.
Figure 2. FDI and the Environment
14
12
10
8
6
Series1
FDI/GDP
4
2
0
0.0 10.0 20.0 30.0 40.0 50.0 60.0 70.0 80.0 90.0 100.0
-2
-4
Environmental Index
Searching for the Holy Grail? Making FDI work for Sustainable Development 10Table 3. Variables in Environmental Quality Index
Air Quality Urban SO2 concentration
Urban NO2 concentration
Urban TSP concentration
Water Quantity Water availability per capits
Water inflow availability per capita
Water Quality Dissolved Oxygen concentration
Phosphorus concentration
Suspended solids
Electrical conductivity
Biodiversity Percentage of mammals threatened
Source: World Economic Forum, 2001
4. Mixed Record: The Mexican Experience
For Mexico, FDI was the prize of the NAFTA integration process.xxvi The hope was that FDI
inflows would greatly increase, stimulating economic growth and bringing social and
environmental benefits by absorbing rural migrants—displaced from by agricultural
liberalisation--into new, higher paying urban-based jobs, and by transferring cleaner
technologies and better environmental management practices.
In the event, the results have been mixed. US FDI into Mexico has increased by a factor of ten
since 1985, reaching $24 billion in 2001, contributing to a massive influx of internal migrants
to urban areas. Between 1980 and 2000, population more than doubled in FDI-laden areas,
while the population of Mexico as a whole grew by less than forty percent.
What is less clear is that the lives of Mexico’s working and poor people have substantially
improved. According to the OECD, the swollen urban population far exceeds the
infrastructure capacity of host communities to manage sewage and waste, provide sufficient
water, and protect air quality. Wages in foreign firms are lower than the mean wage in
Mexican manufacturing as a whole--and have fallen in real terms by more than 10% since
1987.
Moreover, the large FDI inflows of the last decade may not be sustainable. From the middle
of 2001 through the end of 2002, foreign-owned firms dismissed 287,000 workers (or one in
five of all such workers).xxvii Mexican analysts worry that US (and other foreign) firms are
shying away from Mexico because of sluggish growth in the US--and because of emerging
opportunities in China.
The environmental benefits of FDI have also been elusive. A 2000 World Bank study found
no correlation between foreign-ownership and firm-level environmental compliance in
Mexican industry. Rather, the key variable was the strength of state regulation. xxviii
These trends mask some “best practices” that can serve as models for a more comprehensive
sustainable investment strategy. Some foreign firms, including Dutch steel companies and
U.S. chemical firms, have offered higher wages, better working conditions and/or better
environmental standards. Some have also negotiated relationships with host communities for
public infrastructure and social services.xxix
Searching for the Holy Grail? Making FDI work for Sustainable Development 11Unfortunately, these sustainable development success stories are an exception rather than the rule. Between 1985 and 1999, rural soil erosion grew by 89 percent, municipal solid waste by 108 percent, and urban air pollution by 97 percent.xxx The Mexican government estimates that the economic costs of environmental degradation have amounted to a staggering 10 percent of annual GDP, or $36 billion per year. These costs dwarf economic growth, which amounted to only 2.6 percent on an annual basis. Unless economic integration is coupled with strong environmental regulation and enforcement, pollution is likely to worsen. Since NAFTA took effect, however, real spending on the environment and has declined 45 percent, and plant-level environmental inspections have shown a similar drop. xxxi 5. Indicators for “Sustainable FDI”? Fulfilling the promise of FDI for sustainable development will not come as a result of simply increasing FDI flows alone, whether through “openness” or other means. It will require the incorporation of social values by MNCs, effective development policies at national and global levels, and the explicit embrace of environmental and social obligations in investment regimes. Searching for the Holy Grail? Making FDI work for Sustainable Development 12
A comprehensive framework to guide and evaluate FDI projects and government policies has
not yet been developed. In broad terms, “sustainable FDI” projects and policies in developing
countries should:
    • Enhance local productive capacities;
    • Strengthen social resilience and solidarity, including by reducing inequality;
    • Improve environmental performance, both directly and by increasing capacities for
         regulation.
The aim is to develop projects and policies which produce positive results for all three goals,
or at least do not retard one at the expense of another. The creation of measurable indicators
would be a helpful step in promoting “sustainable FDI”. A Briefing Paper for the Earth
Summit produced an initial set of indicators, which could be the starting point for discussion
and elaboration (Table 4).xxxii

Other efforts to provide guidance to business, especially MNCs, can usefully inform
sustainable FDI indicators, including the environmental and social reporting framework of the
Global Reporting Initiative; and the OECD Guidelines for Multinational Enterprises. Least
developed to date are benchmarks and indicators for the development contribution of MNCs.

                      Table 4. Examples of Indicators for FDI and Sustainability

                     Type                         Example of Indicator
                                                  Net Foreign Direct Investment (FDI)
                                                  Net Foreign Direct Investment (FDI)
                                                  as % of GDP and of GFCP
                     Investment and               Net change in FDI global share
                     Productivity                 Net resource transfer
                                                  Ratio of aggregate Net Resource Transfers (long-term) to
                                                  GNP (%)
                                                  Local R & D expenditure from FDI
Economic                                          Per cent of FDI in Greenfield investments
                                                  Ratio of Total Official Development
                                                  Assistance (ODA) to GNP
                     Other Financial              Ratio of external debt to GNP
                     Factors                      Ratio of debt service to exports of
                                                  goods and services, including worker's remittances
                                                  Per capita domestic saving and investment
                     Labour standards and         Adoption of ILO labour standards and indicators
                     employment                   Per cent employment in host economy created
Social                                            (directly/indirectly) by FDI
                                                  Enrolment ratios by level of education, public/private
                     Education                    expenditure on education/training, expected number of
                                                  years of formal schooling
                                                  Adoption of environmental management system,
                     Environmental Best           environmental reporting, energy efficiency
                     Practice                     Green accounting e.g. “green" net national product (green
Environmental                                     NNP), genuine savings etc.
                                                  Per cent of FDI into environmentally sensitive sectors
                     Environmental                Ratio of environmental protection expenditures to GDP
                     Protection                   Degree of implementation of Multi-lateral
                                                  Environmental Agreements
Source: Earth Summit (2002) , Table 3.

Searching for the Holy Grail? Making FDI work for Sustainable Development                       13
III. Pointing in the Right Direction: Case Studies The role of private FDI in promoting sustainable development is a new field of study. More importantly, however, it is a new and active field of practice. A myriad of initiatives are underway, many involving public-private partnerships. This section reviews six case studies involving private direct investment in developing countries. All except one (Beijing Bergey) are drawn from published sources. Produced at different times with different data, methodologies and formats, the case studies do not necessarily reflect “best practice” in integrating all of the indicators developed above Rather, they are organized to highlight good practice along two axes: 1) promoting local productive capacities; and 2) improving environmental performance. 1. Promoting Productive Capacities From an economic development perspective, the most important potential benefit of FDI is to nurture the growth of local productive capacities. Routes to do so include increasing workforce skills and competencies; putting in place new technologies; stimulating local business through supplier relationships; and encouraging local innovation through new knowledge and market opportunities. For FDI to promote productive capacities, much more is needed than simply the transfer of technological hardware. “While policy documents still coin it technology “transfer”, emphasises Bjorn Stigson, President of the World Business Council for Sustainable Development, “this process only succeeds through a cooperation between provider and receiving communities”xxxiii According to Carlos Magarinos, Director-General of UNIDO, “A successful technology cooperation process includes elements such as needs assessment, clear national priorities for technology development, identification of appropriate forms of cooperation, an enabling environment and capacity building.” xxxiv The WBCSD and UNIDO recently published ten case studies of technology cooperation in developing countries.xxxv Two of the case studies are summarized below. The third case study (Beijing Bergey) is unpublished and was developed by the authors. Case Study One: DaimlerChrysler-- Sisal Fiber Project South Africa Based in East London, DaimlerChrysler South Africa manufacturers cars and vehicle components for domestic and international markets. With nearly 4000 employees and a state- of the-art manufacturing facility, DaimlerChrysler is one of the biggest employers in the Eastern Cape region. The subsidiary is wholly-owned by DaimlerChrysler Germany, making the corporation one of the largest German investors in South Africa. DaimlerChrsyler SA is spearheading a project to “green” its supply chain by switching to natural fibres in vehicle components. Early in the 1990s, DaimlerChyrsler (then Mercedez- Benz) declared a commitment to environmental sustainability, including by improving its products and processes. Company research identified a number of natural fibres—flax, hemp, coconut, cotton and sisal—as best in meeting both environmental and manufacturing requirements. A German firm, Johann Borgers GMBH & Co (Borgers), who developed the technology to process and manufacture flax and cotton fibres. Searching for the Holy Grail? Making FDI work for Sustainable Development 14
DaimlerChrysler SA’s objective, however, was not to import natural fibres processed and
manufactured in Germany, but to establish an entire local supply chain based on sisal. The
South African supply chain would include:
    • Sisal farming
    • Processing of sisal fibres
    • Manufacture of sisal components
    • Release to DaimlerChrysler SA.

The “produce locally” decision was driven by South Africa’s local content policies, which
place a duty on imported components used in local manufacture of vehicles. Local content in
exports of vehicles and components, on the other hand, earns credits which offset import
duties. “Local content,” states the WBCSD case study, “is therefore critical to the business in
South Africa, and has spurred the active involvement in technology transfer projects that
promote the use of South African resources”.xxxvi

The multifaceted project required multiple partners, initiatives, and agreements.
DaimlerChrysler oversaw the technology transfer part of the project. Two well-established
South African firms, Brits Textiles and NCI, were identified as recipients of the technology
owned by Borgers.. Brits gave Borgers a one-time payment of $80,000 for the processing and
manufacture technology. NCI—which already had a technology agreement with Borgers--
agreed to a 2 percent royalty on revenue generated to retain their technological support.

The technology transfer was successful, despite some bumps stemming from differences in
business styles and communication cultures. For example, DaimlerChrysler’s procurement
team had to work with one supplier to “ensure that they would not continue to cut corners to
save production costs”.xxxvii The first sisal component was released for inclusion in the
Mercedes-Benz C-Class vehicles in October 2001 and sisal-cotton mixtures are now used
substantively in local production.

Both of the local South African companies have been strengthened as a result of the
technology transfer. Thirty new jobs have been added. Brits textiles has entered a new
business field and developed new industry contacts and opportunities. NCI has had an
increase in turnover and a greater international exposure as a supplier in natural fibres. There
have also been spin-off businesses from the initial project, including applications in buildings
and civil engineering projects.

Less successful has been the effort to develop a reliable local supply of sisal. South African
farms produce only 500 tons a year, leaving an import requirement of about 2,500 tons.
There are 23 state-owned and one operating commercial sisal farms. Two other commercial
farms ceased operations due to labour problems.

The problem is that the productivity of the state-owned farms is very low. DaimlerChrysler
contracted with the Council for Scientific and Industrial Research to examine options for
privatisation, as well as additional markets and applications for sisal fibres. However, as of
2002, local sisal harvesting remains the sticking point in the local supply chain. “As long as
the farms under perform, and cannot supply reliable amounts,” concludes the study, “the
success of the project is in jeopardy”. xxxviii

Searching for the Holy Grail? Making FDI work for Sustainable Development                    15
Case Study Two: Lafarge DuJiangYan Cement Company The French based Lafarge Group, a leading global producer of cement, operates 136 cement plants in 46 countries, employs over 40,000 people, and in 2001, generated sales of $12 billion. Lafarge entered the Chinese market in 1994 and has invested around $220 million in 13 joint or wholly owned ventures which employ nearly 2000 people. Cement is one of “dirtiest” industrial sectors in terms of environmental impacts, including carbon dioxide emissions. A cement kiln requires large quantities of energy, often supplied by coal, to literally melt stone. CO2 is also released in the chemical process by which limestone is calcinized into lime. According to one estimate, the cement industry single- handedly generates about 8 percent of global CO2 emissions. xxxix The company applies “Lafarge Standards,” among the most stringent in the world, to all new plants and project upgrades. According to its Sustainability Report, Lafarge cut its CO2 emissions per ton of cement by 13 percent from 1990 to 2000, and has made a public commitment to reduce its total emissions in industrialised countries by 15 percent by 2010. xl The company’s environmental policy also calls for product innovation, systematic audits, training, and the “sparing use of natural resources”. As a WWF “Conservation Partner”, Lafarge supports the restoration of forests and quarries. China’s development strategy is based on establishing a substantial and profitable position in targeted industries—including the building materials industry--in selected regional markets. With one third of global output, China is the world’s leading producer of cement. China consumes about 35 percent of the world’s cement, a figure expected to rise to 40 percent by 2010. The city of ChengDu in Sichuan Province in China’s Southwest was selected as a growth centre for the cement industry. In 2001, the Province consumed 22 million tons of cement and demand is expected to grow by 10 percent each year over the next decade. In 1997, the Dujiang Yan Building Company approached Lafarge with a three-part development proposal: 1) a new cement plant with state-of-the art dry process technology; 2) a new quarry; and 3) a railway for transporting materials. A joint venture agreement establishing the Lafarge DujiangYan Cement Company—the first turnkey project in China’s building materials industry--was signed in September 1998. The project entailed three separate contracts and partners for the quarry, the plant, and the railway. Finance for the $159 million project was provided by the International Finance Corporation (35 percent), as well as Lafarge (49 percent) and the Chinese partner (16 percent). Each project was completed on budget and on time—the quarry in December, 2001, the railway in February 2002, and the plant in April, 2002. The plant and quarry together employ 338 people. The joint venture company, together with the IFC, promoted high environmental standards, including an environmental impact assessment, a resettlement plan, public consultation, and an environmental management plan. In addition, Lafarge’s own best practices were transferred during the construction phase of each of the three projects, especially those relating to worker safety and the environment. Searching for the Holy Grail? Making FDI work for Sustainable Development 16
The project aimed specifically to transfer technology and build local management capacities,
as well as promote downstream linkages. The equipment used to build the plant was the latest
generation available on world markets. Ninety percent of the mechanical equipment and 75
percent of the electrical equipment used for construction in the three projects were sourced
from China. Lafarge carried out intensive training programs, including a one-year program for
all management and supervisory personnel.

Lafarge’s insistence on high safety and environmental standards was the one of the most
difficult challenges for the joint venture. “The Chinese contractors did not have high safety
standards and were unfamiliar with the safety equipment used by Lafarge,” concludes the case
study. “Changing the behaviours of these employees so they adopted safety practices and used
the appropriate equipment was a time consuming and challenging effort”.xli

Some of the factors which contributed to success were Lafarge’s own financial strength and
technical expertise, as well as the company’s substantial prior experience in China. The fact
that Lafarge had well-established procedures for quality control, safety, scheduling, etc also
made for success. Good working relations with the local partner and the support of the
Chinese Government were also important.

Case Study Three: Beijing Bergey Windpower Co.

Beijing Bergey Windpower Company is a small wind turbine manufacturing venture solely
owned and operated by the US company Bergey Windpower Co. (BWC). Headquartered in
Norman, Oklahoma, BWC manufactures a range of small wind turbines, including 1.0 and 1.5
kW units for off-grid, remote power applications; and larger 10Kw for on-grid utility bill
reduction and off-grid applications such as village electrification, community water supply,
and telecommunications. In the size range up to 10kW, BWC is the leading supplier in the
world.

In 1997, CEO Mike Bergey saw a commercial opportunity when the Chinese State
Development Planning Commission (SDPC)xlii announced “Brightness Engineering,” a large-
scale initiative to electrify 8 million people in villages in China’s western provinces. More
than 80 million people who live in the highlands, deserts and other remote areas of China are
not connected to the utility grid.

Bergey’s pursuit of the SDPC led to the creation of a joint venture in 1998 between BWC (51
percent) and Xiangtan Electric Manufacturing Group Corporation, a state-run enterprise.
Based near the city of Changsha in Hunan Province, the joint venture ramped up to produce
10kW wind turbines for village electrification, with investment capital provided by BWC.

The joint venture partnership was challenging. Work culture was very different in the two
companies. According to Bergey, manufacturing the turbines requires a high level of
precision but “the Chinese style is to cut costs—and corners”.xliii Another issue of contention
involved technology transfer in the licensing agreement. The SPDC and Bergey’s joint-
venture partner wanted access to the design considerations and process in order to “reverse
engineer” the technology. China has domestic manufacturers of wind power units but the
technology is weak and they are not very reliable. BWC was happy to provide training and to
source nearly all components from China--but wanted to protect its intellectual property in the
design of the technology.

Searching for the Holy Grail? Making FDI work for Sustainable Development                   17
Despite these tensions, a technology agreement was worked out and the joint venture was
primed to start manufacturing. However, the SDPC market did not materialise, largely due to
internal bureaucratic manoeuvring, and no tenders for small scale windpower units were put
forward. The “Brightness Engineering” project funding was delayed for four years and when
it finally went forward in 2002 the projects favoured solar technology. Unable to find
sufficient private sector buyers in the four year hiatus, the joint venture continued to loss
money and was dissolved in 2001.

With a strong belief in the applicability of the small wind power units in the Chinese
countryside, and the potential of China as a low-cost manufacturing site, BWC persisted in
trying to establish manufacturing capacity in China. However, a second joint venture failed.
In preparation for accession to the WTO, China liberalized FDI rules in 2000, including the
rule that a foreign company had to be in a joint venture in order to sell at a retail level. Bergey
set up a new manufacturing effort in Beijing, this time as a sole venture.

In its second year of operation, Beijing Bergey Windpower Co sold over 400 units, both
10kW and 1kW, employed 21 people, and generated a profit . The 10kW units were
primarily sold to China’s “Alleviate Poorness” Ministry to electrify newly established villages
in Xinjiang and Inner Mongolia and other nomadic regions.

The 1kW units are mostly exported to the United States, and then re-exported to Brazil,
Mexico and other developing countries. Like much larger multinationals, Bergey has found
that low wage costs make China an attractive manufacturing site. To attract quality
employees, Beijing Bergey offers employees higher than average wages, and seeks out older
employees who have been forced out of their government jobs by mandatory retirement laws.

BWC sources nearly all its inputs from China—except for the design components—and
invested heavily in training its Chinese workforce. BWC is eager to promote manufacturing
capacity in developing countries, and believes that “local manufacturing, under license or
through a joint venture, is necessary if widespread utilisation is to be pursued.”

On the other hand, BWC is a private sector company. Its core business competency--what it
has to sell--is the proprietary design technology that it has developed and keeps improving.
While he recognises the tension, Mike Bergey feels that a “nexus” can be found which
accommodates the interests of both the developing country government seeking to acquire
proprietary technology and private companies who wish to protect it. BWC continually
invests in research and development to improve existing products and develop new ones.

2. Improving Environmental Performance

One of the potential benefits of FDI to sustainable development is the transmission and
diffusion to developing countries of higher environmental and safety management standards
in industry. MNCs from OECD countries are typically subject to more intense NGO scrutiny
and higher standards in their home countries.

Drawing from a case study undertaken for Canada’s International Development Research
Centre, Case Study Four examines the role that higher MNC standards played in promoting
better environmental performance in Chile’s mining sector.xliv

One of the ways that companies based in OECD countries can work to promote better
environmental and social practice is via supply chain management. In 2000, a group of tour
operators, in partnership with the World Tourism Organization, UNESCO and UNEP
launched the Tour Operators Initiative for Sustainable Tourism (TOI) to raise the
environmental performance of suppliers and contractors to operators of tour packages, as well
as the facilities owned by tour operators.

Searching for the Holy Grail? Making FDI work for Sustainable Development                       18
Tourism is one of the world’s largest and fastest-growing industries. In 2001, international
tourism receipts totalled $462 billion, making it one of the largest categories of international
trade.xlv Moreover, international tourism is of increasing economic importance to developing
countries. For the poorest countries, tourism receipts more than doubled between 1992 and
1998 and, except for three LDCs with oil exports, constitute the largest source of foreign
exchange, far outstripping second-place raw cotton and third-place textiles.xlvi

The environmental, cultural and social impacts of tourism can be widespread and devastating.
According to its Statement of Commitment, members of the TOI “recognise and accept our
responsibility to operate in ways that reduce environmental impacts, benefit host
communities, safeguard the future livelihood of local people, and ensure the protection of
destinations for future generations.”xlvii

The aim of the TOI is to develop and implement management tools for good practice in four
key areas:
• Sustainability reporting
• Cooperation with destinations
• Supply chain management
• Internal management.

The Sustainable Tour Operators Initiative currently has 26 members, some of which are high-
volume companies specialising in package tours and some of which are very small companies
specialising in ecotours.xlviii Members are actively involved in Working Groups on the four
issue areas. In addition, TOI collaborated with the Global Reporting Initiative (GRI) to
produce supplementary guidelines for sustainability reporting in the tourism sector.xlix The
TOI website has seventeen case studies, two of which are summarized below in case studies
Five and Six.

Case Study Four: Foreign Companies and Environmental Performance in Chile

Mining is central to Chile’s economy. During the 1990s, mining accounted for about 50
percent of Chilean exports and foreign investment, and 5-7 percent of its GNP. Chile’s
copper, its primary mineral export, accounts for over 30 percent of global production.

Many foreign companies became active in Chile in the 1900s, joining state-owned companies
in mining, smelting and processing activities. In the early 1970s, however, all foreign mining
companies were nationalised as part of the social revolution that swept social democrat
Salvador Allende to power. Foreign mining companies were widely perceived in Chile,
especially by trade union and centre and left political organizations, to be taking out of the
country a disproportionate and unfair share of mineral rents.

After the assassination of Allende, the military government of General Augosto Pinochet
eased foreign investment restrictions. Foreign companies purchased two Chilean mining
companies. Disputada, one of Chile’s oldest cooper companies, was purchased by Exxon
Minerals Chile in 1978 from ENAMI, a state-owned company. l One of Chile’s oldest mining
companies, Disputada had (and has today) two mines, two processing plants, four tailings
damns, and one smelter.

El Indio, which mines gold with copper as a by-product, was purchased by the US St. Joe
Gold Company in 1975, and sold in 1981 to the Fluor Company. li The El Indio deposit was
discovered—at an altitude of 4000 meters--in 1960. In addition to both underground and open
pit mines, the company includes a processing plant.

Searching for the Holy Grail? Making FDI work for Sustainable Development                    19
You can also read