Challenges to the Future of Gas: unburnable or unaffordable? - Oxford Institute for Energy ...
←
→
Page content transcription
If your browser does not render page correctly, please read the page content below
December 2017

                Challenges to the Future of Gas:
                        unburnable or unaffordable?

   OIES PAPER: NG 125                      Jonathan Stern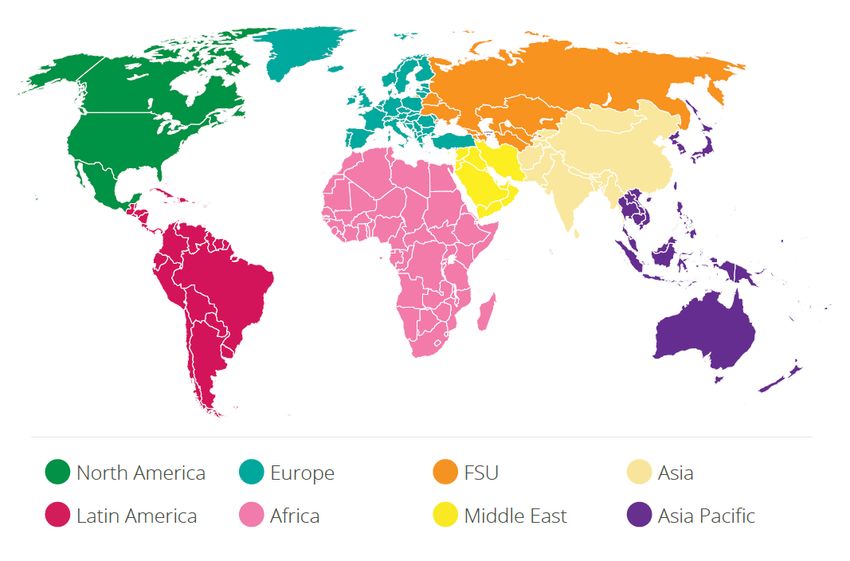
The contents of this paper are the author’s sole responsibility. They do not
         necessarily represent the views of the Oxford Institute for Energy Studies or any of
                                            its members.

                                          Copyright © 2017
                               Oxford Institute for Energy Studies
                                  (Registered Charity, No. 286084)

This publication may be reproduced in part for educational or non-profit purposes without special
permission from the copyright holder, provided acknowledgment of the source is made. No use of this
publication may be made for resale or for any other commercial purpose whatsoever without prior
permission in writing from the Oxford Institute for Energy Studies.

                                      ISBN 978-1-78467-099-3

                           DOI: https://doi.org/10.26889/9781784670993

                                                                                                      i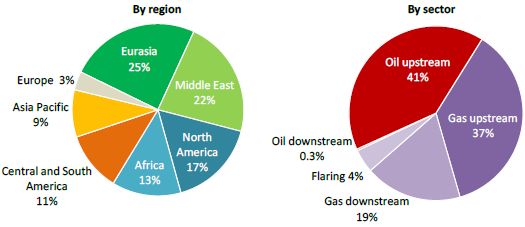
Acknowledgements
My grateful thanks to colleagues at OIES for their comments and help with data especially: James
Henderson, Howard Rogers, Mike Fulwood, Michael Chen, Chris Le Fevre and Anupama Sen.
Catherine Gaunt provided her usual excellent editing suggestions and Kate Teasdale did everything
else with her customary efficiency.
Perhaps more than for most publications I should stress that the views expressed, and any mistakes
which remain, are solely my responsibility.

                                                                                                 ii
Preface
In his paper ‘The Future of Gas in Decarbonising European Energy Markets’, published in early 2017,
Jonathan Stern concluded that although the prospects for gas look reasonably encouraging over the
next ten years, especially for exporters looking to replace declining indigenous production, the post-
2030 outlook is more uncertain. This is because the main focus of European energy policy is
decarbonisation, and within this context gas, as a fossil fuel, must ultimately be removed from the
energy mix if national and regional carbon emission and temperature targets are to be met. As such,
Professor Stern argued that the gas industry needs to develop a ‘decarbonisation strategy’ if it is to
prevent a serious diminution of its role in Europe post 2030.
This second paper expands his horizons to the global gas market. He highlights the fact that many of
the models which are based on a similar premise to those which focus on Europe – namely that
climate targets must be achieved – see gas demand continuing to increase in many regions beyond
2030. Within this context, gas has a potentially bright future in replacing the more polluting fossil fuels,
such as coal and oil. However, while acknowledging that climate change targets represent a longer-
term constraint, Stern asserts that many non-OECD countries are in fact driven by a more significant,
shorter-term imperative, namely the price of energy. Specifically, he reviews the gas prices paid in a
broad range of geographies and concludes that many of the more optimistic demand forecasts are
based on price assumptions that appear unrealistic relative to the levels that customers have been
paying over the past decade.
As a result, this paper questions the logic of suppliers who are waiting for a tightening in the global
gas market to encourage prices back to a level that can incentivise new investment, especially in
greenfield LNG projects. A key assertion is that the disparity between the likely cost of new LNG
projects and the affordable price of gas in many future growth markets will need to be closed by a
focus on cost reduction by project developers, rather than by a hope that higher prices and rising
demand will be sustainable at the same time.
The paper also addresses the issue of the increasing complexity of the commercial structures which
are likely to be required in a changing energy economy. Gas is likely to be increasingly challenged in
the power generation sector, meaning that the focus of suppliers will need to switch to the industrial,
residential, and transport sectors where the customer base is more fragmented and traditional long-
term contracts may not be viable. This trend is likely to be exacerbated by the fact that demand
growth will increasingly be located in smaller, lower-income countries with higher credit and payment
risks, presenting additional challenges to the existing gas industry financing model.
This new paper on the future of gas therefore seeks to look beyond the traditional timeframe of most
industry observers, and to challenge the presumption that gas has an inevitably positive future
because of its position as ‘the least bad fossil fuel’. It reiterates the OIES view that the next decade is
likely to be a positive one for gas, but emphasizes that the immediate challenge is for gas to remain
affordable in the many non-OECD countries where the bulk of global demand growth is expected. If
the industry is to maintain its growth prospects in decarbonising energy balances beyond the 2030s,
key decisions as to whether and how this can be achieved will need to be taken by the start of that
decade.
James Henderson
Director, Natural Gas Programme
iiiPrice Conversion Factor
Gas prices in this paper are quoted in $/MMbtu. In November 2017, approximate conversion factors
were $1/MMbtu = €2.9/MWh = 7.5 UK pence/therm
ivContents
Acknowledgements ................................................................................................................................. ii
Preface ................................................................................................................................................... iii
Price Conversion Factor......................................................................................................................... iv
Contents .................................................................................................................................................. v
Figures .................................................................................................................................................... v
Tables...................................................................................................................................................... v
EXECUTIVE SUMMARY ........................................................................................................................ 1
Introduction.............................................................................................................................................. 2
1. The Future of European gas: summary, responses, and a dilemma .............................................. 3
2. Regional and global modelling projections and scenarios for gas .................................................. 6
3. Wholesale gas prices and affordability .......................................................................................... 10
4. Affordability and future demand potential ...................................................................................... 17
5. Supply potential – costs of new gas pipeline and LNG projects .................................................... 27
6. Increasing complexity of the commercial gas framework .............................................................. 30
7. Challenges to the future of gas ...................................................................................................... 32
APPENDICES ....................................................................................................................................... 38
Appendix 1. Responses to questions asked at the 2017 FLAME Conference .................................. 38
Appendix 2. Types of price formation mechanism ............................................................................. 39
Appendix 3. Map showing the IGU’s regional groups ........................................................................ 40
Appendix 4. Methane emissions from gas industry operations .......................................................... 41
BIBLIOGRAPHY ................................................................................................................................... 44
Figures
Figure 1: Regional gas demand 2016–40 New Policies scenario (Bcm) ................................................ 6
Figure 2: Regional gas demand 2014–40 Sustainable Development scenario (Bcm) ........................... 7
Figure 3: Wholesale gas price levels by region* 2005–16 .................................................................... 11
Figure 4: Wholesale gas prices by region in 2016 ................................................................................ 12
Figure 5: Wholesale gas prices in North America 2005–16 .................................................................. 13
Figure 6: Wholesale gas prices in five Asian region countries 2005–16 .............................................. 13
Figure 7: Wholesale gas prices in six Asia Pacific region countries 2005–16 ..................................... 14
Figure 8: Wholesale gas prices in Japan, Korea, and Taiwan 2005–15 .............................................. 14
Figure 9: Wholesale gas prices in six African countries 2005–16 ........................................................ 15
Figure 10: Wholesale gas prices in eight Middle East countries 2005–16 ........................................... 15
Figure 11: Wholesale gas prices in seven countries of the Former Soviet Union 2005–16 ................. 16
Figure 12: Wholesale gas prices in seven Latin American countries 2005–16 .................................... 16
Figure 13: International benchmark prices for gas and LNG 2005–17 ($/MMbtu) ............................... 25
Figure 14: Estimated breakeven costs of new LNG projects* .............................................................. 29
Figure A4.1: Methane emissions from natural and anthropogenic sources (2012) .............................. 42
Figure A4.2: Regional and sectoral breakdown of methane emissions from oil and gas industries
(2015) .................................................................................................................................................... 43
Tables
Table 1: Non-OECD countries* with significant future gas potential, 2016 .......................................... 18
Table 2: Regional wholesale prices by price formation mechanism 2016 (% of total consumption) .... 20
Table 3: Natural gas subsidies 2013–15 (real 2015 billion US$) .......................................................... 21
Table 4: Natural gas price scenarios 2025–24* (real 2016 $/MMbtu) .................................................. 33
Table 5: Gas imports by region/country in 2040, New Policies scenario (Bcm) ................................... 34
Table 6: National gas typologies* ......................................................................................................... 36
Table A4.1: Methane emissions from the natural gas sector in selected Annex 1 countries in 2015
(thousand tonnes of methane) .............................................................................................................. 42
vEXECUTIVE SUMMARY
Gas as a ‘transition fuel’
For the period up to 2030, the principal threats to the future of gas (outside North America) will be
affordability and competitiveness. Beyond that date – and particularly beyond 2040 – carbon (and
potentially also methane) emissions from gas will cause it to become progressively ‘unburnable’ if
COP21 targets are to be met. Regionally, and especially nationally, the picture will be very different,
and this level of granularity is crucial for any kind of detailed appraisal of the future of gas. But at a
global level, a 20-year horizon prior to significant decline would qualify gas as a ‘transition fuel’.
Affordability, competitiveness, and costs
There are limited numbers of countries outside the OECD which can be expected to afford to pay
wholesale (or import) prices of $6–8/MMbtu and above, which are needed to remunerate 2017
delivery costs of large volumes of gas from new pipeline gas or LNG projects. Prices towards the top
of (and certainly above) this range are likely to make gas increasingly uncompetitive, leading to
progressive demand destruction. International price benchmarks for the majority of 2016-17 were $5–
8/MMbtu, creating additional demand for gas in many regions. There was less evidence of falling
costs for future greenfield (pipeline) gas and LNG projects, where progress will be key to affordability.
Transition from power to other sectors
In the power generation sectors of both established and new markets, gas will increasingly struggle to
compete with solar, wind, and battery storage technologies which are continuing to fall in cost and
appear attractive because they provide greater employment, reduced import dependence, and lower
foreign exchange costs than imported gas. Domestically-produced coal has similar attributes but
much higher carbon emissions. Carbon reduction policies are likely to mean that gas will be
progressively squeezed out of the power generation sector, or reduced to providing a back-up role for
intermittent renewables, which will not be sufficient to remunerate new gas-fired generation
investments without regulatory support (such as a capacity charge). The main exceptions are: China
(and possibly India) where air quality problems may lead to large-scale replacement of coal by gas-
fired generation; countries where gas can replace oil products; and where customers require 24/7
electricity supply.
Unburnable or unaffordable and uncompetitive?
In the low-price world of 2017, the major debate in the gas community is when the ‘glut’ of LNG will
dissipate and the global supply/demand balance tighten. The unspoken assumption is that when this
happens – generally believed to be around the early/mid 2020s – prices will rise somewhere close to
2011–14 levels, allowing a return to profitability for projects which have come on stream since the
mid-2010s, and allowing new projects to move forward. Should this assumption prove to be correct, it
will create major problems for the future of gas.
The key to gas fulfilling its potential role as a ‘transition fuel’ up to and beyond 2030, is that it must be
delivered to high-income markets below $8/MMbtu, and to low-income markets below $6/MMbtu (and
ideally closer to $5/MMbtu). The major challenge to the future of gas will be to ensure that it does not
become (and in many low-income countries remain) unaffordable and/or uncompetitive, long before
its emissions make it unburnable.
1Introduction
The constant discussion of, and calls for, a global move away from fossil fuels means that there has
never been a better time to examine the future challenges to gas in global energy markets. The
overall aim of this research is to examine the proposition made by gas companies and ‘advocacy’
organisations in the 2010s – that gas can play a major role in the transition to decarbonised energy
markets, up to (and possibly beyond) 2050, because of the carbon reduction advantages of switching
from coal to gas, and the role of gas in backing up intermittent renewable power generation. In other
words, the proposition that gas could be not just a ‘transition’ but also a ‘destination’ fuel for a low-
carbon energy system.
The first paper in this series examined the future of gas in European energy balances.1 A major thesis
of that paper was that the policy and environmental communities had found the above propositions
unconvincing. It suggested that the European gas community would need to demonstrate not just with
words, but also with actions, that gas could decarbonise post-2030 to ensure a longer-term future in
European energy balances.2
The focus of this paper is to examine the future of gas in other regions, with the main aim being to
examine how the challenges for gas in (principally) non-OECD regions will differ from those in
Europe, with the main criteria of difference being the importance of affordability, commercial viability,
and environmental (but wider than carbon reduction) issues. The questions which this paper
addresses are:
What are the most important challenges to the future of gas and what is the timescale of these
challenges?
Aside from regional and global projections, are there typologies of national gas markets which
help us to identify the countries which may be particularly important to the future of gas?
What do the answers to these questions mean for new gas exploration and development and
international pipeline and LNG projects?
This paper is structured in seven sections: the first section summarises the conclusions of, and looks
at the responses to, the first paper on Europe. This is followed by a section on modelling projections
and scenarios for global and regional gas demand. The third section looks at wholesale gas pricing
and affordability in different regions and countries for the period 2005–16. This is followed by sections
on: affordability and future demand potential; supply potential and the costs of new pipeline and LNG
projects; and the increasing complexity of the commercial gas framework. The final section draws
some conclusions on these future challenges.
Like its predecessor, this is a short paper which deals with a very large subject and is aimed at
developing general propositions about the future of gas, drawing on detailed research published by
the OIES Gas Programme and others.
1
Stern (2017).
2
To be specific, that methane could decarbonise, in order to make the distinction between natural gas and other gases.
21. The Future of European gas: summary, responses, and a dilemma
Summary
The previous paper found that, if countries are to meet the carbon reduction targets to which they
committed at COP21, European gas demand is likely to remain flat or decline modestly up to 2030
and decline at an accelerated rate thereafter, as the power sector will be required to decarbonise
rapidly, followed by the heat sector at a slower (but still significant) pace up to 2050.
The problems encountered by the gas community over the past decade were summarised under five
headings:
Commercial: the decline in energy and gas demand (which reversed only in 2016). The high-price
period (2011–14) gave gas an image of being ‘unaffordable’ in many countries, certainly in relation to
coal given the lack of a meaningful carbon price. Problems with long-term oil-linked contracts required
renegotiation (and often international arbitration) to convert to hub-based prices. The market
capitalisation of European utilities fell due to billions (and in some cases more than 10 billion) of euros
having to be written off in power generation and gas storage assets. For upstream companies, the
major problem was cost escalation and delayed start-up for new (particularly LNG) projects, which led
to many being unable to cover their full costs at 2017 prices (a subject to which we return in Section
5).
Business model: the fall in market capitalisation is a major factor in the search for a new utility
business model in the context of decarbonising energy markets. The key business model issue is
whether low-carbon generation assets belong in the same company as fossil fuel assets. The German
model of restructuring E.ON and RWE into low-carbon and fossil fuel companies (E.ON and Uniper,
and Innogy and RWE respectively) has not been followed in other countries. The key questions are
whether fossil-based utilities are simply in the business of managing the decline of legacy assets, or
whether, even in the absence of carbon capture and storage (CCS), there can be growth in fossil
generation.
Security: the third element is generally known as ‘security’ but is in fact a clash of political and media
perceptions of gas supply security, compared with the perceptions of those focusing on gas supply
and demand analysis. The political and media perception is that the principal threat to European gas
security comes from Russia. This perception is strongly related to political antipathy towards the
Russian Federation, particularly in connection to military activity in Ukraine and the annexation of
Crimea, with a focus on the role of President Putin. By contrast, analysis based on future gas supply
and demand sees Russia as the only possible source of additional large-scale gas supplies for
Europe, after the current wave of surplus LNG supplies is exhausted (probably around the mid-
2020s). Faster than expected declines in domestic European supplies (particularly in the
Netherlands), combined with the failure of domestic European unconventional gas production, and a
smaller than expected supply from both North Africa and the Southern Corridor, have contributed to
this conclusion.
Environment: while the gas industry has portrayed itself as ‘the cleanest fossil fuel’ (in relation to
emissions in general and carbon in particular), it is still a fossil fuel. Three specific problems have
been raised in relation to environmental claims by the gas industry:
Insufficient account of methane emissions from the gas chain – given that methane is a much
more powerful greenhouse gas than carbon dioxide – may invalidate any claim to have
advantages over coal.
The claim that unconventional gas development involves greater emissions of methane, and also
the use of harmful chemicals, in the hydraulic fracturing process.
More generally, the lack of any significant progress towards widespread commercial-scale carbon
capture and storage (CCS) presents a major obstacle to long-term inclusion of natural gas (or any
3other fossil fuel) in decarbonising energy balances. This lack of progress can lead to the
conclusion that new gas-fired generation and infrastructure can lead to carbon ‘lock-in’, namely,
that unabated gas installations will be emitting carbon for the commercial life of their assets. 3
Fragmentation: perhaps greater than all of the above problems has been the fragmentation of the
European gas industry: from a powerful and cohesive force able to ‘speak with one voice’ during the
monopoly era, to a community of (at least) four different groups of companies with different
commercial interests following the liberalisation of gas markets. The four main groups comprise:
Gas producers and exporters wanting to sell large quantities of methane (that they have spent a
great deal of money discovering) over long time periods, if possible underpinned by long-term
contracts;
Gas suppliers and traders supplying power as well as gas. Unless they are affiliates of producing
or exporting companies they could phase out gas and focus simply on their power business;
Gas network companies wanting to prolong the life of their assets which could in future transport
hydrogen, biogas, or biomethane, or a mixture of those products with methane. These companies
may be indifferent to the product they transport as long as they are being paid for the use of their
networks;
Owners of gas-fired power stations, LNG regasification terminals, and gas storages seeking to
maximise the life of these assets. Decarbonisation of other parts of the value chain may mean
these assets will be stranded, which is more serious for storage and LNG terminals than for
power plants with a shorter asset life.
Responses from the gas community:
A poll conducted at the FLAME 2017 conference gave interesting responses on the issues of gas
advocacy, CCS, and government policy on carbon reduction: 4
Responses were divided in relation to the effectiveness of gas advocacy, but a third of the
respondents believed that advocacy could be convincing if CCS was adopted on a significant
scale.
Less than a quarter of respondents (down from more than 40 per cent the previous year) believed
that COP21 targets would result in gas demand being higher than it otherwise would have been.
More than 50 per cent of respondents believed that technological progress in renewables and
battery storage would have a greater influence on gas demand than carbon reduction targets.
Only 10 per cent of respondents believed that low-carbon issues would gradually fade from the
political agenda; and only 16 per cent that governments would abandon their carbon
commitments as 2030 approached due to the cost of achieving them.
These responses, obtained at one of Europe’s biggest gas conferences, suggest that the gas
industry:
believes that gas advocacy could succeed if CCS were to be adopted on a significant scale but
that …
- its future is more immediately connected with the technological progress of
renewables and battery storage and ...
- is not cynical about decarbonisation, believing this to be a long-term policy objective
which will not be abandoned by governments.
3
Ecofys (2017).
4
For detailed responses see Appendix 1.
4Another group of responses, which is more anecdotal, relates to the progressive inability of the
industry to think about, and plan for, the ‘long term’ (defined as beyond seven years but in most cases
considerable shorter). This means that it has become extremely difficult – in an industry which had
been accustomed to operating with 15–30 year long-term contracts – to plan for 2025, let alone 2050.
These responses undermine the principal recommendation of the first paper, which was for the gas
community to abandon previous gas advocacy slogans 5 and adopt the mantra that ‘gas can
decarbonise’. Investments in biogas and biomethane are increasing and production could reach 50
Bcm by 2030, or around 10 per cent of current European gas demand. 6 But without CCS it is clear
that methane cannot be decarbonised on a sufficiently large scale and, quite aside from any cost
considerations, fragmentation of the gas community combined with short time horizons means there
is little confidence that large-scale investment in CCS will be forthcoming on any timescale.7
The decarbonisation dilemma of the European gas community
As stated in the earlier paper, these findings do not signify any imminent disaster for European gas
prospects. Even if gas demand does not increase, the fall in domestic production is likely to mean
that, in the period up to 2030, there will be a need for significantly larger gas imports and (in some
cases) more infrastructure to facilitate those imports. However, the problem for the European gas
community comes post 2030 when decarbonisation, initially of power and subsequently the heat
sector, needs to accelerate considerably.
The dilemma facing the European gas community is that:
it believes that decarbonisation of energy balances is ongoing, will not be curtailed, and will not be
significantly positive for gas;
it believes that the success of gas advocacy is strongly dependent on the future of CCS;
due to value chain fragmentation (an inability of many players to adopt a planning and investment
horizon longer than five to seven years) and current costs associated with the technology,
significant investment in commercial-scale CCS is very unlikely.8
Some of these European issues recur in the rest of this paper, but the following sections suggest that
the challenges to the future of gas are somewhat different and more immediate elsewhere in the
world.
5
Specifically the 3As: ‘Available, Affordable, Acceptable’.
6
Lambert (2017).
7
For example a Norwegian cooperation between Statoil, Shell, and Total, announced in October 2017, which appeared to
immediately encounter funding difficulties. Favasuli (2017).
8
Although a small-scale project is going ahead in the UK. Favasuli (2017a).
52. Regional and global modelling projections and scenarios for gas
Global energy projections, models, and scenarios being published in the late 2010s tend to divide into
two categories:
those showing how energy balances will evolve in the future, given current and anticipated future
trends and policies which governments have announced;
those seeking to demonstrate how energy balances must evolve if COP21 carbon-reduction
targets are to be achieved.
In this section we look at some of the outcomes for gas in these models and scenarios. The
International Energy Agency’s World Energy Outlook (WEO) is the principal model to which we refer
throughout the rest of this paper, not because it is necessarily more correct than other models, but
because it provides the required degree of granularity and detail across gas supply, demand, and
pricing on a regional level which is not matched by other studies. Specifically, the WEO’s ‘New
Policies’ and ‘Sustainable Development’ scenarios provide detailed analysis of the two categories
noted above.9 Future gas demand by region for the period up to 2040 under these scenarios is shown
in Figures 1 and 2.
Figure 1: Regional gas demand 2016–40 New Policies scenario (Bcm)
South East Asia
Japan
India
China
Russia
Middle East
Africa
Europe
Central/South America
North America
0 200 400 600 800 1000 1200
Bcm
2040 2030 2016
Source: IEA WEO (2017), Table 8.1, p.339.
The difference between the two scenarios is relatively clear: in New Policies, gas demand increases
in all regions up to 2040 with the exception of Europe, Russia, and Japan where it stabilises. But in
the Sustainable Development scenario gas demand to 2040:
declines significantly in Russia, Europe, and Japan;
stabilises in Central/South America;
9
The New Policies scenario: ‘incorporates not just the policies and measures that governments around the world have already
put in place but also the likely effects of announced policies as expressed in official targets and plans’. The Sustainable
Development scenario incorporates three major elements: a pathway to the universal access to modern energy services by
2030; a picture that is consistent with the objectives of the Paris (COP21) Agreement by reaching a peak in emissions as soon
as possible followed by a substantial decline; and a dramatic improvement in global air quality and a consequent reduction in
premature deaths from household pollution. IEA WEO (2017), pp.37–8 and 727.
6 increases modestly in South East Asia and Africa;
increases but then peaks and declines post-2030 in North America and the Middle East;
increases substantially in both China and India.
In the New Policies scenario global gas demand increases from 3.64 trillion cubic metres (Tcm) in
2016, to 4.55 Tcm in 2030, and 5.30 Tcm in 2040; in the Sustainable Development scenario the
corresponding figures for 2030 and 2040 are 4.27 Tcm and 4.22 Tcm.10 These scenarios therefore
suggest that, up to 2030, the future of gas is relatively bright, but if the goals of Sustainable
Development are to be met, gas demand will peak in the early 2030s and decline relatively slowly
over the rest of the decade. The only rapidly growing markets over the entire period will be in China
and India.
Figure 2: Regional gas demand 2014–40 Sustainable Development scenario (Bcm)
South East Asia
Japan
India
China
Russia
Middle East
Africa
Europe
Central/South America
North America
0 200 400 600 800 1000 1200
Bcm
2040 2030 2016
Source: IEA WEO (2017), Table 1, p.452.
International oil company (IOC) scenarios and projections have tended to show fossil fuels – and
particularly gas – continuing to increase in importance. The BP Energy Outlook to 2035 has a base
case in which gas demand is steeply rising in North America, Asia Pacific, and the Middle East, and is
stable or slowly increasing elsewhere. 11 However, one of the BP Outlook’s key uncertainties is the risk
to gas demand, pointing out that gas growth could be challenged by both stronger and weaker
environmental policies; resulting either from faster transition to low-carbon energy, or slower switching
from coal to gas and lack of support for carbon pricing. An ‘even faster transition’ case reduces 2015–
35 global gas demand growth to negligible proportions.12
In Statoil’s Energy Perspectives, global gas demand increases in all three of its scenarios up to 2030,
but growth in the Renewal scenario is marginal. 13 From 2030 to 2050, global gas demand increases in
two of the scenarios, but under Renewal, global demand is 14 per cent below its 2014 level, with
European and North American demand halving during this period and India having the only
10
IEA WEO (2017), Tables 8.1 and 11.1, pp. 339 and 452.
11
BP (2017). Regional data can be found in the data tables which accompany the main report.
12
Ibid, pp.76–85. 2.5 Bcm/year over the period, which compares with a base case of around 20 Bcm/year and a ‘slower gas’
case (where environmental policies are weaker rather than stronger) of 13 Bcm/year.
13
Statoil (2017), p.38. The three scenarios are: Reform, Renewal, and Rivalry with policy and the geopolitical environment
being the major differences between them.
7substantial increase in demand.14 The final observation of the gas section raises issues to which we
return in later sections:
‘The gas industry, together with national governments, must strike the balance between
rising cost, affordability and sustainable energy supplies to ensure the longer term role
of gas in a more diverse energy mix’.15
A Grantham Institute/Carbon Tracker study, which is critical of what it calls ‘business as usual’ studies
by IOCs, tests out the consequences for fossil fuel demand of applying current cost projections for
solar PV and growth of electric vehicles. These are that:16
‘Solar PV (with associated energy storage costs included) could supply 23% of global
power generation in 2040 and 29% in 2050, entirely phasing out coal and leaving
natural gas with just a 1% market share;
Electric vehicles (EVs) account for approximately 35% of the road transport market by
2035. By 2050, EVs account for over two thirds of the road transport market.’
It concludes:
‘Lower energy demand reduces natural gas demand growth across all sectors, but it is
only in our most bullish “Strong PV/Low EV” scenario that we see natural gas demand
peak in 2030 and fall thereafter’.17
For our purposes, one of the study’s most pertinent observations is:
‘In essence, the degree to which natural gas demand grows or not to 2050 could be one
of the key factors that determine whether we achieve the 2 degrees C target’.18
Although many of these studies have scenarios which see a fall in demand post-2030, the only
substantial modelling study located by this author which has what might be described as a
‘catastrophic’ outcome for gas by 2050 is Greenpeace’s 2015 energy [r]evolution in the form of the
Energy [R]evolution (E[R]) and the Advanced [R]evolution (ADV E[R]) scenarios. 19 Under the Energy
[R]evolution scenario:
Global gas demand in 2030 is above its 2012 level; even in 2040 it is only 16 per cent below its
2012 level, but by 2050 it has fallen to 42 per cent of that level.
Consistent with that pattern, in North America, OECD Europe, Europe/Eurasia and OECD Asia,
Latin America, and Africa, demand does not increase greatly and falls post-2030, but not
substantially until the 2040s. In the Middle East, demand is robust throughout the period. Only in
China and India, does demand increase significantly, peaking around 2040 and falling slightly
thereafter.
The Advanced [R]evolution scenario requires fossil fuels to be phased out almost completely by 2050
and for that reason gas demand is reduced to negligible proportions by that date:
Global gas demand in 2030 is very similar to E[R] and is 5 per cent above its 2012 level; by 2040
it is 30 per cent below its 2012 level, and in 2050 it has dropped to 7 per cent of that level;
14
Ibid, p.56.
15
Ibid, p.44.
16
Grantham Institute/Carbon Tracker (2017), p.3.
17
Ibid, pp. 28–9.
18
Ibid p.28.
19
Greenpeace (2015). Energy [R]evolution (E[R]) is a 2 degrees C scenario (similar to the IEA’s 450 scenario which was the
Agency’s 2 degree scenario previous to WEO 2017) with the additional aim of phasing out nuclear energy. Advanced
[R]evolution (ADV E[R]) ‘needs much stronger efforts to transform energy systems of all world regions towards a 100%
renewable energy supply … a much faster introduction of new technologies leads to a complete decarbonisation of the power,
heat and especially the transportation sector’.
8 Regional demand follows a similar pattern, but is more resilient across Asia than in other regions
up to 2040.
The conclusion of the overview of models and scenarios presented here 20 is that from a carbon
reduction perspective the future of gas is relatively robust up to 2030, but uncertain thereafter
depending on the region under consideration and the speed of decarbonisation. Aside from the
Greenpeace scenarios (especially Advanced [R]evolution), the consensus is that global gas demand
is unlikely to decline significantly until after 2040, although in some regions the decline could start
soon after 2030. From a global perspective, a 20–25 year horizon prior to significant decline could be
viewed as an acceptable definition of gas as a ‘transition fuel’.
Modelling consensus is not necessarily a good guide to the future. Technological advances and policy
discontinuities in the power sector may continue to disadvantage gas in energy balances. To the
extent that renewables with battery storage achieve further substantial reductions in costs, the role of
fossil fuels – and particularly higher-cost imported gas and LNG – could become further marginalised
in power generation. Changes in government policies to accelerate carbon reduction policies – which
the IEA refers to as ‘disjointed transition’ – could have a similar impact.21
The focus of the majority of all current energy studies is to illustrate the constraints that carbon (and
other greenhouse gas) emissions impose on fossil fuel use over the next several decades. Given the
consensus of 196 parties at the 2015 COP21 Paris conference, this is completely understandable.
But the major proposition of this study is that other factors may be more important (and significantly
more immediate) constraints on gas demand; the most important of these constraints is the
affordability of the fuel in relation to the development and delivery costs of pipeline gas and LNG in
the late 2010s.
20
We have focused here on energy models, not on studies which make the assumption that natural gas (and other fossil fuels)
must be phased out to meet targets. See for example Anderson and Broderick (2017), p.3. which concludes that, ‘By 2035
substantial use of fossil fuels, including natural gas, within the EU’s energy system will be incompatible with the temperature
commitments enshrined in the Paris Agreement’.
21
The impact of disjointed transition on global gas demand is that it follows the New Policies trajectory up to 2030 and then falls
sharply, joining the Sustainable Development trajectory in 2035. IEA WEO (2017), Figure 11.8, p.464.
93. Wholesale gas prices and affordability
For the purposes of this study, a global or regional approach with timescales up to 2050 tends to
obscure the question of whether it is possible to identify individual countries which may hold the key to
the future of gas over the next two decades. The major focus and context of the models and
scenarios discussed above, and of the previous European study, was carbon reduction. While carbon
reduction policies are by no means unimportant outside Europe, in many countries and (despite the
Nationally Determined Contributions (NDCs) entered into as a result of COP21) access to affordable
energy (including gas) supplies is much higher up the immediate political, economic, and energy
agenda.22
Definition and relevance of affordability
We suggest that in relation to gas, countries fall into two categories of affordability:
An absolute price level, such as $5/MMbtu, above which customers in a country cannot afford to
purchase the fuel either because of their income level, or because the end-user price level of the
final product (especially electricity) for which gas is being purchased would be too high.
A competitive price level above which customers in a country will purchase (or switch to) a
competing fuel (such as coal or renewables), or will invest in demand-side measures to avoid
purchasing the fuel.
In practice, anywhere there is a competitive fuel these two definitions may overlap.
Three problem areas for gas which were identified in the European study were: economic and
commercial, security, and environment.23 Economic and commercial problems centre on costs and
prices, as well as on the creditworthiness of buyers and therefore on the commercial viability of
projects. Cost inflation of pipeline and LNG projects was identified as a problem for upstream
companies in relation to Europe, but it is a much more serious problem for the future of gas in
countries where affordability is lower, and gas is delivered to entire classes of customer at prices
which do not cover the cost of delivery of domestically produced and (especially) imported energy
supplies.
Regional and national wholesale gas prices 2005–16
Figure 3 shows data for wholesale prices of gas by region for the period 2005–16, from which it can
be seen that, aside from Europe, Asia Pacific, Asia (post-2009) and North America (before 2009), the
price of gas has seldom approached $4/MMbtu and, in most other regions, has been significantly
below that level.24 This presents a clear differentiation between what could be deemed the historically
‘high price’ regions (Europe, Asia Pacific, and, since 2010, Asia) and ‘low price’ regions (Latin
America, former Soviet Union, Africa, and the Middle East).
22
NDC submissions can be found at: ‘INDCs as communicated by Parties’,
http://www4.unfccc.int/submissions/indc/Submission%20Pages/submissions.aspx.
23
The other two problem areas in Europe – business models and industry fragmentation – play a less important role in regions
which have either not privatised and liberalised, or where the gas industry has never established a large-scale presence in
energy balances.
24
For the methodological limitations of the IGU wholesale price data see Box 1.
10Figure 3: Wholesale gas price levels by region* 2005–16
$12.00
$10.00
$8.00
$/MMbtu
$6.00
$4.00
$2.00
$0.00
2005 2007 2009 2010 2012 2013 2014 2015 2016
North America Europe Asia Asia Pacific
Latin America FSU Africa Middle East
*for details of the regional groups see Appendix 3.
Source: IGU (2017), Figure 1.3, p.11.
BOX 1: METHODOLOGICAL LIMITATIONS OF THE IGU WHOLESALE PRICE DATA
The principal limitations of the data in Figure 3, and subsequent figures using the IGU price
survey, are that:
‘Comparisons of wholesale price levels ... need to be treated with caution ... [as]
they can cover different points in the gas chain – wellhead price, border price, hub
price, city gate price – so the comparison of price levels is not always a like for like
comparison’ IGU (2017, p.59).
In addition, these may be prices which are charged but, in many countries, the extent to which
they are paid is not certain.
The data are current prices for respective years quoted at current exchange rates. Hence, for
example, the sharp decline in FSU prices post-2013 can be largely explained by the rapid
depreciation of the ruble against the dollar.
For these reasons, price levels are not a completely accurate measure of affordability measured
consistently across (or even within) regions. Nevertheless, Figure 3 provides a strong indication
of long-run affordability – namely prices which markets could afford to pay for domestically-
produced or imported gas over the past decade.
The Asia Pacific region has demonstrated sustained price levels in excess of $8/MMbtu for most of
the period shown in Figure 3, with the exception of the mid 2000s and the post-2015 period. These
countries mostly link gas – and specifically LNG import – prices to oil prices and this is reflected in the
high levels of the 2010–14 period. Figure 3 shows that Asia is the only region to have moved from low
to high prices during this period. All other regions: Latin America, the Middle East, the former Soviet
Union, and Africa have sustained price levels below $4/MMbtu.
11Figure 4: Wholesale gas prices by region in 2016
Middle East
Africa
FSU
Latin America
Asia Pacific
Asia
Europe
North America
0 1 2 3 4 5 6 7
$/MMbtu
Source: IGU (2017), Figure 4.2, p.33.
Figure 4 shows the same data for 2016 which, more starkly than the historical series, illustrates that
only in the regions of Asia, Asia Pacific, and Europe were wholesale prices significantly above
$3/MMbtu. However, these regional figures involve averaging of data for significant numbers of
countries and it is therefore important to look at the price series for individual countries within a
region.25
Evolution of wholesale gas prices in different regions
This section provides a more detailed overview of the evolution of wholesale gas prices in individual
countries over the period 2005–16. North America is perhaps the least representative of all regions,
with high prices in the early/mid 2000s and low prices thereafter, due to the shale (oil and) gas
revolution which, since the late 2000s, has created a ‘Golden Age of Gas’ – the only region where this
has happened.26 Henry Hub prices fell from double digits in the early 2000s to less (and for periods
very substantially less) than $4/MMbtu for most of the 2010s. Because of the integration of the
region’s markets via cross-border pipelines, and the liquidity of these markets, prices remained within
a relatively narrow range (Figure 5). Scenarios from the US Energy Information Administration’s
Annual Energy Outlook 2017 indicate that Henry Hub prices will not rise substantially above
$4/MMbtu for the next two decades. 27 North America may be the only region which appears to have
domestic gas supply availability at these price levels for decades into the future, but the USA and
Canada have the capacity to pay much higher price levels (as evidenced by the early to mid-2010s)
should prices rise significantly higher than $4–5/MMbtu.28 Less clear is the position of Mexico, which
has benefited from imports of low-cost US pipeline gas, but where affordability at higher prices is less
certain.
25
For definitions of the IGU regions see Appendix 3.
26
For comments on the IEA’s Golden Age of Gas hypothesis see: IEA WEO (2017, Box 1, p. 337); Stern (2017); and Boersma
and Jordaan (2017).
27
Three of the five scenarios in the Annual Energy Outlook presentation (Slide 27) by the EIA Administrator Sieminski (2017) in
January 2017 suggested that prices will be at or below $5/MMbtu until 2040.
28
Other countries and regions such as Russia, Central Asian, and some Middle East countries such as Qatar may be able to
maintain similar production costs, but none have proved able to pay substantially higher prices on any sustained basis.
12Figure 5: Wholesale gas prices in North America 2005–16
Source: IGU (2017).
Figure 6: Wholesale gas prices in five Asian region countries 2005–16
Source: IGU (2017).
Figure 6 shows prices in five countries in the Asian region. While prices in Bangladesh and Pakistan
have mostly been significantly below 4/MMbtu, and Indian prices collapsed to that level in 2016,
prices in China and Hong Kong have been in the $8–10/MMbtu range since the early 2010s.
13Figure 7: Wholesale gas prices in six Asia Pacific region countries 2005–16
Source: IGU (2017).
Figure 7 shows that prices in Singapore, the Philippines, and (since 2009) Thailand have been
significantly higher than in the other Asia Pacific countries, although in 2016 there was considerable
convergence.
Figure 8: Wholesale gas prices in Japan, Korea, and Taiwan 2005–15
18.00
16.00
14.00
12.00
$/MMbtu
10.00
8.00
6.00
4.00
2.00
-
2005 2007 2009 2010 2012 2013 2014 2015 2016
Japan Korea Taiwan
Source: IGU (2017).
With a few exceptions, Figures 6 and 7 contrast sharply with the prices for Japan, Korea, and Taiwan
in Figure 8. These countries have little or no domestic gas production and therefore LNG imports set
the wholesale price. Price levels in the period 2010–14 were partly due to nuclear power station
closures (particularly in Japan), and partly to the very high oil price levels to which LNG prices were
contractually linked.
14Figure 9: Wholesale gas prices in six African countries 2005–16
14
12
10
$/MMbtu
8
6
4
2
0
2005 2007 2009 2010 2012 2013 2014 2015 2016
Ghana Ivory Coast Morocco
South Africa Tunisia Mozambique
Source: IGU (2017).
Five of the six African countries shown in Figure 9 have paid prices in the range of $4–12/MMbtu
during the period: Tunisia, Morocco, Ivory Coast, South Africa, and Ghana (since 2010). Elsewhere in
Africa, prices have remained below (and in many cases far below) $4/MMbtu, although by 2016 prices
had been raised much closer to this level in Egypt and Cameroon.
Of the eight Middle East countries in Figure 10, Israel and Jordan stand out with significantly higher
gas prices than the Gulf countries, which are all below $3/MMbtu for most of the period. However,
prices in Gulf countries do not reflect affordability levels, for reasons which are discussed in Section 4.
Figure 10: Wholesale gas prices in eight Middle East countries 2005–16
8
7
6
$/MMbtu
5
4
3
2
1
0
2005 2007 2009 2010 2012 2013 2014 2015 2016
Iran Israel Jordan
Kuwait Oman Qatar
Saudi Arabia United Arab Emirates
Source: IGU (2017).
Of the seven countries of the former Soviet Union in Figure 11, Belarus and Ukraine stand out with
significantly higher gas prices in the 2010s than other countries, which are all substantial producers
and exporters. As mentioned above (Box 1), the sharp decline in Russian prices post 2013 is mainly
due to the depreciation of the rouble against the dollar.
15Figure 11: Wholesale gas prices in seven countries of the Former Soviet Union 2005–16
10
8
$/MMbtu
6
4
2
0
2005 2007 2009 2010 2012 2013 2014 2015 2016
Azerbaijan Belarus Kazakhstan
Russian Federation Turkmenistan Ukraine
Uzbekistan
Source: IGU (2017).
Of the seven Latin American countries in Figure 12, Brazil and Chile had significantly higher gas
prices for most of the period, although they converged with Colombian prices in the mid-2010s, while
in Peru, Trinidad, Argentina, and Venezuela prices remained substantially below $4/MMbtu.
Figure 12: Wholesale gas prices in seven Latin American countries 2005–16
12
10
8
$/MMbtu
6
4
2
0
2005 2007 2009 2010 2012 2013 2014 2015 2016
Argentina Brazil Chile Colombia
Peru Trinidad Venezuela
Source: IGU (2017).
164. Affordability and future demand potential
Individual country criteria and the contrast between China and India
Table 1 shows countries in terms of population, GDP per capita, and share of gas in primary energy
demand (PED) (2016 figures), together with wholesale price levels for the period 2005–16. Countries
where gas has a potentially bright future are those with relatively large populations, where the fuel
comprises significantly less than 20 per cent of primary energy demand, and where there is a proven
ability to pay prices sufficient to remunerate the development and delivery of LNG and pipeline gas
imports. Those in the first two categories which have demonstrated the ability to pay wholesale prices
of $8/MMbtu and above are: China, the Philippines, Thailand, Brazil, Chile, Tunisia, Morocco, and
Ghana. If we include countries (in the first two categories) with prices which have ranged from $4–
8/MMBtu, then we can add: India, Ivory Coast, South Africa, Indonesia, Vietnam, and Colombia. The
possibility that countries with smaller populations (or those where the share of gas is already in
excess of 20 per cent of primary energy demand) could still have significant potential for increased
gas demand is not excluded, but the case may be harder to make. The scale of demand expectations
is clearly different between Asian countries with large populations (such as China) and African
countries with smaller populations and much lower per capita GDP levels.
But country-level generalisations, particularly for large countries, do not capture the granularity of
individual regions, sectors, and industries which may be willing and able to pay much higher prices
than the average, particularly for a constant supply of energy. This will particularly be the case for
major regions or cities with a higher per capita GDP level than the country average, or where export-
oriented industries are located. An additional question is then whether these gas demand ‘niches’ of
1–2 Bcm in countries such as Ghana, Ivory Coast, and Morocco – despite being located in countries
with relatively low per capita GDP – could in time grow into significantly larger, higher-price, gas
markets.
China and India provide an interesting contrast in relation to affordability and price reform. They are
both countries with populations in excess of 1.3 billion, where gas is significantly less than 10 per cent
of primary energy demand. Hence they are both high priority targets for those seeking markets for
large volumes of gas.29 Projections of Chinese gas demand (Figures 1 and 2) show that this could
increase by 270–290 Bcm by 2030 and by 400–450 Bcm by 2040, compared with 210 Bcm in 2016. 30
Chinese regulated city gate gas prices range from close to $9/MMbtu in Shanghai to less than
$4.50/MMbtu in Xinjiang (western China); prices in the majority of the eastern provinces are in excess
of $8/MMbtu.31 From November 2016, the National Development and Reform Commission (NDRC)
has allowed city gate prices to fluctuate within a range of plus or minus 20 per cent from the regulated
price level, meaning that prices in many eastern provinces have been in excess of $10/MMbtu. In
some respects, these regulated prices are problematic, given their inflexibility and slowness to
respond to fluctuations in international price levels, and this may have been partly responsible for the
fall in gas demand growth rates in 2015/16. In another context, they can be regarded as providing
incentives for domestic Chinese producers to continue development of high-cost (especially
unconventional) production.
29
By ‘large’ is meant volumes in excess of 10 Bcm/year. This contrasts with other markets with much more limited demand
potential.
30
For detailed discussion of Chinese gas demand see: Peng, D. ‘Prospecting Chinese gas demand’, in OEF (2017a), pp. 23–
27.
31
Prices from NDRC (converted at $1 = RMB6.5) which had remained unchanged from 2015, were lowered in September
2017. Interprovincial transmission tariffs and VAT on gas were reduced at the same time.
17Table 1: Non-OECD countries* with significant future gas potential, 2016
Wholesale prices representative of the Gas Gas as Population GDP/Capita
period 2005–16 Demand % of (mill) US $ 2017
HIGH MEDIUM LOW (Bcm) PED
>$8MMbtu $4–However, despite continuing tariff anomalies between provinces, and slow progress in liberalisation of
access to infrastructure, Chinese gas price reform has moved significantly towards market pricing
during the 2010s. 32 It has also been consistent with environmental policy and urban air quality
improvement, which is particularly important for the winter months when heating demand rises
dramatically and substantially more gas is needed to substitute for coal. These reforms have also
signalled that, at least in the eastern part of the country, affordability levels are high enough to support
the costs of delivery from new international pipeline and LNG projects. 33
This provides a significant contrast to India, where gas demand is projected to increase by 70–100
Bcm in 2030 and 128–175 Bcm in 2040, from 55 Bcm in 2016 (Figures 1 and 2). While these
increases are significantly less than the China projections, they are very substantial, and certainly
important for those marketing large volumes of new gas. Figure 3 shows that wholesale prices for the
Asian region were in excess of $4/MMbtu but significantly less than $8/MMbtu for most of 2010–16.
However, this is an example of the difficulty of interpreting the term ‘wholesale price’ (see Box 1), as
the price paid for domestically produced gas has never exceeded $4/MMbtu, despite the fact that a
price of twice that level is estimated to be required to bring forward substantial additional supplies. 34
A study of the competitiveness of Indian gas by sector suggests that aside from the transport sector –
where compressed natural gas (CNG) is not subject to the taxation levied on gasoline and diesel – it
is very difficult for gas to compete at a price in excess of $5/MMbtu; and in relation to domestic coal in
the power sector that figure is $3.50/MMbtu. 35 The transport sector is important since India was one of
the first countries to mandate switching to CNG in urban transportation for air quality reasons; this
was applied in 11 (out of 29) states by the mid-2010s. But the main obstacle to optimism that India will
increase gas demand on the scale suggested in Figures 1 and 2, is the lack of any coherent national
gas price reform and seemingly less concern about air quality despite increasing problems in major
cities.
Affordability and government subsidies
We have already seen that in large countries such as China, average prices may not be a guide to
affordability in individual provinces, due to the specific characteristics of customers or government
policies which require gas to be introduced for environmental reasons. But another important reason
why these prices are not an accurate guide to affordability can be seen where governments (or
government-owned utilities) have been willing to subsidise domestically produced gas and
(particularly) imported gas or LNG.
Many countries (and indeed entire regions) subsidise energy, including gas, prices to certain (and in
some cases to all) market sectors. Defining and measuring what is, or should be considered as, a
‘subsidy’ is a complex task, but for our purposes two definitions are relevant: 36
Prices which are lower than international trade – related to either to oil or hub – benchmarks;
Prices which fail to cover the cost of delivery – either production or import and transportation – of
gas to customers.
32
For an account of how Chinese gas price reform progressed from cost- to market-based pricing see Chen (2012).
33
It is not clear whether this is true of Gazprom’s Power of Siberia pipeline, due to start operating at the end of 2019. Detailed
calculations depend on cost and exchange rate assumptions. Henderson and Mitrova (2015).
34
Sen (2017), Figure 1 and pp.2–3. In October 2017, the price for gas produced from ultra-deep water was raised to
$6.30/MMbtu for the coming 6 months. But this only relates to a very small share of total production and it remains to be seen
whether it will be high enough to revive interest in offshore acreage.
35
Ibid, pp.2–20 especially Figures 9–12. See also Sen, A. ‘Disentangling short and long-term determinants of gas demand in
India’, OEF (2017a), pp.27–32.
36
The IEA uses the following subsidy formula: Subsidy = Reference Price – End User Price, where Reference is the import
parity price. IEA Website (2017) has data on subsidies by fuel and by country. An alternative definition includes the taxes
necessary to offset the emissions caused by burning the fuel. Coady et al. (2015) and Parry (2016).
19You can also read