The Big Picture Investing in an uncertain world - Quarterly update From Invesco's Global Market Strategy Office - e-fundresearch.com
←
→
Page content transcription
If your browser does not render page correctly, please read the page content below

The Big Picture
Investing in an uncertain world
Quarterly update
From Invesco’s Global Market Strategy Office
For professional/qualified/accredited investors only

22 March 2020
Data as of 16 March 2020 unless stated otherwise

The Big Picture
                                     Investing in an uncertain world

Is this a buying opportunity or the half-way stage in a larger slump? The truth is we don’t
know, so we have constructed a range of scenarios that see the S&P 500 anywhere between
1400 and 3000 in 12 months. A probability-weighted approach, adjusted for the recent
change in cross-asset correlations, leads to a bar-bell approach in our Model Asset Allocation
that favours gold and cash among defensive assets and real estate and commodities among
cyclicals. Investment-grade credit (IG) is favoured under all scenarios. Regionally, we are
now Overweight UK, Japanese and EM assets.

Model asset allocation

In our view:

▪    Equities offer good returns in optimistic scenarios but we prefer other cyclicals. We go more Underweight.
▪    Real estate is among our favoured cyclical assets. We stay at Maximum.
▪    Corporate high-yield (HY) is under threat in the worst outcomes. We reduce to zero.
▪    Corporate investment-grade (IG) is favoured in all scenarios. We stay at Maximum.
▪    Government debt is unattractive and less diversifying. We remain Underweight.
▪    Emerging markets (EM) is still the sovereign space with the best potential. We stay at Maximum.
▪    Cash returns are low but stable and de-correlated. We remain Overweight.
▪    Gold has lost some of its froth and could still rise in the worst scenarios. We go Overweight.
▪    Commodities are now cheap (especially oil). We increase to Maximum.
▪    Currency hedges are not needed.

Assets that we consider good value on a long-term basis include:
▪    Oil (we always highlighted $20 per barrel as the target in a recession)
▪    Sterling (at 1.15, GBPUSD is close to historical lows)
▪    Real estate (the global REITS yield is now 5.5%)

Figure 1 – Projected 12-month asset class total returns by global GDP scenario

Notes: based on local currency returns. Figures in parenthesis are our subjective probabilities. GDP data shows projected global GDP growth
in 2020. Cash is an equally weighted mix of USD, EUR, GBP and JPY. As of 16 March 2020. There is no guarantee these views will come to
pass. See Appendices for definitions, methodology and disclaimers. Source: BAML, MSCI, GSCI, FTSE, Refinitiv Datastream and Invesco

March 2020                   For professional/qualified/accredited investors only                                                        1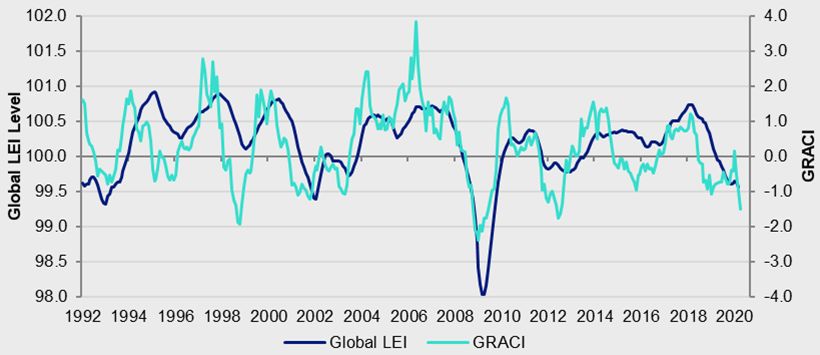
Global Market Strategy Office
                                                                                                                                     The Big Picture

Table of contents

Summary and conclusions: investing in an uncertain world.......................................................................... 3
Model asset allocation ...................................................................................................................................... 5
Since we last wrote ........................................................................................................................................... 6
Taking a step back: focusing on the next decade using Invesco’s CMAs ..................................................... 7
Are we facing global recession? ...................................................................................................................... 8
   Monitoring the situation.................................................................................................................................. 11
Are risky assets cheap? ................................................................................................................................. 13
   A word about correlations .............................................................................................................................. 16
Coronavirus scenarios for 2020 ..................................................................................................................... 17
How will we know which scenario is unfolding? ........................................................................................... 20
   Bringing the pandemic under control.............................................................................................................. 20
   Policymakers to the rescue? .......................................................................................................................... 21
   Finding a vaccine will take time...................................................................................................................... 23
Model Asset Allocation: investing in an uncertain world.............................................................................. 24
Appendices ..................................................................................................................................................... 27
   Appendix 1: Global valuations vs history ........................................................................................................ 27
   Appendix 2: Asset class total returns ............................................................................................................. 28
   Appendix 3: Invesco 10-year Capital Market Assumptions (USD version) ...................................................... 29
   Appendix 4: Scenario asset assumptions ....................................................................................................... 30
   Appendix 5: Methodology for asset allocation, expected returns and optimal portfolios ................................... 31
   Appendix 6: Definitions of data and benchmarks ............................................................................................ 32
Important information ..................................................................................................................................... 34

March 2020                        For professional/qualified/accredited investors only                                                                          2
Global Market Strategy Office
The Big Picture
Summary and conclusions: investing in an uncertain world
Extreme uncertainty This is not the year we were expecting nor do we know how it will end. Anything seems
leads us to a scenario possible. Given the degree of uncertainty we have resorted to four scenarios, ranging
approach
from deep global recession to simple deceleration. We have run asset class
optimisations based on all four and also on a probability-weighted average.
We adopt a barbell However, cross-asset correlations are rising, so judgement remains more important than
approach in the search ever as we strive for diversification. The result is a barbell approach: Overweight the
for diversification “defensive” cash and gold but also Overweight the more cyclical commodities and real
estate. Investment Grade (IG) credit was the one constant maximum allocation asset
across all scenarios and we do likewise in our Model Asset Allocation. Geographically,
we favour UK, Japanese and emerging market (EM) assets.
How do you invest in a world where a deadly virus is forcing a global shutdown, where
It is easy to panic
the oil price is collapsing for other reasons and where policy makers are taking extreme
measures to soften the blow? This extreme uncertainty has been reflected in the
volatility and rising correlations displayed by financial markets. It is easy to panic and
run for the hills (both literally and by adopting an extremely defensive portfolio stance)
but it is not obvious which assets now offer diversification. Cash seems to be the one
asset that has remained decorrelated but that could change if the banks have problems.
However, we can imagine three potential panic circuit breakers: first, a peaking of non-
What could stem the Chinese Covid-19 cases and deaths; second, a policy response that provides shock and
panic?
awe to financial markets and protects the cash flows of businesses and households and,
finally, the development of a viable vaccine (and treatments).
The policy response is Given that an effective and approved vaccine appears to be at least 12 months away,
key hope rests with efforts to quell the outbreak and the fiscal and monetary responses to the
consequent economic crisis. We await signs that the outbreak is coming under control,
so for now we are all relying on a suitable policy response. Reminiscent of the Global
Financial Crisis (GFC), such policy initiatives are arriving thick and fast and in ever
increasing sizes. For example, the Bank of England has introduced changes that could
provide £300bn of loan financing, equivalent to 13% of 2019 GDP.
Fiscal deficits could rise However, such efforts to facilitate loan growth depend upon the willingness of the banks
to 10%-20% of GDP, and their customers to enter such arrangements. It looks increasingly as though
thus requiring QE governments will have to step in to replace normal sources of income. For example,
Denmark has promised Covid-19 impacted businesses that it will cover 75% of employee
salaries (up to a limit) over the next three months if they promise not to make staff
redundant. We think such measures will become widespread but at a cost: if all incomes
had to be covered by the government for three months that would imply extra
government spending of 25% of full-year GDP (assuming all workers are in the private
sector, which they are not). It is therefore not far-fetched to imagine that budget deficits
could reach 10%-20% of GDP this year, a level more associated with war. No wonder
government bond yields have risen sharply in recent days and that central banks are
now announcing big asset purchase programmes (the BOE, ECB and Fed, for example).
2020 global GDP growth So, economies may shutdown but governments and central banks could help avert the
could be anywhere from worst recessionary outcomes. We therefore consider four scenarios that range from a
-3.5% to +2.0% very best case of global GDP growth slowing to 2% in 2020 (versus an original
expectation of 3%) all the way down to a very worst case of Spanish flu proportions with
global GDP shrinking by 3.5% in 2020. Under the latter, we assume that financial
markets would behave as they did during the GFC (in terms of yield curves, spreads,
equity multiples etc.).
With 12-month S&P It is perhaps more instructive to translate that into 12-month market forecasts. Under the
targets between 1400 very best-case scenario, we imagine the S&P 500 would be at 3000 in 12 months, with
and 3000 gold at $1325 per ounce and Brent crude at $45 per barrel. On the other hand, under
the very worst-case scenario, we imagine the S&P 500 at 1400, gold at $1750 and Brent
at $20 (close to where it dropped on 18 March 2020).
March 2020 For professional/qualified/accredited investors only 3Global Market Strategy Office
The Big Picture
IG is favoured in all So, how do we position ourselves in the face of such uncertainty? Not surprisingly, the
scenarios best-case scenarios suggest that equity-like assets and commodities will outperform,
while the reverse is true for the worst-case hypotheses (see Figure 1). Optimisations
then favour high-yield (HY) credit, real estate and commodities (but not equities) in the
best-case outcomes and gold and government bonds in the worst-case eventualities
(see Figure 26). IG is favoured in all scenarios.
Optimisation suggests a When using our probability-weighted projected returns, Figure 31 shows that the
barbell approach optimiser suggests a barbell approach that favours gold, IG, real estate and commodities
(government debt would be neutral and HY and equities would be Underweight).
However, those optimisation processes are based on historical correlations and we have
But beware changing observed a marked change in such correlations over recent weeks (see Figure 23). In
correlations
our opinion, this implies that gold and government bonds are no longer the strong
diversifiers that they once were, so we are not slavishly following those optimisation
results. In particular, rather than being at the maximum in gold, we are sharing the
diversifying burden between cash and gold, both of which are at an Overweight 5% in
our Model Asset Allocation (see Figures 2 and 3).
And low government Further, given the extreme lows reached by developed world government bond yields
bond yields (and the risk of escalating supply), we have decided to remain Underweight that asset
class. As shown in Figure 3, we continue to favour emerging market (EM) government
debt (we like the spread versus the developed world and EM currencies have weakened)
and UK gilts (the UK economy seems precarious and sterling is now extremely cheap).
We favour IG over HY Among less-volatile fixed income groups, we are maximum allocated to corporate IG,
which seems to represent a good combination of risk, reward and diversification. Based
on our projected returns, we favour US, UK and EM markets (the latter has been added
to our framework in this edition). On the other hand, we are zero-weighted in Corporate
HY. Though spreads have widened, they could go much further in the worst outcomes.
Turning to the more cyclical assets, we remain at the maximum allocation to real estate
Real estate and
commodities are our (though the Neutral and policy range have been increased) and we are moving to the
favoured cyclical assets maximum allocation to commodities (with oil close to $20 we think the sustainable
downside is limited). On the other hand, we have gone further Underweight in equities
(while also reducing the Neutral position and policy range). Though we expect strong
performance in the best scenarios, and believe that some equity markets are now in
cheap terrain (the UK and Japan, for example), we think there are more efficient ways to
gain that cyclical exposure (real estate and commodities, say).
Weak sterling makes UK
assets cheap
From a regional perspective, we find ourselves now Overweight UK, Japanese and EM
assets, with the main Underweight in the Eurozone.
Figure 2 – Expected total returns (annualised, local currency) and Model Asset Allocation*
Probability-Weighted Neutral Policy Model Position
1-year Total Return Portfolio Range Asset Vs Neutral
Allocation
Cash & Gold 3.8% 5% 0-10% ↑ 10% Overweight
Cash -0.1% 2.5% 0-10% 5% Overweight
Gold 7.8% 2.5% 0-10% ↑ 5% Overweight
Government Bonds 3.9% 30% 10-50% ↑ 20% Underweight
Corporate IG 4.3% 10% 0-20% 20% Overweight
Corporate HY -0.6% 5% 0-10% ↓ 0% Underweight
Equities 0.2% 40% 20-60% ↓ 30% Underweight
Real Estate 8.9% 8% 0-16% 16% Overweight
Commodities 5.7% 2% 0-4% ↑ 4% Overweight
*This is a theoretical portfolio and is for illustrative purposes only. It does not represent an actual portfolio and is not a recommendation of
any investment or trading strategy. Arrows show direction of change in allocations. Note we have made several structural changes. The
Neutral allocation to Real Estate has been increased to 8% (from 3%) and that for equities reduced to 40% (from 45%). Policy ranges
have been adjusted accordingly. Allocation changes are not indicated (arrows) if they were the result of changes in Neutral allocations.
See appendices for definitions, methodology and disclaimers. There is no guarantee that these views will come to pass. Source: Invesco
March 2020 For professional/qualified/accredited investors only 4Global Market Strategy Office
The Big Picture
Model asset allocation*
Figure 3 – Model asset allocation (22/03/2020)
Neutral Policy Range Allocation Position vs Neutral Hedged Currency
Cash 5% 0-10% ↑ 10%
Cash 2.5% 5%
Gold 2.5% ↑ 5%
Bonds 45% 10-80% ↓ 40%
Government 30% 10-50% ↑ 20%
US 10% ↑ 9%
Europe ex-UK (Eurozone) 8% 0%
UK 2% ↑ 3%
Japan 8% 4%
Emerging Markets 2% 4%
Corporate IG 10% 0-20% 20%
US Dollar 5% 10%
Euro 2% ↓ 2%
Sterling 1% ↑ 4%
Japanese Yen 1% ↓ 1%
Emerging Markets 1% ↑ 3%
Corporate HY 5% 0-10% ↓ 0%
US Dollar 4% ↓ 0%
Euro 1% ↓ 0%
Equities 40% 20-60% ↓ 30%
US 24% ↑ 14%
Europe ex-UK 6% ↓ 2%
UK 3% ↑ 6%
Japan 3% ↓ 6%
Emerging Markets 4% ↓ 2%
Real Estate 8% 0-16% 16%
US 2% ↑ 5%
Europe ex-UK 2% 2%
UK 1% ↑ 1%
Japan 2% ↑ 5%
Emerging Markets 1% ↑ 3%
Commodities 2% 0-4% ↑ 4%
Energy 1% ↑ 2%
Industrial Metals 0.3% 1%
Precious Metals 0.3% 0%
Agriculture 0.3% ↑ 1%
Total 100% 100%
Currency Exposure (including effect of hedging)
USD 49% ↑ 47%
EUR 20% ↓ 7%
GBP 7% ↑ 16%
JPY 15% ↑ 18%
EM 8% ↓ 13%
Total 100% 100%
*This is a theoretical portfolio and is for illustrative purposes only. It does not represent an actual portfolio and is not a recommendation of
any investment or trading strategy. Cash is an equally weighted mix of USD, EUR, GBP and JPY. Currency exposure calculations exclude
cash. Arrows show direction of change in allocations. Note that in this edition we have made several structural changes. First, the Neutral
allocation to Real Estate has been increased to 8% (from 3%) and that for equities has been reduced to 40% (from 45%). The policy ranges
have been adjusted accordingly. Second, we have now added Emerging Markets to the Corporate IG section. Allocation changes are not
indicated (arrows) if they simply resulted from the changes in Neutral allocations. See appendices for definitions, methodology and
disclaimers. Source: Invesco
March 2020 For professional/qualified/accredited investors only 5Global Market Strategy Office
The Big Picture
Since we last wrote
We published the 2020 outlook (On a wing and a prayer) in November 2019, since when
a lot has changed. Figure 4 shows the global asset class returns since then (as of 12
March 2020) and full regional detail is shown in Appendix 2. Given recent volatility, we
are showing data as of 12 March 2020, rather than the normal end of month cut-off.
The world is Though risk-assets did not initially show much concern about the Covid-19 outbreak, that
unrecognisable versus changed during March and Figure 4 shows the extent of losses in equity-like and
what we expected for commodity assets since 31 October 2019. The bad news for us is that in the 2020
this year outlook, we expected the best returns to come from real estate and equities, though we
were slightly underweight equities (for diversification reasons). Being Underweight in
both gold and government bonds was clearly the wrong thing to do. What next?
Figure 4 – Global asset class total returns since 31/10/19 (local currency, %) *
8
4
0
-4
-8
-12
-16
Overw eight
-20 Underw eight
-24 Neutral
-28
*31/10/19 to 12/03/20. Colours represent model allocations during this period. See appendices for definitions
and disclaimers. Past performance is no guarantee of future results. Source: Refinitiv Datastream and Invesco
We must now evaluate whether anything has changed that could necessitate a change
Have risk asset prices
fallen enough? in our projections and allocations. Asset class yields have diverged, with cash and
government yields falling (until recent days), while others have risen (see Figure 5). In
the absence of any other changes this would suggest even more of a preference for
equity-like assets (based on long-term return potential). However, other things have
changed and we are now less optimistic about the global growth outlook and are more
fearful of recession. The question is whether the change in financial asset prices has
been enough to compensate for the less optimistic projections.
Figure 5 – 4m change in global yields (bps)
200
150
100
50
0
-50
Cash Gov Bonds Corp IG Corp HY Equities Real Estate
From 31/10/19 to 12/03/20. See appendices for definitions and disclaimers. Past performance is no guarantee
of future results. Source: Refinitiv Datastream and Invesco
March 2020 For professional/qualified/accredited investors only 6Global Market Strategy Office
The Big Picture
What do Invesco’s 10- Taking a step back: focusing on the next decade using Invesco’s CMAs
year CMAs say? Before worrying about the potential cyclical effects of Covid-19, we thought it worth
stepping back and looking at the long-term prospects. Invesco Investment Solutions
recently published their 10-year capital market assumptions (as of 31 December 2019)
and we thought it might be interesting to put them into our asset allocation framework
and run them through our optimisation process. Figure 6 shows their projected returns
for global asset classes in a range of currency bases (their framework differs from ours,
so we have had to adapt some of their categories – for instance, we use their US
Treasury Short category to represent cash and precious metals for gold).
Figure 6: Invesco 10-year capital market assumptions (global assets, % ann.)
USD EUR GBP CHF
Cash & Gold 2.5 0.4 1.4 0.1
Cash - US Treasury Short 1.8 -0.3 0.7 -0.5
Gold 3.1 1.0 2.0 0.7
Government Bonds 1.9 -0.2 0.8 -0.4
Corporate IG 2.5 0.4 1.4 0.1
Corporate HY - US HY 4.1 2.0 3.0 1.8
Equities 6.0 3.9 4.9 3.7
Real Estate 5.0 2.9 3.9 2.6
Commodities 5.4 3.3 4.3 3.0
Note: Estimates as of 31 December 2019 and based on the 10-year capital market assumptions published by
Invesco Investment Solutions in 2020 Long-Term Capital Market Assumptions – Q1 Update. The USD version of
the CMAs is reproduced in Appendix 3. The above table uses the geometric expected return version for global
asset classes (“gold” is based on the projections for precious metals and the “Cash & Gold” category shows the
average of those two assets). These estimates reflect the views of Invesco Investment Solutions, the views of
other investment teams at Invesco may differ from those presented here. There is no guarantee that these
views will come to pass.
Source: Invesco Investment Solutions
Cash & gold, HY and Not surprisingly, the further we move along the risk spectrum, the higher the projected
equities dominate CMA returns. With one exception: real estate. That is interesting because it remains one of
based optimal portfolios our favoured asset classes. Combining those projections with measures of volatility and
diversification (our 10-year historical covariance matrices) gives the results shown in
Figure 7. Though results vary by currency base and depending on what is maximised
(Sharpe Ratio or returns), there are some broad themes: the combination of cash & gold
is given a maximum allocation, while real estate is largely given a zero allocation.
Equities and HY are largely Overweighted, while IG is largely Underweighted.
Figure 7: Optimised global allocations based on Invesco’s 10-year CMA projected returns
Neutral Policy Maximise Sharpe Ratio Maximise Return
Portfolio Range USD EUR GBP CHF USD EUR GBP CHF
Cash & Gold 5% 0-10% 10% 10% 10% 10% 10% 10% 10% 10%
Cash 2.5% 0-10% 10% 0% 10% 0% 8% 7% 10% 5%
Gold 2.5% 0-10% 0% 10% 0% 10% 2% 3% 0% 5%
Government Bonds 30% 10-50% 43% 10% 10% 10% 29% 29% 16% 28%
Corporate IG 10% 0-20% 15% 0% 0% 0% 0% 0% 0% 1%
Corporate HY 5% 0-10% 10% 10% 10% 6% 10% 10% 10% 10%
Equities 40% 20-70% 21% 66% 69% 70% 51% 47% 62% 45%
Real Estate 8% 0-16% 0% 0% 0% 0% 0% 0% 0% 2%
Commodities 2% 0-4% 0% 4% 1% 4% 0% 4% 2% 4%
Note: optimisations are based on the 10-year projected returns published by Invesco Investment Solutions in 2020 Long-Term Capital Market
Assumptions – Q1 Update, as shown in Figure 6 above. Optimisations are performed by the Asset Allocation Research team using our historical
10-year covariance matrices (for each currency). “Gold” is based on the projections for precious metals and the “Cash & Gold” category shows
the sum of allocations for those two assets). “Maximise Sharpe Ratio” optimisations are performed by maximising the Sharpe Ratio subject not
violating the constraints implied by the policy ranges shown in the table. “Maximise Return” optimisations are performed by maximising return
subject to the policy range constraints but also subject to the standard deviation of returns not exceeding that of the Neutral Portfolio (as shown in
Figure 3). Though based on the projected returns provided by Invesco Investment Solutions, these optimal allocations do not represent their
views, nor those of any other investment team at Invesco. See appendices for definitions, methodology and disclaimers.
Source: Invesco Investment Solutions, Invesco
March 2020 For professional/qualified/accredited investors only 7Global Market Strategy Office
The Big Picture
Are we facing global recession?
Economic data is In an ideal world, economic and corporate data flows would inform our judgements about
virtually useless right the economic cycle. Unfortunately, data for periods prior to February 2020 are largely
now
irrelevant and that for the period during which economies are shut down is virtually
useless. More important is how quickly economies recover; how long it takes activity to
return to normal levels; when, if ever, lost output is recovered and how much, if any,
permanent damage is done (in terms of bankruptcies etc.).
A technical recession is We still do not know the damage suffered by the Chinese economy during the first
possible; policy may quarter of 2020. However, with declines of 20.5% in retail sales and 24.5% in fixed asset
determine how deep investment (both y-o-y for the months of January and February taken together), we
suspect that GDP will have declined during Q1. We think other economies will go
through a similar process during late Q1 and early Q2. On this basis, a technical
recession (two quarters of negative growth) is a possibility at the global level, with full
year growth depending on how rapidly normality is restored and lost production
recovered. Today’s policy choices will determine the extent of the downturn and the
speed of the recovery.
The structure of the US Even the finance industry could freeze. It is not beyond the bounds of possibility that
economy may be an stock exchanges and other financial trading venues are forced to close. This would not
advantage be the first time: for example, the New York Stock Exchange (NYSE) closed for a week
in September 2001 (after the attack on the World Trade Centre) and was also closed for
four months in 1914 after the outbreak of WW1, as were all other major global
exchanges (though transactions did occur off market). However, in general, we would
expect service sectors to be less impacted than industrial sectors. On this basis, the US
economy looks to be better placed than most, especially given the relative lack of
dependence on trade flows (see Figure 8).
Figure 8: Value added by broad sector for major economies in 2018 (% of GDP)
World US China Japan Eurozone UK India
Agriculture 3.4 0.9 7.2 1.2 1.6 0.6 14.6
Industry 25.4 18.2 40.7 29.1 21.9 17.5 26.8
Manufacturing 15.6 11.2 29.4 20.7 14.7 8.8 14.8
Services 65.0 77.4 52.2 69.1 66.0 71.0 49.1
Exports (% of GDP) 30.1 12.2 19.5 18.5 45.9 30.0 19.7
Note: value added does not add up to 100% as some components are not shown. Exports are not part of
value added but show exposure to global trade. All data for 2018 except for value added for World, US and
Japan which are for 2017. As of 16 March 2020. Source: World Bank, Refinitiv Datastream and Invesco
Some sectors cannot Some economic activities are impossible under current circumstances. Travel (domestic
operate in these and international) is severely limited, large gatherings are forbidden and social distancing
circumstances is imposed. Travel & leisure is an obvious casualty, with airlines, hotels and restaurants
severely disrupted (it is the worst performing global equity sector year-to-date, apart from
energy, according to Datastream indices). The same applies to those parts of the
entertainment industry that are played to audiences (sport, theatre, cinemas). However,
the reverse is true for those parts of the media sector that provide home entertainment,
especially those that provide access to movies and catalogues of popular TV series.
Other types of value added will become difficult due to the absence of workers (either
because of lock downs or the need to look after children due to school closures, say).
Some service sector activities can be done just as well from home (the writing of this
document, for example) but many industrial activities require a physical presence. For
instance, factories need a certain minimal staffing to be able to operate and that may
become impossible to ensure. In extreme circumstances, this could apply to the
production of necessities (electricity, gas, water and food, for example).
But some will see a rise On the other hand, some companies and sectors will benefit from this situation: medical
in demand equipment manufacturers (ventilators, say), toilet paper makers, hand sanitiser
producers and food manufacturers and retailers (as panic buying emerges). Year-to-
date stock market performance shows relatively strong performance from the following
sectors: retailers, food, beverage & tobacco and personal care, drug & grocery stores.
March 2020 For professional/qualified/accredited investors only 8Global Market Strategy Office
The Big Picture
Unsurprisingly, the healthcare sector has done even better, given the search for an
effective vaccine and the need for public sector healthcare providers to procure private
sector resources.
Trying to assess the vulnerability of an economy requires more granular information than
A more granular
approach is available in Figure 8. Using national accounts data, Figure 9 is our attempt to provide
just that, based largely on value-added data provided by national data sources. We
show the data for China and Italy as they have both imposed lock downs and for the US,
which is the world’s largest economy and may eventually go through the same
experience (New York is among cities that have already started the process).
Figure 9: Economic value added by sector (% of national total)
US China Italy
Agriculture, forestry & fishing 0.8 7.4 2.2
Extractive industries 1.6 7.1 0.3
Construction 4.1 7.2 4.3
Industry 13.0 32.0 19.3
Manufacturing 11.4 16.6
Utilities 1.6 2.7
Trade, transport, hotel & catering 14.7 15.8 21.6
Retail & wholesale trade 11.5 9.7
Transport and warehousing 3.2 4.3
Airline transport 0.7
Hotels & catering 1.8
Information and communication 5.5 3.7
Finance & insurance 7.4 7.8 4.8
Real estate activities 13.3 7.0 13.7
Other services 25.4 16.2 30.1
Professional, business, admin 12.6 9.6
Education, healthcare, social 8.7 16.4
Arts, entertainment, recreation 4.1 4.1
Government 12.2
Other 2.1
Total negatively impacted 42.8 28.1 32.5
Total positively impacted 32.5 9.7 16.4
Notes: As of 2018 for US data and 2019 for both China and Italy. “Negatively impacted” are those sectors
that believe could be negatively impacted by the economic dislocation resulting from Covid -19 in terms of
lower volumes and/or prices. “Positively impacted” are those sectors that we believe could be positively
impacted by higher volumes or prices as a result of Covid-19. In the US, hotel & catering activity is included
in the arts & entertainment category. In Italy, defence activity is included in the education, healthcare and
social category. As of 16 March 2020. Source: US Bureau of Economic Analysis, National Bureau of
Economic Statistics of China, National Institute of Statistics, Italy, Refinitiv Datastream and Invesco
More sectors are at risk The colour coding in Figure 9 shows our attempt to isolate those sectors we believe
than could benefit most likely to be negatively or positively impacted by the economic dislocation from
Covid-19, either due to volumes (airlines, say) or prices (finance, say). On this basis,
more economic activity is likely to be negatively than positively impacted, which is no
surprise (most sectors are likely to suffer in some way, though perhaps less so).
Interestingly, the obvious casualties (airlines, hotels & catering and arts & entertainment)
But vulnerable industries
such as airlines are a are small within the context of the full economy. Nevertheless, companies in these
small part of the sectors will need a lot of support if they are to survive this downturn. Airlines are an
economy obvious example of where large government support may be needed (loans,
nationalisation) but equally critical will be attempts to help households and small
businesses such as restaurants, pubs and hairdressers.
How will GDP growth be In order to better understand what could happen to global GDP growth numbers, we
impacted? have run some simple simulations, based on assumptions about the quarter-by-quarter
impact. In all cases, the baseline is an assumed 3% growth rate in 2020 and 2021 (like
that of 2019). Also, all scenarios assume a 5% deficit in 2020 Q1 versus baseline, to
allow for the loss of GDP in China and the later impact in Italy.
March 2020 For professional/qualified/accredited investors only 9Global Market Strategy Office
The Big Picture
A scenario-based From there, the scenarios differ, as shown in Figure 10. The very worst-case scenario
approach assumes a sharp loss of activity during 2020 Q2, with a further loss (versus baseline) in
Q3, even though some recovery is implicit versus Q2. It is not until Q4 that GDP goes
above baseline, as the world attempts to make up for output that was lost during the
earlier part of the year. Though it is assumed lost output is recovered, it is also assumed
that productive capacity is damaged by the economic chaos brought by Covid-19 and
that global GDP will remain 2% below baseline over the coming years (“thereafter”).
Figure 10: Assumed variation versus baseline global GDP level forecast
2020 2020 2020 2020 2021 2021 Thereafter
Q1 Q2 Q3 Q4 Q1 Q2
Very Best -5% -15% 7% 10% 3% 0% 0%
Best -5% -20% 7% 10% 5% 3% -1%
Worst -5% -20% 0% 10% 10% 5% -2%
Very Worst -5% -25% -5% 10% 10% 10% -2%
Note: the baseline forecast is for 3% GDP growth in each year, with growth equally spread throughout the year.
The numbers in the table show the percentage variation in the level of GDP versus what would have been seen
in the baseline. These scenarios are for illustrative purposes only and are not forecasts. Source: Invesco
At the other extreme, the very best scenario assumes less of a loss during Q2 (15%) and
immediate recovery of lost output from Q3 onwards. It is also assumed there is no long-
term damage to the economy. This scenario effectively assumes that China represents
a good template for the rest of the world, with the virus brought under control within a few
months and economic activity returning to normal within 3-6 months (as now appears to
be slowly happening based on indicators such as coal consumption and steel output).
Figure 11 shows how these quarterly profiles translate into annual growth rates and the
At the very best 2020 results are interesting. First, the implied calendar year growth rates in 2020 range from
global GDP growth
2.3% in the very best case down to -3.4% in the very worst. However, 2021 sees a big
could be 2.3%; at the
very worst -3.4% but rebound in all cases but especially in the very worst case. This is important from a
with a big rebound financial market perspective, because no matter how bad things become in 2020, there
may be a return to strong growth rates in 2021. Indeed, we believe there is a good
chance that the worse it becomes this year, the stronger will be the growth next year.
Financial markets are likely to anticipate that rebound at some stage, in our opinion.
However, calendar year growth rates are of no interest to financial markets. What
Getting away from matters is what happens in the future. Such an approach requires us to look at growth
calendar year forecasts
looks better
starting in 2020 Q2 and this is what is done in the final three columns of Figure 11. The
assumed decline in global GDP during 2020 Q1 depresses the 2019/20 growth rate to
1.7% in all cases (from 2019 Q2 to 2020 Q1). Looking ahead, the 12-month growth
rates are not so dramatic, running from 1.8% in the very worst case to 5.7% in the very
best case (remembering that 3% is the baseline). By the end of our 12-month forecast
horizon, things could be feeling a lot better.
That sounds encouraging but several caveats are in order: first, these are simulations;
But the recovery may second, they all assume a “V” shaped recovery in economic activity, which may be too
not be “V” shaped
optimistic, especially if the virus re-emerges when lock-downs come to an end; finally,
feedback loops via the financial system could accentuate the downturn.
Figure 11: Summary of implied global GDP growth rates by scenario (%)
2019 2020 2021 2019/20 2020/21 2021/22
Very Best 3.0 2.3 4.5 1.7 5.7 1.7
Best 3.0 1.0 6.6 1.7 4.9 2.4
Worst 3.0 -0.8 9.8 1.7 4.4 2.6
Very Worst 3.0 -3.4 14.1 1.7 1.8 6.5
Note: these growth rates are based on the quarterly profiles shown in Figure 10. 2019/20, 2020/21, 2021/22
show the growth rates for the year starting 2019 Q2, 2020 Q2 and 2021 Q2, respectively. These scenarios are
for illustrative purposes only and are not forecasts. Source: Invesco
March 2020 For professional/qualified/accredited investors only 10Global Market Strategy Office
The Big Picture
Monitoring the situation
Watch profits and We always emphasise the cyclical importance of profits and investment. Unfortunately,
investment….
going into this crisis, both were showing signs of weakness (see Figure 12). We would
expect to see further weakening over the coming quarter or two but would look for
acceleration as a sign that the worst of the economic downturn is behind us.
Figure 12 – Global profit and investment growth (% y-o-y)
40 15
30
10
20
5
10
0 0
-10
-5
-20
-10
-30
-40 -15
Q1 1996 Q1 2000 Q1 2004 Q1 2008 Q1 2012 Q1 2016
World EPS (% yoy, USD) Gross fixed capital formation (PPP USD, % yoy, RHS)
Note: Quarterly data from 1996 Q2 to 2019 Q4. World EPS growth is based on the MSCI World Index (price
index and price/earnings ratios used). Gross fixed capital formation is taken from OECD national accounts data
aggregated across a sub-set of countries which have already reported 2019 Q4 data (Australia, Brazil, Canada,
India, Indonesia, Japan, Poland, South Korea, Sweden, Switzerland, Turkey, UK and US). As of 12 March
2020. Source: MSCI, OECD, Refinitiv Datastream and Invesco
Also, given the potential damage to the global trading system, we believe it would be
…and export growth useful to keep an eye on export developments. Figure 13 suggests that global export
growth was close to zero at the turn of the year (although there was a hint of an upturn in
year-on-year growth in December and January). We have no doubt this will now move
into negative territory and will be interested to see when there is a sign of improvement.
Figure 13 – Global exports (% y-o-y, measured in SDRs)
40
30
20
10
Freight indicators to the
fore 0
-10
-20
-30
1999 2001 2003 2005 2007 2009 2011 2013 2015 2017 2019
Total (% yoy) Sub-total (% yoy)
Note: the chart shows year-on-year growth in the aggregate of exports measured in SDRs (IMF Special
Drawing Rights) across a range of major economies (Australia, Brazil, Canada, China, Eurozone, India, Japan,
Mexico, Russia, South Korea, Sweden, Switzerland, Taiwan, UK and US) . “Total” is the aggregate across all
countries. “Sub-total” is measured over the subset of countries for which the latest month of data (January
2020) is available, with the historical data based only on those countries. Monthly data from January 2000 to
January 2020. Source: Refinitiv Datastream and Invesco.
The problem with the above indicators is that they are reported with a lag, so business
surveys and high frequency indicators are more likely to be used in the near term,
especially anything that reflects conditions in the freight business. One such commonly
used indicator is the Baltic Exchange Dry Index, which shows the cost of transporting
raw materials around the world.
March 2020 For professional/qualified/accredited investors only 11Global Market Strategy Office
The Big Picture
Baltic Dry and equities We are sceptical about the predictive power of the Baltic Dry index but Figure 14
during the GFC suggests it was at least a coincident indicator of equity market turning points during the
GFC. Even better, it seemed to bottom three months before the MSCI World index.
Figure 14 – The Baltic Exchange Dry Index and MSCI World (2005-2010)
12000 1800
10000 1600
8000 1400
6000 1200
4000 1000
2000 800
0 600
01/01/2005 01/07/2006 01/01/2008 01/07/2009
Baltic Exchange Dry Index MSCI World (RHS)
Note: the chart shows daily data from 1 January 2005 to 31 December 2010. Past performance is no guide to
future returns. Source: Refinitiv Datastream and Invesco.
The Baltic Dry led Admittedly, that relationship is at best loose (and most such indices were correlated
equities down this time during the GFC). However, there has been a similar correlation over the most recent
and has turned up five-year period, though the Baltic Dry index remains the more volatile of the two (see
Figure 15). Interestingly, the Baltic Dry index peaked in September 2019, since when it
has fallen 75%. It is inconceivable that it was predicting Covid-19 but it may have been
reacting to the weakness of global data as shown in Figures 12 and 13. Even more
intriguing, the Baltic Dry index seemed to bottom on 10 February 2020. Could that be a
sign of hope? It may be but we think it is too soon to know.
Figure 15 – The Baltic Exchange Dry Index and MSCI World (2015-2020)
2500
2400
2000
2200
1500
2000
1000
1800
500 1600
0 1400
01/01/2015 01/07/2016 01/01/2018 01/07/2019
Baltic Exchange Dry Index MSCI World (RHS)
Note: the chart shows daily data from 1 January 2015 to 17 March 2020. Past performance is no guide to
future returns. Source: Refinitiv Datastream and Invesco.
Otherwise, indicators that we are likely to monitor are monthly PMIs and business
surveys (with a focus on the ISM surveys in the US and the IFO survey in Germany);
weekly jobless claims data in the US (the labour market is a lagging indicator but it is one
of the more reliable high-frequency indicators, in our opinion); monthly US retail sales
and durable goods orders; monthly Chinese activity indicators (retail sales, industrial
production and investment spending); profit indicators from around the world and
bankruptcy data (Japan has a reasonably up to date series, for example). Given our
focus on profits, we shall also be watching industrial production data, as we have often
shown that production tends to lead profits by around six months.
March 2020 For professional/qualified/accredited investors only 12Global Market Strategy Office
The Big Picture
Are risky assets cheap?
Financial dislocation is The degree of dislocation in financial markets is shown by the Global Risk Appetite Cycle
clear Indicator (GRACI) provided by Invesco’s Investment Solutions team, as shown in Figure
16. This is a summary measure of the performance of riskier versus safer asset classes.
Figure 16 – Global risk appetite and the global business cycle
Note: monthly data from January 1992 to March 2020 (as of 15 March 2020). Both Global LEI (Leading
Economic Indicator) and GRACI (Global Risk Appetite Cycle Indicator) are provided by Invesco Investment
Solutions (IIS). Global LEI is a weighted average of leading indicators for 23 countries (both developed and
emerging). GRACI is a measure of relative risk-adjusted performance between riskier and safer asset classes
(it measures how much investors have been rewarded, on average, for taking an incremental unit of risk in
global financial markets on a trailing medium-term basis). A rising index signals improving market sentiment
and vice-versa. Past performance does not guarantee future results.
Source: Federal Reserve, BEA, Moody’s, Invesco Investment Solutions
Are low-yielding Valuations show a similar pattern, with the yield on “safer” fixed income assets at
perceived “safe” assets historical lows, while that on HY credit is close to historical norms and those on equity
really that safe? and real estate assets are above historical norms (see Figure 17, with full regional detail
in Appendix 1). Such valuation measures may not tell us much about the immediate
future, especially at a time of extreme economic uncertainty, but they do show that the
comparison across assets has become more extreme. Just as the Covid-19 outbreak
has shown the importance of safety cushions when valuing assets, the fact that yields on
“quality” government debt are at extreme lows just as government debt appears likely to
rise sharply may be a warning. Note that equity and real estate yields are well above
their regional government and IG counterparts.
Figure 17 – Global yields within historical ranges (%)
25
Average Now
20
15
10
5
0
Start dates are: cash 1/1/01; govt bonds 31/12/85; corp bonds 31/12/96; corp HY 31/12/97; equities 1/1/73;
REITs 18/2/05. See appendices for definitions, methodology and disclaimers. As of 12 March 2020.
Source: Refinitiv Datastream and Invesco
March 2020 For professional/qualified/accredited investors only 13Global Market Strategy Office
The Big Picture
US treasury yields have Figure 18 shows that US treasury yields have never plumbed the depths seen over
never been so low recent weeks, not during the Great Depression nor during WW2 when the Fed was
setting bond yields. This is not a good starting point, especially as returns over the
medium term are highly correlated to yield (and if held to maturity they are in line with the
yield to maturity at the time of purchase).
Figure 18 – US 10-year yields since 1790 (%)
16
14
12
10
8
6
4
2
0
Data is monthly, from December 1790 to March 2020 (as of 16 March 2020). Past performance is no guarantee
of future results. Source: Global Financial Data, Refinitiv Datastream and Invesco
And HY spreads are in At the same time, the yield on US HY credit has moved higher, thus causing the spread
recession territory versus treasury yields to rise to a level rarely seen outside of the GFC (see Figure 19).
As suggested by Figure 19, future returns on US HY are often at their highest when
spreads are at their widest (when nobody else is interested). The problem is that a deep
recession could push that spread even wider so that short-term losses may be incurred
before longer term gains are realised.
Figure 19 – The yield on US high-yield and future returns
24 2400
20 2000
16 1600
12 1200
8 800
4 400
0 0
-4 -400
86 88 90 92 94 96 98 00 02 04 06 08 10 12 14 16 18
US High Yield YTM (%) Total return over next 5 years (ann., %)
Spread vs treasuries (bps, RHS)
Note: based on monthly data from September 1986 to March 2020 (as of 16 March 2020). Based on the
BofAML US High Yield and US Treasury Indices. “Spread versus treasuries” is the yield on US High Yield
minus that on the US Treasury. “Total return” is the annualised five-year total return on the US High Yield
Index. Past performance is no guarantee of future results. Source: BofAML, Refinitiv Datastream and Invesco
As are EM spreads The same applies to EM government debt. As shown in Figure 20, the spread on USD
denominated EM debt versus US treasury yields is wider than at any point since 2003,
apart from during the GFC. In fact, Appendix 1 suggests that EM corporate bonds offer
a similarly generous spread versus those of the developed world. Most EM assets seem
to offer wider spreads than is usual versus developed markets.
March 2020 For professional/qualified/accredited investors only 14Global Market Strategy Office
The Big Picture
Figure 20 – EM hard currency government yield spread (%)
10
9
8
7
6
5
4
3
2
1
Feb-03 Feb-06 Feb-09 Feb-12 Feb-15 Feb-18
Note: Monthly data from February2003 March 2020 (as of 16 March 2020). Yield spread is the yield-to-worst on
the Bloomberg Barclays EM USD Aggregate 7-10 Year Index minus the yield on 10-year US treasury notes. Past
performance is no guarantee of future returns. Source: Barclays Bloomberg, Refinitiv Datastream and Invesco.
The Shiller PE is down a Not surprisingly, given the dramatic decline in prices, equity price-earnings (PE) ratios
lot but US equities are have collapsed. Of course, the problem is that prospective earnings are also collapsing,
not cheap making simple PE ratios next to useless. Therefore, we have always preferred some
form of cyclically adjusted PE (CAPE), where a 10-year moving average of earnings is
used to give a more stable denominator. Figure 21 shows that the Shiller PE for the US
market has fallen quite sharply, from a recent peak of 32 to 23 (as of 12 March 2020).
However, that is still quite elevated (the long-term average is 17) and from such starting
points, US equities have usually generated moderate returns over the next 10 years
(although in recent decades, those returns have at least been positive).
Figure 21 – S&P 500 Shiller PE and future returns (%)
50 -30
Shiller P/E Next 10y Returns (RHS, % Ann, Inverted)
40 -20
30 -10
20 0
10 10
0 20
1881 1901 1921 1941 1961 1981 2001
Monthly data from January 1881 to 12 March 2020. Past performance is no guide to future returns. See
appendices for definitions and disclaimers. Source: Robert Shiller and Invesco
However, other equity
The US market may not look cheap based on its CAPE but other equity regions do.
regions do look cheap Figure 22 shows that our CAPE ratios are at or very close to historical lows for all
regions except the US. With CAPEs falling toward 10 in some regions (notably EM), we
think equity markets are attractive on a long-term basis. However, we doubt that will
stop them getting cheaper over the coming months if there is a deep global recession.
But real estate looks As suggested later in the projected returns in Figure 31, we find real estate even more
even better attractive than equities in all scenarios except “very worst case”. This is because yields
on real estate (REITS) have risen dramatically over recent weeks, offering the chance of
attractive returns in all but the very worst outcomes (in our opinion).
March 2020 For professional/qualified/accredited investors only 15Global Market Strategy Office
The Big Picture
Figure 22 – Historical ranges for CAPEs
100
90 Average Now
80
70
60
50
40
30
20
10
0
Note: CAPE = Cyclically Adjusted Price/Earnings and uses a 10-year moving average of earnings. From 1983
(except for EM from 2005). As of 12 March 2020. Source: Refinitive Datastream and Invesco
A word about correlations
Portfolio diversification relies on imperfect correlations (the lower the better). During
times of stress, asset correlations often rise and that is now happening (see Figure 23).
The average pairwise correlation between global equities and other global assets has
Correlations are rising, gone from the lower end of the historical range (recent bottom of -0.15 on 21 February
making diversification
harder
2020) to the upper end (recent peak of 0.48 on 12 March 2020). Among the assets most
correlated to equities are REITS (recent correlation peak of 0.96), HY (0.92), and
commodities (0.90). Those assets consequently offer little in the way of diversification
versus equities (those correlations are not always positive).
Gold seems to have Figure 23 also shows the abrupt change in the correlation between equities and gold,
stopped being a from a recent low of -0.79 on 24 February 2020 to a recent high of 0.46 on 12 March
diversifier 2020. This suggests that gold has ceased to be the diversifier that we would normally
expect it to be. More hopeful is the fact the government bonds, IG credit and cash have
continued to have little (and frequently negative) correlation with equities, making them
better diversifiers, in our opinion. That said, in recent days the spectre of rising
government debt has pushed down those debt prices, with a knock-on effect on equities.
Figure 23 – 20-day correlations versus global equities
1.0
0.8
0.6
0.4
0.2
0.0
-0.2
-0.4
-0.6
-0.8
-1.0
2000 2002 2004 2006 2008 2010 2012 2014 2016 2018 2020
Gold Average
Note: Based on daily data from 1 January 2000 to 17 March 2020. Calculated as rolling correlations between
daily total returns on the Datastream World Index (equities) and other global asset groups. “Average” shows
the average pairwise correlation between equities and government debt (BoAML Global Government Bond
Index), IG (BoAML Global Corporate Index), HY (BoAML Global High Yield Index), Real Estate (FTSE EPRA
NAREIT Developed Index), Commodities (S&P GSCI Commodity Total Return Index), Gold (London Bullion
Market Spot Price) and Cash (BoAML 0-3 Month US Treasury Bill Index). All in US dollars. Past performance is
no guarantee of future returns. Source: BoAML, FTSE EPRA, S&P GSCI, Refinitive Datastream and Invesco
March 2020 For professional/qualified/accredited investors only 16Global Market Strategy Office
The Big Picture
Coronavirus scenarios for 2020
A scenario-based At this stage we usually talk about our projected returns and have just one scenario.
approach
However, given the uncertainty surrounding the Covid-19 outbreak, that is no longer
possible. We do not know how serious this will become nor the effect on the global
economy. Even worse, economic data flows have become harder to interpret and/or are
meaningless. For that reason, we now consider four scenarios along with our subjective
probabilities (Figure 24 shows the results, as of 12 March 2020, and Appendix 4 shows
the underlying assumptions):
• Very best case (5% probability): 2.0% global GDP growth in 2020 (versus our
The most optimistic
previous estimate of 3.0%). This assumes the global outbreak is contained as
scenario still implies only
2% global GDP growth
rapidly as in China and, with the onset of the Northern Hemisphere spring and
summer, the outbreak is well under control by mid-year. We believe this would
imply a short, sharp shock to the global economy, with quick recovery and little
effect on growth over the next year or so. This implies a slight worsening of our
12-month asset class assumptions about policy rates, yield curves, credit
spreads, default rates, commodity prices and equity/real estate yields/growth.
• Best case (45% probability): 1.0% global GDP growth in 2020. This assumes
A more realistic best a deeper Q2 slump in global GDP. Also, we allow for the potentially disruptive
case assumes 1% GDP
growth
financial effect of the sharp fall in the price of oil. Policy makers (central banks
and governments) are assumed to offset some of the short-term economic
consequences, providing lifelines to distressed corporates and households.
Though there is a GDP growth deficit in 2020, we assume that 2021 growth will
be boosted beyond the 3.0% we had originally expected. Effectively, this causes
displacement of some economic activity and profits from 2020 into 2021.
Though this causes us to downgrade our 12-month assumptions, we suppose
the worst of the impact on market risk-premia will be over within the 12-month
forecast period.
Recession is possible
(-1.0% GDP growth) • Worst case (45% probability): -1.0% global GDP growth in 2020. Covid-19
develops into a serious pandemic that is not halted by warming temperatures
and that proves difficult to control, with vaccines and cures not available until
2021. This could involve widespread loss of life and the closure of much
economic activity for a prolonged period, provoking global recession. Recovery
of lost output does not occur until the end of 2020 and into 2021.
• Very worst case (5% probability): this assumes a dramatic escalation of
A Spanish flu like Covid-19 to Spanish flu proportions. The World Bank estimated in 2014 that
scenario could see
-3.5% GDP growth and
such an outbreak could reduce global GDP by 5% and we assume a 2020
GFC conditions growth rate of -3.5% (versus the original +3%). The downturn could be
exacerbated by high debt ratios and the impotence of many central banks. Our
asset class assumptions for this scenario assume a return to GFC conditions.
Figure 24: Projected 12-month asset class total returns by global GDP scenario
60% GDP +2.0% GDP +1.0% GDP -1.0% GDP -3.5%
40%
20%
0%
-20%
-40%
-60%
Very Best Case (5%) Best Case (45%) Worst Case (45%) Very Worst Case (5%)
Cash Gold Govt Bonds Corp IG Corp HY Equities Real Estate Commodities
Notes: based on local currency returns. Figures in parenthesis are our subjective probabilities. GDP data
shows projected global GDP growth in 2020. Cash is an equally weighted mix of USD, EUR, GBP and JPY. As
of 16 March 2020. There is no guarantee that these views will come to pass. See Appendices for definitions,
methodology and disclaimers. Source: BAML, MSCI, GSCI, FTSE, Refinitiv Datastream and Invesco
March 2020 For professional/qualified/accredited investors only 17Global Market Strategy Office
The Big Picture
S&P 500 could fall to The 12-month projected returns shown in Figure 24 are based on an aggregation of
1400 in an extreme regional estimates. It is not surprising that the worst-case equity-like asset projections
scenario are quite dramatic (doubly so given they were based on closing prices on 16 March
2020, when markets plummeted). For example, they are consistent with an S&P 500 12-
month target of 1950 in a worst-case scenario and 1400 in a very worst-case outcome
(see Figure 25). We doubt these would represent the low point in equity markets and
other similar assets: it is our presumption that even under worst-case scenarios, markets
would be in recovery mode within a year.
Oil is already close to It is worth mentioning that the worst-case commodity downside is limited relative to that
our $20 downside target of equities because the oil price has already been depressed by the rise in Saudi output
and we view $20 as the downside 12m target. The strength of gold also plays a role.
Conversely, we expect healthy equity-like returns under the very best-case scenario,
though bear in mind the starting point is 16 March 2020. Commodities are expected to
be particularly rewarding, given that we imagine a rebound in the oil price (if only to $45).
Gold and sovereign debt Of course, the reverse is true for the more defensive assets: we expect gold to do better
expected to do the best under the worst-case scenarios than under the best case, though it is interesting that
in an extreme recession even gold has fallen during recent market turmoil. Sovereign debt returns are projected
to be modest under all scenarios because the yields have already fallen a great deal and
we see limited further downside. However, we see little prospect of huge losses on
sovereign debt, even in the best-case scenario. IG credit is expected to produce positive
returns in all but the worst of scenarios. Note that the projected cash returns are positive
but too small to be seen in Figure 24.
Figure 25 – Market forecasts by scenario
Current Very Very
(16/03/20) Best Best Worst Worst
Case Case Case Case
Central Bank Rates
US 0.25 0.50 0.25 0.00 0.00
Eurozone -0.50 -0.60 -0.70 -0.80 -1.00
China 4.35 4.00 3.75 3.50 2.50
Japan -0.10 -0.20 -0.30 -0.50 -0.70
UK 0.25 0.50 0.00 0.00 0.00
10y Bond Yields
US 0.73 1.50 0.00 0.00 0.50
Eurozone -0.46 -0.60 -1.00 -1.00 -1.00
China 2.74 3.00 2.75 2.50 2.50
Japan 0.01 0.00 -0.25 -0.30 -0.25
UK 0.44 0.50 -0.25 0.00 0.25
Exchange Rates/US$
EUR/USD 1.12 1.10 1.12 1.20 1.30
USD/CNY 6.99 7.30 7.10 7.20 7.50
USD/JPY 105.87 110.00 105.00 100.00 90.00
GBP/USD 1.23 1.25 1.25 1.25 1.20
USD/CHF 0.94 1.00 0.95 0.90 0.85
Equity Indices
S&P 500 2386 3000 2650 1950 1400
Euro Stoxx 50 2450 2900 2550 1950 1350
FTSE A50 12694 14700 12800 10800 7650
Nikkei 225 17002 25000 20000 16000 11000
FTSE 100 5151 7200 6000 4800 4300
Commodities (US$)
Brent/barrel 28 45 35 25 20
Gold/ounce 1502 1375 1550 1700 1750
Copper/tonne 5276 5800 5000 4000 3000
Notes: There is no guarantee that these views will come to pass. See Appendices for definitions,
methodology and disclaimers. Source: Refinitiv Datastream and Invesco
March 2020 For professional/qualified/accredited investors only 18You can also read