Iceland OECD Economic Surveys
←
→
Page content transcription
If your browser does not render page correctly, please read the page content below
OECD Economic Surveys

 Iceland
 OVERVIEW

http://www.oecd.org/economy/iceland-economic-snapshot/
This document, as well as any data and any map included herein, are without prejudice to the
status of or sovereignty over any territory, to the delimitation of international frontiers and
boundaries and to the name of any territory, city or area.

The statistical data for Israel are supplied by and under the responsibility of the relevant Israeli
authorities. The use of such data by the OECD is without prejudice to the status of the Golan
Heights, East Jerusalem and Israeli settlements in the West Bank under the terms of international
law.

OECD Economic Surveys: Iceland© OECD 2021

You can copy, download or print OECD content for your own use, and you can include excerpts
from OECD publications, databases and multimedia products in your own documents,
presentations, blogs, websites and teaching materials, provided that suitable acknowledgement
of OECD as source and copyright owner is given. All requests for public or commercial use and
translation rights should be submitted to rights@oecd.org. Requests for permission to photocopy
portions of this material for public or commercial use shall be addressed directly to the Copyright
Clearance Center (CCC) at info@copyright.com or the Centre français d’exploitation du droit de
copie (CFC) at contact@cfcopies.com.tatus of or sovereignty over any territory, to the
delimitation of international frontiers and boundaries and to the name of any territory, city or
area.
3 Table of contents Executive summary 8 1 Key policy insights 13 The economy is recovering 15 Monetary policy has been eased in response to the Covid-19 crisis 21 The financial system is considered to be sound but vigilance is warranted 23 Fiscal policy is supporting the economy 26 Policies to increase productivity and employment 33 References 42 FIGURES Figure 1. The economy plunged 9 Figure 2. Border restrictions hit the tourism sector hard 9 Figure 3. Barriers to entry are high 10 Figure 4. Innovation lags behind 11 Figure 5. PISA scores have trended down 11 Figure 6. Carbon emissions exceed the OECD average 11 Figure 1.1. The pandemic hit Iceland mildly 13 Figure 1.2. The economy suffered a large contraction, but policy support helped 14 Figure 1.3. Iceland’s economy is highly egalitarian 15 Figure 1.4. The economy is recovering 16 Figure 1.5. The labour market is stabilising 18 Figure 1.6. External positions have weakened 19 Figure 1.7. Services other than tourism are getting more important 20 Figure 1.8. Foreign tourism collapsed, while domestic travel compensated a bit 21 Figure 1.9. Monetary policy remains accommodative 22 Figure 1.10. Households benefitted more than firms from the easing of monetary conditions 24 Figure 1.11. The banking sector appears sound 25 Figure 1.12. Fiscal policy is supporting the economy 27 Figure 1.13. Adjustments will be required to stabilised the debt ratio over the longer run 28 Figure 1.14. Spending quality will improve as public investment is stepped up 29 Figure 1.15. Tax revenues declined 31 Figure 1.16. High marginal tax rates discourage second earners, often women 32 Figure 1.17. Competitiveness has improved but productivity growth is low in some sectors 34 Figure 1.18. Barriers are high for firms to enter the market 35 Figure 1.19. Regulation of professions is stringent 36 Figure 1.20. Basic skills are relatively weak 37 Figure 1.21. Vocational education and training needs strengthening 38 Figure 1.22. Corruption is perceived as low 40 TABLES Table 1. The economy is projected to accelerate 9 Table 1.1. Macroeconomic indicators and projections 17 Table 1.2. Events that could entail major changes to the outlook 17 Table 1.3. Past recommendations and actions taken in monetary, financial and fiscal policies 29 OECD ECONOMIC SURVEY: ICELAND 2021 © OECD 2021
4 Table 1.4. Potential impact of structural reforms on per capita income 33 Table 1.5. Past recommendations and actions taken to raise competitiveness and skills 39 Table 1.6. Findings and recommendations to foster a strong, resilient and inclusive recovery 41 OECD ECONOMIC SURVEY: ICELAND 2021 © OECD 2021
5 OECD ECONOMIC SURVEY: ICELAND 2021 © OECD 2021
6 This Survey is published on the responsibility of the Economic and Development Review Committee of the OECD, which is charged with the examination of the economic situation of member countries. The economic situation and policies of Iceland were reviewed by the Committee on 14 June 2021. The draft report was then revised in light of the discussion and given final approval as the agreed report of the whole Committee on 25 June 2021. The Secretariat’s draft report was prepared for the Committee by Hansjörg Blöchliger and Vassiliki Koutsogeorgopoulou, with inputs from Sigurður Jóhannesson and Marías Halldór Gestsson from the Institute of Economic Studies of the University of Iceland and Eunha Cho, consultant with the OECD Economics Department, under the supervision of Vincent Koen. Research assistance was provided by Natia Mosiashvili, and editorial support by Gemma Martinez and Sisse Nielsen.The previous Survey of Iceland was issued in September 2019. Information about the latest as well as previous Surveys and more details about how Surveys are prepared is available at www.oecd.org/eco/surveys OECD ECONOMIC SURVEY: ICELAND 2021 © OECD 2021
7 BASIC STATISTICS OF ICELAND, 2019* (Numbers in parentheses refer to the OECD average)** LAND, PEOPLE AND ELECTORAL CYCLE Population (million) 0.4 Population density per km² (2018) 3.5 (38.1) Under 15 (%) 19.6 (17.9) Life expectancy at birth (years, 2018) 82.9 (80.1) Over 65 (%) 15.2 (17.1) Men (2018) 81.3 (77.5) International migrant stock (% of population) 15.5 (13.3) Women (2018) 84.5 (82.8) Latest 5-year average growth (%) 2.0 (0.6) Latest general election June 2020 ECONOMY Gross domestic product (GDP) Value added shares (%) In current prices (billion USD) 24.8 Agriculture, forestry and fishing 4.9 (2.6) In current prices (billion ISK) 3 045.1 Industry including construction 21.7 (26.8) Latest 5-year average real growth (%) 4.4 (2.2) Services 73.4 (70.6) Per capita (000 USD PPP) 60.0 (48.3) Central bank policy interest rate (end-year) (%) 3.0 GENERAL GOVERNMENT (Per cent of GDP) Expenditure 43.4 (40.6) Gross financial debt (OECD: 2018) 61.5 (107.6) Revenue 41.9 (37.5) Net financial debt (OECD: 2018) 6.5 (67.8) EXTERNAL ACCOUNTS Exchange rate (ISK per USD) 122.61 Main exports (% of total merchandise exports) PPP exchange rate (USA = 1) 140.57 Food and live animals 44.7 In per cent of GDP Manufactured goods 37.3 Exports of goods and services 44.4 (54.2) Machinery and transport equipment 8.5 Imports of goods and services 39.3 (50.6) Main imports (% of total merchandise imports) Current account balance 6.4 (0.3) Machinery and transport equipment 33.6 Net international investment position 22.1 Manufactured goods 12.1 Miscellaneous manufactured articles 12.0 LABOUR MARKET, SKILLS AND INNOVATION Employment rate (aged 15 and over, %) 78.4 (57.6) Unemployment rate, LFS (aged 15 and over, %) 3.5 (5.4) Men 81.6 (65.6) Youth (aged 15-24, %) 8.7 (11.7) Women 75.0 (49.9) Long-term unemployed (1 year and over, %) 0.2 (1.4) Participation rate (aged 15 and over, %) 81.0 (61.1) Tertiary educational attainment (aged 25-64, %) 45.0 (38.0) Average hours worked per year 1,454 (1,726) Gross domestic expenditure on R&D (% of GDP, 2018) 2.0 (2.6) ENVIRONMENT Total primary energy supply per capita (toe) 16.8 (3.9) CO2 emissions from fuel combustion per capita (tonnes) 5.2 ( 8.3) Renewables (%) 90.1 (10.8) Water abstractions per capita (1 000 m³, 2014) 9.2 Exposure to air pollution (more than 10 μg/m³ of PM 2.5, % of population) 3.5 (61.7) Municipal waste per capita (tonnes, 2017, OECD: 2019) 0.7 (0.5) SOCIETY Income inequality (Gini coefficient, 2017, OECD: 2016) 0.250 (0.310) Education outcomes (PISA score, 2018) Relative poverty rate (%, 2017, OECD: 2016) 4.9 (11.4) Reading 474 (487) Median disposable household income (000 USD PPP, 2017, OECD: 2016) 34.7 (24.4) Mathematics 495 (489) Public and private spending (% of GDP) Science 475 (489) Health care 8.8 (8.8) Share of women in parliament (%) 38.1 (30.7) Pensions (2017) 7.1 (8.6) Net official development assistance (% of GNI, 2017) 0.3 (0.4) Education (% of GNI, 2018) 7.4 (4.5) * The year is indicated in parenthesis if it deviates from the year in the main title of this table. ** Where the OECD aggregate is not provided in the source database, a simple OECD average of latest available data is calculated where data exist for at least 80% of member countries. Source: Calculations based on data extracted from databases of the following organisations: OECD, International Energy Agency, International Labour Organisation, International Monetary Fund, United Nations, World Bank. OECD ECONOMIC SURVEY: ICELAND 2021 © OECD 2021
8 Executive summary OECD ECONOMIC SURVEY: ICELAND 2021 © OECD 2021
9 Iceland stands up after a deep fall Domestic tourism has only partly replaced foreign travellers. In 2020, pandemic-related After a deep contraction, the economy is travel restrictions reduced foreign arrivals to recovering from the COVID-19 pandemic on around a fourth of the previous year (Figure 2). the back of robust export growth. To a limited extent, this sharp decline was offset The health situation is under control, and new by Icelanders travelling in their own country. infections are rare. All domestic restrictions were lifted end of June. Vaccination is Figure 2. Border restrictions hit the tourism progressing rapidly. sector hard The government extended most support Persons % of GDP programmes until end-2021. It also set up a Tourism's direct contribution to GDP (%) 3 500 000 9 five-year programme to invest in infrastructure, Total number of passengers 8 digitalisation and research and innovation 3 000 000 7 accounting for 0.5% of GDP per year. 2 500 000 6 Following a 6.6% contraction in 2020, the 2 000 000 5 economy is expected to grow by 2.8% in 2021 1 500 000 4 and 4.5% in 2022 (Figure 1,Table 1), driven by 3 a rebound of tourism, a successful 1 000 000 2 vaccination programme and the lifting of 500 000 1 restrictions. Unemployment will edge down to 0 0 around 7% in 2022 on the back of accelerating 2010 2011 2012 2013 2014 2015 2016 2017 2018 2019 2020 growth. Note: Passengers who go through security at Keflavík Airport. Source: Statistics Iceland. Figure 1. The economy plunged StatLink 2 https://stat.link/n8bvat GDP decline in 2020 Table 1. The economy is projected to % 0 accelerate -2 2019 2020 2021 2022 Projections -4 Percentage changes, volume (2005 prices) -6 GDP at market prices 2.6 - 6.6 2.8 4.7 Private consumption 1.9 - 3.3 2.1 4.9 -8 Gross fixed capital - 3.7 - 6.8 8.0 3.4 formation -10 Exports - 4.6 - 30.5 6.5 12.0 Imports - 9.3 - 22.0 8.2 8.2 -12 Consumer price index 3.0 2.8 4.1 2.5 ITA FIN GRC ISL NOR CZE CAN ESP GBR FRA DEU HUN NLD USA LVA DNK CHE LTU PRT AUT SVN SVK BEL POL EST OECD Unemployment rate 3.9 6.4 8.0 7.6 Source: OECD, National Accounts database. Budget balance (% of - 1.5 - 7.3 - 10.3 - 7.1 GDP) StatLink 2 https://stat.link/5zd74v Current account (% of 6.4 1.0 -1.0 0.0 GDP) Non-tourism exports are on the rise. Intellectual property services now account for Source: OECD, Economic Outlook No. 109. around 15% of service exports. Data processing and storage are growing rapidly, attracted by low energy prices and a cool and windy climate. OECD ECONOMIC SURVEY: ICELAND 2021 © OECD 2021
10 Monetary and fiscal policies are shortly after the 2008/09 crisis were exhausted by the late 2010s. accommodative Stringent regulation stifles competition. The Notwithstanding the recent interest rate hike, state sector is small and well run, but barriers to monetary policy remains accommodative. entry facing domestic and foreign firms are high Fiscal policy continues to support (Figure 3), hampering competition. households and firms. Administrative burdens and an extensive Monetary policy has been eased in response licensing and permit system protect incumbents to the crisis and remains appropriately and slow new and innovative start-ups. accommodative. Between March and November 2020 the central bank reduced its key Figure 3. Barriers to entry are high interest rate by 2 percentage points to 0.75%. As PMR gap with OECD average, 2018 inflation and short-term inflation expectations have risen above the target, the bank raised the Administrative requirements for interest rate again to 1% in May. new firms Barriers in network sectors The easing monetary conditions have helped Barriers in services sectors households more than firms. Mortgage credit rose in 2020, and real estate market activity and Barriers to FDI house prices rose. Yet corporate lending Licenses and permits stagnated, despite measures to ease access to Barriers to trade facilitation credit, with liquidity constraints a concern especially for the tourism sector. Tariff barriers Treatment of foreign suppliers Fiscal policy is supporting the economy. The budget deficit widened to 7.3% of GDP in 2020. -0.4 -0.2 0 0.2 0.4 0.6 0.8 1 Less stringent More stringent Parliament suspended the fiscal rule and the rolling five-year fiscal plan it approved in late Note: Positive values mean more stringent regulation than the 2020 as well as the one it endorsed in Spring OECD average, negative values less stringent regulation. Source: OECD, Product Market Regulation database. 2021 aim to support the economy in the short term and to reach a positive primary balance by StatLink 2 https://stat.link/5qjs8n 2025, when gross public debt according to the National Accounts is set to stabilise at 100% of Iceland has untapped innovation potential GDP. (Figure 4). More effective support for business R&D would unlock private investment and Tax reforms help low-income households and improve the ability of smaller firms to innovate. the environment. The third and last stage of an Encouraging firms to adopt digital technologies income tax reform reduced tax rates by up to 8 would help Iceland to make the most of percentage points. Environmentally-friendly innovation niches, with productivity gains. The transport modes receive temporary VAT reliefs. public sector too could become more digitalised with positive societal impact. Skills for the digital era and strong knowledge exchange through Regulation should be eased and closer business-research collaboration on skills improved innovation and international cooperation in Regulatory barriers are stringent, slowing research are essential for stronger innovation. innovation and the entry of new firms. At the same time, skills gaps need to be addressed. Productivity has recently accelerated but has overall remained sluggish over the past decade. The competitiveness gains built up OECD ECONOMIC SURVEY: ICELAND 2021 © OECD 2021
11 Figure 4. Innovation lags behind Vocational education and training is Innovation outcomes in international comparison underdeveloped. Participation is lower than in any European country and limited to traditional Iceland OECD Nordics EU27 Top 5 technical and crafts professions. School-based and work-based learning are weakly integrated, High-technology exports 100 and there are only few pathways to higher 80 Innovative firms 60 Triadic patent families education. per GDP (USD PP) 40 20 Addressing climate change 0 Top 10% most-cited documents in computer Trademarks abroad Iceland has committed to reduce carbon per GDP (USD PP) science emissions substantially over the coming decade. It should do so in a sustainable, cost- ICT-trademarks ICT-patents efficient and inclusive manner. Note: Higher values reflect better outcomes. More information is Iceland’s per capita carbon emissions exceed given in chapter 2. the OECD average, partly because of Source: World Bank, World Development Indicators; OECD, Main Science and Technology Indicators; OECD, Information and industry’s reliance on low energy generation Communication Technology; OECD, Education at a Glance cost (Figure 6). The government committed to database; and Global Innovation Index 2020. reduce emissions from their 2005 level by at least StatLink 2 https://stat.link/qrl1tk 40% by 2030. The quality of primary and secondary Iceland’s climate policy should rely on education is declining, although the system effective carbon pricing, complemented by is remarkably equitable. PISA scores are investment in low-carbon infrastructure, trending down (Figure 5), as teacher targeted spending on green research and qualifications fail to keep up with requirements, development, and well-designed and teacher salaries provide few rewards for environmental regulation. To ease the experience and excellence. transition, the country should remove barriers for new and innovative firms and foster the creation Figure 5. PISA scores have trended down of green jobs and skills. 510 To garner political support and make the low- carbon transition beneficial for all, proceeds 500 from carbon pricing could be redistributed to households and firms, at least partly. 490 Figure 6. Carbon emissions exceed the OECD 480 average 470 Total greenhouse gas emissions per capita Science Kg per capita Iceland OECD Reading 460 Mathematics 20 18 450 16 PISA 2006 PISA 2009 PISA 2012 PISA 2015 PISA 2018 14 Source: OECD, PISA 2018 database. 12 10 StatLink 2 https://stat.link/fslj4b 8 Tertiary education induces skills mismatch. 6 4 Links between universities and the labour market 2 are weak. Funding levers make it attractive for 0 universities to focus on enrolment rather than performance. Collaboration between research Source: OECD Green Growth Indicators. institutions and firms is improving, however. StatLink 2 https://stat.link/oyxelq OECD ECONOMIC SURVEY: ICELAND 2021 © OECD 2021
12 MAIN FINDINGS KEY RECOMMENDATIONS Policies to support the recovery Inflation and short-term inflation expectations are above target. Keep monetary policy accommodative, but stand ready to tighten further if long-term inflation expectations risk becoming unanchored. The merger of the Central Bank and Financial Supervisory Authority is Remain vigilant to maintain a sound and resilient financial system. expected to strengthen the overall surveillance of the financial system. Fiscal policy is supporting the economy. Continue supporting the economy and start fiscal consolidation as planned once the recovery is firmly established. Barriers to the entry of new firms are high. Reduce barriers to sound competition in the tourism and construction sectors. Facilitate access to professions by easing stringent occupational licensing. Skills mismatch is high. Labour shortages have intensified in some Continue and extend the training programme for professions in short sectors, slowing reallocation. supply. Strengthen vocational education and training (VET) by extending work- based learning and by facilitating access to tertiary education for VET graduates. Strengthen the link between tertiary education and the labour market, by linking part of university funding to labour market needs. Promoting innovation Business R&D intensity does not match the rapid increase in tax support Ensure that R&D tax-incentives better target smaller innovative firms. for R&D in recent years and innovation outcomes of smaller firms, which are the main beneficiaries of such support, are relatively weak. Venture capital, an important source of financing for young and innovative Ensure that the new publicly-owned venture capital fund invests in firms without collateral, is not yet well developed. privately-owned venture capital funds with large potential to promote start-ups and innovation companies. The tertiary system does not provide sufficiently broad skills. Increase the provision of vocational education programmes at the tertiary level and of entrepreneurship programmes. Collaboration between research institutions and the business sector is Introduce carefully-designed policy initiatives to encourage business- weak, limiting knowledge transfer. research collaboration on innovation, including specific programmes that connect smaller firms with researchers. Addressing climate change Climate policies lack prioritisation and sequencing and rely mostly on Develop a consistent climate policy framework to guide scope, technical measures. priorities, and sequencing of actions and measures. Geothermal energy, waste management and agriculture are not subject Submit all sectors to carbon pricing, taking into account interactions to carbon pricing. between carbon taxes and emissions trading systems. There is room for further investment in low-carbon infrastructure. Step up spending on low-carbon transport infrastructure, energy transition and the digital transformation. OECD ECONOMIC SURVEY: ICELAND 2021 © OECD 2021
13 1 Key policy insights Iceland is recovering from a comparatively mild COVID-19 health crisis. The number of victims and the stress on the health system have remained low. A smart testing and tracking strategy helped the authorities to identify infections early and to implement targeted health measures. Containment was short and less restrictive than in many other countries, and all domestic restrictions were lifted at the end of June 2021 (Figure 1.1). Preschools and primary schools operated almost without interruption, while remote learning became more widespread at secondary and tertiary level. International borders remained open to the Schengen area, with the rules on testing and quarantining gradually being eased since spring 2021. Vaccination is progressing fast, with all people over 16 years old planned to get at least one dose by early summer. Figure 1.1. The pandemic hit Iceland mildly A. Covid-19 incidence B. Stringency of public health measures New cases 7-day moving average 45 90 ISL OECD ISL OECD 40 80 35 70 30 60 25 50 20 40 15 30 10 20 5 10 0 0 Jul-20 Jul-21 Jan-20 Mar-20 Nov-20 Jan-21 Mar-21 May-20 Sep-20 May-21 Jul-20 Jul-21 Jan-20 Mar-20 May-20 Nov-20 Jan-21 Mar-21 May-21 Sep-20 Source: Oxford University; Our World in Data, as of 5 July 2021. StatLink 2 https://stat.link/vq0ao2 The economic impact of the pandemic was severe but contained by policy action (Figure 1.2). Following widespread lockdowns and travel restrictions worldwide, foreign tourism collapsed, with only around a fourth of foreigners arriving in 2020 compared to the previous year. Icelanders, unable to travel abroad, visited their own country, but this made up only a part of lost revenues. Like in other countries, the government promptly took a range of measures to help the ailing economy, notably with a short-term work scheme to support households and firms (Box 1.1). The central bank’s interest rate cuts and liquidity assistance helped to preserve financial stability. Thanks to these measures, total domestic demand declined by 1.3% only. The economy plunged by 6.6% in 2020, still considerable but less than at the time of the global financial crisis. OECD ECONOMIC SURVEY : ICELAND 2021 © OECD 2021
14 Figure 1.2. The economy suffered a large contraction, but policy support helped A. GDP decline, 2020 B. Discretionary fiscal measures, % of 2020 2020-21 % GDP 0 30 -2 25 -4 20 -6 15 -8 10 -10 5 -12 0 ITA FIN ISL ESP GBR GRC FRA PRT AUT CZE SVN CAN DEU HUN SVK NLD LVA USA DNK CHE LTU NOR BEL POL EST NZL OECD FIN ISL ITA GBR SGP JPN ESP NOR USA CAN DEU FRA CHE CZE DNK NLD NZL BEL SWE Source: OECD, National Accounts database; and IMF, Fiscal Monitor Database of Country Fiscal Measures in Response to the COVID-19 Pandemic. StatLink 2 https://stat.link/ld5e0n The dramatic unfolding of the pandemic overshadowed deeper structural shifts in Iceland’s economy. Tourism, whose breakneck growth drove the recovery after the 2008/09 financial crisis, peaked already in 2018, and the country’s second airline became insolvent in 2019. While tourism might grow less in the medium term, other sectors are taking its place as growth engines. The pharmaceutical industry continues to develop rapidly, and digital service exports such as data processing and storage are booming, benefitting from Iceland’s low energy prices and cool and windy climate. Fisheries are climbing up the value chain with fresh seafood and aquaculture rising. Innovative carbon capture technologies help reduce carbon emissions and can provide export income. Yet, structural change is slowed by a lack of relevant skills and overly stringent regulation. Box 1.1. Government measures have helped households and firms through the pandemic Mid-March 2020, soon after putting in place the first containment measures, the government adopted a support programme to avoid a meltdown of business and household income. The programme was broadened in April and extended in November, with some measures planned to expire mid-2021. It first focused on immediate financial support to households and firms and the health care system and then gradually shifted towards encouraging public and private investment to support the recovery and long- term growth. The most significant measures included a short-term work scheme; additional child and family benefits; households allowed to draw on third-pillar pension savings; special support for vulnerable groups; and the deferral of income and value-added tax payments of up to a year. Businesses whose revenues fell by more than 40% received financial relief, with the severely hit tourism and aviation industry getting special help. Discretionary fiscal measures amounted to around 9% of 2020 GDP in 2020-21, while the automatic stabilisers (declining tax revenues, unemployment benefits) contributed another 8%. The government also embarked on a five-year investment programme focussing on infrastructure, research and development of around 0.5% of GDP annually. The government issued few guarantees, helping to keep contingent liabilities under control. Source: OECD COVID-19 policy response tracker database OECD ECONOMIC SURVEY : ICELAND 2021 © OECD 2021
15 Iceland remains one of the most egalitarian economies of the OECD thanks to high labour force participation of both men and women and a compressed wage distribution (Figure 1.3). After the global financial crisis, lower incomes grew faster than those at the top, making Iceland even more egalitarian. The social welfare system including pensions is well targeted, reducing inequality further. Access to education and health care is universal, and socio-economic status appears to have a weaker influence on education or health outcomes than in most other OECD countries. An area where Iceland is actually the most unequal OECD country is the gap in hours worked between men and women (Figure 1.16). As a result, the gender wage gap is only little below the OECD average. Figure 1.3. Iceland’s economy is highly egalitarian A. Gini coefficient, 2005-2017 B. Gini coefficient, European OECD countries 2018 or latest year available % % 32 60 After taxes and transfers Before taxes and transfers 30 50 28 40 26 30 24 20 22 10 20 0 2005 2007 2009 2011 2013 2015 2017 FIN ISL ITA CZE SVN NLD IRL FRA LUX LVA BEL AUT EST PRT SVK DNK NOR HUN DEU GRC SWE POL ESP OECD Note: Gini coefficient after taxes and transfers for the 18-64 year olds. Latest data for Iceland refer to 2017. Source: OECD, Income Distribution and Poverty database. StatLink 2 https://stat.link/8m1lc3 Against this background, the Survey’s key messages are: Support a resilient, inclusive and sustainable recovery, and start fiscal consolidation as planned once the recovery is firmly established. Foster a business-friendly regulatory framework, improve skills and spur innovation by offering well-targeted support for business R&D and promoting e-government. Move towards a low-carbon economy, by pricing carbon emissions efficiently, investing in low- carbon infrastructure and fostering research and innovation in green technologies. The economy is recovering The economy is recovering (Figure 1.4). Tourism is rebounding, following the easing of the rules on testing and quarantining. Fisheries’ exports remain strong, especially of higher-value fresh seafood and aquaculture. Some sectors such as pharmaceuticals and data storage and processing, continue growing fast. Business investment is benefitting from pent-up demand and a five-year government investment programme. Monetary and fiscal policy provide support to businesses. Household consumption remains robust based on growing wages, regained confidence and the drawing down of savings accumulated during the pandemic. Headline inflation is creeping up as wages and oil prices are rising, and policy remains accommodative. OECD ECONOMIC SURVEY : ICELAND 2021 © OECD 2021
16 Figure 1.4. The economy is recovering Y-o-y % Y-o-y % B.GDP components A. Real GDP change change 15 60 10 40 5 20 0 0 -5 -20 -10 -40 Iceland Private final consumption expenditure -15 OECD -60 Investment United Kingdom Exports of goods and services -20 -80 Average Nordics -25 -100 2006 2008 2010 2012 2014 2016 2018 2020 2006 2008 2010 2012 2014 2016 2018 2020 Y-o-y % C. Consumer price index D. 10-year government bond yields change % 25 16 14 Iceland 20 Iceland 12 Euro Area Euro Area United Kingdom 15 United Kingdom 10 United States 8 10 6 5 4 2 0 0 -5 -2 2005 2007 2009 2011 2013 2015 2017 2019 2021 2006 2008 2010 2012 2014 2016 2018 2020 E. Insolvencies F. Investment composition % of GDP 70 2019 2020 30 60 25 Private non-residential Public 50 Housing 20 40 15 30 10 20 5 10 0 0 Jan Feb Mar Apr May Jun Jul Aug Sep Oct Nov Dec 2005 2007 2009 2011 2013 2015 2017 2019 2020 Source: OECD, National Accounts database; OECD, Main Economic Indicators; and Statistics Iceland. StatLink 2 https://stat.link/ebuhvc OECD ECONOMIC SURVEY : ICELAND 2021 © OECD 2021
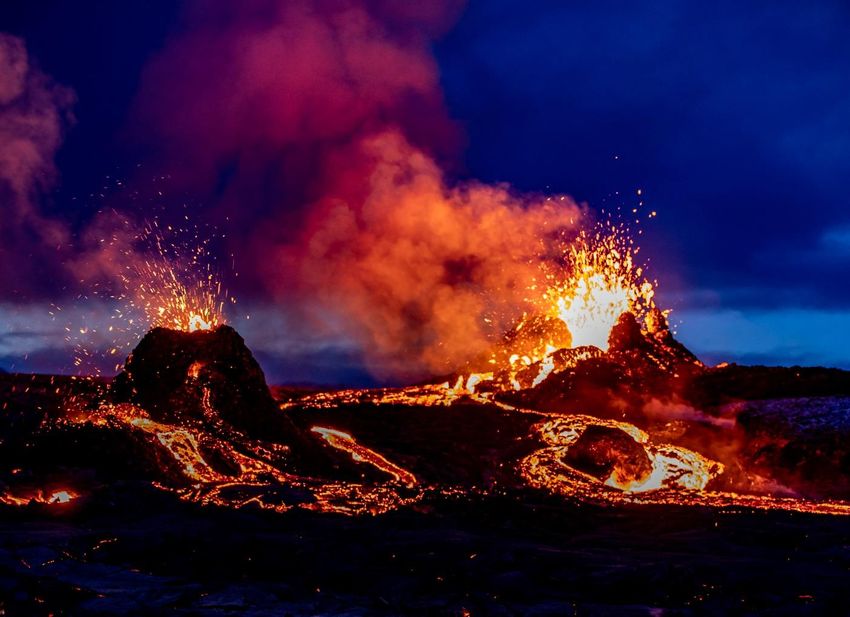
17 After the contraction in 2020, momentum is gradually returning. While the health situation seems under control and confidence has rebounded, tourism continues to suffer from the impact of the pandemic. The short-term work scheme was terminated in mid-2021, while most other policy support measures introduced at the onset of the crisis have been extended until end-2021. The government’s investment programme is expected to continue to support business investment and long-term growth beyond that date. GDP is set to grow by around 3% in 2021 and 4% in 2022 (Table 1.1). Projections are subject to substantial uncertainty and risks. The recovery of the tourism sector relies strongly on foreign arrivals and hence on economic and health conditions overseas. The economy may further face unforeseen events, including supply shocks such as the disappearance of a specific fish stock or a disruption to international travel links due to a volcanic eruption (Table 1.2). Brexit may negatively affect Iceland’s economy notwithstanding the recently announced trade agreement with the United Kingdom. There are also upside risks, however: a faster than planned vaccination overseas could give a stronger boost to travel and tourism. Table 1.1. Macroeconomic indicators and projections 2017 2018 2019 2020 2021 2022 Current Projections prices (ISK billion) Percentage changes, volume (2015 prices) GDP at market prices 2 642.0 4.7 2.6 - 6.6 2.8 4.7 Private consumption 1 323.5 4.8 1.9 - 3.3 2.1 4.9 Government consumption 625.5 4.7 3.9 3.1 2.2 0.9 Gross fixed capital formation 575.2 1.2 - 3.7 - 6.8 8.0 3.4 Final domestic demand 2 524.3 3.9 1.1 - 2.5 3.4 3.5 Stockbuilding1 - 0.8 0.2 - 0.5 1.2 0.0 0.0 Total domestic demand 2 523.5 4.2 0.3 - 1.3 3.4 3.5 Exports of goods and services 1 208.2 1.7 - 4.6 - 30.5 6.5 12.0 Imports of goods and services 1 089.7 0.5 - 9.3 - 22.0 8.2 8.2 Net exports1 118.5 0.6 1.9 - 4.9 - 0.6 1.2 Memorandum items GDP deflator _ 2.7 4.5 3.4 2.3 2.7 Consumer price index _ 2.7 3.0 2.8 4.1 2.5 Core inflation index2 _ 2.5 2.9 2.9 3.7 2.4 Unemployment rate (% of labour force) _ 3.1 3.9 6.4 8.0 7.6 General government financial balance (% of GDP) _ 0.9 - 1.5 - 7.3 - 10.3 - 7.1 General government gross debt (% of GDP)³ _ 60.4 61.5 69.1 78.7 84.0 Current account balance (% of GDP) _ 3.8 6.4 1.0 -1.0 0.0 1. Contributions to changes in real GDP, actual amount in the first column. 2. Consumer price index excluding food and energy. 3. Unlike in some other OECD countries, this includes unfunded liabilities of government employee pension plans. Source: OECD Economic Outlook database No. 109. Table 1.2. Events that could entail major changes to the outlook Shock Potential impact New or extended travel restrictions for foreign tourists related to Economic growth and the recovery of employment would suffer. renewed COVID-19 outbreaks Disappearance of fishing stock Export revenues would fall. Large-scale volcanic eruption International and domestic transport links could be disrupted, hampering some economic activities. OECD ECONOMIC SURVEY : ICELAND 2021 © OECD 2021
18 The labour market is stabilising (Figure 1.5). Unemployment, which peaked at over 8% of the labour force in late 2020, is receding fast. Labour participation is rebounding after falling to a historical low. The short- term work scheme helped avoid an unemployment surge during the first wave in spring 2020. Unemployment rates for both men and women have remained almost identical throughout the crisis. Notwithstanding the uptick in early 2021, youth unemployment is evolving in line with general unemployment, suggesting that labour market developments have not disproportionally hit the young. Rising student numbers suggest that part of the rise in youth unemployment is being absorbed by the education system. Immigration has declined sharply, while emigration also slowed as the employment outlook is hardly better abroad. Figure 1.5. The labour market is stabilising A. Labour market B. Short-term work and unemployment¹ % of labour % of working-age % force, s.a. population 10 88 20 9 18 Unemployed 87 Working short-term 8 16 7 86 14 6 85 12 Financial crisis peak (9.3%) 5 10 4 84 8 3 83 6 2 ←Unemployment rate 4 82 1 Labour force participation rate → 2 0 81 0 2004 2006 2008 2010 2012 2014 2016 2018 2020 2021Q1 Jan-19 May-19 Sep-19 Jan-20 May-20 Sep-20 Jan-21 May-21 C. Unemployment by age and gender D. Migration % of labour 4-quarter moving average force, s.a. Persons Immigration Emigration Women Men 16 000 20 Youth Overall unemployment 18 14 000 16 12 000 14 10 000 12 10 8 000 8 6 000 6 4 000 4 2 2 000 0 0 2021Q1 2003 2005 2007 2009 2011 2013 2015 2017 2019 2000 2002 2004 2006 2008 2010 2012 2014 2016 2018 2020 Note: 1. Data refer to unemployment as registered by Directorate of Labour, as opposed to the Labour Force Survey data show in Panels A and C. Source: Ministry of Finance; and Statistics Iceland. StatLink 2 https://stat.link/ivoqbd OECD ECONOMIC SURVEY : ICELAND 2021 © OECD 2021
19 The pandemic is exacerbating labour market imbalances. Iceland’s labour market is open and flexible, facilitating reallocation. Even so, unemployment remains high in the tourism and associated service sectors, while qualified labour has become scarcer in some technical and digital sectors. To underpin reallocation, the government set up a vocational training programme for professions in short supply, especially technicians, crafts and trade, and health care workers. The government also plans to ease access to work permits for high-skilled workers from outside the European Economic Area, to ease labour shortages. The training programmes should be extended, to prepare workers for jobs in areas with high demand. The external position has been affected by the collapse of foreign tourism, Iceland’s largest pre-COVID- 19 export sector (Figure 1.6). The current account surplus shrank but remained positive, especially as lower imports – notably Icelanders travelling abroad – partly compensated for the loss of foreign tourism revenue. As one of only few OECD countries, foreign direct investment (FDI) flows turned negative over the past few years, and this trend might have accelerated following the pandemic. The net investment position improved, however, reflecting valuation gains on assets held overseas. Overall, openness continues to decline and remains low in view of the country’s small size. Against this background, Iceland should ease restrictions for foreign capital, to fund investments in new and growing sectors and in climate action. Figure 1.6. External positions have weakened A. Current account balance B. Trade openness % of GDP % of GDP 10 60 5 50 0 40 -5 30 -10 20 -15 -20 10 -25 0 2000 2002 2004 2006 2008 2010 2012 2014 2016 2018 2020 2000 2002 2004 2006 2008 2010 2012 2014 2016 2018 2020 C. Sectoral composition of exports D. Total FDI inflows Million ISK, nominal Share of GDP, average 2017-2019 Fisheries Alumnium % of GDP 32 1 600 000 8 Other industrial products Other Tourism 1 400 000 6 1 200 000 4 1 000 000 2 800 000 600 000 0 400 000 -2 200 000 -41 -4 ISL ITA FIN LUX CHE DNK FRA DEU LTU ESP LVA SVK HUN PRT CZE NLD IRL NOR NZL AUT GRC BEL POL SVN GBR EST SWE OECD 0 2017 2018 2019 2020 Note: Panel B: Trade openness is measured as the average of goods and services imports and exports divided by GDP. Source: OECD, Balance of Payments database; OECD, National Accounts database; Ministry of Finance; and OECD, FDI Statistics. StatLink 2 https://stat.link/4r6myp OECD ECONOMIC SURVEY : ICELAND 2021 © OECD 2021
20 The composition of exports has changed in recent years, even before the pandemic, which abruptly reduced the share of tourism (Figure 1.7). The share of intellectual property services, especially those related to licenses of the pharmaceutical industry, has risen. The energy-intensive data processing and storage industry is assumed to make up around 2% of GDP and seems to have grown rapidly as well, attracted by low energy prices and a cool and windy climate (Adalbjornsson, 2019[1]). Further expansion is hampered by Iceland’s remote position and capacity constraints, with only three submarine data cables linking the island to Europe and North America. Increasing transmission capacity of the existing cables or investing in new cables as planned could strengthen competition and raise export revenues. Figure 1.7. Services other than tourism are getting more important A. Exports of goods and services by sector B. Exports by partners 2009 (inner ring), 2019 (outer ring) 2000 (inner ring), 2019 (outer ring) China, 2.5 Marine products, Other , 23.2 USA, 7.3 19.3 Rest of Europe, 5.5 Netherlands, 26.3 0.6 7.7 12.4 23.2 26.4 Portugal, 1.8 Poland, 2.1 6.1 4.5 Denmark, 2.3 5.7 0.3 Norway, 3.9 4.2 19.6 19.3 4.0 21.8 Aluminium 4.6 and aluminum Germany, 5.9 16.4 products, 15.7 9.0 United Kingdom, 10.4 Revenues of foreign France, 7.1 travellers, 34.8 Other manufacturing products, 7.1 Spain, 9.5 C. Foreign value added share of gross exports, 2016 D. Tech and pharma now account for over half of services Share in service exports, %, exports % 2020Q2-2020Q4 80 30 Pharmaceutical companies prominent. 70 25 20% 19% 60 20 18% 18% 15 13% 50 11% 40 10 5 30 0 Tourism Other Transport (excluding Telecommunication, business use of intellectual 20 information services services Charges for the Other transport by air) computer and property passanger 10 0 FIN IRL ITA LTU ISL LUX DNK SVK HUN CZE NLD DEU NZL EST SVN BEL PRT POL AUT CHE FRA ESP GRC LVA SWE GBR NOR Source: Statistics Iceland; UN Comtrade, International Trade Statistics database; OECD, Trade in Value Added database; and Ministry of Finance. StatLink 2 https://stat.link/reafp7 Growing domestic tourism helped offset the collapse of foreign tourism a bit. Foreign tourism started to cool in 2019 following slowing demand overseas and the insolvency of WOW Air. In 2020, the pandemic reduced foreign arrivals to around a fourth of the previous year. In turn, Icelanders almost doubled domestic trips, cushioning the blow to other services such as accommodation, restaurants and cultural activities OECD ECONOMIC SURVEY : ICELAND 2021 © OECD 2021
21 (Figure 1.8). In addition, since travelling abroad makes up a higher share of imports than in most other OECD countries, its sharp fall made up for some of the losses stemming from the lack of foreign tourists. Figure 1.8. Foreign tourism collapsed, while domestic travel compensated a bit A. Tourism Million nights B. Overnight stays Persons % of GDP Tourism's direct contribution to GDP (%) 3 500 000 9 8 Total number of passengers Icelanders 8 7 3 000 000 Foreigners 7 6 2 500 000 6 5 2 000 000 5 4 1 500 000 4 3 3 1 000 000 2 2 500 000 1 1 0 0 0 2010 2011 2012 2013 2014 2015 2016 2017 2018 2019 2020 2010 2011 2012 2013 2014 2015 2016 2017 2018 2019 2020 Note: Passengers who go through security at Keflavík Airport, including foreigners residing in Iceland, foreign labour leaving the country and transit passengers who go through security. Source: Statistics Iceland. StatLink 2 https://stat.link/xk6mra Monetary policy has been eased in response to the Covid-19 crisis Monetary policy has been relaxed since the onset of the pandemic and remains accommodative. Mid-May the Central Bank raised the key interest rate by 0.25 percent points to 1%, but rates remain at historically low levels following the 2 percentage point reduction from March 2020 (Figure 1.9) and are lower than in the euro area in real terms. As part of a broader monetary and financial response package, monetary easing helped to counter the adverse effects of the pandemic and related containment measures on economic activity, in a context of heightened uncertainty (Box 1.2). Inflation was around the 2½ per cent target before the onset of the pandemic but has risen since, largely because of exchange rate depreciation, but also more recently due to rising wages and house prices, soaring global commodity prices, supply bottlenecks in certain sectors and base effects. It hovered around 4¼ per cent in the first quarter of 2021 on a year-on-year basis. The króna has appreciated somewhat in recent months, and the Central Bank expects that headline inflation will ease in the near term, once the effects of the exchange rate depreciation have abated, and against a backdrop of slack in the economy. Long-term readings remain close to target, but short-term inflation expectations have risen above the target. Moreover, real wage growth has been strong, at around 6% in early 2021 year-on-year, despite the crisis-related rise in unemployment, following the 2019 collective agreements. Moving forward, monetary policy should remain accommodative, given the uncertain outlook, but the authorities are advised to monitor developments closely and stand ready to act to ensure inflation expectations remain well anchored. OECD ECONOMIC SURVEY : ICELAND 2021 © OECD 2021
22 Figure 1.9. Monetary policy remains accommodative A. Inflation and key policy rate B. Inflation expectations based on breakevens Y-o-y % Y-o-y % % change change ← Inflation (y-o-y) 1-year breakeven inflation rate 10 -60 7 ← Inflation target 10-year breakeven inflation rate 9 ← Key interest rate -50 6 Inflation target 8 Exchange rate of the króna (inverted) → -40 7 5 -30 6 -20 4 5 -10 3 4 0 3 2 2 10 20 1 1 0 30 0 2010 2011 2012 2013 2014 2015 2016 2017 2018 2019 2020 2021 2010 2011 2012 2013 2014 2015 2016 2017 2018 2019 2020 2021 C. Price developments D. Foreign currency reserves Y-o-y % (in convertible foreign currencies) change Million USD 20 10 000 Imported goods Domestic goods excluding housing 9 000 15 8 000 7 000 10 6 000 5 5 000 4 000 0 3 000 2 000 -5 1 000 -10 0 2012 2013 2014 2015 2016 2017 2018 2019 2020 2021 2021 2000 2002 2004 2006 2008 2010 2012 2014 2016 2018 2020 Note: Breakeven inflation rate is calculated from yield spreads between nominal and index-linked Government and Government-backed bonds (5-day moving averages). Daily data. Source: OECD, Main Economic Indicators; Statistics Iceland; and Central Bank of Iceland. StatLink 2 https://stat.link/tf09wq Box 1.2. Monetary and financial measures to deal with the Covid-19 crisis In response to the COVID-19 pandemic, the Central Bank has taken a wide range of actions to ease the monetary stance and boost liquidity in order to shore up demand, support access to credit and preserve financial stability. From March to November 2020, it cut the policy interest rate in steps by 2 percentage points to 0.75%. Measures were taken to inject liquidity in the financial system. In March 2020 the average reserve requirement for deposit institutions was lowered from 1% to 0%. Changes were also made to the treatment of the fixed reserve requirement (1%) in liquidity rules, so that the Central Bank could allow the reserves to be used in cases of liquidity outflows. Fixed reserves now OECD ECONOMIC SURVEY : ICELAND 2021 © OECD 2021
23 count as liquidity buffer. The countercyclical capital buffer was also reduced in March from 2% to 0%. Moreover, the Bank reduced and subsequently eliminated its offerings of one-month term deposits. These deposits had been one of financial institutions’ main avenues for investing in króna-denominated liquid assets and complying with liquidity requirements, as Treasury bonds had been in short supply. The commercial banks held a large share of their liquid assets in these accounts, and interest rates on them had been somewhat above the Bank’s key rate. Furthermore, a special temporary collateralised credit facility was established in April 2020 with an expanded list of eligible collateral. The Central Bank initiated purchases of Treasury bonds on the secondary market to meet the increase in Treasury bond issuance and ensure the transmission of monetary easing to households and businesses. These purchases have nevertheless been small. Since the onset of the crisis, the Bank has intervened in the spot foreign exchange market to mitigate exchange rate volatility. In 2020, the Bank’s net foreign currency sales totalled Euro 825 million or 37% of total market turnover. In addition, in September 2020 the Bank launched a regular programme to sell foreign exchange in the domestic market, arguing that it should be deepened and price formation improved. The programme was discontinued in May 2021 as the króna has appreciated and the Bank assessed that equilibrium in the foreign exchange market has improved. Other measures included a voluntary temporary suspension of foreign exchange purchases by pension funds and the payment of dividends or equity buy-backs by financial institutions and insurance companies. Source: Central Bank of Iceland. The financial system is considered to be sound but vigilance is warranted The easing of monetary conditions has benefitted households more than firms. Lending to households rose robustly in 2020, along with a surge in real estate market activity (Figure 1.10). The number of first- time buyers increased rapidly, accounting for one-third of homebuyers in the first quarter 2021, a record high (Central Bank of Iceland, 2021[2]). House price increases, however, are broadly in line with macroeconomic fundamentals, according to the assessment by the Central Bank. Housing supply increased as construction initiated by the earlier tourism boom came on stream. Better borrowing terms encouraged mortgage refinancing: demand for non-indexed mortgage loans, and the share of variable- rate loans in total lending, have increased (Central Bank of Iceland, 2021[3]). In contrast, corporate lending stagnated, possibly reflecting tighter access to credit as a result of increased risk, and/or a fall in demand for credit as the pandemic-related crisis reduced firms’ risk appetite (Central Bank of Iceland, 2020[4]). Liquidity constraints are mainly a concern for companies in the tourism and personal services sector, but related sectors, such as commercial property leasing, have also been affected. Household and non- financial corporate debt ratios to GDP have increased, in part due to the GDP contraction, but remain low by historical standards (Figure 1.10). OECD ECONOMIC SURVEY : ICELAND 2021 © OECD 2021
24 Figure 1.10. Households benefitted more than firms from the easing of monetary conditions A. Credit growth to the private non-financial sector B. Credit-to-GDP ratio, private non-financial % of GDP, sector Y-o-y % growth 2003=100 20 250 Households Companies 15 10 200 5 150 0 -5 100 -10 Households Non-financial corporations -15 50 Private non-financial sector -20 Mortgage loans -25 0 2012 2013 2014 2015 2016 2017 2018 2019 2020 2021 2020 2003 2005 2007 2009 2011 2013 2015 2017 2019 C. Real estate prices in the capital area D. Housing market developments Number in the capital area Y-o-y % 2010Q1-100 change 220 1000 30 Real house price index Real commercial prices index 900 25 190 800 20 700 15 160 600 10 500 5 130 400 0 300 Turnover on housing market- sa, -5 3-month moving average (left) 100 200 -10 Real house prices (right) 100 -15 70 0 -20 2010 2012 2014 2016 2018 2020 2010 2012 2014 2016 2018 2020 Note: Credit stock adjusted for reclassification and effects of government debt relief measures. Source: Central Bank of Iceland; Statistics Iceland; and Registers Iceland. StatLink 2 https://stat.link/adhk30 The financial system has held up well in the face of pandemic-related stress and helped to cushion the economy from the severity of the health shock through moratoria on payments and increased credit to private sector (Figure 1.10, Panel A). The overhaul of the banking sector after the 2008 crisis and increased use of macro-prudential tools have put the banking sector on a more solid footing to withstand the adverse effects of the pandemic (Figure 1.11). The recent merger of the Central Bank and Financial Supervisory Authority (see previous Survey) is expected to strengthen the overall surveillance of the financial system. The authorities consider that bank capital and liquidity buffers are strong, since adequacy ratios of systematically important banks are well above requirements and banks have ample liquidity to support the economy. Loan-to-value ratios and debt service ratios on new bank loans have fallen, despite an increase in banks’ share in the household mortgage market at the expense of other lenders (Central Bank of Iceland, 2021[5]). Indicators of credit quality are generally positive. Despite renewed buoyancy, the real estate market is not expected to pose risks for financial stability in the near term, though close monitoring needs to continue (Figure 1.10). The crisis may pose longer-term challenges to real estate market related to changes in habits and work practices associated with the increase in teleworking, which may shift demand durably, affecting especially commercial property. OECD ECONOMIC SURVEY : ICELAND 2021 © OECD 2021
25 Figure 1.11. The banking sector appears sound A. Regulatory Tier 1 Capital to Risk-Weighted B. Regulatory Tier 1 Capital to Risk-Weighted Assets Assets, 2020 Q4 or latest % % 30 30 29 25 28 27 20 26 25 15 24 10 23 22 5 21 0 20 ITA FIN ISL IRL ESP HUN FRA DEU SVK NLD DNK CZE LTU LUX LVA GRC MEX AUT PRT SVN BEL GBR NOR EST POL SWE Dec-15 Dec-16 Dec-17 Dec-18 Dec-19 Dec-20 C. Non-performing loans to total gross loans D. Non-performing loans to total gross loans, % 2020 Q4 or latest % 27 7 7 6 6 5 5 4 4 3 3 2 2 1 1 0 0 FIN ITA ISL IRL LTU SVK NOR HUN LUX AUS GBR DNK NLD FRA GRC EST SWE AUT CZE ESP SVN LVA BEL POL PRT Dec-15 Dec-16 Dec-17 Dec-18 Dec-19 Dec-20 Source: IMF, Financial Soundness Indicators database. StatLink 2 https://stat.link/9uva50 Several measures have been taken to support access to credit and preserve financial stability. Reserve requirements have been relaxed, along with countercyclical capital buffers, and quantitative easing coupled with interventions in foreign exchange markets have helped to ease monetary conditions (Box 1.2). In particular, the easing of the countercyclical capital buffer from 2% to 0% in March 2020 provided commercial banks room to lend even as they restructured loan portfolios. The COVID-19 crisis still poses challenges, warranting vigilance. The impact of the pandemic on financial institutions’ balance sheets requires close attention, even if the banking system appears to have entered the crisis in a strong position. The average non-performing loan ratio, for example, rose slightly from 2.6% at end-2019 to 2.9% at end-2020. Nonetheless, some early indications of increased credit risk can already be observed. For instance, the share of “non-performing” corporate loans, based on a very prudent methodology (i.e. loans past due by over 90 days, frozen or deemed unlikely to be paid) jumped from around 5% at end-2019 to 18½ per cent in early 2021, with the tourism sector recording the highest share (Central Bank of Iceland, 2021[6]). This mainly reflects the fact that many loans previously protected by special pandemic-related payment deferrals are now considered non-performing, according to this methodology (Central Bank of Iceland, 2021[3]). If the recovery is weak, or the pandemic-related shock OECD ECONOMIC SURVEY : ICELAND 2021 © OECD 2021
26 persists, some vulnerable firms may become insolvent and non-performing corporate loans may increase further. Going forward, it is advisable to maintain liquidity support for distressed firms that are deemed viable, until the recovery is well-established. The share of non-performing household loans rose marginally between end-2019 and early 2021 but remains low at around 3%. However, with variable-rate instruments now comprising a relatively high share of housing loans, household budgets have become sensitive to interest rate rises, thereby increasing risks (Central Bank of Iceland, 2020[4]). The previous OECD Economic Survey recommended to go ahead with privatisation plans in the banking sector. Two of the three commercial banks that represent approximately 97% of the deposit money market, and which are considered systematically important institutions, are state-owned. Privatisation has started to be implemented, with the sale of 35% of Íslandsbanki in June 2021. Appropriate post-privatisation ownership and management are essential to minimising risks in the future. Iceland made considerable progress over the past few years towards strengthening its anti-money laundering and counter-terrorist financing (AML/CTF) regime, following the publication of the 2018 Financial Action Task Force (FATF) Mutual Evaluation Report (FATF, 2018[7]). To that effect, actions have been taken to enhance supervision related to both financial institutions (supervised by the Central Bank) and designated non-financial businesses or professions (supervised by the Directorate of Internal Revenue). The Central Bank currently conducts systematic risk assessment on approximately 80 entities under its supervision (“obliged” entities) to ensure implementation of targeted financial sanction obligations through extensive supervisory engagement. Resources allocated to combatting AML/CFT have been considerably increased over the past two to three years. Cooperation and co-ordination between relevant competent authorities in the AML/CFT field has also been enhanced and a Steering Committee was appointed as the national co-operation and co-ordination mechanism. A National Risk Assessment on money laundering and terrorist financing is now published every two years, followed by an action plan responding to the threats and weaknesses. Furthermore, the Central Bank has increased its focus on guidance to raise awareness among the obliged entities of AML/CFT risks. The November 2020 follow-up report of the Financial Action Task Force (FATF) has rated Iceland as “compliant” or “largely compliant” in 37 out of 40 priorities areas, and “partially compliant” in the remaining three, including those related to virtual assets and virtual asset service providers (FATF, 2020[8]). Iceland is committed to continuing to work with the FATF to improve its AML/CTF regime further. Fiscal policy is supporting the economy Like in most countries, the fiscal position deteriorated because of the pandemic-related support programmes and the working of automatic stabilisers (Figure 1.12. A). The 2020 general government budget deficit amounted to 7.3% of GDP, with automatic stabilisers and discretionary COVID-19 measures each accounting for around half of the deficit increase. Gross public debt rose to 69% of GDP, still below the peak reached after the 2008/09 financial crisis, while net public debt, accounting for government assets, remains below 30% of GDP. The short-term work scheme was the largest programme in financial terms, supporting employment especially during spring 2020 (Figure 1.5B). Specific support was directed at firms that had lost more than 40% of their turnover, mainly in the tourism and aviation industry. Contingent liabilities, mostly related to state guarantees for the Housing Fund, continued to decline from 75% of GDP in 2014 to 32% at the end of 2020. The recent revision of national government financial statistics for the years 1998-2019 has reclassified most contingent liabilities as general government debt. OECD ECONOMIC SURVEY : ICELAND 2021 © OECD 2021
You can also read