ON- AND OFF-(MICRO)GRID PV ELECTRIC COOKING: FIELD DATA FOR INTEGRATED ENERGY ACCESS IN HAITI EARTHSPARK INTERNATIONAL - MECS EFORA PROJECT REPORT ...
←
→
Page content transcription
If your browser does not render page correctly, please read the page content below
MECS EForA Project Report (public version)

On- and Off-(micro)grid PV Electric Cooking: field
data for integrated energy access in Haiti
EarthSpark International

Date: 11/13/2020

                             1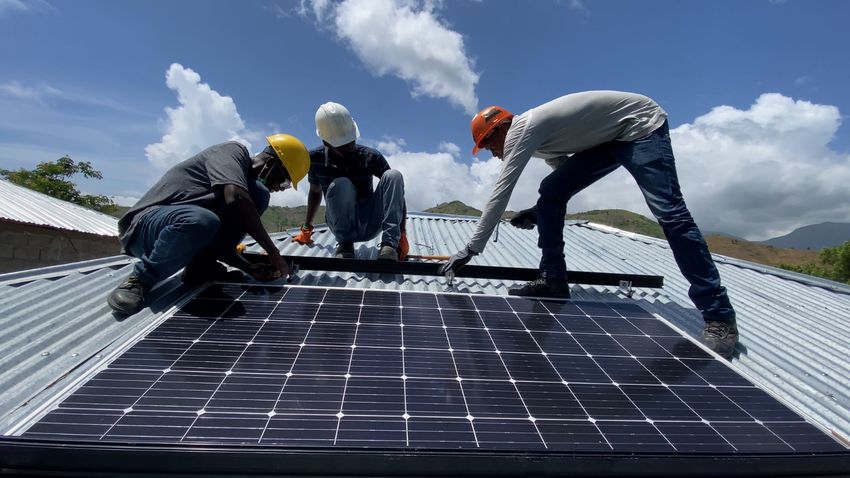
Document Control:

Issue Status        Author(s)       Reviewed By        Loughborough        Issue Date
                                                       University Approved
                                                       By
Draft version 1     Andrew Bilich, Jane , Jon, Simon                       15 Nov 2020
                    Wendy Sanassee, Batchelor
                    Allison
                    Archambault
Final version       Andrew Bilich, Simon Batchelor, Jane Spencer           02/02/2021
                    Wendy Sanassee, Jon Leary & Jane
                    Allison         Spencer
                    Archambault

                                            2
Executive summary
The study explores the potential of electric cooking in rural communities in Haiti by deploying
electric pressure cookers and induction stoves with integrated smart meters in 20 households
connected to a community scale solar PV microgrid as well as cookers and stoves supported by
stand-alone solar+battery systems in 8 off-grid households.

The microgrid participants had a “SparkStove” system, while the off-grid participants had a
SUNSPOT™ solar electric cooking system. Each of the systems were designed to support an electric
pressure cooker (Simpot) and an induction stove. The microgrid system utilized electricity from a
solar PV microgrid while the off-grid system used an individual solar+battery setup. Each device was
interconnected to a smart meter that provided 15-minute interval data for customer electricity
consumption. The present report shows electric cooking data for a minimum of 42 days of
observation for each participant.

Participants were given hands-on training for utilizing electric cooking technology in their home and
also participated in demonstrations and were given recipe and technology guides to help customers
learn to cook with the new technologies and build customer excitement for electric cooking.
Participants also recorded a variety of data in daily energy diaries including the number/type of
meals cooked including a baseline pre-electric cooking menu, what fuel source was used (i.e.
electricity, charcoal, etc.), how long they spent cooking, how many people they cooked for, and if
there were any challenges for a particular meal (especially for electric cooking). All participants
received free electricity for their electric cooking loads to incentivize usage and prioritize actionable
data for planning electric cooking.
In the observed period, there were an estimated 3,820 electric cooking events (1,372 pressure
cooker, 2,448 induction stove, 166 with both) totalling an estimated 3,713 hours of cooking and
3,979 kWh of electricity. On average, the cooking events lasted 58.8 minutes (50 minutes pressure
cooker, 66 minutes induction stove, 112 minutes both) and consumed an average of 1.05 kWh (0.83
kWh pressure cooker, 1.14 kWh induction stove, 1.63 both). Cooking event data also showed
significant ranges for individual customers. On average, customers used electric cooking in 79% of
their observed days, but several customers used electric cooking nearly every day of the study.
Overall, individual customers averaged 1.92 kWh per day. Average induction stove use was 1.58 kWh
per day and average pressure cooker use was 0.79 kWh per day. Off-grid customers consumed an
average of 1.18 kWh per day, while microgrid customers consumed around 2.4 kWh per day.
The electric cooking pilots added significant load to the existing microgrid operations. For example,
in the month of October total average daily load increased 20% because of electric cooking load.
Individual hourly consumption on the grid also increased by an average of 19%, but from 8 AM to 2
PM hourly microgrid load increased 42%-55% as a result of electric cooking highlighting that peak
demand for cooking aligns with peak solar generation in rural Haiti. At the highest-level, monthly
generator use increased 33% from the start of the cooking pilot in July to the end of October. On
normal sunny days, the microgrid has enough extra solar + storage capacity to absorb the extra
cooking load, particularly since it is aligned in the middle of the day, but when solar production is

                                                    3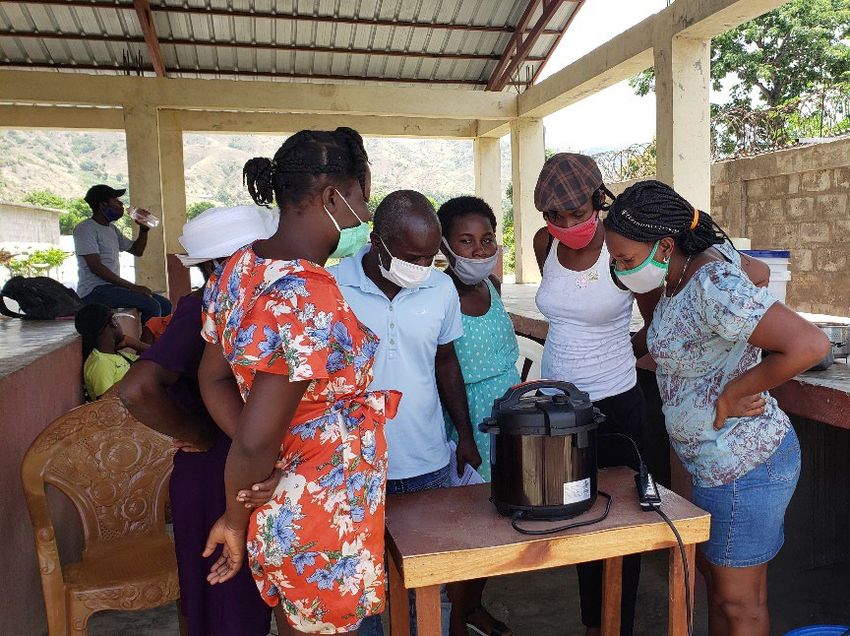
low due to cloudy days and rain, the microgrid saw increased diesel generator usage and on a few
occasions blackouts due to overdraw of the generator.

This illustrates the significant impact that electric cooking load has had on microgrid operations. In
general, the additional draw on the grid is beneficial to the business model of microgrid operations
because the draw coincides with the least-cost energy production. When solar energy generation is
low, however, the electric cooking can be expensive or technically detrimental to the grid. As
anticipated, this finding underscores the importance of 1) deferrable loads on the grid during low
sun days or plans to add additional generation capacity and 2) time-of-use cooking plans to prevent
instantaneous demand from exceeding supply.

The electric cooking participants were very categoric in their response: the cooking appliances are
absolutely life changing. The most mentioned benefit was the amount of time saved cooking with
electricity rather than using charcoal. All participants responded that electric cooking saved them
time compared to status quo cooking. 78% of participants responded indicating that they used that
time for relaxing, 33% for household chores, 15% for focusing on business and income tasks, 7% for
self-care, and 7% for family care.

45% of participants also responded that they increased their cooking frequency as a result of the
electric cooking devices. Financial savings on charcoal expenditures following electric cooking
deployment ranged significantly customer to customer, but the project highlights indicative
willingness to pay values for many customers at or above current microgrid tariffs. This
demonstrates potential pathways for the financial viability of microgrids. The biggest challenge for
the participants was the small size of the devices which limited the amount of food that could be
cooked. Similarly issues with ferromagnetic pots for the induction stoves were also noted, namely
that the pots were too thin and would tend to burn food if not careful.

Overall, the project is a first-step working to prove the viability, effectiveness, and attractiveness of
electric cooking technologies powered by robust, reliable solar + storage energy systems supporting
critical socioeconomic development outcomes in Haiti. This will help to demonstrate key demand for
the solution and create actionable evidence for how to effectively design business models and
frameworks to better support future electric cooking rollouts. In doing this, the project will be
demonstrating viable new revenue streams and opportunities for energy access providers which will
help improve assistance, service, and offerings to other communities. This will also create pathways
for donors, NGOs, private sector, and other stakeholders to meaningfully develop opportunities for
the expansion of clean cooking.

                                                    4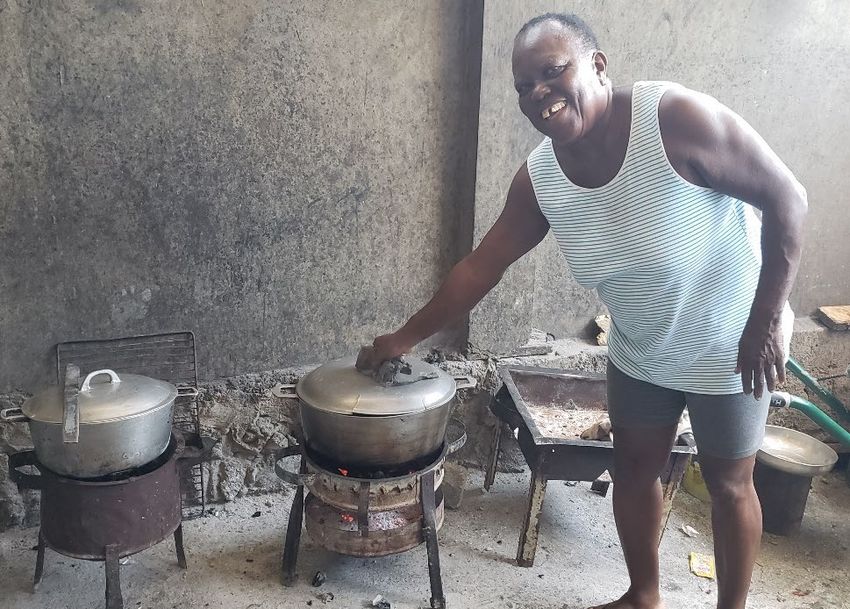
Contents page

1.                 Introduction ............................................................................................................... 7
2.                 Approach ................................................................................................................... 8
     Overview ............................................................................................................................................. 8
     Participants ......................................................................................................................................... 8
     Training ............................................................................................................................................. 10
     Electric Cooking Technology and Installations.................................................................................. 11
     Data Sources ..................................................................................................................................... 12
3.                 Presentation of Results ............................................................................................. 13
     Overview ........................................................................................................................................... 14
     Participant Profiles ............................................................................................................................ 14
     Haitian Meals .................................................................................................................................... 16
     Electric cooking ................................................................................................................................. 18
     Microgrid operations and power quality .......................................................................................... 27
     Customer Surveys ............................................................................................................................. 29
     Tariffs and Cost ................................................................................................................................. 37
     Off-grid outlet ................................................................................................................................... 38
4.                 Key Takeaways ......................................................................................................... 39
5.                 Changing the narrative on modern energy cooking services ....................................... 40
     Appliance performance and acceptance .......................................................................................... 40
     Market Surveys ................................................................................................................................. 52
     Supply chains .................................................................................................................................... 54
     Monitoring electricity supply and use .............................................................................................. 56
     Finance and affordability .................................................................................................................. 58
     Stakeholder interactions ................................................................................................................... 59
     Scaling up electric cooking ................................................................................................................ 64
6.                 Social inclusion and Impacts ..................................................................................... 67
7.                 Gender ..................................................................................................................... 68
8.                 Next steps ................................................................................................................ 69
9.                 Conclusions .............................................................................................................. 70

                                                                              5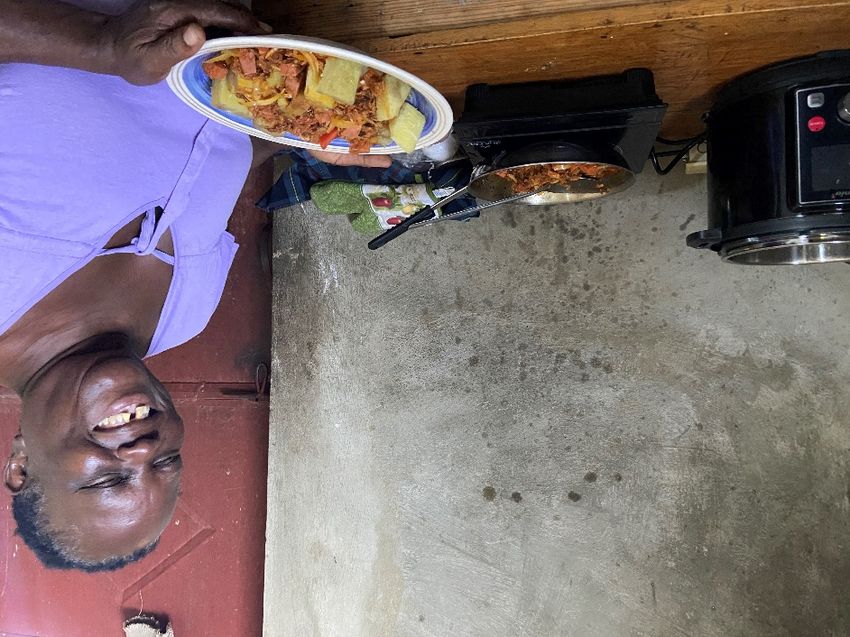
10.   Appendix ................................................................................................................. 71

                                                           6
1. Introduction
The present study explores the potential for electric cooking powered by reliable community-scale
solar PV microgrids to provide an effective alternative to traditional cooking methods for rural
communities in Haiti. Leveraging detailed smart meter consumption data and energy/food journals
from 28 households equipped with electric pressure cookers and electric induction stoves, this
project builds a baseline for electric cooking in Haiti and beyond; specifically by establishing a
knowledge base for electric cooking awareness building, customer preferences (especially for
cooking times/recipe limitations/taste), operating costs and impact on microgrid operations, key
challenges and barriers, and best practices/lessons learned for electric cooking in rural Haiti.

The results will inform how microgrid operators might integrate electric cooking loads into overall
microgrid system design, and how, in turn, that would impact the microgrid business model. The
smart meter data will also enable EarthSpark to assess different customer engagement strategies to
optimize asset utilization and overall microgrid efficiency in delivering high levels of cooking service
availability to customers. Further, this data will help inform designs and business models for off-grid
electric cooking providers like SUNSPOT™ who was a significant partner for the current project. By
running trials in both microgrid and grid-adjacent areas, this project expands the robust functionality
of microgrid smart meters to areas previously left unserved.

Figure 1: Electric cooking participant with her new setup

Overall, the project is a first-step working to prove the viability, effectiveness, and attractiveness of
electric cooking technologies powered by robust, reliable solar + storage energy systems supporting
critical socioeconomic development outcomes in Haiti. The project findings demonstrate demand for
the solutions and create actionable evidence for how to effectively design business models and
frameworks to better support future electric cooking rollouts. In doing this, the project reveals
possible new revenue streams and opportunities for energy access providers which will help
improve assistance, service, and offerings to other communities. The findings also create pathways
for donors, NGOs, private sector, and other stakeholders to meaningfully develop opportunities for
the expansion of clean cooking.

                                                            7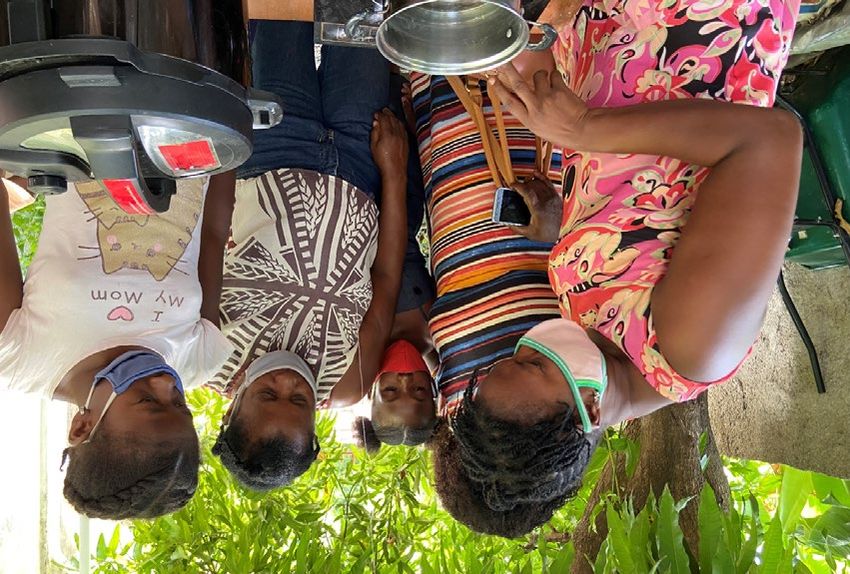
2. Approach
Overview

The study explores the potential of electric cooking in rural communities in Haiti by deploying
electric pressure cookers and induction stoves with integrated smart meters in 20 households
connected to a community scale solar PV microgrid as well as cookers and stoves supported by
stand-alone solar+battery systems in 8 off-grid households.

The study was conducted in the rural community of Les Anglais in Southwestern Haiti which is the
site of EarthSpark’s first microgrid in Haiti. The microgrid itself is a 100kW solar PV hybrid microgrid
serving about 2000 people.

Figure 2: Haitian spaghetti cooked with electric stove and pressure cooker

Participants

In total 20 microgrid households and 8 off-grid households were selected to participate in the
electric cooking study. Participants were selected based off of a number of criteria. Unfortunately,
some of this selection was complicated by COVID-19. All households were encouraged to participate
through direct engagement from Enèji Pwòp staff.

For microgrid participants, the first requirement was that participants needed to be existing
customers of the local microgrid operator, Enèji Pwòp. After that selection was based on a
combination of:

    •    Proximity/Ease of Access – Households in the downtown area near the Enèji Pwòp store
         were prioritized to ease installations as well as the collection of surveys, energy journals, and
         other information, particularly under constrained operating procedures due to COVID-19

                                                           8
•   Size of household – Given the size limitations of the cooking devices, selection focused on
        households that had smaller cooking requirements (i.e. number of people). In general
        household size ranged from 4 to 10 people.

    •   Community Perception/Status – A number of the households selected were women who
        ran various food businesses in town. Given the perception of barriers for electric cooking it
        was important to work with these stakeholders directly as their opinion/experience could
        help tailor future efforts and importantly frame the viability of electric cooking for the rest of
        the community.

    •   Willingness/Ability to Participate -To be effective, the study needed highly motivated
        households that would sustain participation and feedback throughout the study period.
        While many households theoretically could have fit this description, households that had a
        combination of active purchasing patterns and active interactions with Enèji Pwòp staff and
        past surveys/projects were prioritized.

    •   Enèji Pwòp Technicians and Grid Ambassador – The three Enèji Pwòp technicians and one
        grid ambassador were also included as participants (3 microgrid 1 off-grid) as it was critical
        for them to be able to understand and work with the devices effectively so that they could
        support the other participants. It also helps to establish a measure of trust in the systems for
        participants.

For off-grid households, Enèji Pwòp selected households in a specific neighbourhood more isolated
from the rest of the town where households are not likely to be connected by the microgrid. This
neighbourhood also needed to be easily accessible by truck given the installation requirements for
the SUNSPOT™ solar electric cooking systems. The individual households in this neighbourhood
were primarily selected based off of interviews which highlighted specific homes that were present,
smaller in size, and not currently utilizing solar home systems. Three off-grid households were also
selected to help relay the smart meter communications as described further in the technology
section below.

                                                    9
Figure 3: SparkStove participant cooking goat

Training

Four cooking demonstrations and four trainings were held for the study participants and their
families between July 2020 and November 2020. The demonstrations and trainings were conducted
by Enèji Pwòp staff either in the Enèji Pwòp store or in community gathering places.

The training events specifically focused on showing participants how to use the devices safely and
effectively to cook a variety of different meals as well as to answer specific questions from
participants and to enable the participants to practice using the devices. Further, trainings also
included how to shutoff the breakers for the electricity meters for safety and for energy
conservation. Each participant household was required to attend a training event before they could
get their device installed. Each participant household also received a recipe and instruction guide
(see the supporting annexes). The demonstration events focused on cooking specific dishes using
the pressure cookers and/or induction stoves.

Figure 4: Electric cooking demonstration and training

                                                        10
Electric Cooking Technology and Installations
The study participants had two different setups depending on whether they were microgrid or off-
grid. The microgrid participants had a “SparkStove” system, while the off-grid participants had a
“SUNSPOT” system. Each of the systems were designed to support an electric pressure cooker
(Simpot) and an induction stove. The microgrid system utilized electricity from a solar PV microgrid
while the off-grid system used an individual solar+battery setup. Both systems are described in detail
below (see the supporting annexes). All participants received free electricity for their electric
cooking loads to incentivize usage and prioritize actionable data for planning electric cooking.
SparkStove (microgrid): The SparkStove system consists of the two different electric cooking devices
and three different smart meters. The induction stove and the electric pressure cooker were both
connected to a 16A smart meter via a ground-fault circuit interrupter (GFCI) for surge protection
which in turn was connected to a breaker box and then to a 60A smart meter for the household
overall (Figure 1).
This setup was chosen to allow for individual measurement of each cooking device as well as the
overall “non-cooking” electricity consumption. This helped to avoid the need for specific load
disaggregation which has been a challenge for other studies.
Figure 5: Electrical Setup for the Sparkstove
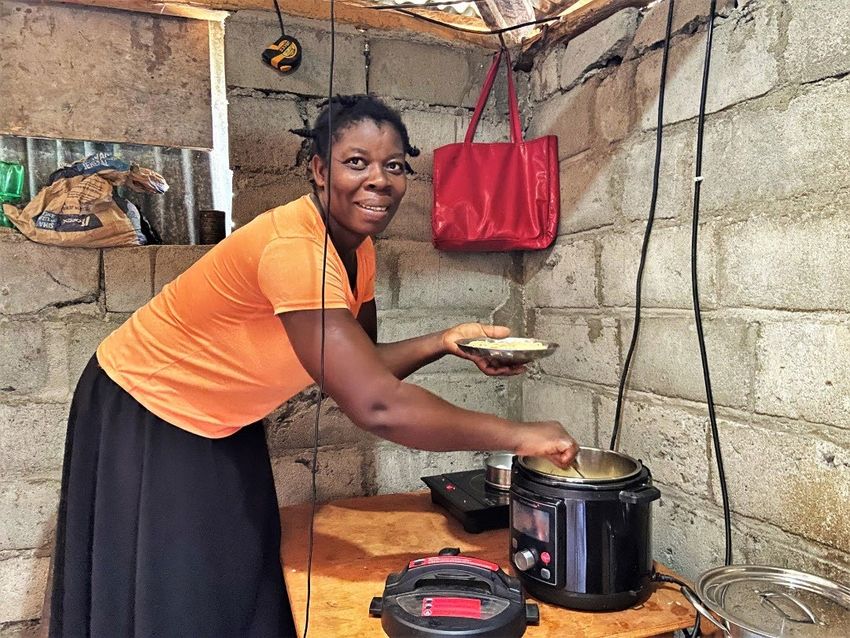
SUNSPOT™ (off-grid): SUNSPOT™ is a self-contained off-grid solar electric power system. The system
consists of two large format PV modules (2 x 350 watts typical), a 2.5 kWh advanced lead carbon
battery and dedicated power and control electronics. It is designed to supply 2 kilowatt-hours per
day, which is enough energy for a family of 4-6 to cook all meals using high efficiency electric
appliances such as induction cooktops or electric pressure cooker, as well as energy for LED lighting
and mobile phone charging. The SUNSPOT has been engineered for local assembly and quick
installation. For the current project, the SUNSPOT systems were prefabricated in the United States
and then assembled locally by Enèji Pwòp staff is Les Anglais. Doug Danley from SUNSPOT also
consulted on the electric cooking study design and implementation.
The SUNSPOT™ system similarly had individual metering of the cooking devices and additional outlet
to allow for individual measurement of each cooking device as well as the overall “non-cooking”
electricity consumption.
11Figure 6: Haitian man cooking on the SUNSPOT System
Figure 7: SUNSPOT solar installation
Data Sources
The study leveraged a few different tools and technologies to collect and analyze a variety of data as
detailed below:
• Energy Diaries: Participants recorded a variety of data in daily energy diaries including the
number/type of meals cooked (both baseline menu and with electric cooking menu as
discussed below), what fuel source was used (i.e. electricity, charcoal, etc.), how long they
spent cooking, how many people they cooked for, and if there were any challenges for a
particular meal (especially for electric cooking). These diaries were then transcribed and
translated to help establish baseline cooking practices and supplement the smart-metering
data. Date ranges for the diaries varied from participant to participant, but in general
included 1 month of pre-electric data and 1-3 months of data after installation. A copy of the
energy diary template utilized can be seen in Table 1 below.
Table 1: Template for Simple Energy Diary
Date 7/1/2020 7/2/2020 ….
12Cooking Start Time
Cooking End Time
What is the age and gender of the person who cooked?
What food/drink did they make?
How many people did they cook for?
Did they cook with electricity?
What did they make using electricity?
Did they use the electric stove?
What did they make?
Was the system easy to use?
If they used another source of energy what did you use
(charcoal, wood, propane, etc.)?
Why were you not able to use electric?
How did people think the meal tasted?
• Formal Participant Surveys: Participants completed formal surveys at the beginning and the
end of the study (about 1-2 months apart for most participants). Questions focused on
gathering information like cooking practices, demographics, fuel expenditures, perception of
electric cooking, issues with technology, etc. A copy of the participant survey questions can
be seen in the supporting annexes.
• Informal Participant Conversations: General feedback from participants was also gathered
through informal conversations and technician/grid ambassador visits.
• Electricity Smart Meters – As above, all of the participants had individual electricity smart-
meters from SparkMeter connected to their electric pressure cookers, induction stoves, as
well as for their overall household electricity consumption from the microgrid or SUNSPOT.
These meters provide 15-minute interval data on electricity consumption as well as power
quality metrics like voltage, frequency, and uptime. This data is automatically pushed to the
cloud.
All of the data was either gathered in person by Enèji Pwòp staff and transcribed or pushed directly
to the cloud. Following this, EarthSpark researchers utilized Excel and R platforms to clean and
analyze the data.
3. Presentation of Results
13Overview
In total 29 participants participated in the initial electric cooking pilot (20 microgrid, 8 off-grid, and 1
R&D using the off-grid system 1). Between July 1, 2020 and September 29th, 2020 all participants
0F
were trained on how to safely utilize the electric cooking technologies. Once trained, participants
received their electric cooking installations and were able to utilize their cooking technologies in
their homes. The present report shows electric cooking data for each participant household from the
date interconnected to November 10th, 2020 giving a minimum of 42 days of observation for each
participant.
Participant Profiles
Gender
All but one cooking participant was female. It does not mean that male members of the family did not
use the cooking appliances, as cooking diaries entries did indicate the participation of male family
members, though minor, in food preparation. During the training sessions as well, male members and
children in the households were welcomed to attend and participate to make the cooking appliances
accessible for everyone in the family.
However, the main cook in most households were identified as female, except for one off-grid
household (this dynamic didn’t shift much at all following the introduction of electric cooking). This
reinforces the social stereotype that women are responsible for preparing food for the family and in
the Haitian context, especially in rural settings, household tasks are considered to be the woman’s
complementary role while the men are out in the fields or doing other manual jobs. The fact that it
was mostly women participating in the electric cooking project also indicates that they are the ones
being the most impacted.
1
This system was deployed at the EarthSpark field office and hosted a variety of different appliances including
a small refrigerator, blender, ice machine, electric coil stove, toaster oven, etc. Since this application was so
different from the other participants, we have included the data as raw data to help inform future analyses,
but have excluded it from the below summaries so as to not skew results.
14Electric Cooking Pilot Participants by Gender
30
27
25
20
Frequency
15
10
5
1
0
F M
Figure 8 : Gender distribution of cooking participants
Survey results indicate that most of the cooks in the household are between 36 and 55 years old.
While this figure reflects the main person who prepared food in the house, it does not mean that age
groups outside of this range did not utilise the electric cooking appliances. Energy diaries entries have
shown that children as young as 9 and elderly people as old as 82 did use the electric cooking
appliances either for preparing meals or just boiling water.
Age Distribution of Participants
10 9
8 7
Frequency
6
4
4 3
2 2
2
0
18-25 26-35 36-45 46-55 56-65 66-75
Age Range
Figure 9 : Age distribution of the cooking participants
The participants were asked about what age they were when they learned to cook. The majority of
them were less than 10 with 6 years old being the youngest age mentioned. Meals prepared at this
young age included plain white rice and boiled root vegetables.
15Age Participant Learned to Cook
Less than 10 18 and above 11 to 18
6%
19%
75%
Figure 10 : Cooking learning age distribution among the participants
81% of participants learned from a maternal figure like a mother or stepmother. Two participants
learned to cook at school and one even studied two years at cooking school (she is the only participant
who is employed as a cook). In 100% of the cases, the person who taught the cooking skills was a
woman.
How participants obtained their cooking skills
At school 8%
Self-taught 8%
Other family member 15%
Mother/ stepmother 81%
0% 10% 20% 30% 40% 50% 60% 70% 80% 90%
Proportion of Participants
Figure 11: How Participants Learned to Cook
Haitian Meals
Baseline menus and cooking/prepping times were established from participant recorded energy
diaries. Not all participants recorded energy diaries and some were more diligent about filling them
out than others. Initial corrected energy/cooking diaries are included in the supporting annexes.
16The participants made a variety of traditional Haitian meals over the course of the baseline and
electric cooking study period. These meals mostly consist of a starch (rice, spaghetti/macaroni,
cornmeal, wheat/millet, plantain, viv (boiled roots/plantain), breadfruit) and an addition of beans,
meat, vegetables, eggs, and/or fish.
Figure 12: Haitian beans and rice
Mostly food is boiled or fried and rice was the most common item prepared followed by
tea/coffee/hot chocolate and spaghetti/macaroni (Figure 5). Beans were the most common addition
followed by fish or meat. Other additions include vegetables, legum (braised vegetables with sauce
and coconut), eggs, etc (Figure 6).
Frequency of Meal Type
Wheat/Millet
Soup/Stew/Bullion
7% Plantain
11%
6%
Viv
5% Breadfruit
Cornmeal 3%
11%
Porridge/Oatmeal
Other 2%
1%
Spaghetti/Macaroni
Bread and Eggs
12%
1%
Rice
Tea/Coffee/Hot 27%
Chocolate
14%
Figure 13: Frequency of Meal Type
17Frequency of Additions to Meal
Meat or Meat/Sauce
Nothing 15%
24%
Eggs
3%
Vegetables Beans or Bean Sauce
2% 34%
Legum
7%
Fish
15%
Meat or Meat/Sauce Beans or Bean Sauce Fish Legum Vegetables Eggs Nothing
Figure 14: Frequency of Additions to Meal
Electric cooking
Participants also recorded estimated start and stop times for cooking. Despite some issues matching
the energy diaries to the actual smart metering data, the diaries still highlighted changes in overall
cooking/prepping times for baseline (mostly charcoal) and electric cooking. It is important to note
that the times include prepping time not just cooking times and they came from participant reported
start and end times which had some accuracy challenges because participants sometimes
retroactively filled out their diaries, mislabelled entries (corrected where possible in review), only
reported hours not hours and minutes, etc. Further, the groupings displayed below were assigned to
each of the participants’ entries which could have led to transcription or classification errors.
Despite these limitations, the diaries highlight a pattern that electric cooking significantly decreases
cooking time, particularly for staple meal bases like breadfruit (53%), viv (51%), soup/stew/bullion
(51%), wheat/millet (41%), spaghetti/macaroni (39%), rice (32%). Comparisons of participant
recorded cooking/prep times can be seen in Figure 7 below.
18Average Cooking/Prepping Times by Meal Type
300.0 Non-Electric Electric
244
250.0 232 231
211 213
Cooking Time (Minutes)
198
200.0
169
146 153
150.0 138
127 122
111 115
106 103
100.0
67 67
50.0
0.0
Figure 15: Average Cooking/Prep Times by Meal Type
Additional detail for meal cooking times can be seen in below. As above you can generally see a
substantial decrease in cooking times for the staple meals and standard additions. With the
aforementioned diary challenges, there are some comparisons that did not have observations for
electric/non-electric cooking or did not have a statistically significant sample size (n>22), so those
comparisons should not be viewed conclusively, but they are included for sake of completeness.
Table 2: Meal Comparisons Electric vs. Non-Electric
Meal (observations) Average Cooking and Prep Time Average Cooking and Prep
Non-Electric (minutes) Time Electric (minutes)
Bread and Eggs (n=13) 71.00 65.00
Breadfruit (n=16) 160.42 56.00
Breadfruit w/ Fish (n=5) 286.67 127.50
Breadfruit w/ Meat or Meat/Sauce (n=2) 73.50 N/A
Breadfruit w/ Vegetables (n=6) 240.00 80.00
Bulgur Wheat (n=17) 160.80 77.92
Bulgur Wheat w/ Beans or Bean Sauce 216.54 132.50
(n=32)
Bulgur Wheat w/ Fish (n=26) 232.86 111.25
19Bulgur Wheat w/ Legum (n=11) 230.56 180.00
Bulgur Wheat w/ Meat or Meat/Sauce 287.10 165.00
(n=11)
Chicken (n=3) 260.00 N/A
Coffee (n=98) 60.72 38.48
Cornmeal (n=40) 175.23 93.00
Cornmeal w/ Beans or Bean Sauce (n=112) 243.39 135.34
Cornmeal w/ Fish (n=34) 228.00 98.08
Cornmeal w/ legum (n=15) 258.13 200.43
Cornmeal w/ Meat or Meat/Sauce (n=14) 295.00 133.00
Eggs (n=9) 10.33 53.00
Filling (n=15) 26.33 N/A
Gratin (n=1) 250.00 N/A
Hot Chocolate (n=59) 68.94 56.60
Hot Water (n=3) 45.00 240.00
Millet (n=4) 150.00 125.00
Millet w/ Beans or Bean Sauce (n=24) 265.80 276.67
Millet w/ Fish (n=3) 345.00 N/A
Millet w/ Fruit (n=1) N/A 60.00
Millet w/ Legum (n=1) 300.00 N/A
Millet w/ Meat or Meat/Sauce (n=10) 245.00 240.00
Pate (n=13) 200.00 68.00
Plantain (n=45) 119.66 109.88
Plantain w/ Beans or Bean Sauce (n=8) 225.00 147.50
Plantain w/ Chicken (n=2) 300.00 N/A
Plantain w/ Egg (n=13) 122.50 89.00
Plantain w/ Fish (n=24) 155.93 90.00
Plantain w/ Meat or Meat/Sauce (n=27) 193.47 172.64
Plantain with rice (n=1) N/A 150.00
Porridge/Oatmeal (n=29) 89.14 61.75
Rice (n=66) 106.35 103.38
Rice w/ Beans or Bean Sauce (n=219) 203.17 130.18
20Rice w/ Chicken (n=8) 192.50 210.00
Rice w/ Fish (n=62) 210.62 149.44
Rice w/ Legum (n=50) 213.28 147.78
Rice w/ Meat or Meat/Sauce (n=89) 225.42 190.73
Rice w/ Vegetables (n=19) 171.89 67.00
Soup/Stew/Bullion (n=189) 204.54 103.70
Spaghetti/Macaroni (n=226) 110.55 67.39
Tea (n=105) 44.88 51.57
TonmTonm (n=36) 232.26 144.00
Viv (n=6) 360.00 71.80
Viv w/ Beans or Bean Sauce (n=13) 154.83 109.86
Viv w/ Eggs (n=1) N/A 60.00
Viv w/ Fish (n=34) 257.86 87.69
Viv w/ Legum (n=5) 200.00 120.00
Viv w/ Meat or Meat/Sauce (n=33) 221.88 153.82
Yam/Root Vegetable (n=3) 82.00 60.00
As above, there were issues matching the participants’ energy diaries and recordings with the actual
electricity data streams from the smart meters which resulted in electricity consumption data being
presented per “cooking event 2” as well as hourly, daily, and monthly averages as discussed below
1F
(see the supporting annexes for raw data).
2
Defined as any time the pressure cooker or induction stove meters were recording power draw greater than
100W. Continuous 15-minute intervals represent the same “cooking event”
21Figure 16: Microgrid participant cooking rice and vegetable sauce
Overall, from July 1 to November 10, project participants consumed 3,985 kWh. Off-grid participants
accounted for 681 kWh and microgrid participants accounted for 3,303 kWh. This is in part because
there were fewer off-grid participants and they generally were connected later than microgrid
participants. Even once all participants were connected, off-grid participants only accounted for
16.6% of energy consumed. When comparing devices, the induction stoves accounted for 2,767 kWh
(69.4%) and the pressure cookers accounted for 1,218 kWh (30.5%). Once all participants were
online, overall daily consumption averaged 53.8 kWh (5.6 kWh off-grid, 56.0 kWh microgrid). Daily
induction stove use averaged 38.0 kWh and daily pressure cooker use averaged 15.9 kWh (Figure 8)
(Figure 9).
Total Electricity Consumption for On-grid vs. Off-grid Customers
90
Electricity Consumed (kWh)
80 Off-grid Microgrid
70
60
50
40
30
20
10
0
22Figure 17: Total Electricity Consumption for Microgrid vs. Off-grid Customers
Total Electricity Consumption for Induction Stove vs. Pressure Cooker
90
80
Induction Stove Pressure Cooker
70
Electricity Consumed (kWh)
60
50
40
30
20
10
0
Figure 18: Total Electricity Consumption for Induction Stove vs. Pressure Cooker
Once all participants were online, average hourly consumption at the grid level was 2.26 kWh with
the majority of consumption (61%) occurring between 9 AM and 4 PM. This consumption aligns with
high solar production for the grid (discussed below). As above, average hourly consumption also
differed by device and customer type. The induction stove averaged 1.61 kWh and the pressure
cooker averaged 0.70 kWh (Figure 10)(Figure 11). Unfortunately, with instability in meter
communications for off-grid meters, intervals are only recorded intermittently with single intervals
accounting for the consumption in other periods. This lessened available hours to calculate true
hourly averages and load profiles for off-grid participants. Consequently, the hourly averages for off-
grid participants are reflected as lumpier and higher (for certain hours) than actual consumption
patterns.
23Average Hourly Total Electricity Consumption
7
Electricity Consumption (kWh)
6
5
4
3
2
1
0
0 1 2 3 4 5 6 7 8 9 10 11 12 13 14 15 16 17 18 19 20 21 22 23
Hour
Figure 19: Average Hourly Total Electricity Consumption
Average Hourly Total Electricity Consumption by Device
5
Electricity Consumption (kWh)
4.5
4
Induction Stove
3.5
Pressure Cooker
3
2.5
2
1.5
1
0.5
0
0 1 2 3 4 5 6 7 8 9 10 11 12 13 14 15 16 17 18 19 20 21 22 23
Hour
Figure 20: Average Hourly Total Electricity Consumption by Device
In the observed period, there were an estimated 3,820 electric cooking events (1,372 pressure
cooker, 2,448 induction stove, 166 with both) totalling an estimated 3,713 hours of cooking and
3,979 kWh of electricity. On average the cooking events lasted 58.8 minutes (50 minutes pressure
cooker, 66 minutes induction stove, 112 minutes both) and consumed an average of 1.05 kWh (0.83
kWh pressure cooker, 1.14 kWh induction stove, 1.63 both) (Table 2). As above, unfortunately, with
instability in meter communications for off-grid meters, cooking events were only recorded
intermittently with single intervals accounting for the consumption in other periods. That lessened
the intervals recorded for calculating cooking event time. Accordingly, the cooking event comparison
cannot be made effectively for microgrid vs. off-grid participants.
24Table 3: Cooking Events by Device
Device Total Cooking Total Cooking Average Cooking Total Cooking Event Average Cooking
Events Event Time (hours) Event Time (hours) Energy (kWh) Event Energy (kWh)
Pressure Cooker 1,372 1,135 50.00 1,127 0.83
Induction Stove 2,282 2,271 60.23 2,583 1.14
Both 166 307 111.73 269 1.63
Total 3,820 3,713 58.79 3,979 1.05
Cooking event data also showed significant ranges for individual customers. On average, customers
used electric cooking in 79% of their observed days, but several customers used electric cooking
nearly every day of the study. There were some technical and equipment challenges (discussed
below) that account for some of the non-use days. For the three customers with below 50%
utilization, two of them were dealing with sickness in the family and/or the primary user and the
third wasn’t too motivated to use the electric cooking devices.
Cooking event summaries for individual participants are shown below with yellow blazes to indicate
off-grid participants (Table 3).
Table 4: Electric Cooking Events by Customer
Participant Starting Total Prop. of Days with Avg. Electric Cooking Avg. Electric Cooking Avg. Electric Cooking
Date Days Electric Cooking Use Events per Day Time per Day (hours) Energy per Day (kWh)
1 7/7/2020 126 86% 1.64 1.40 1.09
2 7/6/2020 127 95% 2.95 2.53 2.48
3 7/4/2020 129 98% 2.59 1.50 1.55
4 8/14/2020 88 74% 0.24 0.07 0.89
5 8/25/2020 77 40% 0.88 1.35 1.34
6 8/30/2020 72 78% 2.42 1.80 1.28
7 9/29/2020 42 79% 2.16 2.11 2.52
8 8/22/2020 80 99% 2.59 4.28 3.80
9 8/30/2020 72 99% 3.41 5.08 4.91
10 8/17/2020 85 73% 1.06 0.73 0.73
11 9/5/2020 66 65% 0.96 0.72 0.90
12 9/6/2020 65 88% 1.77 1.63 2.00
13 9/1/2020 70 99% 0.62 0.17 1.06
14 9/1/2020 70 74% 0.10 0.02 0.49
15 8/24/2020 78 83% 0.44 0.12 1.51
2516 8/22/2020 80 94% 2.47 2.67 3.13
17 8/25/2020 77 88% 1.85 1.63 1.94
18 8/25/2020 77 51% 1.15 1.04 0.91
19 8/18/2020 84 36% 0.39 0.18 0.39
20 8/20/2020 82 98% 2.76 3.63 2.98
21 8/20/2020 82 70% 1.10 1.00 1.26
22 7/1/2020 132 97% 2.44 2.73 2.35
23 8/16/2020 86 24% 0.34 0.30 0.31
24 8/16/2020 86 99% 3.13 3.65 2.80
25 8/14/2020 88 98% 2.84 2.10 2.31
26 9/26/2020 45 84% 0.22 0.06 1.20
27 9/27/2020 44 61% 0.16 0.04 1.06
28 9/28/2020 43 74% 0.14 0.03 0.88
At the individual customer level, consumption and device preference varied significantly. Overall,
individual customers averaged 1.92 kWh per day. Average induction stove use was 1.58 kWh per day
and average pressure cooker use was 0.79 kWh per day. Off-grid customers consumed an average of
1.18 kWh per day, while microgrid customers consumed around 2.4 kWh per day. Average overall
consumption (including non-cooking hours) for individual customers averaged 0.30 kWh per hour in
a day. Individual customers’ induction stove usage averaged 0.28 kWh per hour in a day, while their
pressure cooker usage average 0.15 kWh per hour in a day (Figure 12)(Figure 13).
Average Hourly Customer Electricity Consumption
0.6
Electricity Consumption (kWh)
0.5
0.4
0.3
0.2
0.1
0
0 1 2 3 4 5 6 7 8 9 10 11 12 13 14 15 16 17 18 19 20 21 22 23
Hour
Figure 21: Average Hourly Customer Electricity Consumption
26Average Hourly Customer Electricity Consumption by Device
0.5
Induction Stove
Electricity Consumption (kWh)
0.45
0.4 Pressure Cooker
0.35
0.3
0.25
0.2
0.15
0.1
0.05
0
0 1 2 3 4 5 6 7 8 9 10 11 12 13 14 15 16 17 18 19 20 21 22 23
Hour
Figure 22: Average Hourly Customer Electricity Consumption by Device
Microgrid operations and power quality
The electric cooking pilots added significant load to the existing microgrid in Les Anglais. For
example, in the month of October total average daily load increased 20% because of electric cooking
load. Individual hourly consumption on the grid also increased by an average of 19%, but from 8 AM
to 2 PM hourly microgrid load increased 42%-55% as a result of electric cooking (Figure 14)(Figure
15).
On normal sunny days, the microgrid has enough extra solar + storage capacity to absorb the
cooking load, particularly since it is aligned in the middle of the day, but when solar production is
low due to cloudy days and rain, the microgrid has seen increased diesel generator usage and on a
few occasions blackouts due to overdraw of the generator. At the highest-level, monthly generator
use increased 33% from the start of the cooking pilot in July to the end of October. It should be
noted that other significant loads were added to the Les Anglais system in July 2020 when the
electric cooking pilot started, in particular two telecommunications towers which were themselves a
significant draw on the system, so the increase in generator use is not fully attributable to electric
cooking.
This illustrates the significant impact that electric cooking load has had on microgrid operations. In
general, the additional draw on the grid is beneficial to the business model of microgrid operations
because the draw coincides with the least-cost energy production. When solar energy generation is
low, however, the electric cooking can be expensive or technically detrimental to the grid. As
anticipated, this finding underscores the importance of 1) deferrable loads on the grid during low
sun days or plans to add additional generation capacity and 2) time-of-use cooking plans to prevent
instantaneous demand from exceeding supply. In the future it may also be possible to integrate
weather conditions into cooking tariffs (i.e. sunny day tariffs for electric cooking).
27October Microgrid Consumption
350
300
Consumption (kWh)
250
200
150
100
50
0
1 2 3 4 5 6 7 8 9 10 11 12 13 14 15 16 17 18 19 20 21 22 23 24 25 26 27 28 29 30 31
Day
Other Load Electric Cooking
Figure 23: October Microgrid Consumption by Day
Average Hourly Microgrid Consumption
18
16 Other Load
14 Electric Cooking
Consumption (kWh)
12
10
8
6
4
2
0
1 2 3 4 5 6 7 8 9 10 11 12 13 14 15 16 17 18 19 20 21 22 23 24
Hour
Figure 24: Average Hourly Microgrid Consumption
Electric cooking did seem to have some impact on delivered voltage, particularly on certain
distribution lines, but overall delivered voltage stayed within normal +/- 5% ranges to the customer
devices. The histograms below show a number of 0 readings at the left tail of the histogram which
were mostly the result of meters being left on with no electric cooking load (Figure 16) (Figure 17).
28Figure 25: Histogram of Voltage Recordings for Induction Stoves
Figure 26: Histogram of Voltages for Pressure Cookers
Customer Surveys
Customer satisfaction surveys were conducted for each of the participants. Participants were asked
a variety of questions about charcoal consumption, cooking frequency, free time, etc. before and
after electric cooking. Additional discussion of the findings can be seen in the “Changing the
narrative section” below. A template for the surveys and the raw survey data is included in the
supporting annexes.
29The electric cooking participants were very categoric in their response: the cooking appliances are
absolutely life changing. The most mentioned benefit was the amount of time saved cooking with
electricity rather than using charcoal. Beans are very present in Haitian cuisine and it can take at
least two hours to get the dry beans ready for the meals. With the use of the electric cooking
appliances, this time has been reduced by more than half. Cooked for about 30 minutes in the
Simpot, dry black beans can be ready for consumption. The same beans would take at least 1.5 to 2
hours on charcoal including the time to get the charcoal hot enough to be able to cook food.
Figure 27: Microgrid electric cooking participant in her kitchen
Some participants mentioned how sometimes the charcoal that is available at the market is not
good enough and doesn’t even last a long time. This brings us to the next benefit mentioned, which
is the amount of money saved from not having to purchase or from purchasing less charcoal.
Responses from some participants stressed the ever-increasing price of charcoal, which represents a
big expenditure for the household. It is interesting to note how a higher percentage of microgrid
participants reported saving money on charcoal than off-grid participants. The reason for this is
because the off-grid participants’ SUNSPOT might not allow them to cook on it if it has been raining
for many days in a row. Under this circumstance, the off-grid participants always needed to have a
supplementary fuel source.
Some off-grid participants mentioned the additional benefits of having lighting and a power outlet in
their homes with the SUNSPOT. Some of them would normally use kerosene lamps or rechargeable
lights for their homes but they now have a light point with the system, that works even when the
weather is too bad for electric cooking to be possible. The ability to charge phones for themselves
and some people in their family and neighbourhood has been mentioned and this allows the
participants to save more money as they no longer need to go to phone charging businesses to have
their phone batteries charged (Figure 18).
30Advantages of the electric cooking systems
25%
Additional benefits: light and power outlet
0%
0%
No unpleasant heat from the charcoal Off-grid
10%
On-grid
0%
Does not dirty my pots and hands
10%
50%
Easier and more convenient
10%
25%
Money saved
55%
75%
Electric cooking is fast
85%
Figure 28 : The benefits of electric cooking as mentioned by the cooking participants
Forty-five percent (45%) of participants responded that they increased their cooking frequency as a
result of the electric cooking devices, while 48% responded that there was no change, and 7%
replied that it depended on finances available for purchasing additional food to cook (Figure 19).
Change in Cooking Frequency by Participants
7%
Increased cooking
frequency
48%
No change in cooking
frequency
It depends on the
45%
financial means
Figure 29: Change in Cooking Frequency by Participants
All participants responded that electric cooking saved them time compared to status quo cooking.
78% of participants indicated that they used that time for relaxing, 33% for household chores, 15%
for focusing on business and income tasks, 7% for self-care, and 7% for family care (Figure 20).
31Use of Saved Cooking Time by Participants
90%
78%
80%
Percent of Participants
70%
60%
50%
40% 33%
30%
20% 15%
7% 7%
10%
0%
Relaxing Doing house chores Focusing on business Self care Caring for the family
Figure 30: Use of Cooking Time by Participants
The cooking participants were asked about the number of people who are being fed on a daily basis
from their kitchen. The smallest number mentioned was two people, and this is for a couple whose
children are schooled in other towns, which is customary in rural Haitian families. The largest
number mentioned by cooking participants was 13, and this includes not only family members but
neighbours and friends as well those who regularly eat at the participant’s house. The majority of
participants were serving between 4 and 10 people with household cooking (Figure 21).
Figure 31: Number of People Fed by Each Participant
32In a small town like Les Anglais, it is not uncommon to have more than 1 house in a “lakou” (yard)
where the extended family or a neighbour live. Depending on the relationship among the various
people, they might cook and eat together or the head of one household could cook and send food to
the other houses. Figure 22 below gives an idea of the different categories of people the cooking
participants prepared food for. The category with the highest frequency is “Household and family
only” and it does not always refer to a nuclear family only but also includes in some cases cousins,
aunts, brothers, parents that live in the same yard or under the same roof.
People Eating from Participant Households
30
26
Count of Responses
25
20
15
10
6 6 6
5 2
0
Household and Friends Neighbours Other people Food selling
family only business
Figure 32 : Composition of people eating the meals prepared
Electric cooking participants were also asked about their charcoal expenses before the start of the
project and three months into the project. For some participants, charcoal has disappeared
completely from their kitchen. For others, there has been no change in consumption or no change in
the amount spent on charcoal. This can be explained by a few factors:
i. The participants have a food selling business, where they sell BBQ chicken. They are now
able to divert more charcoal towards their business as they remove it from their kitchen.
ii. Some participants do not purchase charcoal but produce it themselves. So, their charcoal
expenditure has not been affected by the project.
iii. Some participants still purchase charcoal but instead of consuming all of it, only save some
as a backup fuel and then sell the rest.
Monthly charcoal expenditures for participants before electric cooking ranged from 525 htg ($8.28
USD) – 9,300 htg ($147 USD) 3 with an overall average of 2,538 htg ($40.28 USD) and an average of
2F
2,278 htg leaving out the highest expenditure participant. After electric cooking, expenditures
ranged from 0 htg ($0 USD) to 6,200 htg ($98 USD). Most participants saw savings as a result of
3
It should be noted that there are several participants with higher expenditures that utilize charcoal for food
service businesses.
33electric cooking, with 13 participants saving between 80% and 100% on monthly charcoal
expenditures (Figure 23)(Figure 24).
Figure 23 highlights the change in before (blue) and after (orange) expenditures for each customer.
It should be noted that participants 8, 18, and 20 all utilized charcoal significantly for selling food
instead of solely self-consumption. Other high expenditure participants cooked very often or for a
lot of people. Some households didn’t record a before expenditure baseline (4, 8, 13, 15) and some
households didn’t record any expenditure values at all (6, 14, 24). Otherwise, most of the customers
saw a clear decrease in expenditures.
Charcoal expediture before and during cooking pilot
10000
9000
8000
Charcoal Expenditure (htg)
7000
6000
5000
4000
3000
2000
1000
0
0 1 2 3 4 5 6 7 8 9 10 11 12 13 14 15 16 17 18 19 20 21 22 23 24 25 26 27 28 29 30
Participant Number
Monthly Charcoal Expenditure - After (htg) Monthly Charcoal Expenditure - Before (htg)
Figure 33: Average Monthly Charcoal Expenditures Before and After
34Figure 34: Indicative Savings on Charcoal Expenditures
Since most of the electric cooking project participants reported saving money on charcoal (other
baseline fuels were utilized, but primarily fuel use was charcoal, so expenditures focused solely on
charcoal), they were asked about how they were planning on using those savings. The most popular
response was investing it in schooling either for themselves or for their kids. The second most popular
response was to invest in their own business. Now that some money is available, participants can buy
in greater bulk quantities for some products. One ice-cream maker mentioned how she can now
produce twice the amount of ice cream as she is able to buy more ingredients. This in turn, is helping
her generate extra revenue from her business.
Another interesting response was the ability to now buy more nutritive food. Some participants are
not putting aside the money they are saving for future use. Instead, some mentioned that they are
now able to buy better quality food like better meat cuts, more frequently. Many of those food
products were not within their financial capacity, but they can now afford it (Figure 25).
35Use of Savings from Electric Cooking
Improve my house 0%
10%
Save to buy the electrical cooking appliances 0%
5%
Save to buy electricity for cooking in the future 0%
5%
Is not saving 0%
5%
Undecided 13% Off-grid
0%
On-grid
Save for future 25%
10%
Schooling 25%
45%
Invest in business 13%
35%
Buy more food 25%
15%
0% 5% 10% 15% 20% 25% 30% 35% 40% 45% 50%
Figure 35 : Projected use of savings made during the electric cooking pilot project
Only a few challenges were mentioned by the electric cooking participants. The one that was
mentioned almost as often by the microgrid and the off-grid participants was related to the size of the
appliances and how that would in turn limit what they were able to cook with them. For instance, the
Simpot is a 6-quart pot and is well sized for a small nuclear family of 5 to 8 family members.
However, beyond that number, it can be challenging to prepare some Haitian meals with the Simpot.
One example is the rice and beans dishes (diri kole) which can be voluminous. Mashed breadfruit,
called “tom tom” was also mentioned as a difficult meal to prepare with the electrical appliances. The
breadfruits are normally boiled whole, and some families can boil up to 8 breadfruits at a time to feed
everyone. The Simpot is too small to contain this volume and the pots available to use on the induction
cooktop are also not big enough. For this meal, many participants go back to their traditional charcoal
stoves and aluminium pots.
Another disadvantage communicated by some participants was that the ferromagnetic pots which
were provided or available on the market in town or in the nearby towns were too thin. This would
sometimes result in food being burned for some meals. For instance, rice cannot be cooked without
risks of getting burned on the induction cooktop.
Another drawback of the system is how cooking can be disrupted if there is a power outage for the
microgrid participants (i.e. if there is not enough sun during the day and the batteries do not get the
chance to charge enough). Some of the off-grid participants for example keep a small amount of
charcoal in stock and have no choice but to go back to the traditional, outdoor kitchen to prepare food
on the charcoal stoves until the weather has improved sufficiently for the system to be operational
(Figure 26).
36Disadvantages of the electric cooking system
25%
Not adapted for all types of food
15%
13%
No appropriate, thicker pot
25%
Off-grid
On-grid
38%
Not big enough
45%
Cooking disruption during outages/ bad 63%
weather 15%
Figure 36 : Challenges of cooking with the electric cooking system
A deeper dive into the survey and specific narratives from participants can be seen in the Changing
the Narrative section below. Further, participant profiles for four participants can be seen in the
supporting annexes.
Tariffs and Cost
The research project offered free electricity for electric cooking to the participants in order to
prioritize actionable data for planning electric cooking. Even though there was an absence of a true
price signal and therefore data on demand elasticity for customers, we can still draw some insights
on what effective tariffs might be for electric cooking interconnected on EarthSpark’s microgrids. In
general, EarthSpark offers different levels of time varying prices to its customers depending on their
service level ranging from 25 htg/kWh – 60 htg/kWh. Currency fluctuation changes this range
substantially, but as of December 2020 this was equivalent to about 40 – 95 cents per kWh.
By dividing customer charcoal expenditure savings by the monthly electric cooking electricity
consumption, a range of indicative willingness to pay values are highlighted. Overall average
indicative willingness to pay was around 30.76 htg/kWh. However, 13 of our participants reported
an indicative tariff at or above existing EarthSpark tariffs and 4 customers highlighted extraordinarily
high economic value for the electric cooking (>100 htg/kWh). If the four high WTP customers are
removed indicative average WTP drops to 15 htg/kWh, which is still close to normal tariff range.
Some customers, however, did not report charcoal savings (or charcoal information at all) and some
reported very low savings (or high electric cooking usage which distributed those savings) which
resulted in very low to zero willingness to pay values. Many of those customers have charcoal
consumption or use (i.e. food service enterprises) that couldn’t fully be replaced by the electric
37You can also read