HEALTH CARE'S CLIMATE FOOTPRINT - HOW THE HEALTH SECTOR CONTRIBUTES TO THE GLOBAL CLIMATE CRISIS AND OPPORTUNITIES FOR ACTION
←
→
Page content transcription
If your browser does not render page correctly, please read the page content below
HEALTH CARE’S CLIMATE
FOOTPRINT
HOW THE HEALTH SECTOR CONTRIBUTES
TO THE GLOBAL CLIMATE CRISIS AND
OPPORTUNITIES FOR ACTION

                                    Health Care Without Harm
                                    Climate-smart health care series
                                    Green Paper Number One

                                    Produced in collaboration with Arup
                                    September 2019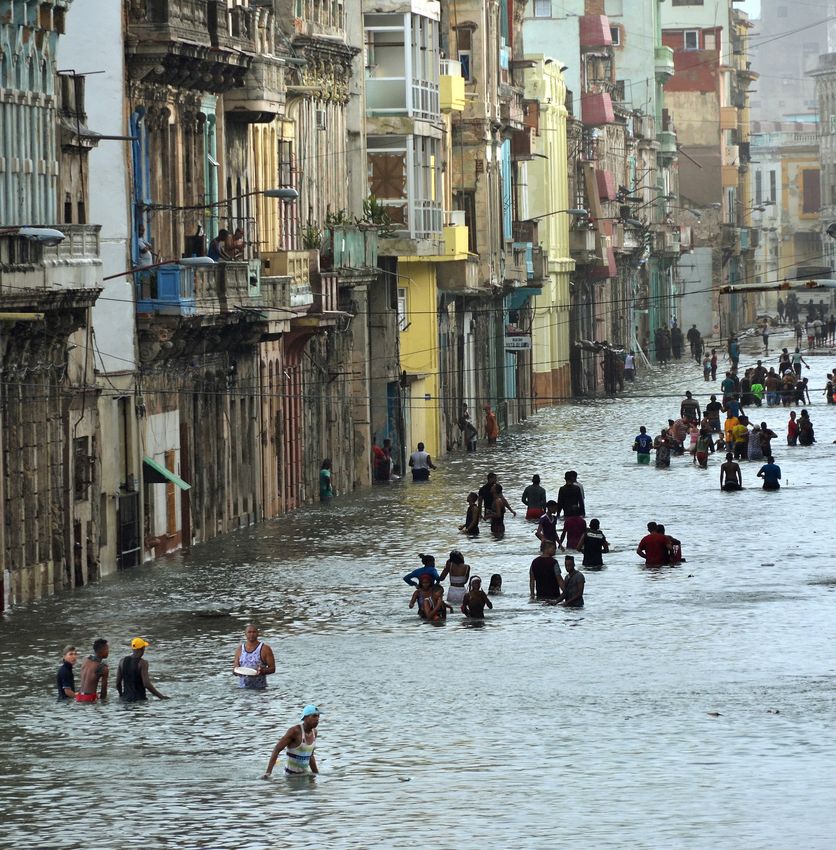
About this paper: This is the first in a series of research and        • Dr. Rosemary Kumwenda, Coordinator of the
policy papers Health Care Without Harm and its partners,                 United Nations informal Interagency Task Team on
including Arup, aim to produce over the next three years.                Sustainable Procurement in the Health Sector, United
The series will define health care’s climate footprint and               Nations Development Programme
outline a set of actions the sector can take to align itself with      • Dan Plechaty, Senior Associate, ClimateWorks
the ambition of the Paris Agreement while simultaneously                 Foundation (United States)
achieving global health goals. Future paper topics will                • Sonia Roschnik, Director, NHS England, Sustainable
include a global road map for health care decarbonization                Development Unit (SDU) (United Kingdom)
and resilience; strategies for national and sub-national               • Jonas Age Saide Schwartzman, Environmental
governments to develop and implement climate-smart                       Engineer, SPDM Health System (Brazil)
health care policies; decarbonizing the health care supply             • Dr. DongChun Shin, Professor, Department of
chain; recommendations for sustainable, climate-resilient,               Preventive Medicine and Director of the Institute for
decarbonized health development assistance; and more.                    Environmental Research, Yonsei University College of
                                                                         Medicine (Republic of Korea)
Authors:                                                               • Dr. Nick Watts, Executive Director, Lancet Countdown
Health Care Without Harm: Josh Karliner and                              on Health and Climate Change (United Kingdom)
Scott Slotterback                                                      • Chendan Yan, Research Analyst, World Resources
Arup: Richard Boyd, Ben Ashby, and Kristian Steele                       Institute (United States)

External scientific advisor: Dr. Peter-Paul Pichler, Social         Acknowledgements: In addition to those listed above, the
Metabolism & Impacts, Potsdam Institute for Climate Impact          project team would like to thank the following individuals
Research, Germany                                                   for their contributions, time, review and/or advice: Fiona
                                                                    Armstrong, Climate and Health Alliance, Australia; Ana
Technical advisory group: Health Care Without Harm                  Belluscio, Health Care Without Harm Global Team; William
established a Climate Measurement Technical Advisory                Clark, Health Care Without Harm Europe; Gary Cohen,
Group to guide the development of the methodology and               Health Care Without Harm; Kevin Conway, Health Care
other research for this and forthcoming studies, so as              Without Harm U.S.; Lindsey Corey, Health Care Without
to ensure accuracy and integrity; integration of aspects            Harm, U.S.; Mandeep Dhaliwal, UNDP; Mireia Figueras
unique to health care into climate footprint measurement;           Alsius, Health Care Without Harm Europe; Laura Gilbert,
alignment with best practices in the field of climate footprint     Arup; Benn Grover, Health Care Without Harm; Suvi Huikuri,
measurement; flexibility for regional differences in health         UNDP; Viktor Jósa, Health Care Without Harm Europe;
systems; and uptake by key stakeholders.                            Nick Knock, Health Care Without Harm U.S.; Lauren Koch,
                                                                    Health Care Without Harm U.S.; Aidan Long, Health Care
The advisory group, which met virtually at key moments              Without Harm Europe; Manfred Lenzen, University of
in the project’s development, is drawn from international           Sydney; Natalia Linou, UNDP; Rick Lomax, NHS England
organizations, health and health care institutions, climate         Sustainable Development Unit (SDU); Marina Maiero, World
organizations, and academic experts. Members include:               Health Organization; Dr. Peter Orris, University of Illinois,
                                                                    Chicago; Dr. Anne Owen, University of Leeds; Vital Ribeiro,
    • Andrés Alvarado, Head of Facilities Management,               Projeto Hospitais Saudáveis, Brazil; Antonella Risso, Health
      Hospital Clínica Bíblica (Costa Rica)                         Care Without Harm Latin America; Dr José Rueda-Cantuche,
    • Joe Bialowitz, National Environmental Program Leader,         European Commission; Ramon San Pascual, Health Care
      Kaiser Permanente (United States)                             Without Harm Southeast Asia; Sangwon Suh, University of
    • Anthony Capon, Professor of Planetary Health,                 California, Santa Barbara; Maria Sunyer Pinya, Arup; Imogen
      University of Sydney (Australia)                              Tennison, NHS England SDU; Elena Villalobos Pratts, WHO;
    • Dr. Diarmid Campbell-Lendrum, Climate Change and              Jennifer Wang, Health Care Without Harm Global Team;
      Health Team Leader, World Health Organization                 Susan Wilburn, Health Care Without Harm Global Team;
    • Sally Edwards, Regional Advisor, Pan American Health          Jessica Wolff, Health Care Without Harm U.S.; Zhao Ang,
      Organization/World Health Organization                        Rock Environment and Energy Institute, China.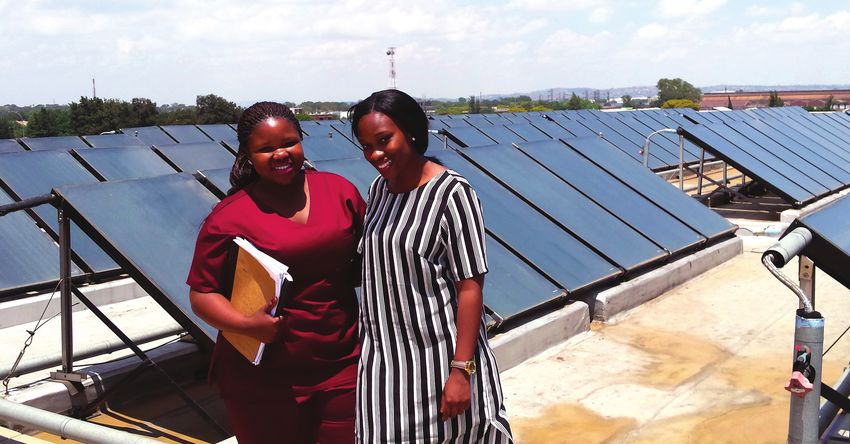
How the Health Sector Contributes to the Global Climate Crisis and Opportunities for Action

                                         Health Care Without Harm (HCWH) is an international NGO that seeks
                                         to transform the health sector worldwide so that it becomes ecologically
                                         sustainable and a leading advocate for environmental health and justice. Health
                                         Care Without Harm has worked for 23 years with the health care sector to
                                         reduce its use of toxic chemicals and generation of waste, while transforming the
                                         supply chain and fostering climate action.

                                         With offices in the United States, Europe, Asia; a regional team in Latin America;
                                         and country-level partnerships with national organizations in Australia, Brazil,
                                         China, India, South Africa, and Nepal; Health Care Without Harm is a leader in
                                         mobilizing the health care sector to realize this vision.

                                         Health Care Without Harm’s staff of health professionals, researchers, and
                                         advocates work with hospitals, health systems, governments, and international
                                         agencies to accelerate health care decarbonization, resilience, and climate
                                         policy leadership around the world. Health Care Without Harm’s Global Green
                                         and Healthy Hospitals Network has 1,200 institutional members across 60
                                         countries, all working to bring the health sector into the climate movement and
                                         expand their healing mission beyond the four walls of their facilities.

                                         Arup is the creative force at the heart of many of the world’s most prominent
                                         projects in the built environment and across industry. They offer a broad range of
                                         professional services that combine to make a real difference to their clients and
                                         the communities in which they work.

                                         Arup is truly global. From 89 offices in 34 countries, their 14,000 planners,
                                         designers, engineers, and consultants deliver innovative projects across the
                                         world with creativity and passion.

                                         Founded in 1946 with an enduring set of values, their unique trust ownership
                                         fosters a distinctive culture and an intellectual independence that encourages
Green pa·per                             collaborative working. This is reflected in everything they do, allowing them
/ɡrēn/ ˈpāpər/                           to develop meaningful ideas, help shape agendas, and deliver results that
                                         frequently surpass the expectations of clients.
1. An environmental health policy
   paper.                                The people at Arup are driven to find a better way and to deliver better solutions
                                         for clients.
2. A first-draft document on a
   specific policy area circulated       Health Care Without Harm would like to acknowledge support from the
   among interested parties who          Fast Start Fund of the Climate Works Foundation, the Swedish International
   are invited to join in a process      Development Cooperation Agency (SIDA) via UNDP, the Wallace Global Fund,
   of consultation and debate. The       and the MacArthur Foundation, which helped make this paper possible.
   objective of a green paper is to
   arrive at a general consensus
   before drafting the official policy
   document, the white paper.

                                                                                                                                   1
CONTENTS

    Executive summary     								                                                       4
1   Introduction											8
    Climate change is a health issue								9
    Health care’s climate impact									10
    This paper’s contribution									10
2   Study methodology										14
    Definition of the health sector									14
    Databases, applied information, and method architecture					                         15
    MRIO choice 											15
    Environmental extensions 									15
    National expenditure data 									16
    Presentation and reporting of results								16
    Study limitations 										18
3   Findings: Health care’s global climate footprint						                               19
    Health care is a major contributor to the climate crisis					                        19
    More than half of health care’s footprint comes from energy use 				                 19
    Health care’s climate footprint generally reflects overall 					                     22
     national emissions patterns
    Decarbonizing health care’s supply chain is critical						                           28
    Fossil fuel combustion is at the heart of health care’s climate footprint			         28
    Health care spending and the sector’s growth is an important factor in emissions		   29
    Significant data gaps remain									32
4   Policy recommendations									34
    Health care’s responsibility									34
    Six action areas for climate-smart health care							                                34
        Action 1: Reduce health care’s climate footprint now 					34
        Action 2: Support a societal transition to clean, renewable energy			            36
        Action 3: Chart the course for zero emissions health care by 2050			36
        Action 4: Make development assistance for health climate-smart			37
        Action 5: Establish and implement government action plans for 			38
                 climate-smart health care
        Action 6: Deepen research on health care and climate change 			39
5   Final words											40

2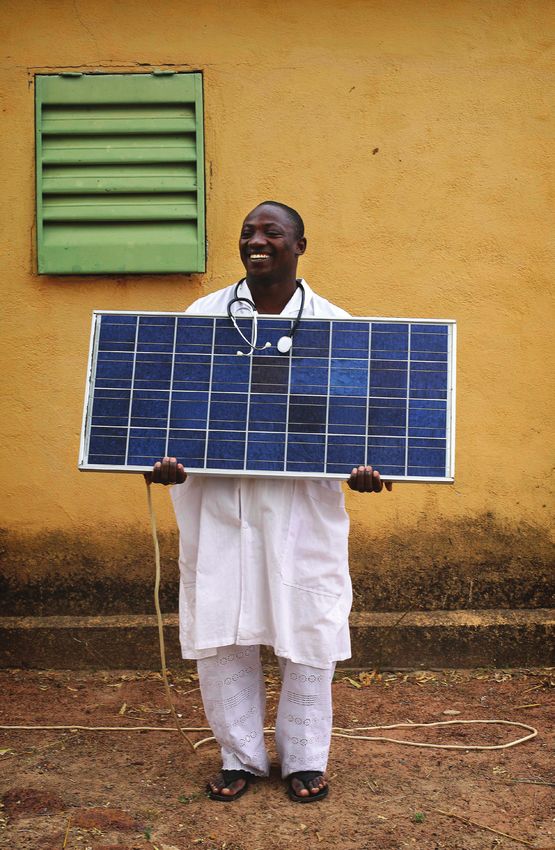
APPENDICES
                                  How the Health Sector Contributes to the Global Climate Crisis and Opportunities for Action

  Appendix A
  Tabulated national health care emissions for the 43 WIOD countries available at:
  www.noharm.org/ClimateFootprintReport

  Appendix B
  Detailed methodology available at www.noharm.org/ClimateFootprintReport

  Appendix C
  Country snapshots available at www.noharm.org/ClimateFootprintReport

                                                                                                                           3
EXECUTIVE SUMMARY

    THIS PAPER
• Establishes the first-ever global estimate of health care’s climate footprint.
• Is based on full global coverage of spending data, together with detailed information from 43 countries.
• Identifies key sources of health care emissions while allowing for a comparison between nations and among
    many regions of the world.
• Makes a set of recommendations to align global health goals with global climate goals.

    KEY FINDINGS

    Health care’s global climate footprint
      • The health sector, whose mission is protecting and promoting health, makes a major contribution to the
        climate crisis — the greatest health threat of the 21st century — and therefore has an important role to play
        in resolving it.
      • Health care’s climate footprint is equivalent to 4.4% of global net emissions (2 gigatons of carbon dioxide
        equivalent).
      • The global health care climate footprint is equivalent to the annual greenhouse gas emissions from 514
        coal-fired power plants.
      • If the health sector were a country, it would be the fifth-largest emitter on the planet.

Top health care emitters
      • The top three emitters, the United States, China, and collectively the countries of the European Union,
        comprise more than half the world’s total health care climate footprint (56%).
      • The top ten health care emitters make up 75% of the global health care climate footprint.
      • The United States health sector, the world’s number one emitter in both absolute and per capita terms,
        produces 57 times more emissions per person than does India.
      • While India has the seventh-largest absolute health sector climate footprint, it has the lowest health-related
        emissions per capita of all 43 nations considered in detail in this study.
      • China’s health sector produces six times more greenhouse gases per person than India’s does. But China’s
        health system also emits one-seventh the greenhouse gases per capita as that off the United States, one-
        third that of Korea and just under one-half per capita that of the European Union.

                       “Health care’s climate footprint is
                  equivalent to 4.4% of global net emissions”

4
How the Health Sector Contributes to the Global Climate Crisis and Opportunities for Action
Sources of health care’s climate footprint
• While vastly differing in scale, each nation’s health sector directly and indirectly releases greenhouse gases
while delivering care and procuring products, services and technologies from a carbon-intensive supply chain.
• Health care contributes to greenhouse gas emissions through energy consumption, transport, and product
manufacture, use, and disposal.
• Emissions emanating directly from health care facilities and health care owned vehicles (Scope 1) make up 17%
of the sector’s worldwide footprint.
• Indirect emissions from purchased energy sources such as electricity, steam, cooling, and heating (Scope 2)
comprise another 12%.
• The lion’s share of emissions — 71% are primarily derived from the health care supply chain (Scope 3) through
the production, transport, and disposal of goods and services, such as pharmaceuticals and other chemicals,
food and agricultural products, medical devices, hospital equipment, and instruments.
• Three-quarters of all health care emissions, including from its supply chain, are generated domestically. This
means roughly one-quarter of all health care emissions are generated outside of the country where the health
care product is ultimately consumed.
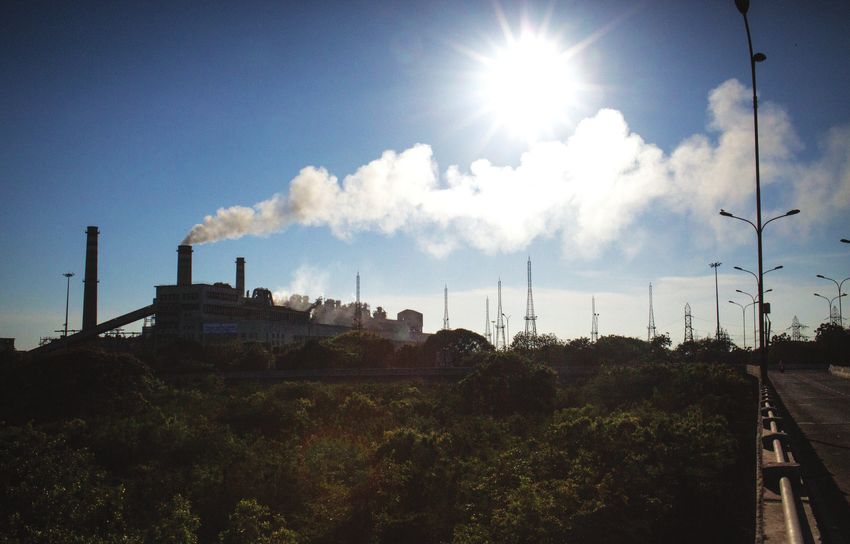
• Fossil fuel consumption is at the heart of health care’s emissions. Energy — primarily the combustion of fossil
fuels — makes up well over half of health care’s climate footprint when measured across all three scopes.
Health care’s footprint is linked to health spending
• There is a strong but not absolute correlation between a country’s health sector climate footprint and a
country’s health spending. Generally, the higher the spending, measured as percentage of a country’s GDP,
the higher the per capita health care emissions are in that country.
• Other factors are also critically important, particularly the energy intensity of a country’s economy and the
emissions intensity of its energy system.
• If health sector growth and investment is coupled with a new trajectory to zero emissions, health care’s
climate footprint can decrease significantly even as health spending grows. Such a scenario can link health
sector development goals such as universal health coverage with global climate targets.
NEXT STEPS
The health sector must take responsibility for its climate footprint
• Health care must respond to the growing climate emergency not only by treating those made ill, injured,
or dying from the climate crisis and its causes, but also by practicing primary prevention and radically
reducing its own emissions.
• Health care climate action that aligns with the ambition of the Paris Agreement will require health sector
facilities, systems, and ministries to work with manufacturers and suppliers of health care goods and
services to achieve net zero emissions by 2050 or before.
• The sector must undertake this effort while simultaneously meeting global health goals such as universal
health coverage and working to achieve the Sustainable Development Goals.
• Several health systems in multiple countries are already leading the way toward decarbonization, serving
as models for the sector.
5
EXECUTIVE SUMMARY

    SIX ACTIONS FOR CLIMATE-SMART HEALTH CARE

                Reduce health care’s climate footprint now. Actors at all levels in the health sector
     Action 1   can build on the ongoing work of thousands of hospitals and health systems already
                addressing their climate footprint to forge parallel and related paths toward net zero
                emissions. Key steps can be based on the Greenhouse Gas Protocol and should include:

                Scope 1: Take immediate          Scope 2: Invest in               Scope 3: Set and implement
                action to reduce health care     and advocate for the             criteria for low-carbon or zero-
                facility emissions.              decarbonization of local and     emissions procurement so as
                                                 national energy systems and      to begin to decarbonize the
                                                 the implementation of clean,     supply chain.
                                                 renewable energy.

                Support a societal transition to clean, renewable energy. The health sector in
     Action 2   every country should advocate for a rapid phase-out of fossil fuels and a transition to clean,
                renewable energy so as to help move health care energy consumption to net zero emissions
                while also protecting public health from both local pollution and global climate impacts.

                Chart the course for zero emissions health care by 2050. A coherent global
                road map is necessary to identify key pathways forward, while establishing timelines and
     Action 3   frameworks for action. The road map should be based on principles of global equity for
                climate and health, a unified, climate-smart approach to mitigation and resilience, and an
                approach that fosters action at all levels.

                Make development assistance for health climate-smart. Bilateral aid agencies,
                multilateral development banks, other health funding agencies, and philanthropies should
     Action 4   integrate climate-smart principles and strategies into their health aid, lending, and policy
                guidance for developing countries. Those funding climate mitigation and adaptation should
                integrate health into their programs. This should be undertaken in alignment with the
                outcomes of the UN Secretary General’s 2019 Climate Action Summit.
                Establish and implement government action plans for climate-smart health care.
                National and sub-national governments should build on existing initiatives to establish action
     Action 5   plans to decarbonize their health systems, foster resilience, and improve health outcomes.
                Implementation should contribute to government climate policy and nationally determined
                contributions to the Paris Agreement. The countries most responsible for the problem should
                lead the way.
                Deepen research on health care and climate change. Further research is necessary
                to better understand trends in the interplay of health care and climate change, including
     Action 6   an analysis of the future trajectory of health care emissions, in-depth analysis of the supply
                chain and its climate impact, national and sub-national level health care climate footprinting,
                economic and health analysis of the costs and benefits of transitioning to climate-smart
                healthcare, and more.

6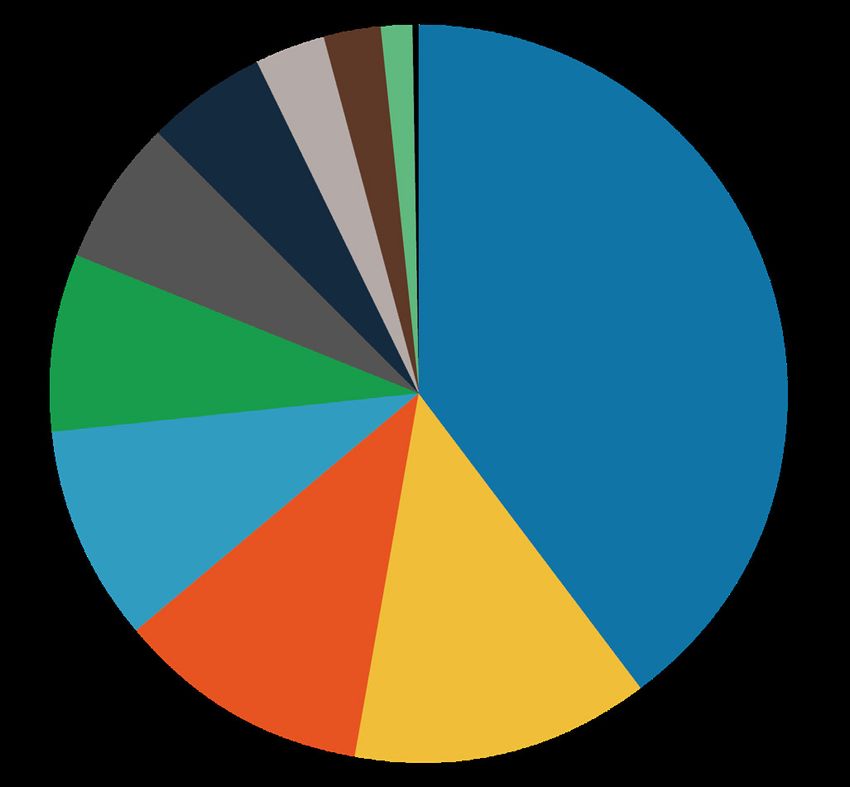
How the Health Sector Contributes to the Global Climate Crisis and Opportunities for Action

CONCLUSION

  • Health, as with every sector of society, has the responsibility to align its actions and development trajectory
    with the Paris Agreement in order to stave off the worst impacts of climate change.

  • Given its mission to protect and promote health, the sector also has a responsibility to implement the
    Hippocratic Oath to “first, do no harm” as it relates to its own climate footprint, while influencing other
    sectors to do the same.

  • Health investment and policy must be retooled to support decarbonization. If the health sector — individual
    health facilities, health systems, ministries of health, international and bilateral development agencies, and
    private health care organizations — all take action toward this goal, it can be achieved.

  • If health care development, growth, and investment can align with global climate goals, the 10% of
    the world economy that health care represents, together with its political influence at every level of
    government, can help provide leadership for a low-carbon, climate-smart, more equitable, and
    healthier future.

                                                                                                                               7
INTRODUCTION

In October 2018, the Intergovernmental Panel on                                                       This stark and urgent message from the world’s
Climate Change (IPCC) issued an alarming report                                                       leading climate scientists, together with a relentless,
which found that staving off the worst impacts of                                                     ongoing assault of extreme weather and other climate
climate change by limiting global warming to 1.5°C, the                                               impacts around the world today, presents a clarion
ambition of the Paris Agreement, would “require rapid,                                                call for a rapid transformation of the global economy
far-reaching and unprecedented changes in all aspects                                                 to a low-carbon, and ultimately zero-emissions future.
of society.”                                                                                          It has spurred a growing number of institutions and
                                                                                                      jurisdictions to declare a “climate emergency.” For
Such thoroughgoing change, according to the IPCC,                                                     instance, at the time of publication, nearly 900 local
would need to include transitions in land, energy,                                                    governments in 18 countries had declared climate
industry, buildings, transport, and cities, that reduced                                              emergency and committed to action to rapidly reduce
global net human-caused emissions of carbon dioxide                                                   emissions.2
(CO2) “by about 45% from 2010 levels by 2030,
reaching ‘net zero’ around 2050”.1                                                                    This paper focuses on how the health sector, which
                                                                                                      sits on the front lines as a first responder to climate
                                                                                                      change, also makes a heretofore little recognized but
                                                                                                      significant contribution to the problem. The paper
“Health sector facilities are the operational                                                         argues that health care must respond to the climate
    heart of service delivery, protecting                                                             emergency not only by treating those made ill, injured,
                                                                                                      and dying from the climate crisis and its causes, but
 health, treating patients, and saving lives.                                                         also by practicing primary prevention by radically
    Yet health sector facilities are also a                                                           reducing its own emissions.
 source of carbon emissions, contributing
   to climate change. The world’s health                                                              Despite its clear identity as a cohesive sector
                                                                                                      of society with a robust private dimension and
   sector facilities churn out CO2 through                                                            governance bodies at local, national and global levels
    the use of significant resources and                                                              — a sector that collectively spend $7.2 trillion annually
energy-hungry equipment. This is perhaps                                                              or 10% of world GDP3 — health care’s emissions
                                                                                                      footprint has been largely ignored by those addressing
   ironic — as medical professionals our                                                              climate change over the past quarter century. The
commitment is to ‘first, do no harm.’ Places                                                          health sector itself has paid scant attention until
 of healing should be leading the way, not                                                            recently.
   contributing to the burden of disease.”
                                                                                                      This paper takes the most comprehensivea look at
                                                                                                      health care’s climate emissions to date in order to
          - Tedros Adhanom Ghebreyesus,                                                               build an understanding of where the problem comes
           Director General, World Health Organization                                                from so that this challenge can be tackled not only
                                                                                                      without compromising the quality of care, but by
                                                                                                      potentially improving it. The paper identifies a path
                                                                                                      forward that can empower health systems, ministries,
                                                                                                      multilateral and bilateral health lenders and donors,
                                                                                                      together with suppliers and manufacturers of health
                                                                                                      goods and services, to begin to take cost-effective,
                                                                                                      urgent action to move toward net zero emissions in
                                                                                                      order to protect public health from climate disruption.

    a. Global spending data together with detailed information on 43 countries provides global coverage that allows for a comparison among nations and many regions of the world.

8
How the Health Sector Contributes to the Global Climate Crisis and Opportunities for Action
Climate change is a health issue disrupt core public health infrastructure and overwhelm
health services.”6
Climate change is damaging human health today and
will have a greater impact in the future. The Lancet Hospitals, health centers, and public health workers are
has called it the “biggest global health threat of the first responders to the health effects of climate change.
21st century.”4 Hospitals and health systems will inevitably bear high
costs resulting from the growing number of extreme
Direct climate impacts, such as the spread of vector- climate events and must become resilient to climate’s
borne disease, increased heat, drought, severe impacts. Some of the poorest health systems in the
storms, and flooding as well as the mass migration world are often some of the most vulnerable both in
of climate refugees, have health consequences that harm’s way and without tools and resources to protect
will disproportionately affect the most vulnerable and themselves.
marginalized populations and increase in intensity over
time (Figure 1). At the same time, the main driver of climate change
— fossil fuel combustion — is causing major health
All countries will experience significant and growing problems now, contributing to air pollution that
health impacts from climate change. Low- and middle- prematurely kills more than seven million people a year,
income countries will see the worst effects as they are roughly twice as many people as HIV AIDS, Malaria,
most vulnerable to climate shifts and least able to adapt and TB combined.7 Air pollution also makes a major
given weak health systems and poor infrastructure. contribution to long-term chronic diseases that require
Climate change could drag more than 100 million treatment and hospitalization, which in turn contributes
people back into extreme poverty by 2030 with much to increased health sector spending and emissions. This
of this reversal attributable to negative impacts on is linked with inequity as more than 80% of premature
health.5 deaths attributed to non-communicable diseases occur
in low- and middle-income countries. The worst effects
The “lack of progress to date in reducing emissions and and causes of climate change can be prevented, and
building adaptive capacity threatens” not only “human such prevention presents a significant opportunity to
lives and the viability of the national health systems simultaneously improve health outcomes and increase
they depend on,” according to the Lancet Countdown health equity.8
on Health and Climate, but also has “the potential to
Injuries, fatalities, mental Asthma, cardiovascular disease
health impacts
Heat-related illness and
death, cardiovascular Malaria, dengue, exephalitis,
failure hantavirus, Rift Valley Fever, lyme
disease, chikungunya,
West Nile virus
Forced migration,
civil conflict, Respiratory allergies, asthma
mental health impacts
Malnutrition, Cholera, cryptosporidiosis,
diarrheal disease campylobacter, leptospirosis,
harmful algal blooms
Figure 1: Impact of climate change on human health (Source: U.S. Centers for Disease Control and Prevention)
9INTRODUCTION
Health care’s climate impact The study found that reducing the energy used for
hospital cooling and refrigeration by 30% could abate
While vastly differing in scale, each nation’s health ~110 Mt CO2e per year currently, equivalent to installing
sector directly and indirectly releases greenhouse 27,400 wind turbines.15
gases (GHG) while delivering care and procuring
products, services, and technologies from a carbon- In 2019, an in-depth study by Pichler et. al. published
intensive supply chain. Health care contributes to in Environmental Research Letters examined
carbon emissions through energy consumption, all Organization for Economic Cooperation and
transport, and product manufacture, use, and disposal. Development (OECD) countries (minus Chile), plus India
and China. It found that the health care sectors of the
Indeed, the health sector, which comprises 10% of 36 countries sampled combined were responsible for
world GDP and is dedicated to preventing, treating, and 1.6 GtCO2e emissions or 4.4% of the total emissions
healing disease, cuts across many of the categories from these nations in 2014. Their study provides the first
often associated with climate footprint measurement. comparable estimates of CO2 emissions of health care
Yet until recently it has not been measured as a across a large group of nations that comprise 54% of
coherent segment of the world’s climate footprint. the world’s population and 78% of world GDP.16
In recent years, comprehensive health care climate
footprint measurements were undertaken in a few This paper’s contribution
countries. Two studies in the United States found the
country’s health care emissions to alternately have Until recently, both the health sector and the
reached 8%9 and 9.8% of the national total respectively, climate community have had limited awareness
with the latter estimate comprising 655 million metric of the significant contribution the sector makes to
tons of carbon dioxide equivalent (CO2e).10 In the greenhouse gas emissions, and with it the need to
United Kingdom, the National Health Service (NHS) take thoroughgoing action to align health care with the
and Public Health England estimated the health and ambition of the Paris Agreement. This report, together
social care climate footprint in England in 2017 to be with other emerging research, provides baseline
27.1 Mt CO2e, representing around 6.3% of the country’s information that can inform a pathway to health care
climate footprint.11 Similar studies had comparable decarbonization via sector-wide action. The areas of the
findings in Australia (7%)12 and Canada (5%).13 report’s groundbreaking findings include the following:
Until recently, no one had undertaken a comprehensive Global estimate: This report establishes the first-
global study of health care’s emissions. In 2017, the ever detailed estimate of health care’s global climate
World Bank, in collaboration with Health Care Without footprint. It makes several contributions to the world’s
Harm, published an estimated calculation which found understanding of the extent of health sector emissions
that the health care sector generated 2.6 billion out of and their sources. In doing so it builds on the growing
the 52 billion metric tons of CO2e globally emitted in base of knowledge of health care’s climate footprint.
2011 — or 5% of global emissions.14
This paper also goes further than previous work in
In 2018, the Kigali Cooling Efficiency Program (K-CEP) terms of number of countries covered in detail and
published a study on global emissions from cooling number of greenhouse gases considered. The World
in health care. It found that globally, roughly 365 Mt Input-Output Database (WIOD) database was employed
CO2e (+/- 90 Mt) annually comes from energy used and covers all remaining countries in the world, albeit
to provide hospital cooling. This is equivalent to the with much less detail. This has allowed us to produce a
emissions from over 75 million cars on the road or 110 global estimate with reasonable confidence (Section 2 -
coal power plants for an entire year. The study did not Study methodology).
take into account harmful F-gases (HFCs, HCFCs) used
in cooling, which would make the number even higher.
10How the Health Sector Contributes to the Global Climate Crisis and Opportunities for Action
The study breaks down the estimate in several ways, and country estimates will differ from, for instance,
including looking at both absolute and per capita health a hospital’s estimate of its scopes, in that this study
sector emissions by country and region, as well as covers the entire health sector and therefore includes,
correlations between health care spending and sector for instance, health care insurance providers or retail
emissions by country. outlets for medical devices. (See Appendix B for further
details.)
Regional estimates: The study has developed an
approach that allows us to reasonably disaggregate Country estimates broken down by scope: The study
health care’s climate footprint for world regions provides five sample country estimates based on GHG
where sufficient data exists. Thus, it provides regional Protocol scopes. Similar analyses for all 43 countries are
estimates for East Asia and the Pacific (and within available online in supplemental material. It is important
that, ASEAN countries), Europe and Central Asia (and to note that the health care climate footprint estimates
within that, the European Union), Latin America and the in this report may differ from the handful of national
Caribbean, and South Asia. studies that have been carried out. National studies
have access to more precise and granular data at a
A particular focus in this paper is given to the European country level, which can facilitate a more specific level
Union as a political union that is forging a collective of reporting, while this study is using a global database
political response to the climate crisis. It has set block- to produce a global estimate, as well as a series of
wide goals which drive action on a national level, and national estimates based on that data.
therefore this study considers the EU as an entity when
making comparisons with major emitters such as the Analysis by economic sector: The study has traced
United States, China, and other nations. (Specific data health care’s climate footprint back to the original
for all 28 EU countries is available in Appendix A) emissions sectors covered in the WIOD database. This
has allowed for a wide-angle snapshot of most sources
Given lower data quality for the countries of Africa and of the health care sector’s emissions, including energy,
the Middle East collected by our chosen database, transportation, agriculture, pharmaceutical production,
we elected not to report regional results for these and more.
important parts of the world; subsequent updates to this
methodology and footprint will seek to address this gap. Anesthetic gases and metered-dose inhalers: While
limited by the use of data from only 31 countries, the
Alignment with the Greenhouse Gas Protocol: The study generates a conservative estimate of the climate
report breaks down global emissions according to impact of anesthetic gases — highly potent greenhouse
the framework established by the Greenhouse Gas gases — and metered-dose inhalers, which use them.
Protocol, the world’s most widely used greenhouse Due to different data sources, these estimates are not
gas accounting standards. It aligns World Health included in the overall global estimate of health care’s
Organization (WHO) health sector definitions with an footprint, but are in addition to it.
emissions analysis organized by the categories of
Scope 1 (direct emissions from health care facilities), Research agenda: The study identifies a number of
Scope 2 (indirect emissions from purchased energy), areas where further research and methodological
and Scope 3 (all indirect emissions, not included in development can help support the sector in its efforts to
scope 2, that occur in the value chain, including both understand and address its climate footprint.
upstream and downstream emissions).
Policy recommendations: Based on the findings, the
This aligns the health care sector estimate with the study sets forth a group of recommendations based
same framework being used by many other sectors, on our growing knowledge of the important role that
sub-national and national governments, and health care health care plays in relation to climate change, along
systems and facilities. It is important to note that the with the imperative of the sector to align with the Paris
proportions attributed to the three scopes in the global Agreement and meet its sustainable development
goals.
11Health care taking climate action Several health care institutions in multiple countries are already leading the way toward decarbonization. These hospitals and health systems in both developed and developing countries are serving as models by implementing a set of actions to reduce their climate footprint and/or become carbon neutral, while also building resiliency and taking leadership action. The following are some examples. There are many more. The Health Care Climate Challenge:54 Launched in 2015 at the Paris Climate Conference, the Health Care Climate Challenge is a Health Care Without Harm initiative to mobilize health care institutions around the world to play a leadership role in addressing climate change. The Challenge and its pledge, which institutions sign to participate, are based on the three pillars of mitigation, resilience, and leadership. To date, more than 190 institutions representing the interests of over 18,000 hospitals and health centers from 31 countries, have joined the Challenge and committed to taking action. Participants range from small health centers to large health systems. So far, together they have committed to reducing emissions by 30 million metric tons. 100% renewable electricity: In 2018, as part of the Challenge, Health Care Without Harm began collecting commitments from health care facilities around the world to target using 100% renewable electricity. To date, 21 institutions in 12 countries have signed on and in doing so are raising the bar for sustainable health care on every continent. In making this commitment, health care is joining thousands of cities,55 companies,56 higher education,57 and other organizations making similar commitments as part of a worldwide effort to accelerate the transition from dependence on fossil fuels to an economy based on clean, renewable energy such as wind and solar. When fully implemented, these 21 institutions will collectively be serving over 23 million patients per year at health care facilities powered by 3.3 billion kilowatt hours of renewable electricity. In doing so, they will have reduced their aggregate annual GHG emissions by over 1 million metric tons of CO2e. 12
How the Health Sector Contributes to the Global Climate Crisis and Opportunities for Action

Health care climate action by region

Europe: England’s NHS reduced the health and social care climate footprint — including Scopes 1, 2, and 3 – by 18.5% since
2007. Its goal is to comply with the country’s Climate Change Act, which sets a requirement of reducing the footprint further
so that United Kingdom achieves a 34% reduction by 2020 and an 80% reduction by 2050.58 There are other outstanding
local and regional examples in Europe, particularly in Scandinavia and the Netherlands, where zero emissions hospital
buildings, increasing organizational commitments to carbon neutrality, innovative climate-smart technologies, and strategies
to address supply chain emissions are being adopted in the sector.59

North America: In the United States, where, arguably the most work needs to be done, several major health systems are
moving toward decarbonization in Scopes 1 and 2. For example, Kaiser Permanente, one of the largest U.S. non-profit
health systems, is committed to being carbon net positive by 2025; the University of California Health System has set a goal
of 2025 for carbon neutrality; and Cleveland Clinic aims to be carbon neutral by 2027.60 Several Canadian health systems
are also committed to carbon neutrality.

Latin America: In Latin America more than 175 hospitals in Argentina, Brazil, Chile, Colombia, and Costa Rica, working in
collaboration with Health Care Without Harm’s Global Green and Healthy Hospitals Network, have calculated their climate
footprints and are making reduction commitments.

Africa: In Africa, the Mohammed VI University Hospital has set the target of 100% renewable electricity by 2030. They will
achieve this through investments in on-site solar and geothermal energy. In Zimbabwe, UNDP’s Solar for Health Program
has installed solar arrays to power more than 400 health centers, facilitating quality care, cutting costs and building
resiliency with zero emissions. In South Africa, Netcare, a private health system, has a target to reduce their emissions
by over 35% by the year 2023. Solar energy is a key component of this effort. They currently have solar panels providing
10MW of power with plans for further expansion.

Asia: In South Korea, Yonsei University Severence Hospital has committed to a 30% reduction of carbon emissions by
2020, equal to nearly 12,000 metric tons of CO2e. In India, the Chhattisgarh State Renewable Energy Development Agency
(CREDA) and State Health Department have collaborated to install, operate and maintain solar PV systems in 900 health
centres and district hospitals, reducing their carbon footprint while building resiliency. Many other Indian large hospitals
and small health centers are also pursuing climate-smart strategies. Similar initiatives exist across South East Asia. And in
Nepal, Kirtipur Hospital and Tilganga Institute of Ophthalmology have both committed to powering their facilities on 100%
renewable electricity. This will allow them to dramatically reduce their climate footprint while providing consistent care in
Nepal where the electrical grid is unstable and prone to black outs.

China has formulated numerous regulations and plans at the national to provincial and municipal levels, focusing on
energy conservation in public institutions within which healthcare is one of the major sectors. For instance, in 2016,
Beijing Municipal Health and Family Planning Commission issued The Plan of Action for Energy Conservation and Carbon
Reduction in the 13th Five-Year (2016-2020) Plan of Beijing Healthcare Institutions, setting a goal for the healthcare
institutions’ energy consumption reduction. In this context several Beijing hospitals have achieved significant carbon
emission reductions by conducting green building retrofits, improving energy management and constructing new buildings
by following new for Green Hospital Building hospital standards.

Climate action in the global supply chain: Some supply chain companies, such as Johnson & Johnson and Philips, have
committed to 100% renewable electricity in their operations by 2050 or earlier. UNDP and Health Care Without Harm
are developing criteria for low carbon health procurement that can mobilize health sector demand for zero emissions
products.61

                                                                                                                                  13
STUDY METHODOLOGY
The purpose of this study was to calculate the climate climate emissions of national, regional, and sectoral
footprint of the global health care sector. A climate level activities of the economy.
footprint covers emissions of carbon dioxide, methane
and nitrous oxide gases associated with the activities A full description of methodology taken in this study
of a sector or organization, and provides a more including the MRIO approach, applied data and
comprehensive measure of its contribution to climate reporting structures can be found in Appendix B.
change than a carbon footprint alone.
The method for calculating the climate impact of a Definition of the health sector
studied system generally consists of multiplying the
units of output of the system (i.e. quantity of activity To define study boundaries and create definition
it undertakes) by the amount of carbon associated for what should be included in the assessment of
with that unit of output (i.e. carbon intensity). This can the global health care sector carbon emissions, it
be done at multiple scales ranging discrete product was important to apply a definition for the sector.
supply chains, whole organizations, sectors of the The World Health Organization’s definition of the
economy, or even geographic regions or nations. health sector was applied because it is commonly
recognized and is aligned with useful published and
Almost all activities in the global economy have available data. It defines the health sector as: “all
some level of emissions associated with them. organizations, institutions, and resources that are
Economic systems such as health care are also highly devoted to producing health actions. A health action
interconnected with supporting sectors and through is defined as any effort, whether personal health care,
regional and multi-national supply chains. This means public health service or inter-sectoral initiative, whose
the real complication that comes with calculating a primary purpose is to improve health.”
climate footprint, is that of sourcing data (activity and
carbon intensity), tracking impacts through the value Using the WHO definition as a foundation, the study
chain, and using appropriate accounting methods combined this with the OECD health statistics reported
to accurately attribute impacts across connected in the System of Health Accounts (SHA) 2011 (co-
systems. published by the OECD, Eurostat, and WHO), and its
allocation of health care activities across the global
Multi-Region Input-Output (MRIO) modelling offers a economy and the reported expenditures in those
powerful methodology for doing this. It is a particularly activities within the MRIO. This created a method for
useful tool since it avoids truncation errors that can determining the scale of activities across the global
occur due to insufficient data or as a consequence of health care sector and for producing climate footprint
the complexity and connectedness of supply chains. assessment outputs aligned with health care sector
definitions.
MRIO harnesses economy Input-Output (IO) tables,
which detail the trade flows and transactional
quantities between sectors in an economy. Through
combining national IO tables, a model for global trade
split by sector and nation is constructed to create a
MRIO table, capturing economic flows across borders
and sectors. Such tables, paired with carbon emissions
data, can then be used in environmentally extended
MRIO (EE-MRIO) analyses to evaluate the links
between economic activity and resource use, including
greenhouse gas emissions.17 With refinements to
approach, EE-MRIO tables can be used to estimate the
14How the Health Sector Contributes to the Global Climate Crisis and Opportunities for Action
METHODOLOGY RESULTS
WIOD IO database – capturing
the global trade relationships
Total CO2, CH4, and N2O
emissions intensities for all
WIOD categories
Environmental extensions and
Global and national
PRIMAP emissions data
health care climate footprints
Mapped OECD/WHO
expenditure data presented in
WHO health sector definition, WIOD sector breakdowns
OECD/WHO health care
expenditure data Concordance / mapping process
based on Pichler et al. (2019)18
Figure 2: Methodology architecture for HCWH global health sector climate footprint
Databases, applied information, and method Environmental extensions
architecture
The WIOD dataset provides a detailed environmental
In developing the study method, a range of choices extension (EE) covering carbon dioxide emissions
and database decisions were required. These for all nations and sectors.20 Unfortunately, other
are examined below covering the choice of MRIO GHGs are not included in the EE, so a customised
database, environmental extensions, and national approach to including these emissions was required.
account expenditure data on health care. Taken The Greenhouse Gas Protocol lists six classes
together the methodology applied is summarized in of greenhouse gas to be included in footprinting
Figure 2. calculations:
• carbon dioxide
MRIO choice • methane
• nitrous oxide
This study was conducted using the World Input- • hydrofluorocarbons (HFCs)
Output Database (WIOD), a global MRIO model funded • perfluorocarbons (PFCs)
by the European Commission.19 WIOD provides a full • sulphur hexafluoride (SF6)
model of global trade, using a consistent 56-sector
definition to describe the economies of 43 nations After carbon dioxide, the main contributors to global
in detail, with an aggregated rest-of-world (ROW) warming are methane and nitrous oxide. These
category ensuring full global coverage. It is a highly gases were added to our methodology by allocating
regarded model, which has been widely used and emissions reported in the PRIMAP emissions database
validated in literature. WIOD was chosen over other to WIOD categories. This approach allowed us to
database options due to its robust methodology, as incorporate virtually all global methane emissions
well as its sectoral and geographical resolution. and over 93% of global nitrous oxide emissions into
the model. Collectively carbon dioxide, methane, and
nitrous oxide accounted for over 98% of global GHG
emissions in 2014.21
15STUDY METHODOLOGY
National expenditure data Presentation and reporting of results
The concordance process used to map expenditures The reporting of climate change impacts requires
is widely adopted and documented in the literature12, 18. careful presentation so that the language used, and
Health expenditure data was used to ensure alignment the systems and scopes applied are familiar to the
between sector boundaries and the definition of the intended audience and users of the information.
health care sector by WHO. National expenditure The study reporting is framed by three general
data was mapped onto WIOD categories using a perspectives including the:
concordance matrix between WHO and WIOD sector • World Input Output Database (WIOD) structure
definitions. The theory behind this process is set out in and economy sectors
the supplementary information to the study by Pichler
• Structure of the WHO System of Health
et al.22. Detailed descriptions of the WIOD sector
definitions21 and of the WHO expenditure categories23 Accounts (SHA)
were used to ensure consistent mapping of • Greenhouse Gas Protocol (GHGP) Scope 1, 2, and
expenditures. Further detail on the health expenditure 3 categories
data for each nation and region in WIOD is available in The GHGP scope categories are a widely applied
Appendix B. and common framework (also in the health sector),
for the allocation and reporting of GHG emissions of
organizational and supply chain settings (Figure 3).
Figure 3: Greenhouse Gas Protocol Scopes 1, 2, and 3. (Source: Greenhouse Gas Protocol)
16How the Health Sector Contributes to the Global Climate Crisis and Opportunities for Action
SHA Health Care Providers
Hospitals Long-term Ambulatory Ancillary Retailers Preventative Admin + Care given Providing
care care services care finance at home care to non-
residents
Total Emissions from Sector – segmented by WIOD production categories
Scope 1
Scope 2
Scope 3 = Total – Scope 1 – Scope 2
Figure 4: Approach taken for mapping emissions to GHGP Scope 1, 2, and 3 categories from the SHA and WIOD climate footprint assessment model
It was important to have a means to translate the The audience for this paper is wide ranging and
study results based on the WIOD and SHA structures includes those across the health sector value chain.
into a form consistent with the GHGP scopes. The Its particular focus is to support the development
approach developed for this framing of outputs of strategic and policy direction for health systems’
involved a mapping of the SHA to the Scope 1, 2, climate action. In its findings, the reader will find
and 3 categories through the economy sectors in results presented to both the WIOD and GHGP scopes.
the WIOD. Further description of this can be found in This should provide sufficient balance between
Appendix B, including a summary of how the GHGP understanding the key emission sources (via WIOD)
scope definitions were interpreted into the health care and the reporting categories (via GHGP) commonly
sector’s specific activities. A summary of this mapping used for communicating and presenting climate action.
is shown in Figure 4. A range of country- and region-specific summaries are
also presented.
Metered-Dose Inhalers
Metered-Dose Inhalers (MDIs), typically used for the treatment of asthma and other respiratory conditions, use
hydrofluorocarbons as propellants. These gases are highly potent greenhouse gases, with warming potentials
between 1,480-2,900 times that of carbon dioxide.26 As with anesthesia, global data on emissions from MDIs
was not available, however, UNFCCC Annex 1 nations report data on emissions from this source.27 For UNFCCC
Annex 1 nations, emissions from MDI use totalled 6.9MtCO2e, an additional 0.3% on top of the global health care
footprint. The full global emissions from MDIs can be expected to be substantially greater than this figure, and
while antiasthmatics are included on the WHO essential medicine list,28 alternative delivery mechanisms to MDIs,
such as dry powder based inhalers, are available which provide the same medicines without the high global
warming potential propellents.
17STUDY METHODOLOGY
Study limitations
This paper aims to create an understanding of the
climate footprint of the global health care sector 4. WIOD detail countries and the rest of the world
and has used data sources and methods that (ROW): The WIOD database gives detailed
prioritize the completeness of this over resolution. information on 43 countries and combines the rest
Therefore, the approach should not be expected to of the world into one aggregated sector. This means
give results to a similar level of detail as footprints there is a loss of resolution into many countries. The
calculated for national health care systems, health ROW category – because it plays a balancing role
care organizations, or individual health care facilities. within the model – also masks any irregularities in
A generalized summary of other limitations including data reporting and sector definitions between the
data collection and reporting approaches include: detail countries. This also means specific country
data is lacking for all of Africa and the Middle East,
1. Alignment with previous studies: This paper is the as well as many low- and middle-income countries in
first to estimate the climate impact of health care Asia, Latin America, and the Caribbean.
in all countries and across three major greenhouse
gases. The closest comparable study18 used a 5. Allocation of emissions footprint to GHGP scopes:
similar methodology, yet this paper differs in five key It is challenging to disaggregate the MRIO-based
aspects (among others): approach to assessment into the Scope 1, 2, and 3
reporting structure, particularly regarding the sub-
a. It covers all countries, including an additional 25% categories of Scope 3. Only partial perspectives
of global GDP. to this are offered in the study. A structural path
b. It considers methane and nitrous oxide in analysis is necessary to show full supply chain
addition to carbon dioxide emissions, equivalent relationships with the model.
to an additional 25% of global climate impact.
c. Its modelling is based on WIOD MRIO database 6. Nitrous oxide as anesthetics: The assessment is
rather than Eora to facilitate comparison among determined from data available for 31 countries
countries. under the UNFCCC reporting regime. These
d.It uses a more granular approach to map health countries represent 15% of world population, 57% of
care spending for non-OECD countries, such as GDP, and 73% of global health care expenditure. Due
China and India. to this limitation, we report this data separately.
e. In the specific case of China, expenditure data
was revised downward by 15% between the 7. Fluorinated gases as anesthetics (desflurane,
publication of Pichler et al.’s paper and this paper. sevoflurane, isoflurane): Figures are derived from
published research on atmospheric concentrations.
2. Spending data: The System of Health Accounts The global warming potential is inferred from these
(SHA) spending data uses a consistent definition measurements. It can be taken as a global footprint,
of health care and categorization of health care but due to the different method for deriving the
providers across countries. value, we report it separately.
3. Allocation of SHA spending data into WIOD 8.Reporting year: This study considered emissions
economic sectors: The SHA health care provider from the health care sector for 2014, the latest year
categories do not align directly with WIOD economic available for the WIOD database. Progress has been
sectors. The method of translating between the two made in the five years since then by health sector
requires some approximations based on detailed providers and their partners in decarbonising their
definitions of SHA and WIOD categories. activities. This is not as yet represented in
the findings.
18FINDINGS: HEALTH CARE’S GLOBAL
CLIMATE FOOTPRINT
This paper contributes to a growing body of evidence documenting the extent and nature of health care’s
climate footprint. Six key conclusions can be drawn from this study.
1. Health care is a major contributor to the 2. More than half of health care’s footprint
climate crisis comes from energy use
Health care, a sector whose mission is to “first, Emissions emanating directly from health care facilities
do no harm” and to heal, has a significant climate (Scope 1) make up 17% of the sector’s worldwide
footprint and makes a major contribution to the footprint. Indirect emissions from purchased electricity,
climate crisis, which is quickly evolving into a global steam, cooling and heating (Scope 2) comprise
health emergency. A growing number of national and another 12%. And the lion’s share of emissions —
international studies confirm and shed light on 71% — come from what is known as Scope 3, and are
this finding. primarily derived from the health care supply chain —
the production, transport, use, and disposal of goods
This study, the only comprehensive global analysis and services that the sector consumes.
to date, finds that the global health care sector had a
climate footprint of 2.0GtCO2e in 2014, equivalent to When viewed across all three scopes, more than half
4.4% of global net emissions. of the health sector’s footprint is attributable to energy
use, primarily consumption of electricity, gas, steam
If health care were a country, it would be the fifth- and air conditioning supply combined with health
largest emitter on the planet. Health care’s climate sector operational emissions.
footprint is smaller than that of China, the United
States, India, and Russia but larger than Japan’s and Other significant activities that contribute to health
Brazil’s. care’s footprint include: agriculture (9% including
catering at health facilities, growing cotton for surgical
The global health care climate footprint is equivalent gowns, etc.), pharmaceuticalsb,21 and chemicals (not
to the greenhouse gas emissions from 514 coal-fired including the energy used to produce them, 5%),
power plants.24 transport (7%), and waste treatment (3%). In addition,
a limited estimate covering only 31 countries shows
The highest contributions to the global health care that an additional nearly 1% of health care’s global
climate footprint come from the United States (546 climate footprint or nearly four million metric tons of
million metric tons of CO2e), China (342 MtCO2e), and health care emissions come from the sector’s use of
the European Union (248 MtCO2e). (See Appendix A anesthetic gases (0.6%) and metered dose inhalers
for a ranking of the 43 countries, plus the EU.) (0.3%). (See: Metered Dose Inhalers on page 17 and
Anesthetic Gases on page 31)
Health care emissions make up a varying percentage
of each country’s climate footprint. They range from
highs in the United States (7.6%), Switzerland (6.7%)
and Japan (6.4%) to lows in India (1.5%) and Indonesia
(1.9%). Data was not available for many low- and
middle-income countries. Most of the 43 countries
in the study fall close to the world average of 4.4%
(Figure 7).
b. Other studies in this field have found the contribution of pharmaceuticals to be greater that our stated result here. This is a result of different reporting practice. We present the
emissions from the manufacturing of pharmaceuticals and chemicals, whereas previous reporting give the full embodied emissions in the pharmaceutical products purchased
by health care. Primarily, these numbers differ since emissions from energy used in the supply chain are captured in the results when reporting full embodied emissions.
19You can also read