The Global Financial Centres Index 28 - September 2020 - Financial Centre Futures - Long Finance
←
→
Page content transcription
If your browser does not render page correctly, please read the page content below

The Global
Financial Centres
Index 28
September 2020

  Financial Centre Futures
In March 2007, Z/Yen and the City Of London released the first edition of the GFCI, which
continues to provide evaluations of competitiveness and rankings for the major financial
centres around the world. We are pleased to present the twenty-eighth edition of the
Global Financial Centres Index (GFCI 28).

In July 2016, Z/Yen and the China Development Institute (CDI) in Shenzhen established a
strategic partnership for research into financial centres. We continue our collaboration in
producing the GFCI.

The GFCI is updated every March and September and receives considerable attention
from the global financial community. The index serves as a valuable reference for policy
and investment decisions.

Z/Yen is the City of London's leading commercial think-tank. Z/Yen was founded in 1994
to promote societal advance through better finance and technology. Z/Yen has built its
practice around a core of high-powered project managers, supported by experienced
technical specialists so that clients get expertise they need, rather than just resources
available. The firm is headquartered in London, but Z/Yen is committed to the ‘virtual
office’ concept and is an intense user of technology in order to improve flexibility and
benefit staff.

The CDI is a leading national think-tank that develops solutions to public policy challenges
through broad-scope and in-depth research to help advance China’s reform and opening-
up to world markets. The CDI has been working on the promotion and development of
China’s financial system since its establishment in 1989. Based on rigorous research and
objective analysis, CDI is committed to providing innovative and pragmatic reports for
governments at different levels in China and corporations at home and abroad.

The authors of this report, Hugh Morris,
Professor Michael Mainelli, and Mike Wardle,
would like to thank Bikash Kharel, Peter
Welch, Carol Feng, Peng Yu, and the rest of the
GFCI team for their contributions with
research, modelling, and ideas.

The Global Financial Centres Index 28

Foreword
Warm greetings from Seoul Metropolitan Government! I am Seo Jeong-hyup, the
Acting Mayor of Seoul.

Seoul, a leading global financial hub, and Z/Yen, a world-renowned consulting group,
are jointly hosting this much awaited webinar on the GFCI 28. I would like to express
my heartfelt appreciation and congratulations.

The outbreak of Covid-19 has caused drastic changes to human civilization. The global
economy is on the brink of recession and whole industries are in decline. Cities around
the world are faced with numerous, unprecedented challenges. As we stand at a
crossroads between a crisis and an opportunity, this presentation of GFCI 28 is all the
more meaningful.

Seoul Metropolitan Government will regard the insightful results of the GFCI 28 report
as a compass and use it to find the right direction for the financial sector in Seoul going
forward. We will turn this crisis into an opportunity by taking full advantage of our
“digital finance” efforts, which we have long been committed to.

The 3 major elements of our “digital finance” efforts are the Seoul Fintech Lab, which
houses 100 fintech companies and 1,000 innovators, the Digital Finance MBA, which
focuses on fostering future global experts on digital finance, and the Seoul International
Finance Office, which provides support for the business activities between overseas
financial institutions and domestic financial institutions.

In this era of the Covid-19 pandemic, rampant with uncertainties and confusion, Seoul
Metropolitan Government will strive to open up a new “digital financial hub” future for
Seoul. We will continue to ask for the advice of global financial experts along our
journey.

Hopefully, Z/Yen can continue to join us on our journey and give us insightful advice.
Thank you.

Seo Jeong-hyup
Acting Mayor Of Seoul

                                              1
The Global Financial Centres Index 28

GFCI 28 Summary And Headlines
Overview
• We researched 121 centres for this edition of the Global Financial Centres Index
  (GFCI 28). The number of financial centres in the main index has increased from 108
  to 111 with the addition of Bratislava, Xi’an, and Wuhan, though new entrants to
  the index take some time for their position in the index to settle. There are 10
  associate centres awaiting potential inclusion in the main index.
• GFCI 28 again shows a relatively high level of volatility, with 23 centres rising ten or
  more places in the rankings and 20 falling ten or more places.
• Overall, the average rating of centres in the index dropped over 41 points (6.25%)
  from GFCI 27, which may indicate a more general lack of confidence in finance
  during a time of continuing uncertainty around international trade, the impact of
  the covid-19 pandemic on individual economies, and geopolitical and local unrest.
• All of the top ten centres in the index increased their ratings in GFCI 28, reversing
  recent trends. Of the next 40 centres, 12 improved their rating while 27 fell. This
  may indicate increased confidence in leading centres during the covid-19
  pandemic.

GFCI 28 results

Leading Centres
• New York retains its first place in the index, although London in second place has
  made up ground in the ratings, now only four points behind the leader (27 points in
  GFCI 27).
• Shanghai moved up one place to third and Tokyo dropped one place to fourth,
  although only one point separates them in the ratings. Similarly, Hong Kong moved
  up a place to rank fifth and Singapore fell one place to sixth, again with only one
  point separating Hong Kong and Singapore in the ratings.
• Shenzhen and Zurich entered the top ten in this edition, replacing Los Angeles and
  Geneva.
• Within the top 30 centres, Luxembourg, Boston, Seoul, and Madrid rose by more
  than five places.

Western Europe
• After its strong performance in GFCI 27, centres in Western Europe had mixed
  fortunes in GFCI 28, with 15 centres rising in the rankings and 12 falling. However,
  the average drop in ratings was only 21 points (3.17%) in this region.

Asia/Pacific
• Asia/Pacific Centres had a mixed performance in GFCI 28, with ten centres falling in
   the rankings and 14 rising. This appears to reflect levels of confidence in the
   stability of Asian centres and in their approach to sustainable finance, which
   appears to be growing in its effect on the overall rating of centres.
• Taipei, Chengdu, and Qingdao all rose more than 30 places in the rankings.

                                              2
The Global Financial Centres Index 28

North America
• North American centres showed the least change in ratings across the regions,
  falling on average just 9 points (1.3%).
• Boston, Washington DC, and San Diego all improved five or more places in the
  rankings.
• Six out of the eleven North American centres are in the top 20, up from four in GFCI
  27.

Eastern Europe & Central Asia
• Following a good performance in ratings in GFCI 27, all centres in this region saw
  their ratings fall, and only three of the 16 centres in the region—Moscow, Istanbul,
  and Athens—improved their rank.
• Sofia, Baku, and Almaty fell over 30 ranking places from GFCI 27 to GFCI 28.

Middle East & Africa
• All 13 Centres in the Middle East & Africa fell in the ratings, with only Abu Dhabi,
  Mauritius and Cape Town improving in the rankings.

Latin America & The Caribbean
• All centres in this region fell in the ratings, with the average rating for the region
   falling 54 points (8.66%).

FinTech
• New York leads the FinTech rankings, followed by Beijing, Shanghai, London, and
   Shenzhen. Five of the top ten centres for FinTech are Chinese.
• In our recently published Smart Centres Index, focusing more broadly on innovation
   and technology, Chinese centres did not feature as strongly as they have in the
   Fintech rankings. This suggests a particular focus on Fintech in these centres.

GFCI 28
• GFCI 28 was compiled using 138 instrumental factors. These quantitative measures
  are provided by third parties including the World Bank, The Economist Intelligence
  Unit, the OECD, and the UN. Details can be found in Appendix 4.
• The instrumental factors were combined with 54,509 assessments of financial
  centres provided by 8,549 respondents to the GFCI online questionnaire. A
  breakdown of the respondents is shown in Appendix 2.
• Further details of the methodology behind GFCI 28 are in Appendix 3.

Shanghai As A Financial Centre

In this edition of the GFCI, we include a supplement focusing on Shanghai as a financial
centre, prepared by the CEIBS Lujiazui Institute of International Finance - see pages 18
to 24.

                                               3
The Global Financial Centres Index 28

Table 1 | GFCI 28 Top 56 Ranks And Ratings

                                    GFCI 28                    GFCI 27         Change in   Change in
  Centre
                             Rank          Rating       Rank          Rating     Rank       Rating
  New York                     1            770          1             769         0         ▲1
  London                       2            766          2             742         0         ▲24
  Shanghai                     3            748          4             740        ▲1         ▲8
  Tokyo                        4            747          3             741        ▼1         ▲6
  Hong Kong                    5            743          6             737        ▲1         ▲6
  Singapore                    6            742          5             738        ▼1         ▲4
  Beijing                      7            741          7             734         0         ▲7
  San Francisco                8            738          8             732         0         ▲6
  Shenzhen                     9            732          11            722        ▲2         ▲10
  Zurich                      10            724          14            719        ▲4         ▲5
  Los Angeles                 11            720          10            723        ▼1         ▼3
  Luxembourg                  12            719          18            715        ▲6         ▲4
  Edinburgh                   13            718          17            716        ▲4         ▲2
  Geneva                      14            717          9             729        ▼5         ▼12
  Boston                      15            716          25            708       ▲10         ▲8
  Frankfurt                   16            715          13            720        ▼3         ▼5
  Dubai                       17            714          12            721        ▼5         ▼7
  Paris                       18            713          15            718        ▼3         ▼5
  Washington DC               19            712          24            709        ▲5         ▲3
  Chicago                     20            711          16            717        ▼4         ▼6
  Guangzhou                   21            710          19            714        ▼2         ▼4
  Amsterdam                   22            701          27            703        ▲5         ▼2
  Stockholm                   23            700          28            702        ▲5         ▼2
  Vancouver                   24            698          22            711        ▼2         ▼13
  Seoul                       25            695          33            694        ▲8         ▲1
  Montreal                    26            694          26            704         0         ▼10
  Melbourne                   27            693          21            712        ▼6         ▼19
  Madrid                      28            692          43            678       ▲15         ▲14
  Hamburg                     29            690          29            699         0         ▼9
  Brussels                    30            686          34            691        ▲4         ▼5
  Toronto                     31            684          23            710        ▼8         ▼26
  Sydney                      32            682          20            713       ▼12         ▼31
  Abu Dhabi                   33            681          39            682        ▲6         ▼1
  Dublin                      34            679          30            698        ▼4         ▼19
  Mumbai                      35            678          45            672       ▲10         ▲6
  Copenhagen                  36            674          35            689        ▼1         ▼15
  Stuttgart                   37            672          32            696        ▼5         ▼24
  Milan                       38            670          42            679        ▲4         ▼9
  Osaka                       39            665          59            656       ▲20         ▲9
  Busan                       40            664          51            664       ▲11          0
  Kuala Lumpur                41            663          44            677        ▲3         ▼14
  Taipei                      42            662          75            640       ▲33         ▲22
  Chengdu                     43            659          74            641       ▲31         ▲18
  Wellington                  44            657          31            697       ▼13         ▼40
  Tel Aviv                    45            656          36            688        ▼9         ▼32
  Casablanca                  46            655          41            680        ▼5         ▼25
  Qingdao                     47            654          99            610       ▲52         ▲44
  Munich                      48            653          37            687       ▼11         ▼34
  New Delhi                   49            652          69            646       ▲20         ▲6
  Oslo                        50            651          61            654       ▲11         ▼3
  Calgary                     51            649          40            681       ▼11         ▼32
  Glasgow                     52            648          65            650       ▲13         ▼2
  Rome                        53            643          53            662         0         ▼19
  Vienna                      54            640          38            685       ▼16         ▼45
  Jersey                      55            637          49            666        ▼6         ▼29
  Doha                        56            627          48            669        ▼8         ▼42

                                                    4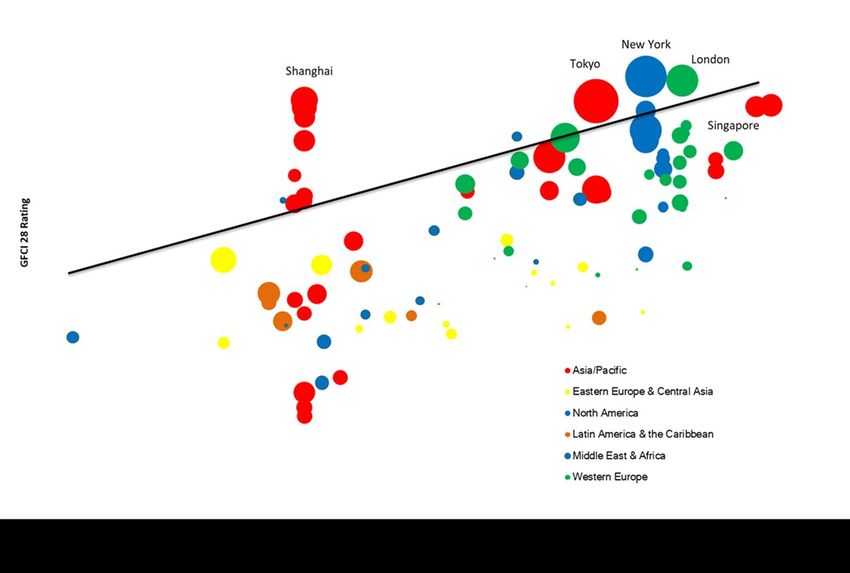
The Global Financial Centres Index 28

Table 1 (Continued) | GFCI 28 Remaining Ranks And Ratings

                                         GFCI 28                   GFCI 27        Change in   Change in
  Centre
                                  Rank         Rating       Rank         Rating     Rank       Rating
  Warsaw                           57           618          50           665        ▼7         ▼47
  Bangkok                          58           617          58           657         0         ▼40
  Lisbon                           59           608          76           639       ▲17         ▼31
  San Diego                        60           605          81           634       ▲21         ▼29
  Bermuda                          61           601          63           652        ▲2         ▼51
  Moscow                           62           600          71           644        ▲9         ▼44
  Mauritius                        63           598          64           651        ▲1         ▼53
  Istanbul                         64           595          79           636       ▲15         ▼41
  Helsinki                         65           594          68           647        ▲3         ▼53
  Prague                           66           593          46           671       ▼20         ▼78
  Cape Town                        67           592          80           635       ▲13         ▼43
  Liechtenstein                    68           591          54           661       ▼14         ▼70
  Bahamas                          69           590         105           599       ▲36         ▼9
  Mexico City                      70           589          78           637        ▲8         ▼48
  Cyprus                           71           588          67           648        ▼4         ▼60
  British Virgin Islands           72           587          60           655       ▼12         ▼68
  Malta                            73           586         107           588       ▲34         ▼2
  Nur-Sultan (formerly Astana)     74           585          72           643        ▼2         ▼58
  Monaco                           75           580          86           626       ▲11         ▼46
  Vilnius                          76           578          66           649       ▼10         ▼71
  Isle of Man                      77           577          77           638         0         ▼61
  Cayman Islands                   78           575          47           670       ▼31         ▼95
  Guernsey                         79           574          73           642        ▼6         ▼68
  Sao Paulo                        80           569          83           632        ▲3         ▼63
  Jakarta                          81           568          93           617       ▲12         ▼49
  GIFT City-Gujarat                82           563          82           633         0         ▼70
  Bahrain                          83           562          56           659       ▼27         ▼97
  Gibraltar                        84           561          90           621        ▲6         ▼60
  Rio de Janeiro                   85           560          89           622        ▲4         ▼62
  Barbados                         86           559         108           583       ▲22         ▼24
  Bratislava                       87           552         New           New       New         New
  Tallinn                          88           551          52           663       ▼36        ▼112
  Nanjing                          89           550         101           608       ▲12         ▼58
  Johannesburg                     90           549          85           627        ▼5         ▼78
  Panama                           91           548          94           616        ▲3         ▼68
  Athens                           92           547          96           614        ▲4         ▼67
  Santiago                         93           546         104           603       ▲11         ▼57
  Buenos Aires                     94           543         106           592       ▲12         ▼49
  Sofia                            95           540          62           653       ▼33        ▼113
  Nairobi                          96           539          87           625        ▼9         ▼86
  Riga                             97           538          70           645       ▼27        ▼107
  Baku                             98           537          57           658       ▼41        ▼121
  Almaty                           99           536          55           660       ▼44        ▼124
  Reykjavik                       100           535          92           618        ▼8         ▼83
  Budapest                        101           531          84           628       ▼17         ▼97
  Tehran                          102           528          95           615        ▼7         ▼87
  Kuwait City                     103           524          91           620       ▼12         ▼96
  St Petersburg                   104           523          97           613        ▼7         ▼90
  Xi'an                           105           506         New           New       New         New
  Manila                          106           491         103           606        ▼3        ▼115
  Riyadh                          107           486          88           624       ▼19        ▼138
  Tianjin                         108           477         100           609        ▼8        ▼132
  Hangzhou                        109           463          98           612       ▼11        ▼149
  Dalian                          110           455         102           607        ▼8        ▼152
  Wuhan                           111           420         New           New       New         New

                                                        5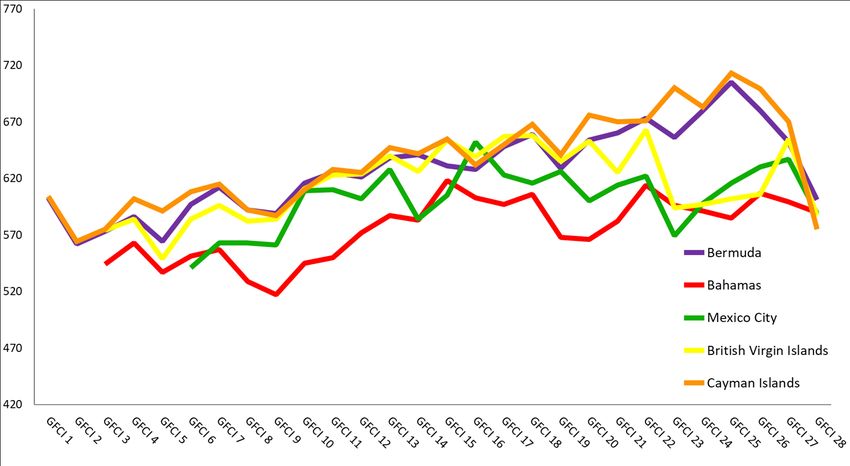
The Global Financial Centres Index 28

We track centres that have yet to achieve the number of assessments required to be
listed in the main GFCI index. Table 2 lists the ten centres which fall into this ‘associate
centres’ category.

Table 2 | GFCI 28 Associate Centres

                                           Number Of Assessments               Mean Of
Centre
                                            In The Last 24 Months            Assessments
Bogota, Colombia                                        147                        527
Lugano, Switzerland                                     105                        634
Lagos, Nigeria                                          101                        511
Andorra                                                 88                         583
Ho Chi Minh City, Vietnam                               79                         553
Chisinau, Moldova                                       62                         640
Turks and Caicos                                        56                         584
Karachi, Pakistan                                       55                         511
Trinidad & Tobago                                       48                         569
Kaunas, Lithuania                                       36                         550

 Regional Performance
 The mean of the top five Asia/Pacific centre remains higher than other regions. North
 America is still fractionally ahead of Western Europe. The reduction in ratings seen in
 GFCI 28 shows in the downturn in the average ratings of the top centres in other
 regions.

Chart 1 | Average Ratings Of The Top Five Centres In Each Region

                                                    6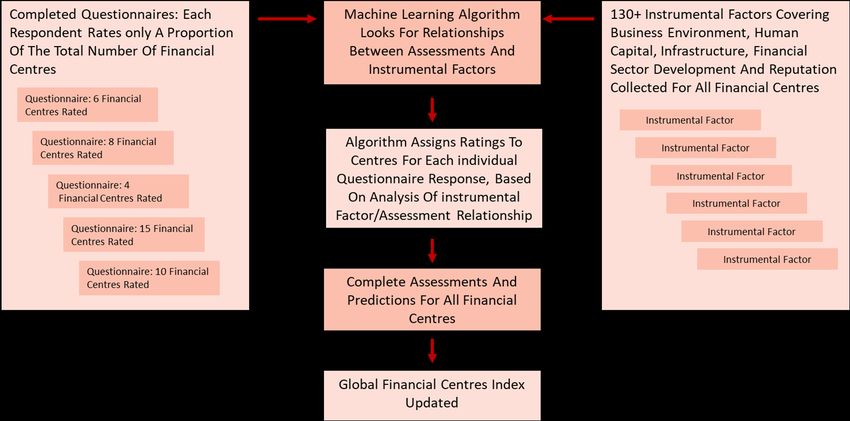
The Global Financial Centres Index 28

The Top Five Centres
New York retained its first place in the index, although London has made up ground,
now only four points behind in second place. Only one point separates Shanghai in
third place from Tokyo in fourth. Hong Kong recovered one ranking place from sixth to
fifth place in the index.
Chart 2 | The Top Five Centres— GFCI Ratings Over Time

     “Those jurisdictions that
        market themselves
    effectively to key investing
   jurisdictions (ideally through
       centralised marketing
     programmes) fare better
      than those that don't.”
  PARTNER, PROFESSIONAL SERVICES FIRM, JERSEY

                                                  7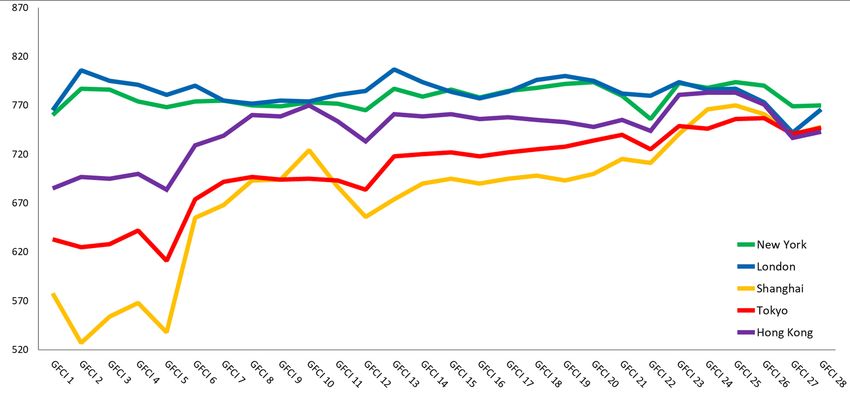
The Global Financial Centres Index 28

Future Prospects

The GFCI questionnaire asks respondents which centres they consider will become
more significant over the next two to three years. Table 3 shows the top 15 centres
mentioned. Ten of the 15 centres are in the Asia/Pacific region.

Table 3 | The 15 Centres Likely To Become More Significant

 Centre                                                      Mentions in last 24 months

 GIFT City-Gujarat                                                      284
 Stuttgart                                                              206
 Qingdao                                                                195
 Shanghai                                                               168
 Singapore                                                              111
 Seoul                                                                  107
 Beijing                                                                106
 Guangzhou                                                              87
 Shenzhen                                                               75
 Hong Kong                                                              50
 Paris                                                                  44
 Dubai                                                                  38
 Frankfurt                                                              35
 Chengdu                                                                34
 New York                                                               31

   “Post-COVID 19, the geographic boundaries are
 gradually diminishing for talents. Skilled people can
be working despite physically limitation thanks to the
                aids of technology.”
DEPUTY GENERAL MANAGER, BANKING, NEW YORK

                                                   8
The Global Financial Centres Index 28
Areas Of Competitiveness
The instrumental factors used in the GFCI model are grouped into five broad areas of
competitiveness: Business Environment, Human Capital, Infrastructure, Financial Sector
Development, and Reputation. These areas and the instrumental factor groups which
comprise each area are shown in Chart 3.
Chart 3 | GFCI Areas Of Competitiveness
“Regulatory environment has to accommodate
innovation whilst ensuring consumers’ trust is safe-
guarded. It is important to enable robust cyber
security frameworks and have the investigative
powers and skills necessary to enforce.”
HEAD OF INVESTOR CONTACT CENTRE, BANKING, DUBLIN
9The Global Financial Centres Index 28
To assess how financial centres perform in each of these areas, the GFCI factor assessment
model is run separately for each of the five areas of competitiveness. The top 15 ranked
centres in each of these sub-indices are shown in Table 4. New York takes the lead position
in all areas, followed by London. Singapore, Tokyo, and Hong Kong also feature strongly,
with the remaining slots in the top five places across the different areas of competitiveness
taken by Geneva, Chicago, Luxembourg, and Shanghai.
Table 4 | GFCI 28 Top 15 Centres By Area Of Competitiveness
Financial Sector Reputational &
Rank Business Environment Human Capital Infrastructure
Development General
1 New York New York New York New York New York
2 London London London London London
3 Hong Kong Hong Kong Tokyo Shanghai Singapore
4 Geneva Luxembourg Singapore Singapore Hong Kong
5 Chicago Singapore Hong Kong Hong Kong Tokyo
6 Singapore Paris San Francisco Frankfurt Shanghai
7 Amsterdam Shanghai Stockholm Zurich Geneva
8 Beijing Chicago Beijing Beijing Beijing
9 Shanghai Tokyo Shanghai San Francisco Zurich
10 Zurich Beijing Amsterdam Paris Toronto
11 Frankfurt Los Angeles Madrid Tokyo Chicago
12 Copenhagen Geneva Boston Shenzhen San Francisco
13 Tokyo San Francisco Vancouver Los Angeles Stockholm
14 San Francisco Shenzhen Brussels Amsterdam Sydney
15 Montreal Dubai Paris Copenhagen Oslo
“We are worried about carefully constructed
international taxation agreements designed to
ensure fair receipts of tax based on location of
earnings being undermined by nationalistic interests,
and a naive political drive simply to lower taxes to
attract business. On the plus side under ESG,
companies will find that their tax avoidance
behaviours will come under scrutiny.”
CEO, TRADE ASSOCIATION, LONDON
10The Global Financial Centres Index 28
Factors Affecting Competitiveness
The GFCI questionnaire asks respondents to indicate which factors of competitiveness
they consider the most important at this time. The number of times that each area was
mentioned and the key issues raised by respondents are shown in Table 5.
Table 5 | GFCI 28 Main Areas Of Competitiveness
Area of Number of
Main Issues
Competitiveness Mentions
The Regulatory environment is still seen as the central pillar
needed for a successful financial centre.
Must strike the right balance of regulation, to reduce corruption
Business
363 without stifling innovation and development and with greater
Environment transparency.
FinTech regulation is a hot topic, with some arguing for more
and some for less regulation.
Remote working has made cross-border work easier, reducing
the need to have employees that live and work in the same city.
Cities with good infrastructure and lifestyle still attract the top
Human Capital 323
talent.
The need for IT skills has continued to grow as FinTech and AI
become mainstream.
Essential to build working environments which cater to the social
as well as business needs of people
Infrastructure 383 Changes to the way we work - brought about by the covid-19
pandemic - have accelerated the need for world-class IT/
connectivity infrastructure to facilitate virtual working.
Tax increases are foreseen. This may be lead to some choosing
to relocate
Taxation 378 In general, low taxation is seen as better for businesses. Tax
incentives are a key way to attract investment business and top
talent.
Reputation gives confidence to investors and is a leading factor
when selecting a financial centre.
Reputation 338
A city’s reputation is useful for attracting human capital to the
centre. Looking for safety, liveability, and quality of life.
Physical access is becoming less of an issue due to the
accelerated acceptance of remote working and increased digital
connectivity between centres.
Financial Sector
309 Access to markets still seen as necessary for important in-person
Development meetings.
Clusters of financial businesses increase efficiency in the system
and in turn make it more attractive to others.
“Flexible labour markets help keep costs down for
firms. There could be a lower rate of natural
unemployment and lower inflation. Multi-skilled
workers may be able to adjust their working
patterns or workloads.”
SENIOR ACCOUNTANT - UAE & TURKEY, PROFESSIONAL SERVICES FIRM, DUBAI
11The Global Financial Centres Index 28
Political Stability And Regulatory Quality
Reputational and Business Environment measures have a significant correlation with
financial centre competitiveness. Chart 4 plots GFCI ratings against the World Bank’s
Political Stability And Absence Of Violence/Terrorism Indicator and Chart 5 plots GFCI
ratings against the World Bank’s measure of Regulatory Quality. These charts
demonstrate the correlation of these factors with the GFCI 28 ratings (the size of the
bubble indicates the relative GDP of each centre).
Chart 4 | GFCI 28 Rating Against Political Stability And Absence Of Violence/Terrorism (Supplied by The
World Bank)
Chart 5 | GFCI 28 Rating Against Regulatory Quality (Supplied By The World Bank)
12The Global Financial Centres Index 28
Connectivity
Financial centres thrive when they develop deep connections with other centres. The
GFCI allows us to measure connectivity by investigating the number of assessments
given to and received from other financial centres. Charts 6 and 7 show the different
levels of connectivity enjoyed by Shanghai and Sydney to demonstrate the contrast,
with Shanghai having connections with a wider spread of centres than Sydney. Both are
well connected with Asian centres; but Shanghai is much better connected to London
and New York and other centres in Western Europe and Eastern Europe & Central Asia.
Chart 6 | GFCI 28 Connectivity - Shanghai
Chart 7 | GFCI 28 Connectivity - Sydney
13The Global Financial Centres Index 28
Financial Centre Profiles
Chart 8 | GFCI 28 Profile Elements
Using clustering and correlation analysis we
have identified three measures (axes) that
determine a financial centre’s profile along
different dimensions of competitiveness.
‘Connectivity’ – the extent to which a
centre is well connected around the world,
based on the number of assessments given
by and received by that centre from
professionals based in other centres.
A centre’s connectivity is assessed using a combination of ‘inbound’ assessment
locations (the number of locations from which a particular centre receives
assessments) and ‘outbound’ assessment locations (the number of other centres
assessed by respondents from a particular centre). If the weighted assessments for a
centre are provided by over 63% of other centres, this centre is deemed to be ‘Global’.
If the ratings are provided by over 42% of other centres, this centre is deemed to be
‘International’.
‘Diversity’– the instrumental factors used in the GFCI model give an indication of a
range of factors that influence the richness and evenness of areas of competitiveness
that characterise any particular financial centre. We consider this span of factors to be
measurable in a similar way to that of the natural environment. We therefore use a
combination of biodiversity indices (calculated on the instrumental factors) to assess a
centre’s diversity taking account of the range of factors against which the centre has
been assessed – the ‘richness’ of the centre’s business environment; and the
‘evenness’ of the distribution of that centre’s scores. A high score means that a centre
is well diversified; a low diversity score reflects a less rich business environment.
‘Speciality’ – the depth within a financial centre of the following industry sectors:
investment management, banking, insurance, professional services, and the
government and regulatory sector. A centre’s ‘speciality’ performance is calculated
from the difference between the GFCI rating and the industry sector ratings.
In Table 6 ‘Diversity’ (Breadth) and ‘Speciality’ (Depth) are combined on one axis to
create a two dimensional table of financial centre profiles. The 111 centres in GFCI 28
are assigned a profile on the basis of a set of rules for the three measures: how well
connected a centre is, how broad its services are, and how specialised it is.
The 11 Global Leaders (in the top left of the table) have both broad and deep financial
services activities and are connected with many other financial centres. This list
includes nine of the top ten global financial centres in GFCI 28.
Significant changes in GFCI 28 include Chicago, Los Angeles, Washington DC, and Zurich
exiting the Global Leaders, with Shenzhen and San Francisco moving into this category.
14The Global Financial Centres Index 28
Table 6 | GFCI 28 Financial Centre Profiles
Broad & Deep Relatively Broad Relatively Deep Emerging
Global Leaders Global Diversified Global Specialists Global Contenders
London Frankfurt Guangzhou GIFT City-Gujarat*
New York Amsterdam Abu Dhabi* Hangzhou*
Shanghai Paris Chengdu Dalian
Beijing Moscow Qingdao
Hong Kong Brussels*
Global Singapore Los Angeles*
Shenzhen* Dublin
San Francisco* Seoul
Dubai Zurich*
Geneva* Chicago*
Tokyo
Established International International International
International Diversified Specialists Contenders
Boston* Sydney Luxembourg* Tianjin
Washington DC* Istanbul* Mumbai* Wuhan (New)
Milan* Mexico City* Casablanca Nur-Sultan
Rome* Madrid Mauritius* Doha*
Athens Toronto Riga*
Montreal Munich* Taipei
International
Edinburgh Vienna British Virgin Islands*
Budapest* Vilnius
Busan* Almaty
Hamburg Buenos Aires
Tel Aviv Bermuda*
Stuttgart Panama*
Nanjing
Cyprus*
Established
Local Diversified Local Specialists Evolving Centres
Players
Bangkok* Johannesburg New Delhi* Sao Paulo*
Warsaw* Oslo* Guernsey* Jakarta*
Stockholm* Copenhagen* Malta* Rio de Janeiro
Vancouver St Petersburg Cape Town
Melbourne* Isle of Man* Riyadh*
Calgary Cayman Islands* Manila
Helsinki Tallinn*
Prague Sofia
Kuala Lumpur* Bahrain
Lisbon* Jersey*
Local Santiago Baku
San Diego Liechtenstein*
Wellington Reykjavik
Osaka Xi'an (New)
Glasgow Kuwait City
Bratislava (New)
Tehran
Nairobi
Monaco
Bahamas*
Barbados
Gibraltar
An asterisk denotes cities that have moved between categories between GFCI 27 and GFCI 28
15The Global Financial Centres Index 28
The GFCI 28 World
100
51 See Detailed
24
26
Map Below
31
8 15
20
1
11
19
60 61 46
69
70
78 72
91
85
80
93 67
94
The numbers on the map indicate the GFCI 28 rankings.
Broad and Deep Relatively Broad Relatively Deep Emerging
Global Leaders Global Diversified Global Specialists Global Contenders
Established International International Diversified International Specialists International Contenders
Established Players Local Diversified Local Specialists Evolving Centres
Associate Centre
16The Global Financial Centres Index 28
104
62
74
99 25
64 7 108
98 4
105 47 40
71 102 110
45 43 111 39
3
103 89
21 109
83
56 17 9 42
49
82
107 33 5
35 58 106
41
6
96
81
63
90
32
27
44
65
50
88
23
97
36
52 13 76
77 22 29
34 2 57
30
16
55 66
12 48
79
37 87
18
10 54 10
68
14
38
75 95
53
28
59 92
84
73
17The Global Financial Centres Index 28
Shanghai’s Development As A Financial Centre
We are grateful to the CEIBS Lujiazui Institute of International Finance for
contributing this supplement on Shanghai’s development as a financial centre.
Shanghai Has Built Itself Into An International Financial Centre With Global Impact
The COVID-19 outbreak is exerting a profound impact on the global political, economic,
and financial landscape. China’s financial opening-up has not slowed down due to the
epidemic, but has further accelerated. Only an open and connected global economic
system will enable all countries to prosper. The opening-up policy has demonstrated a
significant advantage as the main driver of economic growth in Shanghai and China at
large.
A host of opening-up measures taken by Shanghai, an international financial hub, has
made global investors more confident in China’s financial markets: “Shanghai-Hong
Kong Stock Connect”, “Shanghai-London Stock Connect”, “Bond Connect”, and
Shanghai Gold Exchange’s international board have been initiated in Shanghai; China A-
shares have been included in three international indexes - MSCI, FTSE and S&P Dow
Jones, in succession. When planning to invest in RMB-denominated assets, world-class
investors set their sights on Shanghai, which is becoming an open center for RMB-
denominated asset allocation
Shanghai boasts a solid foundation, a great potential, and a huge market size in building
itself into an international financial centre. In 2019, the trading volume of Shanghai’s
financial markets totaled RMB 1,934 trillion, 7.7 times the level in 2009. By by the end
of 2019, the total number of licensed financial institutions in Shanghai had reached
1,646, 660 more than that at the end of 2009. With its robust development, Shanghai
International Financial Centre has been widely recognised.
Shanghai has established a relatively complete set of financial factor markets, the size
and overall strength of which are generally commensurate with the international status
of RMB. Looking at objectives, tasks, and measures at the national level for the
construction of Shanghai International Financial Centre, it is clear that Shanghai has
now largely developed into an international financial center with global impact.
First, Shanghai’s financial market system has been continually improved, with a
growing international influence. Shanghai has become one of the cities worldwide with
a complete set of financial factor markets. In recent years, an array of financial market
platforms, such as China Trust Registration Co., Ltd., Shanghai Insurance Exchange,
Shanghai Commercial Paper Exchange, and Shanghai Headquarters of China Central
Depository & Clearing Co., Ltd., have been based in Shanghai.
The city has established an omni-category financial market system covering stocks,
bonds, futures, currency, foreign exchange, gold, insurance, and trust.
18The Global Financial Centres Index 28
China A-shares have been incorporated into MSCI, FTSE and S&P Dow Jones. Chinese
bonds have been included into the Bloomberg Barkley Global Aggregate Index and JP
Morgan Government Bond Index-Emerging Markets. Shanghai ranks high globally in
several financial market indicators.
By the end of 2019:
• Shanghai’s stock market had ranked 4th, 4th and 2nd globally by market
capitalization, trading volume, and financing amount respectively.
• Shanghai Gold Exchange had claimed the top spot in the world by spot gold trading
volume.
st
• Shanghai Futures Exchange ranked 1 globally by trading volume of several futures
products.
By the end of 2019, the custody balance of Shanghai’s interbank bond market had
reached RMB 86.4 trillion, accounting for 87% of China’s bond market balance, ranking
second in the world.
In 2019, the total trading volume of Shanghai’s financial markets hit RMB 1,934.3
trillion, up 16.6% year-on-year and 7.7 times the level at the end of 2009; the direct
financing amount reached RMB 12.7 trillion, 5.8 times the level at the end of 2009,
accounting for more than 85% of the national total.
Shanghai’s financial markets have seen a broad range of innovative products, such as
crude oil futures, two-year treasury futures, pulp futures, interest rate options, stock
options, copper options, natural rubber options, CSI 300 ETF options, and stock index
options. Among them, Shanghai’s crude oil futures market has evolved into the largest
in Asia and the third largest in the world.
Figure 1 | Trading Volume Of Shanghai’s Financial Markets
19The Global Financial Centres Index 28
Figure 2 | Direct Financing Of Shanghai’s Financial Markets
Second, the continual clustering of Chinese and foreign financial institutions in
Shanghai has made market players more diversified. International, headquarters-
based, and functional financial institutions are springing up. Aside from banks,
securities companies, insurers, fund firms, and trust institutions, a fair number of
prominent financial institutions or organizations, such as the New Development Bank,
Cross-Border Interbank Payment System (CIPS), Global Association of Central
Counterparties (CCP12), and City Commercial Banks Clearing Co., Ltd., have made a
presence in Shanghai.
Foreign-funded financial institutions are accelerating their push into Shanghai. Allianz
China, the first wholly foreign-owned insurance holding group in China, has been
officially opened; the first batch of newly established foreign-funded securities
companies, including Nomura Orient International Securities and JP Morgan Securities
(China), have been permitted to operate in Shanghai; and the joint-venture between
Amundi and BOC Wealth Management, the first wholly foreign-owned wealth
management company in China, was given approval to operate in Shanghai.
Also in this city, Vanguard Investment Advisors (Shanghai) Investment Consultancy Co.,
a joint-venture between Vanguard Group and Ant Financial, was among the first batch
of third-party fund sales companies to pilot the robo-advisor business in China; BNP
Paribas has become one of the first foreign-funded banks with the type A lead
underwriter license in the interbank market; Willis Insurance Brokers Co., Ltd. has
become the first foreign-funded insurance brokerage company licensed to expand its
business scope in China.
In addition, efforts have been stepped up to build a global asset management center in
Shanghai. The Bank of Communications and China CITIC Bank have set up wealth
management subsidiaries in Shanghai. The top ten asset management institutions by
asset size across the world have all established their business in Shanghai. Among 25
Whole Foreign-Owned Enterprise Private Fund Managers (WFOE PFMs) in China, 24
have started their operations in Shanghai; and more than 30 overseas investment fund
management companies have established a branch in Shanghai.
20The Global Financial Centres Index 28
The size of Shanghai’s securities asset management business accounts for one-third of
the national total; and the size of assets under management of insurance asset
management companies in Shanghai accounts for more than half of the national total.
Emerging financial business models are booming. Fintech companies, such as CCB
Fintech and BOC Fintech, have been established in Shanghai. In this city, the assets
under management of financial leasing companies have hit RMB 2.1 trillion, accounting
for about 30% of the national total. Shanghai is home to the headquarters of over 50
payment institutions, including Alipay, becoming a major powerhouse for China’s
payment industry.
By the end of 2019, the number of licensed financial institutions in Shanghai had reached
1,646, 660 more than that at the end of 2009, with foreign-funded ones making up nearly
one-third.
Figure 3 | Licensed Financial Institutions In Shanghai
The added value and tax revenue of Shanghai’s financial industry has grown rapidly.
Figure 4 | Added Value And Tax Revenue As A Percentage Of Shanghai’s GDP And
Total Tax Revenue
21The Global Financial Centres Index 28
Third, new breakthroughs have been made in financial opening-up, with the
capability for cross-border resources allocation significantly improved. The launch of
the Sci-Tech Innovation Board and the successful experimentation with the registration-
based IPO system have further enhanced the synergy effect between Shanghai
International Financial Center and Science and Technology Innovation Center.
By the end of June 2020, 130 companies had been listed on the Sci-Tech Innovation
Board, raising a total of RMB 201.5 billion in their IPO. These listed companies are
concentrated in high-end industries, such as next-generation information technology,
high-end equipment manufacturing, and biopharmaceuticals.
Much headway has also been made in facilitating financial market connectivity. Major
pilot programs for financial innovation have been successfully rolled out, including
“Shanghai-Hong Kong Stock Connect”, “Shanghai-London Stock Connect”, “Bond
Connect”, and Shanghai Gold Exchange’s international board.
Two-way opening-up of interbank bond, foreign exchange and currency markets has
accelerated. By the end of 2019, a total of 2,731 overseas institutional investors had
entered the interbank bond market, holding bonds valued at around RMB 2.2 trillion.
The number of tradable currency pairs in the RMB foreign exchange market has
increased to 27. The issuance of the Belt & Road Bond and Panda Bond has further
expanded. By the end of 2019, the Panda Bond issuance had reached RMB 335.67
billion; and the Belt & Road Bond worth RMB 18.8 billion had been issued by the
Shanghai Stock Exchange.
The pilot implementation of financial reform and opening up in Shanghai has produced
a pronounced effect. A range of financial reform and innovation measures carried out in
China (Shanghai) Pilot Free Trade Zone have been replicated and promoted across
China or in some regions.
Cross-border RMB business has been expanding, and in 2019, Shanghai’s cross-border
RMB revenue and expenditure reached RMB 5.2 trillion, accounting for 45% of the city’s
cross-border payments and about 50% of the national cross-border RMB payments.
Fourth, with the continuous improvement in financial standards and systems, the
scope of the “Shanghai Prices” has been expanding. The mechanism through which
interest and exchange rates are set by the market has been further improved. With the
continuous optimization of Shanghai Interbank Offered Rate (Shibor), loan prime rate
(LPR), and other mechanisms for benchmark interest rate liberalization, Shanghai has
become the first city in China to fulfill interest rate liberalization for foreign currency
deposits.
The CFETS RMB exchange rate index has become a major measure of RMB exchange
rates. The scope of the “Shanghai Prices” has been expanding. The “Shanghai Gold”,
“Shanghai Oil”, “Shanghai Silver”, and other international product varieties have been
traded in succession, significantly enhancing the city’s pricing power for RMB products
and commodities.
22The Global Financial Centres Index 28
The Shanghai Gold has been traded on the Dubai Gold and Commodities Exchange. In
partnership with Chicago Mercantile Exchange, Shanghai Gold Exchange has rolled out
derivatives based on the “Shanghai Gold”.
With the extensive application of technological standards for the UnionPay card,
UnionPay has extended its services to 177 countries and regions, becoming the world’s
largest international card issuer by card issuance and trading volume. UnionPay has
been chosen by the Asian Payment Network as the sole provider of the cross-border
chip card standard.
Fifth, Shanghai’s financial environment has been continuously optimized, earning
growing international recognition. Substantial progress has been made in promoting
rule of law in financial markets. China’s first financial court has been set up in Shanghai.
Financial tribunals, financial prosecution offices (departments), financial arbitration
courts, the Financial Consumer Protection Bureau of the People’s Bank of China, and
the Financial Dispute Mediation Center have been established in Shanghai in
succession.
The ‘Regulation of Shanghai Municipality on Promoting the Construction of the
International Financial Center and the Regulation of Shanghai Municipality on Financial
Oversight and Management’ have been promulgated.
Additionally, significant progress has been made in the establishment of the credit
system. The Credit Reference Center of the People’s Bank of China based in Shanghai
has established a centralized and unified national basic database of financial credit
information from enterprises and individuals. China’s first comprehensive local credit
regulation has been unveiled in Shanghai.
Positive progress has been made in building an international financial talent pool in
Shanghai. Continuous efforts have been made to cultivate, introduce, and attract
financial professionals, and optimize the system and environment for talent
development. The number of financial professionals in Shanghai has reached 470,000.
Figure 5 | Number Of Finance Professionals In Shanghai
23The Global Financial Centres Index 28
The COVID-19 outbreak has not hindered the implementation of measures for financial
opening-up in Shanghai. On February 14, the People’s Bank of China, together with
other ministries and commissions, jointly issued the ‘Opinions for Further Accelerating
the Construction of Shanghai as an International Financial Center and Providing
Financial Support for the Integrated Development of the Yangtze River Delta Region’.
To promote the pilot implementation of financial policies in the Lin’gang New Area of
Shanghai Pilot Free Trade Zone, this document specified seven measures, including
encouraging commercial banks to set up wealth management subsidiaries and
investment subsidiaries to invest in equity in unlisted companies, promoting facilitation
of cross-border trade and investment, and ramping up the development of fintech.
Meanwhile, in order to open up Shanghai’s financial industry at a higher level, this
document set out 11 measures, including expanding market access for foreign-funded
financial institutions, promoting the construction of the RMB-denominated financial
asset allocation and risk management center, and creating a sound financial
environment in line with international standards.
As far as physical space is concerned, commercial buildings in Shanghai Lujiazui
Financial and Trade Zone rivalled those on the Wall Street and in the City of London 10
years ago. The progress made by Shanghai International Financial Center in recent years
is built not on visible skyscrapers, but on intangible innovations in financial systems and
mechanisms.
With China’s deep integration into the global market, Shanghai will continue to improve
its service capacity and move towards becoming an international financial center with a
stronger ability to allocate global resources. Efforts will be made to build a hub and
portal for financial opening-up, and finally develop Shanghai into a center of global
asset management, cross-border investment and financing services, fintech,
international insurance, global RMB-denominated asset pricing and settlement,
financial risk management, and stress testing.
No matter how the global economic landscape changes, Shanghai continues to
benchmark itself against world-renowned international financial centers, marshaling
high-end financial factors and market players from across the world. With a new
mission at a new starting point, Shanghai International Financial Center will embark on
a new journey. In the post-2020 era, Shanghai will march towards even higher goals for
building an international financial center.
24The Global Financial Centres Index 28
Regional Analysis
In our analysis of the GFCI data, we look at six regions of the world to explore the
competitiveness of their financial centres. Alongside the ranks and ratings of centres,
we look at trends in the leading centres in each region and investigate the average
assessments received by regions and centres in more detail.
We display this analysis in charts which show:
• the mean assessment provided to that region or centre;
• the difference in the mean assessment when home region assessments are
removed from the analysis;
• the difference between the mean and the assessments provided by other regions;
• the proportion of assessments provided by each region.
Charts 9 and 10 show examples of these analyses. Coloured bars to the left of the
vertical axis indicate that respondents from that region gave lower than the average
assessments. Bars to the right indicate respondents from that region gave higher than
average assessments. It is important to recognise that assessments given to a centre by
people based in that centre are excluded to remove ‘home’ bias.
The additional vertical axis (in red) shows the mean of assessments when assessments
from the home region are removed. The percentage figure noted by each region
indicates the percentage of the total number of assessments that are from that region.
“City reputation and branding attract international
attention to help a city attract more financial
capital and human capital from across the world.
London, Hong Kong, and Singapore show strong
competitiveness in terms of city reputation and
branding as international financial centres. City
reputation and branding are crucial factors in terms
of making a financial centre go to the next level,
especially going global.”
TEAM LEADER, LOCAL GOVERNMENT, SEOUL
25The Global Financial Centres Index 28
Chart 9 | Example 1: Assessments Compared With The Mean For Region 6
This line shows that the assessments
given by other regions and excluding
those from region 6 had an average 10
points lower than the overall mean.
Respondents from region 6 rated their
home centres higher than
respondents from other regions.
This percentage shows
This bar shows that that 32 per cent of
assessments from assessments for region
centres in this region 6 came from centres in
Region 1 (32%)
averaged 41 points region 1.
below the mean for Region 2 (24%)
region 6.
Region 3 (7%)
Region 4 (5%)
Region 5 (9%) This bar shows that
assessments from centres in
Region 6 (15%) this region averaged 72
points above the mean for
Multi-Regional (8%) region 6.
-125 -75 -25 623 25 75 125
This figure is the mean of all
assessments in the GFCI for
region 6.
Chart 10 | Example 2: Assessments Compared With The Mean For An Individual Centre
26The Global Financial Centres Index 28
Western Europe
London held onto second place in the index, and improved its ratings. The leading
group of Western European centres increased their ratings and rankings, although most
other centres in the region fell in the ratings. An exception was Madrid, which rose 15
places in the rankings and 14 rating points. Oslo and Glasgow also rose more than ten
places in the rankings.
Table 7 | Western European Top 20 Centres In GFCI 28
GFCI 28 GFCI 27 Change in Change in
Centre
Rank Rating Rank Rating Rank Rating
London 2 766 2 742 0 ▲24
Zurich 10 724 14 719 ▲4 ▲5
Luxembourg 12 719 18 715 ▲6 ▲4
Edinburgh 13 718 17 716 ▲4 ▲2
Geneva 14 717 9 729 ▼5 ▼12
Frankfurt 16 715 13 720 ▼3 ▼5
Paris 18 713 15 718 ▼3 ▼5
Amsterdam 22 701 27 703 ▲5 ▼2
Stockholm 23 700 28 702 ▲5 ▼2
Madrid 28 692 43 678 ▲15 ▲14
Hamburg 29 690 29 699 0 ▼9
Brussels 30 686 34 691 ▲4 ▼5
Dublin 34 679 30 698 ▼4 ▼19
Copenhagen 36 674 35 689 ▼1 ▼15
Stuttgart 37 672 32 696 ▼5 ▼24
Milan 38 670 42 679 ▲4 ▼9
Munich 48 653 37 687 ▼11 ▼34
Oslo 50 651 61 654 ▲11 ▼3
Glasgow 52 648 65 650 ▲13 ▼2
Rome 53 643 53 662 0 ▼19
Chart 11 | Top Five Western European Centres Over Time
27The Global Financial Centres Index 28
Chart 12 | Average Assessments By Region For Western Europe – Difference From The Overall Mean
Chart 13 | Assessments By Region For London - Difference From The Overall Mean
Chart 14 | Assessments By Region For Zurich - Difference From The Overall Mean
Chart 15 | Assessments By Region For Luxembourg - Difference From The Overall Mean
28The Global Financial Centres Index 28
Asia/Pacific
Asia/Pacific centres overall performed well in GFCI 28. Hong Kong and Shanghai improved
their position slightly while Singapore and Tokyo fell in the rankings. All these leading
regional centres, as well as Beijing and Shenzhen rose in the ratings. Shenzhen entered
the global top ten. Twelve centres rose in the rankings, including large improvements for
Osaka, Taipei, Chengdu, Qingdao, and New Delhi. The longer term trend over a number of
years of Asia/Pacific centres improving mostly continues. The top six centres in the region
are firmly embedded in the top ten centres in the overall index.
Table 8 | Asia/Pacific Top 20 Centres In GFCI 28
GFCI 28 GFCI 27 Change in Change in
Centre
Rank Rating Rank Rating Rank Rating
Shanghai 3 748 4 740 ▲1 ▲8
Tokyo 4 747 3 741 ▼1 ▲6
Hong Kong 5 743 6 737 ▲1 ▲6
Singapore 6 742 5 738 ▼1 ▲4
Beijing 7 741 7 734 0 ▲7
Shenzhen 9 732 11 722 ▲2 ▲10
Guangzhou 21 710 19 714 ▼2 ▼4
Seoul 25 695 33 694 ▲8 ▲1
Melbourne 27 693 21 712 ▼6 ▼19
Sydney 32 682 20 713 ▼12 ▼31
Mumbai 35 678 45 672 ▲10 ▲6
Osaka 39 665 59 656 ▲20 ▲9
Busan 40 664 51 664 ▲11 0
Kuala Lumpur 41 663 44 677 ▲3 ▼14
Taipei 42 662 75 640 ▲33 ▲22
Chengdu 43 659 74 641 ▲31 ▲18
Wellington 44 657 31 697 ▼13 ▼40
Qingdao 47 654 99 610 ▲52 ▲44
New Delhi 49 652 69 646 ▲20 ▲6
Bangkok 58 617 58 657 0 ▼40
Chart 16 | Top Five Asia/Pacific Centres Over Time
29The Global Financial Centres Index 28
Chart 17 | Average Assessments By Region For Asia/Pacific – Difference From The Overall Mean
Chart 18 | Assessments By Region For Shanghai - Difference From The Overall Mean
Chart 19 | Assessments By Region For Tokyo - Difference From The Overall Mean
Chart 20 | Assessments By Region For Hong Kong - Difference From The Overall Mean
30The Global Financial Centres Index 28
North America
The extent of changes in ratings and rankings in this region were less than for other parts
of the world. New York retained its leading place in the index, increasing one point in the
ratings. Boston, Washington DC and San Diego improved their rankings.
By contrast, Los Angeles, Chicago, Vancouver, Toronto and Calgary fell in the rankings
in this edition of the GFCI.
Table 9 | North American Centres In GFCI 28
GFCI 28 GFCI 27 Change In Change In
Centre
Rank Rating Rank Rating Rank Rating
New York 1 770 1 769 0 ▲1
San Francisco 8 738 8 732 0 ▲6
Los Angeles 11 720 10 723 ▼1 ▼3
Boston 15 716 25 708 ▲10 ▲8
Washington DC 19 712 24 709 ▲5 ▲3
Chicago 20 711 16 717 ▼4 ▼6
Vancouver 24 698 22 711 ▼2 ▼13
Montreal 26 694 26 704 0 ▼10
Toronto 31 684 23 710 ▼8 ▼26
Calgary 51 649 40 681 ▼11 ▼32
San Diego 60 605 81 634 ▲21 ▼29
Chart 21 | Top Five North American Centres Over Time
31The Global Financial Centres Index 28
Chart 22 | Average Assessments By Region For North America – Difference From The Overall Mean
Chart 23 | Assessments By Region For New York - Difference From The Overall Mean
Chart 24 | Assessments By Region for San Francisco - Difference From The Overall Mean
Chart 25| Assessments By Region For Los Angeles - Difference From The Overall Mean
32The Global Financial Centres Index 28
Eastern Europe & Central Asia
Istanbul, Moscow, and Athens improved their ranking in GFCI 28 although other
centres fell back, reversing the region’s performance from GFCI 27. Seven of the 16
centres in the region centres dropped over 10 places in the rankings, including Almaty,
which lost the improvement it made in GFCI 27. Bratislava is a new entrant to the
index, ranked 87th. Centres which fell less than others took a higher position in the
region, for example, Nur-Sultan is sixth in the regional table compared with 11th in
the region in GFCI 27.
Table 10 | Eastern European & Central Asian Centres In GFCI 28
GFCI 28 GFCI 27 Change In Change In
Centre
Rank Rating Rank Rating Rank Rating
Warsaw 57 618 50 665 ▼7 ▼47
Moscow 62 600 71 644 ▲9 ▼44
Istanbul 64 595 79 636 ▲15 ▼41
Prague 66 593 46 671 ▼20 ▼78
Cyprus 71 588 67 648 ▼4 ▼60
Nur-Sultan 74 585 72 643 ▼2 ▼58
Vilnius 76 578 66 649 ▼10 ▼71
Bratislava 87 552 New New New New
Tallinn 88 551 52 663 ▼36 ▼112
Athens 92 547 96 614 ▲4 ▼67
Sofia 95 540 62 653 ▼33 ▼113
Riga 97 538 70 645 ▼27 ▼107
Baku 98 537 57 658 ▼41 ▼121
Almaty 99 536 55 660 ▼44 ▼124
Budapest 101 531 84 628 ▼17 ▼97
St Petersburg 104 523 97 613 ▼7 ▼90
Chart 26 | Top Five Eastern European & Central Asian Centres Over Time
33The Global Financial Centres Index 28
Chart 27 | Average Assessments By Region For Eastern Europe & Central Asia - Difference From The
Overall Mean
-238
Chart 28 | Assessments By Region For Warsaw - Difference From The Overall Mean
Chart 29 | Assessments By Region For Moscow - Difference From The Overall Mean
Chart 30 | Assessments By Region For Istanbul - Difference From The Overall Mean
34The Global Financial Centres Index 28
The Middle East & Africa
In this region, the majority of centres fell in terms of both ranking and rating. Cape
Town made up ground after falling in the rankings in GFCI 27. Abu Dhabi rose six places
in the rankings. Other centres fell back and in particular, Bahrain and Riyadh fell back
sharply in the ratings and rankings.
Dubai continues to lead the table in the region and Casablanca continues to take first
place in Africa.
Table 11 | Middle East & African Centres In GFCI 28
GFCI 28 GFCI 27 Change in Change in
Centre
Rank Rating Rank Rating Rank Rating
Dubai 17 714 12 721 ▼5 ▼7
Abu Dhabi 33 681 39 682 ▲6 ▼1
Tel Aviv 45 656 36 688 ▼9 ▼32
Casablanca 46 655 41 680 ▼5 ▼25
Doha 56 627 48 669 ▼8 ▼42
Mauritius 63 598 64 651 ▲1 ▼53
Cape Town 67 592 80 635 ▲13 ▼43
Bahrain 83 562 56 659 ▼27 ▼97
Johannesburg 90 549 85 627 ▼5 ▼78
Nairobi 96 539 87 625 ▼9 ▼86
Tehran 102 528 95 615 ▼7 ▼87
Kuwait City 103 524 91 620 ▼12 ▼96
Riyadh 107 486 88 624 ▼19 ▼138
Chart 31 | Top Five Middle East & African Centres Over Time
35The Global Financial Centres Index 28
Chart 32 | Average Assessments By Region For The Middle East & Africa — Difference From The Overall Mean
Chart 33 | Assessments By Region For Dubai - Difference From The Overall Mean
Chart 34 | Assessments By Region For Abu Dhabi - Difference From The Overall Mean
Chart 35 | Assessments By Region For Tel Aviv - Difference From The Overall Mean
36The Global Financial Centres Index 28
Latin America & The Caribbean
Centres in Latin America & The Caribbean recovered ground in GFCI 28, with nine of the
eleven centres in the region improving in the rankings since GFCI 27. The Bahamas and
Barbados improved considerably in the rankings, up 36 and 22 places respectively.
Cayman Islands fell 31 places in the rankings.
Table 12 | Latin American & Caribbean Centres In GFCI 28
GFCI 28 GFCI 27 Change in Change in
Centre
Rank Rating Rank Rating Rank Rating
Bermuda 61 601 63 652 ▲2 ▼51
Bahamas 69 590 105 599 ▲36 ▼9
Mexico City 70 589 78 637 ▲8 ▼48
British Virgin Islands 72 587 60 655 ▼12 ▼68
Cayman Islands 78 575 47 670 ▼31 ▼95
Sao Paulo 80 569 83 632 ▲3 ▼63
Rio de Janeiro 85 560 89 622 ▲4 ▼62
Barbados 86 559 108 583 ▲22 ▼24
Panama 91 548 94 616 ▲3 ▼68
Santiago 93 546 104 603 ▲11 ▼57
Buenos Aires 94 543 106 592 ▲12 ▼49
Chart 36 | Top Five Latin American & Caribbean Centres Over Time
37The Global Financial Centres Index 28
Chart 37 | Average Assessments By Region For Latin America & The Caribbean – Difference From The
Overall Mean
Chart 38 | Assessments By Region For Bermuda - Difference From The Overall Mean
Chart 39 | Assessments By Region For Bahamas - Difference From The Overall Mean
198
Chart 40 | Assessments By Region For Mexico City - Difference From The Overall Mean
38The Global Financial Centres Index 28
Home Centre Prospects
While the GFCI is calculated using only assessments from other centres, we ask
respondents about the prospects of the centre in which they are based; and
specifically whether their ‘home’ centre will become more or less competitive.
In general, people are more optimistic about the future of their own centre than
people outside that centre. Respondents from Shanghai are particularly optimistic.
However, respondents in London continue to be less certain than those in other
centres, reflecting the continuing uncertainty about future trading relations with the
E.U. and the rest of the world. In Tokyo, the largest group of respondents
considered that their city's performance would remain about the same.
Chart 41 | Home Centre Prospects - New York Chart 42 | Home Centre Prospects - London
Chart 43 | Home Centre Prospects - Shanghai Chart 44 | Home Centre Prospects - Tokyo
Shanghai has evolved in creating a more transparent
regulatory and legal environment.
CHIEF INVESTMENT OFFICER, INSURANCE, SHANGHAI
39The Global Financial Centres Index 28
Stability
The GFCI model allows for an analysis of the volatility in financial centre
competitiveness. Chart 45 contrasts the ‘spread’ or variance of the individual
assessments given to each of the top 40 centres with the sensitivity to changes in the
instrumental factors.
The chart shows three bands of financial centres. The unpredictable centres in the
top right of the chart have a higher sensitivity to changes in the instrumental factors
and a higher variance of assessments. These centres have the highest potential future
movement. The stable centres in the bottom left have a lower sensitivity to changes
in the instrumental factors and a lower variance of assessments.
We have only plotted the top 40 centres (for clarity) but it is worth noting that most
of the centres lower in the index would be in the dynamic and unpredictable areas of
the chart if plotted. The top ten centres in the index are all in the stable area, with
Brussels and Copenhagen shown in the dynamic area for the first time.
Chart 45 | Stability Of The Top 40 Centres In GFCI 28
40You can also read