Supporting People and Place: Planning for a Just Transition in Northern Ireland - The Nevin Economic ...
←
→
Page content transcription
If your browser does not render page correctly, please read the page content below
l

          Supporting People and
                         Place:
    Planning for a Just Transition in Northern
                                       Ireland

                             Aoife Ní Lochlainn

               NERI Working Paper Series No. 71
                             December 2020

                0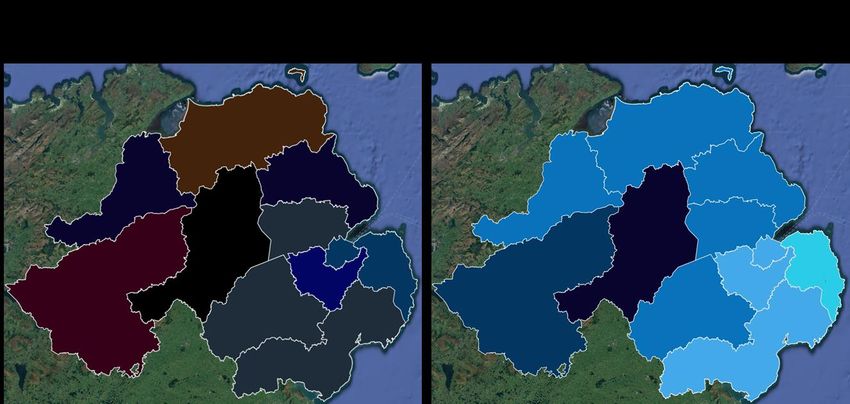
When citing this report, please use the following wording:

     Ní Lochlainn, A. (2020) Supporting People and Place: Planning for a Just Transition for

Northern Ireland, NERI Working Paper Series, NERI WP 2020/N0 71, Dublin: NERI.

NERI working papers represent un-refereed work-in-progress and the author(s) are solely
responsible for the content and any views expressed therein. Comments on these papers
are invited and should be sent to the author(s) by e-mail. This paper may be cited.

The authors gratefully acknowledge helpful feedback from a number of reviewers. The
usual disclaimer applies. All correspondence to aoife.nilochlainn@gmail.com

This working paper and any associated materials are available online at:
www.nerinstitute.net
A JUST TRANSITION FOR NORTHERN IRELAND

Aoife Ní Lochlainn (NERI) Nevin Economic Research Institute, Dublin, Ireland

Keywords: Just Transition, Climate Change, Agrifood, Skills needs, Economic transition.
JEL Codes: J21, J24, J50, O20, Q50

______________________________________________________________________

ABSTRACT

A just transition is often defined as one which includes decent work for all, social inclusion

and the eradication of poverty. Northern Ireland faces a significant challenge to

decarbonise its economy and society. While the obligation to reduce carbon emissions is a

shared one, the capacity to bear the brunt of such a large-scale transition is unequal. The

burden of economic transformation is often felt first by workers, particularly those in the

power or fossil fuel extraction sectors. However, other sectors and geographic areas may

be at risk from negative impacts of decarbonisation. A just transition framework provides a

structure for stakeholders and government to assess sectoral vulnerabilities and

collaborate in the design of carbon reduction policies which support vulnerable workers

and communities. This paper examines the risks for workers in Northern Ireland from

decarbonisation in particular, identifying the sectors and the geographic areas most at risk

from transition. It will also examine some of the elements needed to embed a Just

Transition in principle and practice in Northern Irish climate policy.

This version: 07 January 2021

                                                 1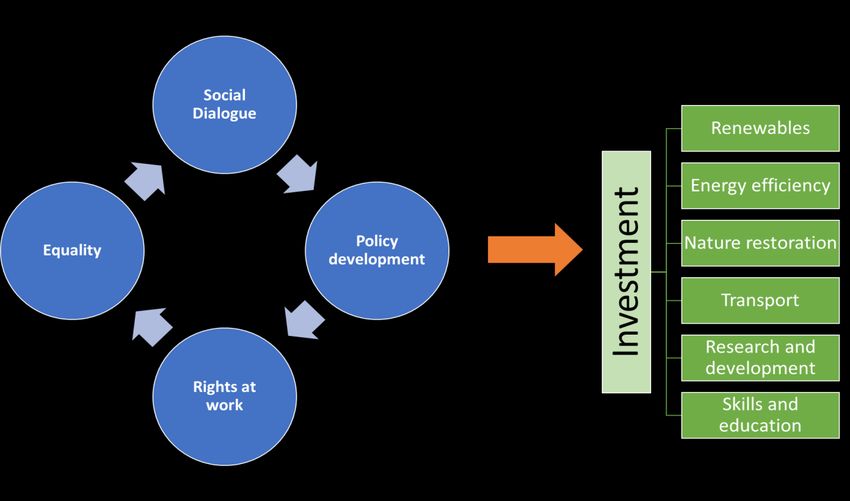
SUPPORTING PEOPLE AND PLACE: PLANNING FOR A JUST
           TRANSITION IN NORTHERN IRELAND

Aoife Ní Lochlainn (NERI) Nevin Economic Research Institute, Dublin, Ireland

SECTION 1: INTRODUCTION

Northern Ireland is at a critical point in its path to decarbonisation. Left without a

functioning Government for three years, the Executive was finally re-established early in

2020 just a few weeks before the Covid-19 crisis struck. Similar to its neighbours, Northern

Ireland is grappling with the challenge of decarbonising its economy and society in a period

of heightened global uncertainty. However, the political limbo has meant there has been

less opportunity to progress climate action in the past few years.

The political agreement struck in January 2020 re-establishing the Executive (New Decade,

New Approach, 2020), commits to bringing forward a Climate Change Act with

“environmental targets” and a Green New Deal. It also commits to forming a new energy

strategy with “ambitious targets and actions for a fair and just transition to a zero carbon

society”. Thus, following years of decision-making stasis due to the lack of a functioning

executive, there is a concerted effort being made to bring Northern Ireland climate policy

into line with other UK countries.

Globally, the public demands for action have become louder and more persistent over the

last number of years, amplified, no doubt by the rising voice of youth leaders such as Greta

Thunberg and leaders of the Global Fridays for Future movement; however, climate policy

can be seen as ‘top down’, technocratic and difficult to communicate. Just transition

frameworks and programmes represent an effort to address this weakness in climate policy

making and consider the impacts of transition to a low carbon economy in a more inclusive

way.

Recent NERI work on this topic includes a number of papers examining just transition in the

Republic of Ireland. This paper should be read in conjunction with that ongoing work.

                                              2
This paper will address the challenge of a planning a just transition for Northern Ireland.
Section 2 will explore the concept of a just transition. Section 3 will examine the climate
change challenge for Northern Ireland, reduction targets and emissions profile. Section 4
will look at the vulnerability of certain economic sectors and workers to negative impacts on
job security from a transition to a low carbon economy. Section 5 will look at the agri-food
industry and the section 6 will discuss green jobs, and skills in Northern Ireland. Finally, the
paper will discuss the just transition framework and the role of social dialogue.
SECTION 2: WHAT IS A JUST TRANSITION?
The obligation to decarbonise our economy and society is a shared one, yet it exists in a
context where the capacity to bear the brunt of such a large-scale transition is unequal. A
rich and growing literature on energy justice provides a starting point for discussion on how
the transition to carbon neutrality can be a socially inclusive one, undertaken in a
democratic way (Healy and Barry, 2017, Gambhir et.al. 2018). The scale of the transition
needed to meet the goals of the Paris Agreement will require a significant reshaping of the
economy, which in turn will impact on jobs, livelihoods and job opportunities. This will be
acute for segments of the workforce. Without intervention by the state, the impacts of the
transition on parts of the population may be negative. Yet, if managed well, the transition
could lead to more job opportunities, better quality higher paying work in addition to a
healthier environment.
The concept of the just transition originated in the trade union movement and was
primarily focused on the employment and workers’ rights related impacts of
decarbonisation (Galgóczi, 2018). However, for some, the idea has come to include other
groups who may be vulnerable to negative impacts from an economic transition, such as
rural communities (Healy and Barry, 2017). Whether a just transition policy focuses only on
workers or targets a broader group of people, what is common to both approaches is the
question of where power lies and the capacity of vulnerable individuals or groups not only
to withstand, but also to flourish under the transition.
3Experience of mismanaged transitions coupled with a feeling of exclusion from both the
conversation and the decision-making process has left some local populations and groups
of workers distrustful of climate action (NEF, 2019). Regions such as the north of England,
still scarred from closures of coal industries decades ago, are a prime example of badly
managed transitions (Emden and Murphy, 2019). The north of England is facing a new
transition, this time to a low carbon economy; for communities who were impacted by the
closures in the 1980s, however, the effects of economic devastation are all too recent. Far
off promises of greener, better jobs may have little relevance to those who feel that their
current jobs are at risk, especially in sectors or geographic areas which have previously
experienced an unjust transition. Discussion which highlights the potential creation of
green jobs but does not acknowledge that those jobs may be created in different locations,
require different skill sets and are not yet a reality, may be met with scepticism from those
whose livelihoods and careers are threatened (Gambhir et.al. 2018). In addition, climate
action policies and debates must recognise the historical and cultural heritage connected
to certain industries and their contribution to the economic and social development of their
nation, and how the destruction or transformation of these industries may be negatively
perceived by the communities who built them (NEF, 2019). This may also hold true for
farming communities, another industry with a strong cultural heritage and identity,
regardless of country. Experiences of the transition to a carbon neutral economy will be
place specific and will have their own particular social and historical context.
The journey of just Transition from trade union demand to widely accepted policy
framework - albeit not as widely implemented - has been well-documented (Galgóczi, 2018;
Nugent and Goldrick-Kelly, 2019; Mercier, 2020). Within the UN the International Labour
Organisation (ILO) has been leading on defining the concept and creating a policy
framework. As a tripartite agency, including government, employer and worker
representatives, it is well-placed to develop programmes/guidelines which ‘mainstream’ and
promote the advancement of a green economy that prioritises green jobs and an equitable
shift to a low carbon society. This work and the work of member countries and activists led
to the inclusion of j
4ust transition in the preamble to the Paris climate agreement, resulting in the adoption of a
work programme focused on “economic diversification and transformation and just
transition of the workforce, and the creation of decent work and quality jobs” (UN, 2016)
“Taking into account the imperatives of a just transition of the workforce and the creation
of decent work and quality jobs in accordance with nationally defined development
priorities. “
Paris Agreement
The International Trades Union Confederation (ITUC) defines a just transition as one which
‘secures the future and livelihoods of workers and their communities in the transition to a
low-carbon economy’. While a just transition is concerned that the outcomes are just, the
process is equally as important, especially given the long-term nature of the transition.
An influential 1998 article by D.B Kohler, a Canadian trade union leader ‘Just Transition – A
Labour View of Sustainable Development’, articulated the view that “the real choice is not
jobs or environment. It is both or neither” (Rosemberg, 2010). The trade union movement
during this period, while understanding the economic benefits of a developing low carbon
economy, was also aware of the complexity of this task and that a just transition
approach/framework should operate in tandem with environmental policies rather than in
opposition to them. With this in mind, a just transition framework should incorporate the
following principles for guiding policy making for a low-carbon economy (op.cit.). The first is
an investment approach which upholds decent work and human rights. The second is
social dialogue, and meaningful, democratic consultation with stakeholders that is inclusive
of the wider community. The third is a thorough and early research and assessment of the
social and employment impacts of carbon reduction policies. The fourth is the development
of social protection policies and labour market policies to minimize risk of job losses and/or
provide income support for vulnerable workers. Finally, the fifth is the development of local
economic diversification plans, in order to prepare for transition in vulnerable areas.
Just transition, as it has found form in UN frameworks, accords with the related but broader
concept of sustainable development and specifically the Sustainable Development Goals
(SDG). It creates a framework for economic development which can help achieve a number
5of the SDGs: One (no poverty), seven (affordable and clean energy), eight (decent work and
economic growth), 10 (reduce inequality) and 13 (climate action).
While just transition polices, where they have been implemented, have been subject to
many evaluations, there is relatively little critique of the concept itself. Galgóczi (2019)
warns that just transition as a concept will/has become too broad “and general and often
even overstretched” to be meaningful.
However, just transition might be defined or constituted; the ILO has provided guidance on
common principles to inform implementation.
Social dialogue leading to a strong social consensus on the goals and the pathway
to transition. Social dialogue must be part of the framework and consultation with
stakeholders must be informed and ongoing;
Respect for rights at work;
Policies must take into account gender equality;
Policies must be coherent, providing a just transition framework which will promote
the creation of decent jobs, anticipate the impacts of transition on employment,
provide for adequate and sustainable social protection for job losses, promote skills
development and allow collective bargaining and the right to organise;
Policies and programmes should be bespoke policies and programmes;
International cooperation between countries should be fostered (ILO, 2015).
Fundamental to the success of just transition policies, is the creation of a framework,
enabling policy-making under the principles listed above.
6SECTION 3: CLIMATE CHALLENGE FOR NORTHERN IRELAND
Like its neighbour south of the border, Northern Ireland has often been labelled a ‘climate
laggard’ 1. While it makes up 3% of the UK population, Northern Ireland currently accounts
for approximately 4% of the UK’s GHG emissions (CCC, 2019). Among the constituent
countries of the UK it is the only one not to have climate targets set out in law and while it is
included in the UK 2008 Climate Change Act and accompanying targets, it does not have
specific Northern Ireland legislation setting out a framework for meeting such targets. Many
of the levers required for climate mitigation policies are devolved or partially devolved,
making it more important that the devolved counties have legislative frameworks which
enable coherent policy-making (CCC, 2019a).
Under the 2008 Climate Change Act (the Act), carbon budgets are set for five year terms
with emissions reduction targets for the UK as a whole and, as requested, proposed targets
for the devolved administrations2. However, each country can, if it chooses, set targets
beyond those set out in the carbon budgets. The Act set a 2050 target of an 80% GHG
emissions reduction on 1990 levels by 2050. In 2019, it was amended to set a new target of
net zero emissions by 2050. Following this, Scotland and set a new targets of net zero by
2045 and Wales accepted the CCC recommendation of a 95% reduction by 2050 but
announced its ambition to develop a path to net zero. The Northern Ireland executive of
2011-2016 set a target of 35% by 2025 in its Programme for Government. The Fifth Carbon
Budget under the Act proposed a pathway for Northern Ireland for reaching at least 35%
reduction in GHG emissions by 2030. Until 2019, Northern Ireland was projected to miss
this 2025 target by approximately 3%, but, due to the announced closure of the Kilroot
coal-powered electricity station 3 the Department of Agriculture, Environment and Rural
Affairs (DAERA, 2020) has projected that the 35% target will actually be exceeded in 2025.
1
See for example, https://www.belfasttelegraph.co.uk/news/northern-ireland/edwin-poots-accused-
of-blocking-climate-change-legislation-39385663.html
2
Minister Poots wrote to the CCC in 2020 requesting that it provide advice on a ‘fair target’ for
Northern Ireland and advice on how to meet it (CCC, 2020c)
3
It has since been announced that it will be converted to a gas-powered station with the retention of
150 jobs.
7The collapse of the executive in 2017 means that Northern Ireland’s GHG emissions
reductions targets have not been updated since the 2011-2016 Programme for
Government. The Sixth UK Carbon Budget, set in December 2020, proposes updated 2030
and 2050 targets for Northern Ireland, in line with the UK target of net zero emissions by
2050. However, like Scotland, there is no barrier to Northern Ireland setting its own, higher
targets in a Programme for Government and/or climate change legislation. The all-party
agreement re-establishing the government in early 2020, New Decade New Approach,
commits to a “climate change Act with legally binding and ambitious sectoral emission reduction
targets”4. Aside from a climate change act, New Decade New Approach commits to a number
of other environmental and related economic policies including the establishment of an
independent environmental protection agency, a Green New Deal and new energy strategy
which “will set ambitious targets and actions for a fair and just transition to a zero carbon
society” (New Decade New Approach, 2020: 44). At the time of publishing this paper, these
commitments were either in the very early stages or had not been commenced. 5
The lack of a functioning Assembly or Executive in Northern Ireland between 2017 and
2020 meant that the there was little policy development during those years in devolved
policy areas. An estimated 160 pieces of legislation were held up during this period and
only essential legislation was introduced by Westminster (Gstrein and Prince, 2020) This
stagnation in policy making in Northern Ireland may perhaps be seen in the projections for
GHG emissions made by DAERA, which show a levelling off of reductions in 2025 due to “no
further policy savings”.
“Emissions are expected to decrease year-on-year until 2025 when they level off. The
downward trend is mainly driven by the energy supply sector with Kilroot power station
closing in 2024 contributing to the decrease between 2018 and 2025 before levelling off
as no further policy savings are included.”
4
New Decade New Approach can be found at:
https://assets.publishing.service.gov.uk/government/uploads/system/uploads/attachment_data/file/8
56998/2020-01-08_a_new_decade__a_new_approach.pdf
5
Consultations have begun on the energy strategy, climate legislation and the programme for
government and the green economy (green new deal).
8DAERA (2020) Report on Northern Ireland Greenhouse Gas Projections6
Figure 1 below, shows 2017 reported emissions and DAERA projected emissions for 2025
and 2030. The tailing-off of projected emissions reductions between 2025 and 2030 can be
clearly seen in the chart; total emissions are projected to fall 22.1% from 2017 to 2025 and
a further 1.1% between 2025 and 2030.
Figure 1: Northern Ireland emissions 2017 and projected emissions 2030
20.0
18.0
16.0
Waste management
14.0 Transport
12.0 Residential
Public
10.0
Land use change
8.0 Industrial process
Energy supply
6.0
Business
4.0
Agriculture
2.0
0.0
2017 2025 2030
Source: DAERA (2020) Northern Ireland Greenhouse Gas Projections based on 2017 GHG
inventory
As highlighted by DAERA, the reduction in emissions from energy supply make up the
largest saving, 61% from 2017 to 2025 and a further 0.6% from 2025 to 2030. This is
followed by reductions in business and waste management (see table 1).
6
https://www.daera-ni.gov.uk/articles/northern-ireland-greenhouse-gas-projections
9Table 1: Percentage change in Northern Ireland emissions 2017 and projected emissions
2025 and 2030
% change % change % change
1990 to 2030 2017 to 2025 2025 to 2030
Agriculture -3.4 -4.7 -0.6
Business -52.2 -31.9 -9.4
Energy supply -75.1 -61.0 -0.6
Industrial process -78.4 0.2 0.0
Land use change 15.7 -11.6 6.4
Public -59.4 -0.6 5.3
Residential -33.5 -12.0 4.9
Transport 9.7 -13.5 -2.6
Waste management -76.8 -42.8 -6.3
Total -36.7 -22.1 -1.1
Source: DAERA (2020) Northern Ireland Greenhouse Gas Projections based on 2017 GHG
inventory
The Climate Change Committee (CCC) is the independent advisor on climate change to
parliament. It provides advice and progress reports to both the UK and devolved
governments/parliaments. A 2019 CCC report on the net zero target provided advice on
mitigation policies, sectoral challenges and targets for the devolved administrations (CCC,
2019b). It analyses sectoral reduction possibilities and obstacles under three different
ambition levels, ‘highest possible ambition’, which correlates to net-zero emissions by 2050,
‘further ambition’ which correlates to 96% GHG reductions and ‘core ambition’ which
correlates to the previous 80% target. To move from further ambition to highest possible
ambition, the report provides what it terms ‘speculative options’, which include more
difficult policy options such as demand reduction in aviation and diet, radical shifts in land
use and more extensive use of carbon removal and storage technologies.
Taking into account each county’s particular emissions profile and feasibility challenges, the
report gives indicative targets for the devolved administrations which would be needed for
the whole of the UK to reach the net-zero target on a cost-effective basis. The
characteristics of each administration’s economy, biogeography, society and culture/history
present different opportunities for effective and efficient emissions reductions and also
present different obstacles. Scotland has a greater capacity for emissions removal through
the Land Use, Land Use Change and Forestry (LULUCF) sector for example than the other
10administrations, giving it greater flexibility in policy making in other areas (see figure 2
below).
UK emissions reductions in recent years have been concentrated in the energy sector due
to the move away from coal-fired electricity generation, due to be complete by 2025 (CCC,
2020). This means that future reductions must come from other sectors, transport,
residential, agriculture and a transition from gas-fired to renewable energy. In order to
reach the net zero target for 2050, the CCC has recommended, as part of its Sixth Carbon
Budget, that the UK set a target for emissions reduction of 63% by 2035 (CCC, 2020b).
While the carbon budgets for the 2030-40s provide important signals for investment, both
public and private, there is pressure to increase the interim 2030 targets and frontload
emissions reductions. This pressure stems from those who advocate greater earlier action
for both moral and economic reasons. Reports of record-breaking heat over the last
decade provide a scientific argument for accelerating, or front-loading emissions
reductions. The economic argument of greater cost effectiveness, articulated forcefully in
the Stern Report of 2006, has also been made by the Committee itself in its Fourth Carbon
Budget: “pathways with early [domestic] action…are more cost-effective over time than
pathways which delay action towards meeting the 2050 emissions reduction target” (CCC,
2010)
Northern Ireland has an emissions profile more similar to that of the Republic of Ireland7
than that of other UK administrations. Its agriculture emissions are just over 27%, nearly
three times that of the UK as a whole, which is around 10%, but close to those of the
Republic of Ireland, which sit at 34%. Agriculture also holds a similar socio-economic and
cultural place in Northern Ireland as it does in the Republic of Ireland. It is the only devolved
administration where LULUCF is a source of emissions rather than a sink, for both
biogeographic and socio-economic historical land-use reasons.
In contrast to the land-use, at 15%, Northern Ireland has the lowest energy supply
emissions of the four administrations, which is unsurprising given the historical and current
7
Republic of Ireland GHG emissions by source 2018 Agriculture – 33.9%, Transport – 20.1%, Energy
– 17.5%, Residential – 10.2%, Business – 7.8% Industrial Processes - 3.8% (Source: EPA, 2020).
11importance of the coal and oil industries in Britain. Energy emissions in Wales, where the
coal industry has been historically dominant, is at 30% and in England it is 21.5%. Scotland,
while home to a large oil and gas industry has energy emissions on a par with Northern
Ireland, at just 16%. Scotland has built a strong renewable energy sector.
Due to Northern Ireland’s emissions profile, the CCC has recommended that the 2050
target be set at an 82% reduction over 1990 levels. Interim targets would be as follows:
69% reduction in all GHG emissions by 2040 and 48% by 2030. This means the period of
the Sixth Carbon budget, 2033-2037 would see a 60% reduction over 1990 levels (CCC,
2020c). For Northern Ireland, the CCC does believe that a net zero for all GHG emissions is
attainable by 2050, instead they have recommended that CO2 emissions would reach net
zero by that stage but that other GHG emissions (in particular methane) would not. This is
due to the agricultural profile of Northern Ireland and the fact that it is an important
exporter of beef, lamb and dairy to the rest of the UK.
Figure 2: Northern Ireland and UK GHG emissions profiles - 2018
100%
Agriculture
Business
80%
Energy Supply
60% Exports
Industrial processes
40%
Land use, land use change
and forestry
Public
20%
Residential
0% Transport
Waste Management
-20%
England Wales Scotland Northern
Ireland
Source: NAEI (2020) Greenhouse Gas Inventories for England, Scotland, Wales and
Northern Ireland 2018
12While Northern Ireland may account for an almost negligible amount of UK emissions,
when taken together, the policies of the devolved administrations are critical to the UK
reaching its target (CCC, 2019). Advice from the CCC in its 2019 recommendations on policy
measures to reach the fifth carbon budget target of 35% in Northern Ireland by 2030
include: Developing a route to market for low-cost intermittent renewables, in particular
offshore wind; replace the common agricultural plan payments with payments that are
linked to agricultural emissions reductions and sequestration; increase the rate of tree
planting; introduce a policy to incentivise homeowners to install low-carbon heaters,
replace oil boilers with heat pumps; develop policy for delivering energy efficient
improvements in homes targeted at low income households and finally, assist in more
rapid deployment of electric vehicles. These policy options if properly implemented will
deliver a reduction in emissions to Northern Ireland of 40% by 2035 (CCC, 2019). The net
zero UK-wide target requires Northern Ireland to reach a 48% reduction in all GHG by 2040
(CCC, 2020c)
Figure 3: Northern Ireland GHG emissions historical and targeted at the 80% and Net-Zero
targets
30
GHG Inventory
1990 to 2017
25
GHG
20 projections
until 2030 at
UK 80%
MtCO2e
15 reduction 2050
target
GHG
projections at
10 2050 at UK
80% reduction
2050 target
5 GHG
projections at
2030 and 2050
at UK net-zero
0
2050 target
2026
2029
1990
1999
2002
2005
2008
2011
2014
2017
2020
2023
2034
2040
2046
13Source: DAERA (2020) Northern Ireland Greenhouse Gas Projections based on 2017 GHG
inventory, SONI (2020) and the Climate Change Committee (2019) Net Zero: The UKs
contribution to stopping global warming
Figure 4: Northern Ireland historical emissions and projections 1990-2050
35
30
25
20
MtCO2e
15
10
5
-
1990 (base year)
2005
2028
2038
1999
2001
2003
2007
2009
2011
2013
2015
2017
2020
2022
2024
2026
2030
2032
2034
2036
2040
2042
2044
2046
2048
2050
Historical
Balanced Net Zero Pathway
Source: CCC (2020), Sixth Carbon Budget
Figure 5: Path for reaching the net-zero target – Northern Ireland
25
20
Balanced Net Zero Pathway
15
MtCO2e
Headwinds
10 Widespread Engagement
Widespread Innovation
5 Tailwinds
-
2044
2020
2022
2024
2026
2028
2030
2032
2034
2036
2038
2040
2042
2046
2048
2050
Source: CCC (2020), Sixth Carbon Budget
14In its Sixth Carbon Budget, the CCC presented a recommended pathway and scenario
(Balanced Net Zero) under four other scenarios for the UK as a whole and the devolved
administrations. The other scenarios are from Headwinds, Widespread Innovation,
Widespread Engagement and Tailwinds. Headwinds is similar to the Further Ambition
pathway laid out in the 2019 scenarios discussed above (96% UK-wide reduction), which
sees some (but not widespread) behavioural change and some technological advancement.
It is more reliant on carbon capture and storage and hydrogen infrastructure than the
other scenarios. At the other end of the scenario spectrum, the Tailwinds scenario assumes
considerable success in technical innovation and behavioural change, such as a 50%
reduction in meat and dairy UK-wide by 2050. The Balanced Zero Pathway seeks to make
significant reductions in emissions in the 2020s, frontloading the reductions burden. It
assumes for example, a 35% reduction in domestic consumption of all meat and dairy.
Until targets are set by domestic legislation or policy, Northern Ireland will fall primarily
under UK-wide legislation. The levers for policy-making are split between devolved and
reserved. The balance of powers is outlined in the CCC Report (2019):
Economic and fiscal: Mostly reserved
Energy (apart from nuclear): Fully devolved
Planning: Fully devolved
Local government and housing: Mostly devolved (including domestic and public
energy efficiency and fuel poverty).
Industry: Mostly reserved.
Transport: Vehicle standards and taxation is reserved. Demand side measures are
mostly devolved.
Agriculture and land use: Mostly devolved.
Waste: Fully devolved.8
The importance of the devolved administrations to the UK effort is made clear in the
budget. Of the abatement pathways identified for Northern Ireland, Scotland and Wales,
nearly 60% are in the ‘mostly’ or ‘partially’ reserved policy areas (CCC, 2020b).
8
Northern Ireland Office, (2018), Devolution settlement: Northern Ireland. See also CCC (2019),
Reducing Emissions In Northern Ireland
153.1 Energy Sector
The emissions intensity in energy production in Northern Ireland has decreased over the
last ten years. As discussed above, Northern Ireland has met its 2020 target of 40% share
of renewable energy in electricity production. Emissions reduction in the electricity
generation sector will deliver the majority of emissions reduction in Northern Ireland
between 2020 and 2025. Beyond 2025, there are no current policies driving additional
emissions reductions. The forthcoming closure of the Kilroot power plant and its
subsequent conversion from a coal plant to a gas plant means that there will no longer be
any coal burning electricity generating plants in Northern Ireland.
Figure 6: NI consumption of renewable energy generated as a percentage of total energy
consumption
50.0%
45.0%
40.0%
35.0%
30.0%
2009
25.0%
20.0% 2019
15.0%
10.0%
5.0%
0.0%
Jul Aug Sep Oct Nov Dec Jan Feb Mar Apr May Jun
Source: Department for the Economy, (2020)
Over 70% of the renewable share of electricity generation comes from onshore wind
sources. There is currently no offshore wind capacity and it is not expected until 2027.
16Figure 7: The breakdown of the generation energy from renewable sources 2015-2018
5,000.0
4,500.0
4,000.0 Biomass and waste
3,500.0 AD
3,000.0 Other bioenergy
2,500.0 Sewage gas
2,000.0 Landfill gas
Hydro
1,500.0
Solar PV
1,000.0
Onshore Wind
500.0
-
2016 2017 2018
Source: Department for the Economy, (2020)
Energy policy, while fully devolved, is impacted by Northern Ireland’s membership of the
Integrated Single Electricity Market (I-SEM) with the Republic of Ireland. The Department for
the Economy is currently reviewing the energy strategy, due to be published at the end of
2021. The strategy will be informed by the net zero 2050 target.
As discussed above, the hiatus in government in Northern Ireland following the collapse of
the Assembly in 2017 meant that there was little-to-no new policy-making or legislation
introduced. In the renewable energy sector in particular, new policy direction and new
investment vehicles for infrastructure are needed in order to make more progress in the
area.
While the CCC has recommended an 82% reduction in all GHG emissions in Northern
Ireland by 2050 in its sixth carbon budget, it states that there is no technical reason that
net zero could not be achieved (CCC, 2020). Getting to net zero however, would require a
substantial reduction in livestock and greater GHG removal technologies being located in
Northern Ireland. A private members bill introduced by the Green Party and supported by
all other parties apart from the DUP, commits to net zero emissions by 2045. Northern
Ireland is free to set a higher target than that recommended by the CCC; however, the level
17of agricultural emissions and the importance of the agrifood industry to Northern Ireland
provide a significant challenge to higher ambition.
The policy recommendations set out in the CCC 2019 advice for Northern Ireland will
require a significant action by the state across sectors, from agriculture to transport, energy
and housing. However, the actions set out will reduce emissions by 40% by 2030 only,
whereas the new net zero target will require a reduction of at least 48% in 2030. To meet
the 82% reduction by 2050, a much greater reduction in LULUCF emissions will be required
(CCC, 2020c).
18SECTION 4: VULNERABILITIES AND RISK FROM AN UNJUST TRANSITION
The concept of just transition evolved from the trade union movement’s concern that the
costs of transition to a low or carbon-neutral economy would disproportionally negatively
impact groups of workers. While this has developed over time to include other vulnerable
populations such as lower income groups in rural areas (Galgóczi, 2019) this paper will
concentrate on the livelihoods and wellbeing of workers.
Climate legislation in Northern Ireland is imminent. At the time of writing this paper, a
private members bill with cross-party support had been introduced and the Executive had
begun consultation on its own planned legislation. There is also growing political, civil
society and business pressure on the Government to introduce both binding targets to
reduce emissions and a commitment to a just transition.9 With this in mind, what would a
just transition in Northern Ireland look like?
The principles outlined in the ILO guidelines include the idea that policies and programmes
are specifically tailored to the needs of every country/region. Just transition frameworks
provide the structures which guide policy-making. The first step in process must be to
provide a full analysis of the economy, the labour market, the decarbonisation policies
available and the risk to specific sectors and to the livelihoods and wellbeing of workers and
vulnerable populations.
The first group of workers to find themselves impacted by decarbonisation are usually
those in the energy generation and fossil fuel extraction sectors (Botta, 2018; Gambhir et.al.
2018). As noted earlier, in some countries, such as the UK, some communities may have
experienced similar transitions due to other economic factors and policy decisions, such as
the closure of coal mines in the 1980s. Northern Ireland, while having a historically
important industrial and manufacturing base, does not have the same fossil fuel extraction
industry that was prevalent in Great Britain.
9
Just transition is mentioned in New Decade New Approach and in the CCC, 2020 Sixth Carbon
Budget
194.1 Decarbonisation – winners and losers
Globally, decarbonisation will bring many benefits including a healthier environment and
the creation of millions of new jobs. 10 The economic and/or employment benefits may not
be equally felt however, with specific regions and sectors exposed to adverse impacts, such
as job losses (Gambhir et.al. 2018). Employment contraction is expected in industries which
are carbon intensive, but at the same time low-carbon intensive industries such as
renewable energy generation are expected to see an increase in employment (Botta, 2018).
Negative impacts from a low carbon transition are likely to be concentrated in specific
geographic regions (op.cit.). These negative spatial/sectoral impacts may be short-term
initially, but unaddressed they can lead to longer-term economic decline if they are not
replaced by new jobs in the same location. Negative impacts can be amplified by structural
changes driven by new technologies, such as digital, automation and artificial intelligence
(NESC, 2019). This technological advancement is already transforming production, business
models and supply chains and will likely bring with it some short-term disruption and costs
to specific workers and sectors.
NESC research explores the twin challenges of digital and low-carbon transitions in tandem,
stressing the need for a planned approach to both, in order minimise risks and negative
impacts (Moore, 2020). The two transitions are inter-related in more ways than just their
common risks. The push to drive energy efficiencies and low-carbon solutions across the
economy will lead to technological advances and digital innovation (Moore, 2020). In the
Republic of Ireland there is evidence to suggest that 40% of employment is at risk of
displacement or a change in task, in particular in the agricultural, industry, construction,
retail, transport, accommodation and food service, and administrative sectors (NESC, 2020).
NERI research on Northern Ireland found that the advancement in automation, AI, and
other technologies was likely to lead to a greater polarisation of the workforce, with an
increase in both higher skilled and lower skilled employment and a relative stasis in the
level of middle skilled employment (MacFlynn and Wilson, 2019). The nature of the task (e.g.
routine or non-routine) of the worker being an important factor in whether the job was at
10
Recent research has estimated a global loss of 6 million jobs by 2030 but an increase of 26 million
jobs in comparison with a ‘no action’ approach. (Gambhir et.al. 2018).
20risk of displacement. This polarisation has an impact on inequality as lower skilled jobs
generally have lower wages and fewer opportunities for career progression.
Due to this technological advancement, some industries will see a complete change in their
business models, supply and value chains. The car industry is one such example. Many
countries have plans to phase out the sale of new petrol and diesel cars; the UK has vowed
to do so by 2030.11 While this should lead to increased demand for electric vehicles, moving
to electrified powertrains will mean a 30% reduction in value added at the manufacturing
stage. In addition, it is estimated that electrified vehicles will requires less maintenance over
time and fewer spare parts (Galgóczi, 2019). Thus advancement in technology in the car
industry could have a negative impact on the maintenance workers in the motor vehicles
and motorcycles sector in Northern Ireland.
Therefore, given the level of technological advancement required to reduce emissions in
certain sectors, there will be risks to particular jobs in those sectors from both transitions,
in particular in the agricultural and food processing sector and transport and
manufacturing sectors (NESC, 2020). The process of identifying jobs which are at risk from a
transition to a low carbon economy will need to take the digital and technological transition
into account, as threats to employment may come from task-specific displacement due to
low-carbon technological solutions rather than the demise of an industry such as fossil fuel
extraction. This makes estimating risk to employment a difficult undertaking.
Labour Market in Northern Ireland
The labour market in Northern Ireland took far longer to return to its 2008 level than the
rest of the UK (Mac Flynn, P., 2019). While the employment levels recovered and economic
inactivity rates dropped, structural issues in the economy remain, in particular, the
proportion of part time workers, which increased from 23% in 2009 to 26% in 2019 and
temporary workers which increased 5.4% to 7.1%. (Mac Flynn, 2019). Part time employment
is often accompanied by lower pay, less job security and less opportunity for career
progression (Wilson, L., 2017).
11
https://www.gov.uk/government/news/government-takes-historic-step-towards-net-zero-with-end-
of-sale-of-new-petrol-and-diesel-cars-by-2030
21The number in full time employment in all sectors between March 2012 and March 2020
increased 14.3% and in part time employment by 10.9% (table 2 below). The largest
increase in full time employment was in the professional, scientific and technical activities
sector and the information and communication sector, 60.6% and 44.3% respectively,
followed by the administrative and support service sector at 41.2%. In contrast, fulltime
employment in manufacturing rose only 15.9%, with a 35.9% rise in part time employment.
Table 2: Employment in Northern Ireland by SIC (2007)
Standard Industrial Classification Percentage
Mar-12 Mar-20
(2007) Change
Full Part Full Part Full Part
Industry Section
Time Time Time Time Time Time
Agriculture, Forestry and Fishing 3760 8340 4440 8820 18.1 5.8
Mining and quarrying 1560 110 1960 100 25.6 -9.1
Manufacturing 68820 5010 79770 6810 15.9 35.9
Electricity, gas, steam and air
1240 70 1700 220 37.1 214.3
conditioning supply
Water supply, sewerage, waste
management and remediation 4680 290 6210 1000 32.7 244.8
activities
Construction 28670 2740 32310 3350 12.7 22.3
Wholesale and retail trade; repair
64520 58500 64590 64650 0.1 10.5
of motor vehicles and motorcycles
Transportation and storage 19840 4650 23390 5980 17.9 28.6
Accommodation and food service
15690 25320 19630 30980 25.1 22.4
activities
Information and communication 13620 2030 19660 2520 44.3 24.1
Financial and insurance activities 15110 4150 15160 3670 0.3 -11.6
Real estate activities 6320 2880 7260 2680 14.9 -6.9
Professional, scientific and
18140 4850 29140 7030 60.6 44.9
technical activities
Administrative and support service
26680 13410 37670 17050 41.2 27.1
activities
Public administration and defence;
44990 10620 38550 10700 -14.3 0.8
compulsory social security
Education 37400 32930 38120 34220 1.9 3.9
Human health and social work
62980 51360 78170 51800 24.1 0.9
activities
Arts, entertainment and recreation 7570 7500 7470 7760 -1.3 3.5
Other service activities 6950 6840 7330 8450 5.5 23.5
Total 448,570 241,570 512,530 267,800 14.3% 10.9%
Source: Labour Force Survey 2020
22Estimating GHG emissions by sector in Northern Ireland
Emissions per economic sector data are only available at the UK level and are not available
at the Northern Ireland level. Employment by sector and SIC (standard industry
classification 2-5 digit disaggregation) is available for Northern Ireland, but there is no
similar data for emissions by sector. Northern Ireland emissions data is published in line
with IPCC National Communication sectors as seen in the section above. However, it is not
possible from the emissions reports to calculate the emissions per economic sector, or
indeed per persons employed.
Eurostat provides a breakdown of UK emissions by sector, e.g. manufacturing, electricity,
agriculture, transport and storage etc. See table 3 below.
Table 3: UK GHG Emissions by sector (NACE)
% of total
Industry Section GHG
emissions
Transportation and storage 21.8
Manufacturing 19.6
Electricity, gas, steam and air conditioning supply 19.6
Agriculture, forestry and fishing 12.3
Mining and quarrying 5.9
Water supply; sewerage, waste management and remediation activities 5.9
Wholesale and retail trade; repair of motor vehicles and motorcycles 4.3
Construction 3.3
Human health and social work activities 1.6
Public administration and defence; compulsory social security 1.3
Accommodation and food service activities 0.9
Administrative and support service activities 0.9
Education 0.7
Professional, scientific and technical activities 0.6
Information and communication 0.4
Arts, entertainment and recreation 0.4
Other service activities 0.4
Real estate activities 0.2
Financial and insurance activities 0.0
Activities of households as employers; undifferentiated goods- and services-
producing activities of households for own use 0.0
Source: Eurostat (2020), UK GHG Emissions by sector (NACE)
23The lack of GHG emissions per sector data for Northern Ireland presents a difficulty when
attempting to identify those sectors and those workers which are more at risk from job
displacement or losses due to a transition to a low carbon economy. IPCC Inventory
categories can be of some assistance; for example, it is clear that agriculture is a high GHG
emissions sector. While the carbon intensity of the sector has decreased since 1990, the
overall emissions have remained static. This is due to increased output, as evidenced in the
dairy sector, where gains in reducing emissions per unit of production (31% since 1990)
were matched by growth in total milk production (increase in yield per cow) (DAERA, 2020).
However, unlike agriculture, it is much more difficult to identify sectors and subsectors
within the ‘business’ source category.12 As discussed in the previous section, the emissions
profile of the Northern Ireland differs from that of Great Britain, in particular in the weight
of the agriculture sector. The structure of agricultural sector in Northern Ireland also differs
from that of the rest of the UK; on average farms are smaller and pastoral farming, in
particular beef and dairy farms are more prevalent.
Given the emissions profile of Northern Ireland, is it possible to identify the jobs and
sectors that are at risk from losses or displacement? If they exist are these at risk jobs
concentrated in particular geographic areas and if they are, are there wider implications for
those communities? NERI research on just transition in the Republic of Ireland identified
sectors at risk through estimating emissions per person employed by sector using Eurostat
statistics on GHG emissions and employment per NACE sector (Goldrick-Kelly and Nugent,
2019). The broad NACE sectors of agriculture, forestry and fishing, transportation and
storage, electricity, gas steam and air conditioning supply, and manufacturing accounted for
three quarters of sectoral emissions. Within those broad sectors six subsectors were
identified with a share of 2% or more of total emissions: crop and animal production
hunting and related service activities; air transport; electricity, gas, steam and air
conditioning supply; manufacture of other non-metallic mineral products; land transport
and transport via pipelines and manufacture of basic metals (Goldrick-Kelly and Nugent,
2019). NESC research identifies the following sectors as being particularly vulnerable to the
12
Another difficulty with using the source rather than the end-user is that it gives a partial estimation
of the emissions used in the production of good (or service).
24transition in the Republic of Ireland: “those employed in the supply of fossil fuels and
generation of electricity from peat and coal, transport, parts of manufacturing and
agriculture. The agri-food sector is a major sector in terms of employment that will be
affected by the move to a low-carbon economy” (NESC, 2020: 9).
If the methodology applied by Goldrick-Kelly and Nugent were applied to UK emissions, the
top six subsectors (SIC 2007) would be as follows: products of agriculture; hunting and
related services; electricity production – gas; crude petroleum and natural gas; waste
collection; treatment and disposal services; materials recovery services; electricity
production – coal, and manufacture of refined petroleum products (BEIS, 2020). Given the
emissions profile of Northern Ireland and its similarity to the profile of the Republic of
Ireland, it is reasonable to assume that the top GHG emitting economic sectors are part of
the broad SIC 2007 sectors agriculture, forestry and fishing, manufacturing, electricity, gas,
steam and air conditioning supply and transport and storage.
In the absence of data per economic sector (SIC or NACE), a possible supplementary
approach would be to identify the high emissions companies who are part of the EU
Emissions Trading Scheme.13 All companies and corporate bodies, public or private, who
emit a high level of carbon annually, must register under the European Trading Scheme.14 A
list of companies registered and their installations can be found in the European
Commission’s Union Registry. This registry thus provides an indicator of which power
stations, waste and manufacturing plants emit GHG emissions on a large scale. The registry
also includes large publicly-owned installations such as hospitals and third level education
campuses.
13
A similar methodology was employed by UK Trades Union Congress and Orion Innovations (2015)
in report on the Yorkshire and Humber region, Industrial regions and climate change policies: Yorkshire
and the Humber regional report. Using the EU-ETS registry and the Local and Regional CO2 Emissions
Estimates, the paper calculated approximate emissions from large emitting industrial sites and
power generation sites to identify number of employees working in high emissions sectors/sites.
14
The withdrawal of the UK from the EU will mean that it will no longer be part of the EU-ETS. There
are plans to create a UK emissions trading scheme. https://www.pinsentmasons.com/out-
law/guides/uk-emissions-trading-scheme-2021 However, Northern Ireland, as part of the all island
single energy market, will remain in the EU-ETS,
https://www.gov.uk/government/publications/meeting-climate-change-requirements-if-theres-no-
brexit-deal/meeting-climate-change-requirements-if-theres-no-brexit-deal
254.2 Geographic evaluation of risk
Given the difficulties described in the previous section in identifying jobs at risk from the
transition by economic sector, a geographic approach might be more fruitful. This section
uses the available data at district council level to identify at risk populations by geographic
area. Data for CO2 emissions and large high emissions installations are mapped by district
council to show the geographic intensity of carbon emissions across Northern Ireland.
Figures for each district council are then discussed, along with the employment statistics
per sector to give an overview of the possible risk to each district from the transition to a
net zero economy.
Mapping high emissions installations gives a picture of the geographic spread of GHG
emissions. The installations currently taking part in the EU-ETS in Northern Ireland are
mapped below. In addition to the EU-ETS register, the Department for Business, Energy and
Industrial Strategy (BEIS) publishes regional carbon emissions data. 15 The data provides a
breakdown by end-user category (industry, agriculture, residential, transport and LULUCF)
per district council. As part of this breakdown, BEIS provides data emissions from large
industrial installations, most of whom are EU-ETS participants. The data include CO2
emissions but do not include other GHG emissions such as methane. Therefore, while it
gives a good picture of the industrial, transport and residential emissions per local
authority, the picture it provides of agricultural emissions is partial. The National
Atmospheric Emissions Inventory (NAEI) provides another useful dataset including most EU-
ETS emitting installations but not their 2019 verified emissions.
The maps below use all three data sources to provide a picture of the spread and intensity
of carbon emissions across Northern Ireland. The maps were created by using Google
Earth Pro.
15
Territorial emissions according to end-user
https://assets.publishing.service.gov.uk/government/uploads/system/uploads/attachment_data/file/8
94785/2005-18-local-authority-co2-emissions-statistical-release.pdf
26Figure 8: Northern Ireland CO2 emissions per person by District Council
* Total includes Industrial and Commercial, Agriculture, Residential, Transport and LULUCF
Source: BEIS (2020) Local Authority territorial CO2 emissions estimates 2005-2018
The two maps above show the total CO2 emissions per person per district council. The
three highest emitting councils are Mid-Ulster, Fermanagh and Omagh and Mid and East
Antrim. When only the industrial, agricultural and commercial emissions per person are
shown the two highest emitters are still Mid-Ulster and Fermanagh and Omagh.
The map below shows the high emissions installations per district council in addition to the
industrial and commercial emissions per person. This gives a good indication of the location
of the highest emitting industries. It does not include agriculture but it does include
agrifood manufacturing.
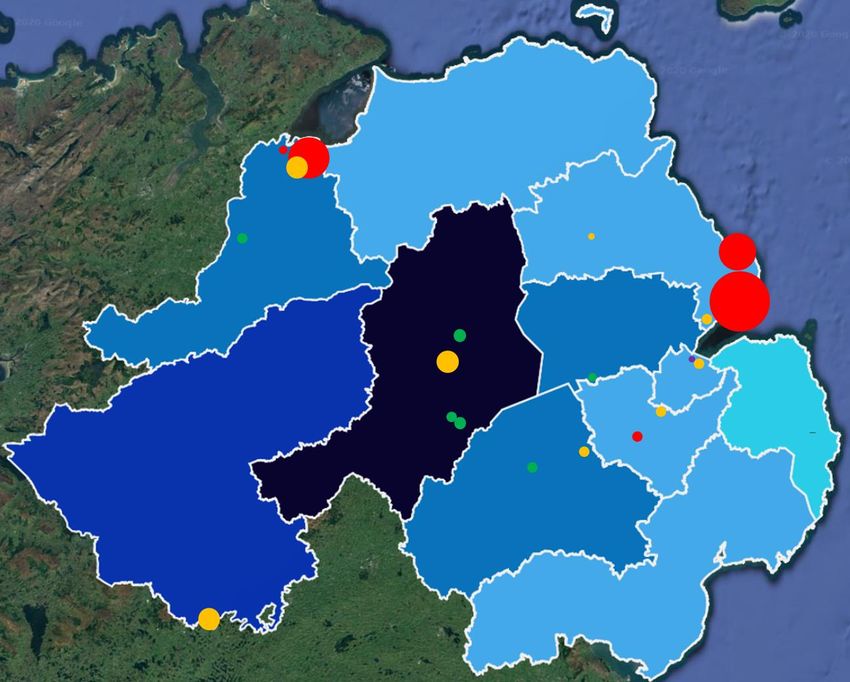
27Figure 9: Northern Ireland high emissions installations (2019) and industrial and
commercial emissions by District Council
Source: EU-ETS Registry (2019) Verified Emissions and BEIS (2020) Local Authority territorial CO2
emissions estimates 2005-2018 (ktCO2); NAEI (2020) Interactive Map
28According to the EU-ETS registry, there are five power stations taking part in the scheme
(one of which is co-located with a drinks company), one waste/waste-to-energy site, eight
manufacturing plants, including, cement, glass, textiles, aerospace and drinks. Public
institutions such as hospitals are also included in the scheme, but are not mapped here.
Finally, there are six agrifood manufacturing plants mapped. Many of these installations are
located in regional towns or rural/ semi-rural areas.
An examination of GHG emissions by source and by district council can provide some
evidence of how each area may be impacted by the transition to a net zero economy.
Table 4: NI Emissions by sector and district council
Total Per Capita Emissions
Name Total kt CO2
tCO2
Mid Ulster 1,756.8 11.9
Fermanagh and Omagh 1,233.1 10.6
Derry City and Strabane 1,026.6 6.8
Antrim and Newtownabbey 1,027.1 7.2
Armagh City, Banbridge and Craigavon 1,541.5 7.2
Newry, Mourne and Down 1,261.1 7.0
Mid and East Antrim 901.6 6.5
Causeway Coast and Glens 1,020.7 7.1
Lisburn and Castlereagh 811.0 5.6
Belfast 1,418.5 4.1
Ards and North Down 665.3 4.1
Source: BEIS (2020) Local Authority territorial CO2 emissions estimates 2005-2018 (kt CO2)
While the Armagh City, Banbridge & Craigavon16 district is home to two high emissions EU-
ETS installations – one meat manufacturer and one packaging manufacturer which serves
the agri-food business. The BEIS data (2020) show that in 2018 there were also two dairy
manufacturers who were no longer participating in the EU-ETS with emissions of 1 ktCO2
and 0.5 ktCO2 operating in the district council area. There also a hospital with emissions of
16
The Ards and North Down, Antrim and Newtownabbey, Newry, Mourne and Down, and Causeway
Coast and Glens local authorities did not have any large installations in their districts and are not
included in these tables.
29just below 1 ktCO2 in 2018. The two dairies and the hospital are included in the industrial
emissions in the table below, along with the current EU-ETS installations.
The industry and agricultural emissions per capita in the district are 2 tCO2, below the
average of 3 tCO2. Armagh City, Banbridge & Craigavon has the second highest population
after Belfast district and its population is approximately 80% rural/small town.
Unsurprisingly, given its population and large rural and small town population, it has the
highest transport emissions and the second highest domestic emissions among the district
councils, with total per capita emissions at 7.2tCO2. Manufacturing, including food, is a large
employer; at 24.3% full time employees (FTE), it is the largest of the higher emissions
industries in the district. One of the agrifood manufacturing plants alone has 2,000 full time
employees and 300 agency workers. 17
Table 5: Armagh City, Banbridge & Craigavon18
Employment 2019 Emissions 2018
Total % Total
% Total FTE PTE PTE (ktCO2)
19
Agriculture, forestry and fishing * 2,976 * A. Industry and Commercial 132.6
Electricity
Mining and quarrying 0.4 219.0 0.0 B. Industry and Commercial 94.5
Gas
Manufacturing 24.3 12,401 2.0 C. Large Industrial 11.0
Installations
Electricity, gas, steam and air * * 0.0 D. Industrial and 188.5
conditioning supply Commercial Other Fuels
Water supply, sewerage, waste 1.5 756.0 0.1 E. Agriculture 78.0
management and remediation
activities
Construction 7.0 3,574.0 0.9 Domestic Total 439.2
Wholesale and retail trade; repair 14.8 7,567.0 14.6 Transport Total 562.6
of motor vehicles and motor cycles
Transport and storage 6.8 3,463 1.4 LULUCF Net Emissions 35.3
Per Capita Emissions (t) 7.2 (t)
17
https://www.irishnews.com/business/2020/05/26/news/moy-park-writing-the-rule-book-on-safety--
1951537/
18
All district council tables are from BEIS (2020) Local Authority territorial CO2 emissions estimates
2005-2018 and the LFS Tables for Local Government Districts 2008-2019 (2020)
19
Statistics on farmers and agricultural workers are found in the Agricultural census and are not
included in the LFS
30You can also read