Consensus document on the epidemiology of severe acute respiratory syndrome (SARS) - DEPARTMENT OF COMMUNICABLE DISEASE SURVEILLANCE AND RESPONSE
←
→
Page content transcription
If your browser does not render page correctly, please read the page content below
WHO/CDS/CSR/GAR/2003.11
1

    Consensus document on the
    epidemiology of severe acute
    respiratory syndrome (SARS)

    DEPARTMENT OF COMMUNICABLE DISEASE
    SURVEILLANCE AND RESPONSE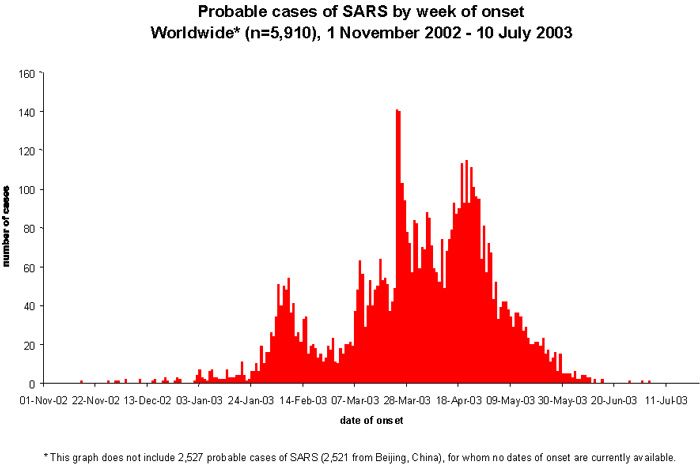
WHO/CDS/CSR/GAR/2003.11

Consensus document on the
epidemiology of severe acute
respiratory syndrome (SARS)

DEPARTMENT OF COMMUNICABLE DISEASE
SURVEILLANCE AND RESPONSE
Acknowledgement

This document has been produced by the Severe Acute Respiratory Syndrome (SARS) Epidemiology
Working Group and the participants at the Global Meeting on the Epidemiology of SARS, 16-17
May 2003.

© World Health Organization 2003

All rights reserved.

The designations employed and the presentation of the material in this publication do not imply the expression of
any opinion whatsoever on the part of the World Health Organization concerning the legal status of any country,
territory, city or area or of its authorities, or concerning the delimitation of its frontiers or boundaries. Dotted lines
on maps represent approximate border lines for which there may not yet be full agreement.

The mention of specific companies or of certain manufacturers’ products does not imply that they are endorsed or
recommended by the World Health Organization in preference to others of a similar nature that are not mentioned.
Errors and omissions excepted, the names of proprietary products are distinguished by initial capital letters.

The World Health Organization does not warrant that the information contained in this publication is complete and
correct and shall not be liable for any damages incurred as a result of its use.
Consensus Document on the Epidemiology of SARS                                                   WHO/CDS/CSR/GAR/2003.11

Table of Contents

I. Introduction ...................................................................................................................... 2
II. Recommendations from the global meeting on the epidemiology of SARS ....................... 3
1. Incubation period ............................................................................................................. 3
2. Infectious period .............................................................................................................. 3
3. Case-fatality ratios........................................................................................................... 4
4. Routes of transmission, exposure dose and risk factors for transmission ........................ 4
5. The presence and significance of subclinical infection ..................................................... 5
6. Reproduction number in different transmission settings and under different
control strategies .................................................................................................................. 5
7. Animal and environmental reservoirs .............................................................................. 6
8. Cross-cutting issues ....................................................................................................... 6
III. Key epidemiological distributions.................................................................................... 7
1. Incubation period ............................................................................................................. 7
2. Infectious period .............................................................................................................. 8
3. Case-fatality ratios......................................................................................................... 10
IV. Routes of transmission and effective prevention of transmission ................................ 12
1. Routes of transmission.................................................................................................. 12
2. Risk factors for transmission......................................................................................... 13
2.1 The global epidemiology of SARS .................................................................................. 13
2.2 Risk factors for SARS .................................................................................................... 14
2.3 Special populations requiring investigation .................................................................. 14
2.4 Airline transmission ..................................................................................................... 17
3. The SARS experience by geographical area ................................................................... 18
V. The presence and significance of subclinical infection ................................................ 25
VI. Reproduction number in different transmission settings and under different control
conditions....................................................................................................................... 26
VII. Animal and environmental reservoirs ......................................................................... 27
1. Animal reservoirs ............................................................................................................ 27
1.1 Domestic animals.......................................................................................................... 27
1.2 Wildlife .......................................................................................................................... 28
2. Food safety ..................................................................................................................... 29
3. Stability and resistance of the SARS coronavirus.............................................................. 29
VIII. Cross-cutting issues................................................................................................. 30
References........................................................................................................................... 32
Annex1-Agenda .................................................................................................................. 36
Annex2-List of participants................................................................................................. 38

                                                                    1
Consensus Document on the Epidemiology of SARS WHO/CDS/CSR/GAR/2003.11
I. Introduction
On 16-17 May 2003, the World Health Organization held the first global meeting on the
epidemiology of SARS in Geneva, Switzerland. The objectives of the meeting were to:
- Produce a WHO consensus document on our current understanding of the epidemiology
of SARS as it informs public health practice.
- Identify gaps in our knowledge for the planning of additional epidemiological studies if
required.
There are still considerable gaps in our knowledge of the global epidemiology of SARS,
which is the first severe and readily transmissible new disease to emerge in the twenty-first
century. WHO is coordinating the synthesis and interpretation of the body of work that is
being produced around the world and is promoting the sharing of data and experience in
containing and controlling this epidemic.
Participants were asked to present data and analysis relevant to answering the
epidemiological questions in the agenda (Annex 1) either from their experience of SARS
outbreaks in their countries and territories or based on the analysis of data from countries
reporting cases of SARS. The final list of participants is attached as Annex 2.
Participants were representatives of the Centres (institutions, national and regional public
health authorities and other health protection agencies) that have experienced outbreaks of
SARS and also included leading international experts in the fields of public health and
communicable disease epidemiology, mathematical modelling and clinical virology. Seven
topics for discussion (see below) were selected on the basis of their importance as
epidemiological indicators of the potential impact of the SARS epidemic and the potential for
prevention, containment, elimination or eradication. Participants presented their findings to
a broad audience on Friday 16 May and a smaller group met on Saturday 17 May to review
the data and formulate draft recommendations for wider dissemination.
Professor Angus Nicoll (Health Protection Agency, Colindale, London England), the invited
chair, opened the meeting, welcomed the participants and outlined the meeting's objectives.
Dr David Heymann (Executive Director, Communicable Diseases Cluster, WHO) also
welcomed the participants and thanked them on behalf of Dr Brundtland (Director-General,
WHO) for their participation. Dr Guénäel Rodier (Director, Communicable Disease
Surveillance and Response Department, WHO) highlighted the importance of sharing data
and experience and the need to reach a consensus on the epidemiology of SARS to enable
evidence-based public health action.
Discussions at this meeting focused on seven main topics:
§ Incubation period
§ Infectious period
§ Case-fatality ratios
§ Routes of transmission, exposure dose and risk factors for transmission
§ The presence and significance of subclinical infection
§ Reproduction number in different transmission settings and under different control
strategies
§ Animal and environmental reservoirs
The main findings and recommendations arising from the meeting are summarized by topic
followed by the studies under way. However, given the rapid evolution of our knowledge
about SARS, the document also incorporates published data and data presented at the SARS
Clinical Management Workshop, 13-14 June 2003, Hong Kong, Special Administrative
Region of China, the WHO Global Conference on Severe Acute Respiratory Syndrome, Kuala
Lumpur, Malaysia, 17-18 June 2003 and during teleconferences of the WHO Ad Hoc Working
2Consensus Document on the Epidemiology of SARS WHO/CDS/CSR/GAR/2003.11
Group on the Epidemiology of SARS. It therefore provides a synthesis of our current
understanding of the epidemiology of SARS and the priorities for public health research.
II. Recommendations from the global meeting on the
epidemiology of SARS
The participants recognized that striking progress had been made in global understanding
of the science of SARS, and the coronavirus1 that is its cause (SARS-CoV), since the first
information began to be gathered in March. The experience in affected areas has already
shown that the transmission of the SARS-CoV can be prevented by adherence to basic public
health measures, including rapid case detection, case isolation, contact tracing and good
infection control, including hand washing and the use of personal protective equipment
(PPE). However they also recognized that much more needs to be known so as to protect the
public and achieve WHO’s goal of containing and pushing back SARS out of its human host.
To help achieve this, the participants made the following recommendations that have been
updated in light of new data:
1. Incubation period
1.1. Refined estimates of the incubation period can rapidly be achieved by combining
data internationally on the approximately 200 cases with clearly defined exposure
histories. WHO to coordinate a global analysis of the incubation period by defining a
minimum data set, with a data dictionary and coding sheet.
1.2. Centres to prioritize laboratory testing of the approximately 200 SARS cases with
clearly defined exposure histories. These cases should be tested for SARS
coronavirus by one or more assays2 to identify cases with laboratory evidence of
infection, and ideally with evidence of seroconversion as the laboratory gold
standard.3
1.3. WHO to establish and achieve agreement on a protocol to investigate “outliers” in
both tails of the incubation period distribution.
1.4. WHO to review its public health recommendations informed by the incubation period
immediately after the analysis of the combined data set is completed.
1.5. WHO to facilitate the development of an applied research plan to evaluate the public
health policies for SARS containment and control that are based on a 10-day
incubation period.
2. Infectious period
2.1. Centres to relate clinical data on the onset and/or change in the symptoms and signs
of SARS (fever, cough, dyspnoea, and diarrhoea and chest X-ray changes) to viral
shedding studies both retrospectively and prospectively.
2.2. WHO to encourage Centres to analyse linked clinical and laboratory data sets in order
to better describe the infectious period and other clinical epidemiology.
2.3. WHO to facilitate modelling and data analytic studies to estimate infectiousness by
time since onset from detailed epidemiological data sets.
2.4. WHO to encourage Centres to carry out detailed case-studies on “superspreading
events”i (this terminology was considered more accurate than “super spreaders”) and
to coordinate collection and synthesis of these data. A review of "superspreading
i
A "superspreading event " is a transmission event that generates many more than the average number of
secondary cases.
3Consensus Document on the Epidemiology of SARS WHO/CDS/CSR/GAR/2003.11
events" should explore the connectedness of social networks that may facilitate
transmission and the current infection control and other public health measures that
need to be improved to prevent future “superspreading events”.
2.5. Based on current evidence and experience, WHO to re-affirm that hospital discharge
and follow-up recommendations published on 28 March 2003 are acceptable public
health practice.
2.6. WHO to revise the Management of Contacts of Probable SARS Cases (11 April 2003)4
to indicate that where SARS, is present or there is a reasonable suspicion that an
individual is infected (for example on the basis of travel history), the need for
prompt isolation of the individual and investigation of relevant contacts after onset
of any symptoms suggestive of SARS.
2.7. WHO to publish a statement on what is currently known about the infectious period
of SARS.
2.8. Centres to undertake quantitative studies of SARS-CoV shedding, wherever possible
before and after the onset of symptoms suggestive of SARS, and continuing beyond
resolution of these symptoms to determine the time period of potential
infectiousness in relation to onset and resolution of symptoms, as a basis for
appropriate isolation procedures.
3. Case-fatality ratios
3.1. Simple methods for calculating case-fatality ratios (CFRs) from aggregate data will
not give reliable estimates during the course of an epidemic. Centres to review CFRs
using statistical methods that provide valid and robust estimates such as non-
parametric and/or parametric survival analyses. These methods require case-based
data, preferably with laboratory confirmation.
3.2. The effects of factors such as age, sex, the presence of co-morbidities and the
effectiveness of clinical management on the CFR for SARS need to be determined at
the global level. WHO to facilitate the systematic collection of data on co-
morbidities, including underlying immunosuppression, cardiorespiratory disease and
other chronic diseases, clinical management and clinical outcome.
3.3. WHO to analyse data on the CFR for health care workers as a specific population at
risk of SARS.
3.4. WHO to establish criteria for cause of death in relation to SARS through collaboration
with the WHO Update Reference Committee for the International Classification of
Diseases and Vital Statistics unit. There is a need to distinguish between SARS as the
cause of death and dying of other causes with SARS as co-morbidity.
4. Routes of transmission, exposure dose and risk factors for
transmission
4.1. WHO to review Definition of a SARS Contact in Management of Contacts of Probable
SARS Cases in Web document 4 to include:
- analysis of SARS cases by probable route of transmission, including the
proportion of cases currently unexplained by established chains of
transmission
- explicit reference to exposure during the symptomatic period of a SARS case
while investigating the role, if any, of infectivity in the pre-clinical period
- that special consideration should be given to confined spaces (such as within
aircraft, taxis, other vehicles, some work environments) and hospital settings
4Consensus Document on the Epidemiology of SARS WHO/CDS/CSR/GAR/2003.11
- that there is a need for flexibility and judgement in the assessment of the risk
of SARS transmission to contacts
- that current evidence indicates casual contacts are not at risk for SARS except
when there has been sustained, close contact with a case of SARS or in high-
risk transmission settings, such as health care settings and households
- that Centres report unusual transmission events to WHO to help build the
evidence for as yet unrecognized routes of transmission and better define risky
environments and behaviours such as clinical procedures that result in
aerosols, including the use of nebulizers and difficult intubations.
4.2. Centres to undertake or continue detailed epidemiological, laboratory and
environmental investigations on unusual transmission events, including transmission
that cannot be explained by close, sustained contact (defined as having cared for,
lived with or having had direct contact (Consensus Document on the Epidemiology of SARS WHO/CDS/CSR/GAR/2003.11
6.4. WHO to support or assist in the analysis of detailed epidemiological data from
mainland China and Taiwan province to evaluate the effectiveness of public health
measures by assessing the effective reproduction number.
6.5. The WHO Western Pacific Regional Office to negotiate China's participation in data
sharing including the synthesis of global data via the global minimum data set.
7. Animal and environmental reservoirs
7.1. Centres to undertake urgent studies to determine whether animal reservoirs exist
based on epidemiological evidence of exposure risk and laboratory evidence of
infection and transmission potential.
7.2. WHO to collaborate with Centres on studies of viral inactivation to develop additional
guidance on environmental decontamination in the context of SARS, particularly for
the cleaning of hospitals and residential buildings (see also recommendation 4.5).
8. Cross-cutting issues
8.1. Those responsible for the health of the public need to ensure that clinical,
laboratory, and epidemiological resources are efficiently coordinated to best respond
and manage an outbreak and to evaluate these activities. This includes the
undertaking of well-coordinated, priority studies to generate the information needed
for public health action, and the timely access by public health decision-makers to
this information.
8.2. WHO to facilitate closer collaboration between clinical, laboratory and epidemiology
networks to address public health priorities in the diagnosis, containment and
control of SARS.
8.3. WHO to achieve consensus from Centres on their participation in developing a global
minimum data set for international analysis in order to better describe the
epidemiology of SARS, especially for uncommon events to increase sample size and
the power of any study.
8.4. WHO to leverage a data sharing agreement between Centres which addresses issues
of confidentiality, use of data and publication rights.
8.5. WHO to work with Centres to analyse the global data set and to present these
findings as a consensus statement by the partnership at the WHO Global Conference
on Severe Acute Respiratory Syndrome, Kuala Lumpur, Malaysia, 17-18 June 2003.
8.6. WHO to review published clinical data collection tools and define a minimum clinical
data set.
8.7. WHO to facilitate the development of an applied research plan to evaluate the public
health policies for SARS containment and control that are based on findings such as
the 10-day incubation period, conclusions on when people are infectious and other
key epidemiological questions.
8.8. All participating Centres to support WHO in achieving the above goals by sharing
relevant data and experiences.
6Consensus Document on the Epidemiology of SARS WHO/CDS/CSR/GAR/2003.11
III. Key epidemiological distributions
The following key distributions of SARS are discussed in this section – incubation period,
infectious period and case-fatality ratios.
1. Incubation period
The estimates for the incubation period for SARS are starting to converge as tabled below.
Estimates are derived from an analysis of SARS cases with single point exposures or
exposure over a well-defined interval (Table 1). They will later be refined by the addition of
laboratory data.
Most countries reported a median incubation period of 4-5 days, and a mean of 4-6 days.
The minimum reported incubation period of 1 day was reported from China (4 cases) and
Singapore (3 cases) and the maximum of 14 days was reported by China.
Donnelly et al analysed 1425 cases notified to 28 April in the Hong Kong Special
Administrative Region of China (Hong Kong SAR) for whom epidemiological, demographic
and clinical data were linked. The data were fitted to γ distributions by maximum likelihood
estimation methods with allowance for censoring. The maximum likelihood estimate of the
mean and variance of the time from infection to onset was 6.37 days (95% CI 5.29-7.75) and
16.69 days respectively; therefore 95% of the patients would experience the onset of
symptoms within 14.22 days of infection.5 Four Centres stated that the maximum observed
incubation period was 10 days.
There was considerable discussion about the range of the incubation period and the effect
of “outliers” at the upper end of the incubation period on existing recommendations on the
isolation of cases and their contacts. “Outliers” beyond a 10-day maximum incubation
period are few in number and have not necessarily been subjected to rigorous and
standardized investigation. However, it was noted that other mammalian coronavirus
infections have long right-hand tails for incubation periods, so a long tail is also biologically
plausible for the SARS-CoV. Statistical methods can be used to enable the inclusion of cases
with defined periods of exposure rather than point exposures alone in order to increase
sample size. There was also some concern that SARS cases arising from a single exposure
may not be representative of all SARS cases.
Centres agreed that a detailed investigation of “outliers” is needed before public health
policy is changed to extend the incubation period beyond 10 days, as any extension of the
incubation period will have considerable impact on health service practice and resources.
Participants also agreed on the need to combine data sets into a standardized international
data set (N@200 cases) to refine current estimates of incubation period. Although the focus
of the investigation should be on the right-hand tail of the distribution (maximum
incubation period) because of its public health importance, the shortest incubation periods
seen in SARS influence the mean incubation period more than the upper tail and should also
be reviewed.
It remains unclear whether the route of transmission influences the incubation period.
7Consensus Document on the Epidemiology of SARS WHO/CDS/CSR/GAR/2003.11
Table 1. Summary of SARS incubation period estimates
Area Minimum Mean Median Maximum Comments
Canada 2 4.8 4.2 10 Based on 42 cases with a single
exposure to a source case. The
median and mean were
calculated using a parametric
fit, while the minimum and
maximum are from the data.
People's 1 (4 cases) 4 4 12 Based on 70 cases from
Republic of Guangdong. 5 cases with an
China incubation period of >10 days.
14 Beijing and Guangdong.
China, Hong - 6.37 (95% CI - - Based on 57 cases with one
Kong SAR 5.29-7.75) exposure to SARS over a limited
time scale. Incubation period of
£14.22 days in 95% of cases
(parametric fit).
China, - - - 10-14 Based on household
Taiwan transmission studies.
Singapore 1 (3 cases) 5.3 5 10 Based on 46 cases with a single
exposure.
Viet Nam 5 6-7 - 10 Based on health care associated
exposure to a source case.
WHO 5 7.2 7 10 Based on two episodes (5 cases)
European with a single exposure to a
Region source case.
2. Infectious period
Transmission efficiency appears to be greatest from severely ill patients or those
experiencing rapid clinical deterioration, usually during the second week of illness. Data
from Singapore (Figure 1) show that few secondary cases occur when symptomatic cases are
isolated within 5 days of illness onset.6
Figure 1. Secondary cases of SARS by days to isolation of the source
case. Singapore, reported to 15 April, 2003
80 4
Number of cases
Number of secondary cases
Average/case
Secondary cases / case
60 3
Cases
40 2
20 1
0 0
0 1 2 3 4 5-6 7-8 9+
Days from Onset to Isolation
8Consensus Document on the Epidemiology of SARS WHO/CDS/CSR/GAR/2003.11
This inference of infectivity by time since onset derived from epidemiological observations
correlates very closely with laboratory data on cases. Maximum virus excretion from the
respiratory tract occurs on about day 10 of illness and then declines. Peiris et al3 from Hong
Kong SAR presented the results of quantitative reverse transcriptase (RT)-PCR on sequential
nasopharyngeal aspirates/throat and nose swabs (NPA/TNS) from 392 patients (adapted in
Table 2). Virus shedding in stool begins later than in respiratory secretions but also followed
an inverted "V" distribution; 100% of stool samples from 50 patients were PCR positive by
days 12-14 and then the detection rate declined.
Similarly, RT-PCR data from the Government Virus Unit, Hong Kong SAR, indicate that 36%
of NPA/TNS test positive on days 0-2, peaking at 61% positive on days 9-11 and then the
percent positive declines to 0% by day 23.7 This source also reports that 22% of stools tested
by RT-PCR are positive on days 0-2 of illness, peak at 100% on 12-14 and falls to 50% on
days 21-23. Detection of viral RNA has a much lower yield from serum with only 19% of
samples positive on days 0-2, peaking at 39% on days 6-8 of illness and being undetectable
by day 12.7 Lim also quantified viral excretion in stool; the highest number of viral copies
per millilitre occurred on days 10-15 of illness and fell quickly thereafter. Viral excretion in
NPA specimens peaked on days 12-14 of illness but at two orders of magnitude lower than
viral excretion in stools.
Data linkage is required to determine whether there is a direct relationship between clinical
severity and viral load and excretion.
Table 2. RT-PCR positivity in respiratory specimens, stool and urine*
Sample (% positive) Days from illness onset
0-2 3-5 6-14 15-17 21-23
NPA/TNS (n=392) 31 43 57-60 35 13
Stool (n=50) 0 57 86-100 33 43
Urine (n=20, **n=19) 50 35 21**
(day 10) (day 16) (day 21)
*Adapted from Peiris et al3 and the Hong Kong SAR presentation delivered by Dr Margaret Chan,
Director of Health, 16 May 2003.
There are a number of counter examples to the inference that infectivity is greatest in the
second week of illness. There is anecdotal evidence of transmission in the early prodromal
period from a small number of source cases (Canada). Two index cases reported by
European countries were infectious at days 1-2 and day 6 after the onset of symptoms.
Further elucidation of the risk of transmission from cases with mild illness, and transmission
during the prodromal period is urgently needed.
The existing WHO guidelines on the clinical management4 and medical follow-up of patients
with SARS8 were reviewed in light of the epidemiological findings on the period of infectivity.
There are no reports of transmission beyond 10 days of fever resolution consistent with the
total period of isolation following fever defervescence recommended by WHO. Based on the
evidence now available, the WHO discharge policy remains valid.
There are differences in the discharge policies of Centres at this time. Most Centres'
discharge policy is consistent with that of WHO, while the period of medical follow-up is
longer in Hong Kong SAR where patients are monitored for 19 days after defervescence and
a normal chest X-ray. The duration of medical follow-up after discharge from hospital varies
across China although defervescence and resolution of chest X-ray changes is a universal
requirement before hospital discharge.
Few serial clinical specimens have been collected and some Centres have experienced
difficulty in linking clinical, laboratory and epidemiological data to build up a complete
9Consensus Document on the Epidemiology of SARS WHO/CDS/CSR/GAR/2003.11
picture of the interaction between the SARS-CoV, its human host and transmission
environments. There is an urgent need for well-defined virus shedding studies linked to the
clinical progression of disease.
Virus shedding studies are under way in Singapore, Hong Kong SAR, Canada and China.
Singapore is specifically investigating virus excretion in a convalescent cohort of patients.
Participants agreed on the following priorities for the elucidation of the period of infectivity:
- Review of published and anecdotal data on the period of infectivity. Additional
epidemiological and laboratory studies are needed to fully describe the period of
communicability, including quantitative virology.
- Determination of the shedding pattern of SARS cases throughout the duration of
illness and convalescence. The analysis should stratify patients by clinical status
(symptomatic or convalescent) and severity of illness.
- Virus shedding and serological studies among quarantined contacts of SARS cases to
determine the onset and duration of infectivity (Hong Kong SAR). Overall in Hong
Kong, 223 of 19 386 family and social contacts under surveillance developed SARS
(1.2%) and 28 of 1158 contacts on home confinement (the subset of household
contacts from the broader contact cohort above) subsequently developed probable
SARS (2.4%).
- Compilation of a case series on “superspreading events” in order to better define the
contribution of behaviour (time from illness onset to isolation), other host
characteristics, virus characteristics and the environment in which “superspreading
events” have occurred.
- Review of existing health worker training and broader community education on SARS
and other relevant infections in all countries to ensure adherence to
recommendations for health care settings, domestic infection control and other
hygiene procedures.
- Modelling of data sets with known links between individual cases.
3. Case-fatality ratios
SARS is a condition associated with substantial morbidity and mortality. On 14 May 2003,
WHO published a synthesis of revised CFR estimates using three statistical methods.9 The
revision was based on an analysis of the latest data from Canada, China, Hong Kong SAR,
Singapore, and Viet Nam.
The case-fatality ratio of SARS is estimated to range from 0% to more than 50% depending
on the age group affected, with an overall CFR estimate of approximately 15%.ii Using a
non-parametric survival analysis estimated from interval-censored data, which provides an
unbiased estimation of case-fatality, WHO estimated a crude CFR of 14% in Singapore and
15% in Hong Kong SAR. The method used to calculate CFR in China has not been reported;
accordingly, it is unclear whether the lower age-specific CFR among older age groups in
China reflects a healthier cohort of elderly and aged persons than elsewhere or the effect of
the method of CFR calculation.
Table 3 synthesizes the estimates of CFR presented at the meeting.
Multivariate analysis of risk factors associated with SARS-related mortality from Hong Kong
include increasing age, male sex, the presence of co-morbidity and health care seeking
behaviour.
However, given that in some Centres, most SARS deaths occurred in the elderly, there is a
need to distinguish between SARS as the direct cause of death and dying with an
ii
.A global case-fatality ratio of 11% was recorded at the end of the outbreak (see also IV.2.1).
10Consensus Document on the Epidemiology of SARS WHO/CDS/CSR/GAR/2003.11
intercurrent SARS infection. WHO participants were tasked with liaising with the WHO Update
Reference Committee for the International Classification of Diseases regarding
recommendations on the death certification in SARS and reporting back to the partnership.
Gender differences in case-fatality also need further investigation as the results above are
based on small numbers.
Laboratory testing is important to determine whether the CFR in the United States of
America and Europe may be the result of strain variation in the SARS-CoV or due to a high
false-positive rate among clinically diagnosed cases.
The differences in CFR estimates support the need for a larger data set (see below – The
global minimum data set). WHO was asked to provide an updated synthesis of CFR when
data from the global minimum data set become available.
Table 3. Case-fatality ratios
Area Crude CFR Comments
Canada 16.7% in probable cases Median age of SARS deaths 75
years: 83% over 60 years.
9.3% of probable and suspect
cases combined Diabetes and co-morbidities
independently associated with
mortality.
People’s Republic of China The crude CFR in Beijing Age-specific CFR
appears lower than published 20-29 0.9%
data. HCW have a low CFR of 30-39 3.0%
1.4%. 40-49 5.0%
50-59 10%
60-69 17.6%
Method for determining age-
70-79 28%
specific CFR not defined.
80+ 26.3%
China, Hong Kong SAR Non-parametric competing risk Age-specific CFR
analysis: 15% 0-24 0% (n=0)
Males have a worse outcome 25-44 6% (n=29)
than females in all age groups. 45-64 15% (n=35)
65+ 52% (n=87)
Age-specific CFR lower among
HCWs.
China, Taiwan 13 % (34 deaths out of 264
probable cases).
Singapore Non-parametric competing risk
analysis: 14%
United States of America 0% Only 6 of 64 probable cases
have laboratory evidence of
SARS-CoV infection.
Viet Nam 9.7%
WHO European Region 0% Of 39 probable cases in 11
countries, only 8 are known to
have laboratory confirmation of
SARS-CoV infection.
The global minimum data set
Centres agreed in principle on a global minimum data set of SARS cases to answer a range
of public health questions on SARS. This data set will be based on the existing WHO line
listing and data dictionary10 which will be enhanced with additional fields. Some of the key
additional variables are listed below.
11Consensus Document on the Epidemiology of SARS WHO/CDS/CSR/GAR/2003.11
- Unique identifier of source case
- Demographic details, including occupation
- Global positioning system (GPS) code for case location
- Laboratory results, including results of convalescent phase serology (ideally collected
≥28 days after illness onset), polymerase chain reaction (PCR) results, virus isolation
and evidence of co-infection
- Risk factor data, including co-morbidities, treatment received and pregnancy
- Options for additional dates of exposure for cases who had multiple exposures
- Clinical descriptors and outcomes
- Date of isolation of the case (in a health care facility)
- Date of home isolation of contacts who subsequently become cases (i.e. prior to
illness onset in secondary cases)
A data dictionary will accompany the global minimum data set.
IV. Routes of transmission exposure dose and risk
factors for transmission
1. Routes of transmission
Available evidence suggests that SARS emerged in Guangdong Province, in southern China
in November 2002. More than one third of early cases, with dates of onset before 1 February
2003, were in food handlers (persons who handle, kill, and sell food animals, or those who
prepare and serve food).11
Throughout the outbreak, the primary mode of transmission appears to be direct mucous
membrane (eyes, nose, and mouth) contact with infectious respiratory droplets and/or
through exposure to fomites. Cases have occurred primarily in persons with close contact
with those very ill with SARS in health care and household settings. Transmission to casual
and social contacts has occasionally occurred when as a result of intense exposure to a case
of SARS (in workplaces, airplanes or taxis) or in high-risk transmission settings, such as
health care settings and households. Molecular analysis can help to describe transmission
trees.
A basic reproduction number (R0) of approximately 3 is consistent with a disease spread by
direct contact or larger virus-laden droplets that travel only a few meters rather than by
lighter airborne particles. By contrast, if a disease is transmitted by aerosols, a single person
can infect an entire room by coughing, as can happen with measles and influenza. If so,
then simple infection control techniques, such as frequent hand washing can go a long way
toward slowing the spread of the disease.
Aerosolizing procedures in hospitals, and other events12 that promote aerosolization of
infectious respiratory droplets or other potentially infectious materials (such as faeces or
urine) in hospitals or other settings, may amplify transmission. Survival of the SARS-CoV
needs further investigation in a variety of settings and under a variety of conditions (e.g. in
fomites or carpets) and the importance of cleaning surfaces without generating dangerous
aerosols was emphasized. There need to be careful studies to determine the minimum
practical methods of inactivating the virus, for example through cleaning, following the
presence of a patient with SARS or suspected SARS.
Appropriate respiratory precautions should be sustainable in a fully functioning hospital and
there is a need to establish the "new norm" in respiratory precautions. The public health
sector should focus its efforts on general surveillance of respiratory illnesses, SARS case
finding and investigation, isolation of close contacts of SARS cases, and public and
12Consensus Document on the Epidemiology of SARS WHO/CDS/CSR/GAR/2003.11
professional education. These activities are consistent with the recommendations of the
World Health Organization.,4,13
The role of faecal-oral transmission is unknown; however, there is no current evidence that
this mode of transmission plays a key role in the transmission of SARS though caution was
expressed on this point because of the lack of surveys and transmission studies among
children where this is a common mode of transmission of other viral infection. Several
animal coronaviruses are spread via the faecal-oral route.14 Peiris et al reported watery
diarrhoea in 55 (73%) of 75 cases from the Amoy Gardens outbreak.3 The onset of diarrhoea
occurred at a mean 7.5 days of illness with a maximum frequency of 6.3 stools per day.
Diarrhoea was less frequent in other series; 38% of 138 SARS cases were associated with
large volume diarrhoea at the Prince of Wales Hospital15 and 16% of 1315 cases on the Hong
Kong SAR Hospital Authority database.
In Viet Nam, approximately 50% of cases had diarrhoea during their illness (7% with
diarrhoea at admission) with the most severe cases all having diarrhoea. In Guangzhou City,
Guangdong province China 8.6% of 662 probable and suspect cases of SARS had diarrhoea
at onset; diarrhoea at any time during the course of illness was not documented. In Taiwan,
approximately 57% of cases had diarrhoea at any time. In Ontario, Canada, 28% of probable
cases and 19% of suspect cases had diarrhoea throughout the course of illness; suspect
cases developed diarrhoea earlier than probable cases. It was noted that in some cases, late
diarrhoea may be related to antibiotic treatment rather than part of the natural history of the
disease: however, given that viral excretion was greatest in stool, diarrhoea could still
remain important for infectivity, regardless of its cause.iii
Under certain circumstances, such as in health care settings or other closed environments,
contamination of inanimate materials or objects by infectious respiratory secretions or other
body fluids (saliva, tears, urine and faeces have been found to contain virus) seems to
occasionally play a role in disease transmission. Despite considerable opportunity there
have been no reports of food or waterborne transmission; however studies are needed to
further define the potential role of these routes.
2. Risk factors for transmission
2.1 The global epidemiology of SARS
The first cases of SARS are now known to have emerged in mid-November 2002 in
Guangdong Province, China. The first official report of an outbreak of atypical pneumonia in
the province, said to have affected 305 persons and caused 5 deaths, was received by WHO
on 11 February. Around 30% of cases were reported to occur in health care workers.
Confirmation that cases were consistent with the definition of SARS was made after
permission was granted, on 2 April, for a WHO team to visit the province.
A cumulative total of 8422 probable cases, with 916 deaths, were reported from 29
countries during the outbreak (data current at 7 August 2003)16; WHO announced that the
last chain of human transmission was broken on 5 July 2003. Of this total, 5327 cases and
349 deaths are reported from mainland China. A global case-fatality ratio of 11% was
recorded at the end of the outbreak (see also III.3). These figures may be revised again
following a process WHO has begun with all centres that reported cases to close off the
historical data set of the outbreak. The epidemic curve of the outbreak by date of onset is
presented in Fig 2. Total cases and attack rates per 100 000 inhabitants based on probable
SARS cases reported to WHO by 7 August 2003, are presented in Figures 3 and 4
respectively.
iii
Minutes of the 7 May World Health Organization Ad Hoc Working Group on the Epidemiology of
SARS.
13Consensus Document on the Epidemiology of SARS WHO/CDS/CSR/GAR/2003.11
2.2 Risk factors for SARS
Risk factors for SARS were described in a number of studies. Health care workers, especially
those involved in procedures generating aerosols, account for 21% of all cases, ranging from
3% of reported probable cases in the United States of America (1/33 cases) to 43% in Canada
(108/251 cases).16 Other risk factors include household contact with a probable case of
SARS, increasing age, male sex and the presence of co-morbidities.IV The care and slaughter
of wildlife for human consumption in the wet markets of southern China is associated with
serological evidence of infection (see VII.1.2).17
The transmission of SARS in the Metropole Hotel18 and the Amoy Gardens12 has been
attributed in part to environmental contamination, with a possible animal vector19
contributing to the spread of the virus in the Amoy Gardens outbreak.
There has also been limited transmission associated with air travel (see IV.2.4).
The evidence presented at the Global Meeting on the Epidemiology of SARS and published
data have confirmed the efficacy of traditional public health measures, which include early
case identification and isolation, vigorous contact tracing, voluntary home quarantine of
close contacts for the duration of the incubation period, and public information and
education to encourage prompt reporting of symptoms.20
2.3 Special populations requiring investigation
SARS in children
To date, there have been two reported cases of transmission from children to adults and no
reports of transmission from children to other children. The epidemiological investigation of
8 of 10 children with SARS in Hong Kong SAR who had been attending school at the time of
presentation found no evidence that they had spread the infection to their classmates.21
Epidemiological investigations in Guangzhou City, Guangdong, China, also found no
evidence of SARS transmission in schools.22 These findings are in contrast to the secondary
attack rates among adults.23
Serological studies using non-invasive diagnostics among children for evidence of
transmission in settings where virus has been circulating are recommended.
SARS in pregnancy
Additionally, there have been no reported cases of vertical transmission. Data from the
Princess Margaret Hospital, Hong Kong SAR, from March-May 2003 show that of 10 women
previously well, aged 27-44 years who developed SARS during pregnancy, 6 required
admission to the hospital's intensive care unit, 4 were ventilated and 3 died. There was one
maternal death among the 5 first trimester pregnancies and 4 spontaneous abortions; no
virus was found in cord blood or liquor. Two maternal deaths occurred among the 5 late
pregnancies; all 5 infants survived and no perinatal transmission was detected.24
A global collaborative study on SARS in pregnancy is needed to increase the sample size of
case series. Anker has estimated that there are 100 pregnant women among the more than
8000 probable SARS cases reported worldwide.v It is unlikely that any one country would
have a large enough sample of pregnant women among their probable SARS cases to
definitively answer questions about the course and outcome of SARS in pregnant and
IV
Dr Margaret Chan. Hong Kong SAR presentation, Global meeting on the Epidemiology of SARS. World
Health Organization, Geneva, Switzerland, 16-17 May 2003.
v
Anker M. Calculations based on the age-sex distribution of SARS cases and national age-specific
14Consensus Document on the Epidemiology of SARS WHO/CDS/CSR/GAR/2003.11
lactating women, including whether pregnancy outcomes are affected by the gestational age
at infection.
Figure 2.
WHO issues first travel advisory 15 March
WHO issues global alert
12 March
Adapted from World Health Organization. Epidemic curves – Severe Acute Respiratory Disease (SARS)
http://www.who.int/csr/sars/epicurve/epiindex/en/index1.html
15Consensus Document on the Epidemiology of SARS WHO/CDS/CSR/GAR/2003.11
Figure 3. Probable SARS cases in selected sites16
3000
2500
2000
Cases
1500
1000
500
0
i)
re
R
)
)
e
i)
to
ng
o
nc
pe
SA
o
an
on
ap
ji
i
ei
ov
ei
(H
g
or
(T
ng
(B
on
Pr
(T
am
an
Si
K
na
ng
a
w
N
g
ad
hi
do
on
ai
et
C
an
,T
ng
Vi
,H
C
na
ua
na
hi
,G
hi
C
C
na
hi
C
Selected sites
Figure 4. Probable SARS cases in selected sites. Attack rates per 100 000
inhabitants16
30
25.6
25 23.1
19.6
20
Rate
15
10
5.1 5.9
5 2.3
2.2
0
)
R
e
)
)
ce
to
i)
ng
oi
or
SA
pe
on
in
an
ap
ji
ei
ei
ov
g
or
(H
ng
(T
(B
on
Pr
(T
am
Si
an
K
na
a
g
N
ad
g
on
w
hi
on
ai
et
C
an
gd
,T
H
Vi
C
n
,
na
ua
na
hi
,G
hi
C
C
na
hi
C
Site
16Consensus Document on the Epidemiology of SARS WHO/CDS/CSR/GAR/2003.11
2.4 Airline transmission
WHO issued the first emergency travel advisory on 15 March25 to airlines and travellers,
providing case definitions for probable and suspect cases of SARS and advising airline crew
of the need to report all such cases to airport and public health authorities. Additional
guidance was issued on 27 March26 that recommended measures to reduce the risk of the
global spread of SARS, including the exit screening of air passengers departing from areas
reporting local transmission. The following analysis only includes travellers fulfilling the
WHO case definition of probable SARS issued on 27 March 2003.
The following data are current to 14 July 2003.vi WHO has received verified reports of 40
flights on which one or more probable SARS cases travelled while symptomatic (a total of 37
potential source cases, see Table 4). In addition, there are 40 flights involving 21 probable
cases on which WHO is awaiting further details. These data are not yet complete; WHO
continues to receive new data, and review and reclassification of cases are ongoing.
Five international flights have been associated with the transmission of SARS from
symptomatic probable cases to passengers and/or crew; one of these flights (Flight C)
constitutes a "superspreading event". Details of the flights are still under investigation.
The French public health authorities investigated a small cluster of cases associated with
two international flights (Flights A/B: a two-leg journey on 22–23 March 2003). The source
case, a physician, was estimated to be on day 3–4 of his illness when flying. Three persons
who travelled on the flight later developed SARS - a flight attendant and two passengers,
one sitting 1 row ahead of the source case and another 5 rows behind the source case. Exit
screening was already in place at the port of departure but the explanation given by the
physician for his symptoms did not preclude him from travelling.
The source case for Flight C was a 72-year-old man who had visited the Prince of Wales
Hospital in Hong Kong SAR before flying on 15 March. This case was associated with a
cluster of 24 probable cases of SARS representing 22 passengers and 2 flight attendants. Of
these 22 infected passengers, 14 subsequently travelled on later flights (a total of 5 flights)
while symptomatic. Of these subsequent flights, only one was associated with possible in-
flight transmission (Flight E, see below). Seating information for the passengers on Flight C
is incomplete; our current understanding is that passengers up to 7 rows in front and 5
rows behind the source case on both sides of the central aisle were infected. The number of
secondary cases from transmission on this flight is still under investigation as at least one
group of passengers travelling together may have been exposed while in an area with recent
local transmission. The route(s) of transmission on flight C also remains undetermined -
droplet, contact, faecal–oral and limited airborne transmission, or a combination of
modalities, are all plausible.
Table 4. Flights with symptomatic probable cases, 23 February–23 May
2003
Travel period (2003) Number of flights Number of symptomatic
probable cases on board
23 February–14 March 9 6
15 March–26 March 10 18
27 March–23 May 21 13
23 February–23 May 40 37
vi
Data extracted from the WHO Airline Transmission of SARS database
17Consensus Document on the Epidemiology of SARS WHO/CDS/CSR/GAR/2003.11
The source case on Flight D was a 33-year-old male physician who was on day 6–7 of illness
when flying on 14–15 March. One secondary case (a flight attendant) was associated with
possible transmission on the flight. Two family members travelling with the source case
were also infected (one probable and one suspect case); they have not been included as air
travel-associated secondary cases as the opportunities for domestic transmission exceed
the likelihood of transmission exclusively on this flight.
Two passengers from flight C (15 March) were symptomatic when they travelled on flight E
on 23 March. A passenger who sat next to one of the source cases (who was on day 6 of his
illness) later developed SARS.
The International Air Transport Association (IATA) provided denominator data on
commercial international flights and passengers, including transit passengers, for March
2003 to and from Beijing, Hong Kong SAR, Singapore, Taipei and Toronto. From the verified
flights of March there are 6.5 passengers per million who travelled from these locations
while symptomatic cases of probable SARS. However, we do not know how many of these
persons were actually real cases of SARS-CoV infection.
There are a number of important findings from the preliminary data:
- A total of 29 secondary cases have been linked to probable cases of SARS who
travelled while symptomatic. Only one flight (Flight C) resulted in a "super spreading
event", on which limited airborne transmission cannot be excluded on current
evidence. However, other modes of transmission also need to be considered. A
detailed analysis of Flights A–E, which are associated with secondary cases, is under
way.
- To date, no transmission has been confirmed on flights after the 27 March travel
advisory in spite of at least 21 flights with probable SARS cases on board since that
date. Given the highly effective internal public health measures implemented in
jurisdictions with outbreaks (case identification, isolation and contact tracing),
probable SARS cases detected after 27 March may be less likely to be “real” cases of
SARS-CoV infection than earlier cases. Serological studies are needed to evaluate the
predictive value of the surveillance case definition over time in this cohort.
- A crude estimate from the verified flights of March is that 6.5 passengers per million
travelled as symptomatic probable SARS cases in March 2003 having departed from
locations specified above with local transmission of SARS. On the current data, we
are unable to calculate the reduction in risk associated with the travel advisory and
other pre-departure surveillance implemented in affected areas. In addition, some of
these “cases” may not have been real cases of SARS-CoV infection. IATA documented
a 10.6% reduction in the number of passengers travelling to and from the cities
listed above compared to March 2002.
Centres in collaboration with WHO are encouraged to carry out careful evaluations of all
measures aimed at reducing the international spread of SARS. Convalescent phase serology
should be collected on these cases to exclude persons who did not have SARS-CoV infection
to refine the estimate of risk.
3. The SARS experience by geographical area
Canada
Canada experienced a SARS epidemic with two clusters that were epidemiologically linked to
two hospital outbreaks. Transmission of SARS in the Greater Toronto Area (GTA) began with
an index case who had spent time in the Metropole Hotel, Hong Kong, in February 2003.27 A
family contact after becoming ill with symptoms compatible with SARS was treated at a
hospital in the GTA and subsequently transmitted the illness to staff and patients in the
hospital. Nearly 100 hospital workers at three GTA hospitals subsequently became ill. Initial
descriptive epidemiology suggests that transmission occurred in contacts of patients and
18Consensus Document on the Epidemiology of SARS WHO/CDS/CSR/GAR/2003.11
visitors who were not identified as having SARS and were not in isolation precautions and
contacts of ill family members. At the beginning of the outbreak, transmission occurred in
health care workers prior to the implementation of hospital-wide infection control
precautions.28
The first case linked to the second phase of the Ontario outbreak was a 96-year-old man
admitted to an orthopaedic ward in the index hospital on 22 March 2003 with a fractured
pelvis.29 During the course of his SARS-related illness with onset date 2 April, he developed
respiratory symptoms, fever, diarrhoea and radiological evidence of atypical pneumonia.
Aspiration pneumonia and Clostridium difficile-associated diarrhoea were thought to
explain his illness. On 20 May, 5 patients in a rehabilitation hospital in Toronto were
reported with febrile illness; one patient had been referred from the orthopaedic ward of the
index hospital and had been an inpatient at the same time as the first case. A second case
was found to have SARS-CoV by nucleic acid amplification. After their identification, an
epidemiological investigation of pneumonia cases at the index hospital identified 8 cases of
previously unrecognized SARS among patients, and concluded that exposure to inpatients
with unrecognized SARS after relaxation of strict SARS control measures probably resulted in
transmission to health care workers, patients and visitors. Of the 74 cases reported to the
Ontario public health service from 15 April-9 June, 67 (90%) resulted directly from exposure
in the index hospital.
Transmission has been largely confined to health care settings, primarily acute care
hospitals, in which there have been unrecognized SARS patients, and appropriate infection
control measures have not yet been implemented. Attack rates among nursing staff in one
Toronto hospital prior to the recognition of SARS, were: emergency room 22% (8/36),
intensive care unit 10% (4/39) and cardiac care unit 60% (6/10).28,29
Canadian health authorities documented at least 2 transmission events involving health care
workers wearing full PPE (N95 masks or higher, eye protection, gowns and gloves) infected
during a difficult intubation. High-risk procedures (intubation, suction, nebulized aerosol
therapy and positive pressure non-invasive ventilation) have resulted in transmission to
health care workers.30 In two events, undiagnosed SARS cases were identified as the source
of transmission for 7 hospital staff. Although infection control precautions were in place,
compliance may not have been complete. In the third, staff were reportedly compliant with
infection control precautions except for one break in technique where a face shield was
accidentally dislodged.31
Transmission of SARS to 10-11 hospital staff was also reported in lower risk settings.
Affected staff included physicians, nurses, and service assistants (e.g. porter/housekeeper)
working in 4 different low-risk SARS units and one community hospital. Investigation of
these cases suggested that transmission occurred while staff were wearing recommended
PPE and following all recommended infection control precautions.31
Transmission has usually involved severely ill source cases. Anecdotally some cases have
had very little exposure involving either transmission occurring after short but intense
exposure to very ill persons or transmission after exposure to suspect cases or persons with
mild symptoms in their prodromal period.
Examples include:
- a paramedic, who may not have been under optimal infection control precautions,
infected while spending a very short time with a severely ill patient
- an infected nurse aid whose only exposure was a very brief visit to a case
household32
- health care workers in SARS units but without exposure to high-risk procedures
infected while wearing full PPE (see above).
In most situations, implementation of aggressive airborne, contact, and droplet precautions
provides effective protection for caregivers. Community acquired infection has been
reported from close community contact, religious events (5 cases, plus an exported case)33
19You can also read