Automated Demand Response Technologies and Demonstration in New York City using OpenADR - Joyce Jihyun Kim, Rongxin Yin, Sila Kiliccote Lawrence ...
←
→
Page content transcription
If your browser does not render page correctly, please read the page content below

LBNL-6470E

Automated Demand Response
Technologies and Demonstration in
New York City using OpenADR

Joyce Jihyun Kim, Rongxin Yin, Sila Kiliccote
Lawrence Berkeley National Laboratory

September 2013

Automated Demand Response Technologies and Demonstration
            in New York City using OpenADR

                          Prepared for

                      THE NEW YORK STATE
           ENERGY RESEARCH AND DEVELOPMENT AUTHORITY
                           Albany, NY

                         Anthony Abate
                         Project Manager

                           Prepared by

             LAWRENCE BERKELEY NATIONAL LABORATORY
                          Berkeley, CA

                        Joyce Jihyun Kim
                          Sila Kiliccote
                          Rongxin Yin

                  NYSERDA Agreement No. 20723

                         September 2013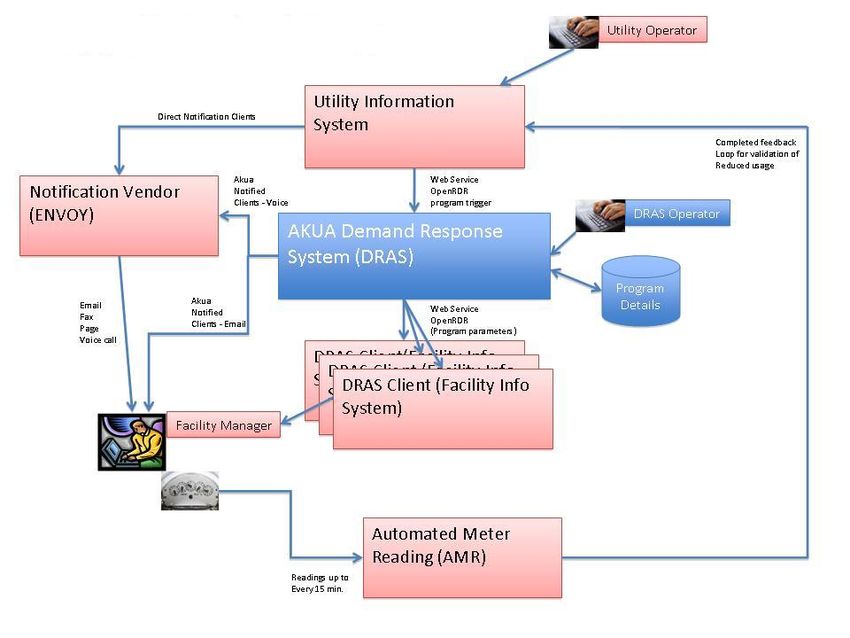
Notice
This report was prepared by the Lawrence Berkeley National Laboratory in the course of performing work
contracted for and sponsored by the New York State Energy Research and Development Authority
(hereafter NYSERDA). The opinions expressed in this report do not necessarily reflect those of NYSERDA
or the State of New York, and reference to any specific product, service, process, or method does not
constitute an implied or expressed recommendation or endorsement of it. Further, NYSERDA, the State of
New York, and the contractor make no warranties or representations, expressed or implied, as to the fitness
for particular purpose or merchantability of any product, apparatus, or service, or the usefulness,
completeness, or accuracy of any processes, methods, or other information contained, described, disclosed,
or referred to in this report. NYSERDA, the State of New York, and the contractor make no representation
that the use of any product, apparatus, process, method, or other information will not infringe privately
owned rights and will assume no liability for any loss, injury, or damage resulting from, or occurring in
connection with, the use of information contained, described, disclosed, or referred to in this report.

                                              Disclaimer

This document was prepared as an account of work sponsored by the United States Government. While this
document is believed to contain correct information, neither the United States Government nor any agency
thereof, nor The Regents of the University of California, nor any of their employees, makes any warranty,
express or implied, or assumes any legal responsibility for the accuracy, completeness, or usefulness of any
information, apparatus, product, or process disclosed, or represents that its use would not infringe privately
owned rights. Reference herein to any specific commercial product, process, or service by its trade name,
trademark, manufacturer, or otherwise, does not necessarily constitute or imply its endorsement,
recommendation, or favoring by the United States Government or any agency thereof, or The Regents of
the University of California. The views and opinions of authors expressed herein do not necessarily state or
reflect those of the United States Government or any agency thereof or The Regents of the University of
California.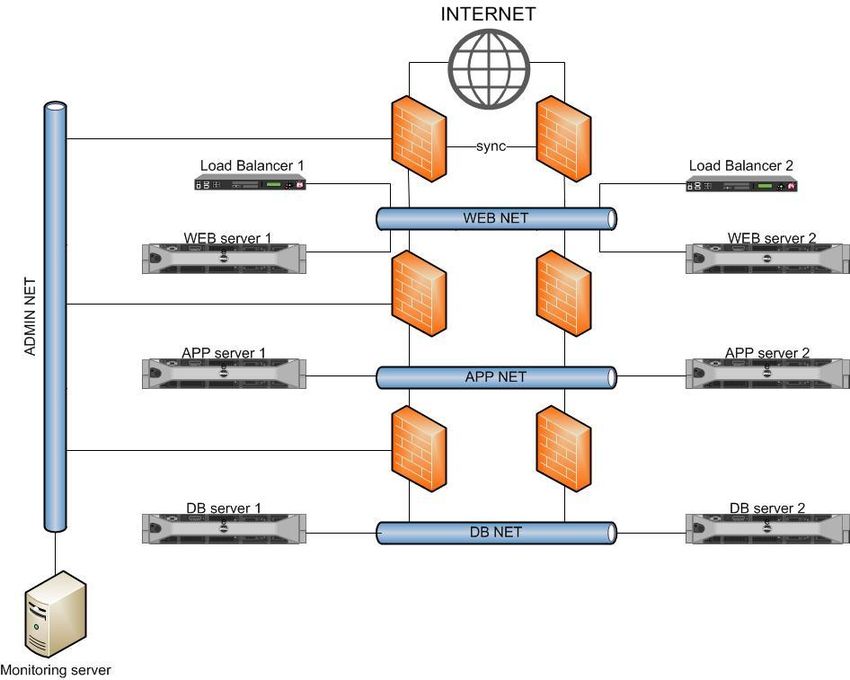
Acknowledgements
The work described in this report was coordinated by the Lawrence Berkeley National Laboratory and
funded by the New York State Energy Research and Development Authority under the Agreement No.
20723. This work was sponsored in part by the Demand Response Research Center which is funded by the
California Energy Commission (Energy Commission), Public Interest Energy Research (PIER) Program,
under Work for Others Contract No. 500-03-026 and by the U.S. Department of Energy under Contract No.
DE-AC02-05CH11231.

                                                 iii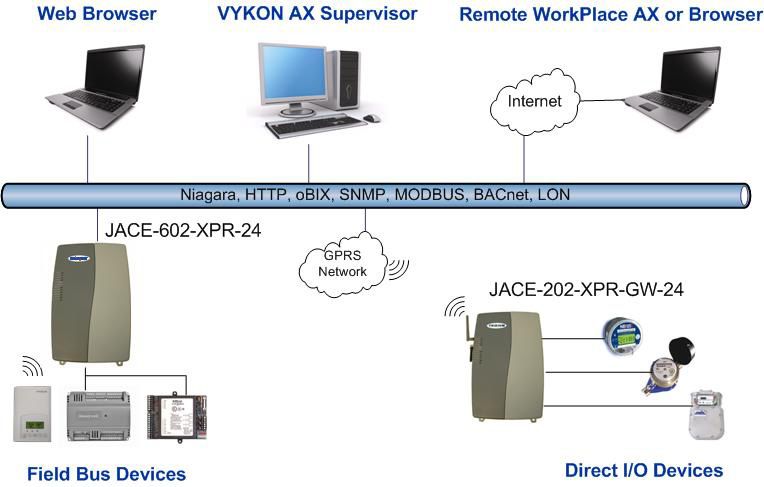
Abstract
Demand response (DR) – allowing customers to respond to reliability requests and market prices by
changing electricity use from their normal consumption pattern – continues to be seen as an attractive
means of demand-side management and a fundamental smart-grid improvement that links supply and
demand. Since October 2011, the Demand Response Research Center at Lawrence Berkeley National
Laboratory and New York State Energy Research and Development Authority have conducted a
demonstration project enabling Automated Demand Response (Auto-DR) in large commercial buildings
located in New York City using Open Automated Demand Response (OpenADR) communication
protocols. In particular, this project focuses on demonstrating how OpenADR can automate and simplify
interactions between buildings and various stakeholders in New York State including the independent
system operator, utilities, retail energy providers, and curtailment service providers. In this paper, we
present methods to automate control strategies via building management systems to provide event-driven
demand response, price response and demand management based on OpenADR signals. We also present
cost control opportunities under day-ahead hourly pricing for large customers and Auto-DR control
strategies developed for demonstration buildings. Lastly, we discuss the communication architecture and
Auto-DR system designed for the demonstration project to automate price response and DR participation.

Keywords: commercial building, demand response, dynamic pricing, mandatory hourly pricing, OpenADR,
Open Automated Demand Response, price response, smart grid

                                                   iv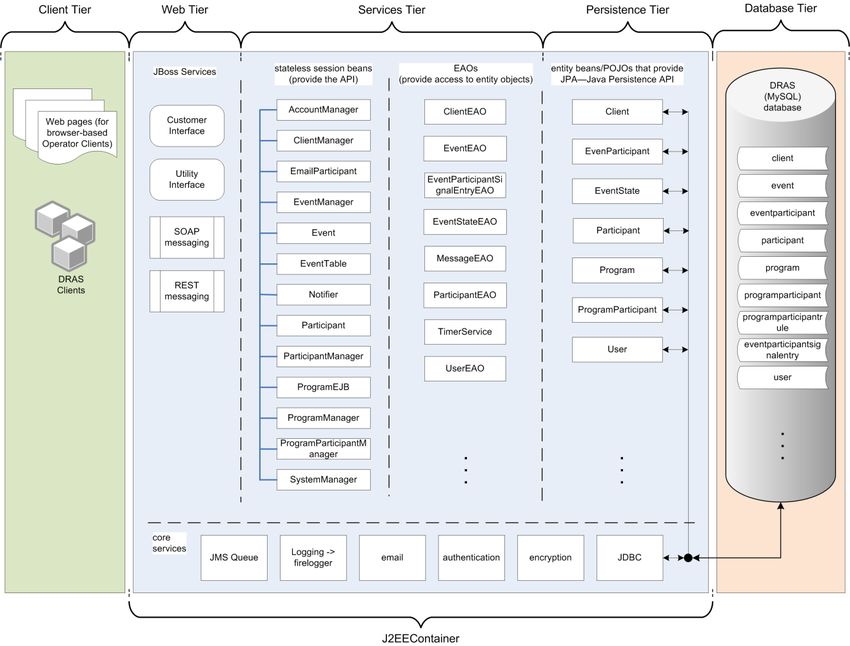
Table of Contents
Summary ........................................................................................................................................................ 1

1       Introduction ........................................................................................................................................... 4

2       Background ............................................................................................................................................ 5

    2.1         Demand Response Forms Currently Present in New York State .................................................. 5

    2.2         Barriers to Hourly Price Response in NYS ................................................................................... 6

    2.3         Cost Control Opportunities ........................................................................................................... 6

3       OpenADR in New York State ..............................................................................................................10

    3.1         OpenADR Specifications and Key Concepts ...............................................................................10

    3.2         OpenADR Sample Use Cases ......................................................................................................11

4       Methods ................................................................................................................................................14

    4.1         OpenADR Communication Architecture and Security ................................................................14

    4.2         Auto-DR System Design and Configuration ................................................................................15

    4.3         Site Auto-DR Curtailment Modes and OpenADR Signals ..........................................................17

5       Site Implementation ..............................................................................................................................19

    5.1         Site Description ............................................................................................................................19

    5.2         Auto-DR Control Strategies .........................................................................................................21

6       Conclusions ..........................................................................................................................................23

7       Future Research ....................................................................................................................................24

References .....................................................................................................................................................23

Appendix A: DRAS Cyber Security Plan ......................................................................................................24

Appendix B: Equipment Cut Sheets ..............................................................................................................25

Appendix C: Demonstration Site Summary ..................................................................................................26

                                                                                v
List of Figures
Figure 1. Price duration curves: New York City LBMP from Sept 2011 to Aug 2012 .................................. 7

Figure 2. Distribution of New York City LBMP over month and time-of-day during the top 1% of the time
between Sept 2011 and Aug 2012 .................................................................................................................. 7

Figure 3. NYPA: actual electricity bill breakdown for a sample office building in 2011 .............................. 8

Figure 4. Con Edison: predicted electricity bill breakdown for a sample office building in 2011 ................. 9

Figure 5. OpenADR 2.0 Event PUSH Pattern (Source: OpenADR 2.0b) .....................................................11

Figure 6. OpenADR 2.0 Event PULL Pattern (Source: OpenADR 2.0b)......................................................11

Figure 7. OpenADR communication architecture for event-based DR programs in New York City............12

Figure 8. OpenADR communication architecture for dynamic pricing in New York City ...........................13

Figure 9. OpenADR communication architecture for the New York demonstration site ..............................14

Figure 10. Auto-DR System Configuration for Buildings with Open Protocol .............................................16

Figure 11. Auto-DR System Configuration for Buildings with Proprietary Protocol ...................................17

Figure 12. Automated demand response signal prioritization .......................................................................18

Figure 13. Demonstration Site Location (Source: Google Map) ...................................................................19

List of Tables
Table 1. Demand response curtailment programs in New York City ............................................................. 5

Table 2. Con Edison SC-9 - General Large, Rate II - Time-of-Day Delivery Charges .................................. 8

Table 3. Demonstration Site Summaries .......................................................................................................21

Table 4. Auto-DR Strategies for Demonstration Sites...................................................................................22

                                                                        vi
Summary
Since October 2011, the Demand Response Research Center (DRRC) at Lawrence Berkeley National
Laboratory (LBNL) and New York State Energy Research and Development Authority (NYSERDA) have
conducted a demonstration project enabling automated demand response (Auto-DR) in large commercial
buildings located in New York City (NYC) using Open Automated Demand Response (OpenADR). This
interim report details the overall project concept, objective and progress. Currently, Auto-DR functionality
has been commissioned at some demonstration sites and project’s time line has all sites being
commissioned, tested and operational over the summer and fall of 2013.
OpenADR is an open and interoperable communication standard that facilitates smart-grid information
exchange among various entities such as utilities, system operators, aggregators, energy services providers,
and end-users. These interactions are defined as client-server transactions via Internet using XML
(eXtensible Markup Language) data models. OpenADR is different than other demand response
application protocols, like Smart Energy Profile (SEP) intended for home-based device interactions over
advanced metering infrastructure (AMI) based transport. OpenADR messages are used to communicate
demand response (DR) requests, energy pricing and schedules from servers (e.g., utilities, system operators,
energy suppliers, etc.) to subscribing clients at customer sites. As an open specification, OpenADR can
simplify the implementation of multiple signaling systems and ease the adoption of building automation.
As a machine-to-machine standard, OpenADR can interact with buildings and industrial control systems
that are preprogrammed to take action based on DR or price signals in a fully automated fashion with no
manual intervention. As a result, the demand-side resources can be used more frequently in smart grid
transactions contributing to grid reliability and robustness.
New York State’s (NYS’s) market structure provides several mechanisms intended to encourage larger
customers to reduce their impact on the grid. These include hourly prices for energy constraints; retail
demand tariffs and utility DR programs for distribution system constraints; wholesale DR for capacity
constraints; and even dispatchable DR for providing Ancillary Service to the New York Independent
System Operator (NYISO). OpenADR supports all of the common NYISO, utility, retail energy provider
(REP) and curtailment service provider (CPS) interactions with commercial customers in NYS.
Individually, these interactions are not complicated. However, as the number of interactions increases, the
customer’s burden to respond to multiple interactions also increases. OpenADR can simplify this process
by standardizing how each will present its signals in a standards-based machine readable format and
making it easier for more buildings to respond in ways for the benefit of a smarter gird in NYS.
The project focuses on following:
1) demonstrate how OpenADR can automate and simplify interactions between buildings and various
stakeholders in NYS including the NYISO, utilities, REPs, and CSPs;
2) automate building control systems to provide event-driven demand response, price response, and
demand management according to OpenADR signals; and
3) provide cost-saving solutions to large customers by actively managing day-ahead hourly prices
and demand charges.
Event-Driven Demand Response
Using OpenADR, the NYISO or utilities could publish DR event notifications including the program type,
date, time, and duration as well as target type (by load zone, geographic location, or program associations).
Based on the DR event information published by the NYISO or utilities, a CSP can use OpenADR to
communicate a DR event to all or selected groups of program participants. A participating building can
subscribe to their CSP’s OpenADR signal to receive DR event information. Upon the receipt of OpenADR
signals, sites can respond automatically, manually, or a combination of both. If the response is automated,
OpenADR signals would trigger pre-programmed control strategies via the facility’s building management
system (BMS). A BMS system could also guide facility operators to manually change operations and
control set points.
1Price Response
The NYISO could publish wholesale (i.e. Day-ahead Locational Based Marginal Price) prices in OpenADR
protocol. Utilities and REPs can receive price signals from the NYISO and determine their rates (minus
adjustments) to reflect the wholesale market variations. End-users who respond to dynamic pricing can
pull the OpenADR price information from a utility, a REP or the ISO via their OpenADR client and
manage energy consumption accordingly. The buildings could dynamically control and optimize loads to
minimize costs according to the day-ahead price variations. If the buildings do not have the ability to
process the dynamic price information and make decisions about how to respond to that information, the
OpenADR server can generate simple operation mode (Normal, Moderate, High, or Special) for the
buildings based on the price information. The buildings can then trigger pre-programmed control strategies
based on the simple operation mode.
Demand Management
In NYS, customers pay delivery charges that are largely based on the maximum demand of each billing
cycle to reflect the cost of the distribution infrastructure. Typically, the delivery charges for large
customers are more expensive in summer than winter and additional charges apply during peak hours.
Therefore, it is important that the customers manage their maximum demand in order to reduce electricity
bills. The OpenADR server can assist the building’s peak load management by monitoring electric demand
in real time and automate peak load reduction if the demand is nearing a preset threshold.
Auto-DR Demonstration in NYC
Four buildings were recruited for the demonstration project. Preferences were given to the buildings that
represented the typical construction of large commercial buildings in NYC. All demonstration buildings
previously participated in one or more incentive-based DR programs through CSPs. Prior to this project,
the load reduction at these buildings was provided through manual control of HVAC, lighting, and other
systems.
OpenADR Communication Architecture
Currently in NYS, wholesale day-ahead hourly prices are published in a downloadable spreadsheet format
at the NYISO website and are made available from some utility websites. Today, DR event notifications
are propagated via email and phone by the NYISO and CSPs. Since the NYISO, Consolidated Edison (Con
Edison), and CSPs did not publish price or DR signals using the OpenADR protocol, the project team used
a centralized server to mimic the transfer of these signals from these entities to the facilities using
OpenADR data models. Con Edison’s customers who are subject to the default Mandatory Hourly Pricing
(MHP) tariff are billed under Rider M for their electricity supply. Under this rider, the cost of energy is
roughly calculated based on the customer's actual hourly energy usage multiplied by the NYISO's day-
ahead zonal locational based marginal price (DA LBMP). This does not account for miscellaneous charges
like taxes and adjustments which do not vary hourly. To generate a standards-based machine readable
pricing signals, the project’s OpenADR server scrapes DA LBMP published on the NYISO's website and
converts the data into OpenADR data models for each day.
For this project, DR event notifications undergo a similar conversion to machine-readable OpenADR
protocol. If a CSP sends DR test/event notifications to the customer via email, the OpenADR server would
receive the same email and convert the message into OpenADR signals. The customer’s building
automation is equipped with OpenADR client software that reads both the OpenADR signals for daily
prices, day-ahead DR event notifications, and day-of DR notifications. The facility’s BMS activates
respective pre-programmed control strategies. The OpenADR server also collects electric meter data for
monitoring purposes. All information exchange is accomplished through a secure Internet connection with
128-bit Secure Sockets Layer encryption.
Building Auto-DR System Design and Configuration
2A site’s Auto-DR system design and configuration depends heavily on the capabilities of existing building
control systems and protocols. It is common for large commercial buildings to have several systems and
devices (i.e., HVAC, lighting, electric, security, etc.) used for building operation. A centralized BMS
integrates individual control systems/devices to provide greater controllability and efficiency to building
managers. Installing a centralized BMS can be a seamless process if all systems/devices use an open
building automation communication protocol (i.e. BacNet, Modbus, Lonworks, etc.), which facilitates
interoperability between different vendors’ systems. Open building automation communication protocols
are a vendor-neutral standard used within a facility supporting all building systems and devices equally.
(OpenADR, on the other hand, is a smart grid data protocol developed to facilitate interoperable exchange
of information relating to electricity market information, transactions, etc.) The use of an open building
automation communication protocol is advantageous for Auto-DR when multiple systems/devices need to
respond to the same OpenADR signals. Three of the four demonstration sites’ BMS use BACnet as the
building automation communication protocol and one building uses a proprietary protocol.
Auto-DR Equipment Installation and Programming
Each demonstration building had a vendor-specific BMS, namely Honeywell’s Enterprise Buildings
Integrator, Automated Logic Corporation’s WebCTRL® , Schneider Electric's Andover Continuum, and
Johnson Control Inc.’s Legacy respectively. Honeywell provided the overall system design and equipment
installations for the project. Programming of the Auto-DR control strategies was done by subcontractors
who can program in each vendor’s software. Most of the control strategies were HVAC-related, such as
set-point changes and fan speed reduction. We proposed lighting strategies for two buildings in addition to
the HVAC strategies. However, the lighting system was not integrated into the BMS prior to the project
and additions would increase costs and further delay the project.
Conclusions and Next Steps
In this report, we provided progress updates on project by presenting customer bill control opportunities,
Auto-DR implementation methods, and DR control strategies for the project’s demonstration buildings.
The demonstration buildings were automated to provide event-driven demand response, price response, and
demand management according to OpenADR signals. Control strategies were designed to curtail
customer’s load as per day-ahead hourly prices and demand charges as well as DR events. HVAC control
strategies were often the first to be automated because they were effective at lowering demand and they
could be easily controlled through the facility’s BMS. The strategies involving starting chillers during non-
operational hours (i.e., precooling) could not be automated because they require a site engineer to be
present by the NYC Fire Code. The implementation of Auto-DR system in demonstration buildings
heavily depended on the existing control systems and communication protocols. The building systems that
used an open building automation communication protocol were easier to automate than the ones used
proprietary protocols because the open protocols could speak to multiple systems/devices manufactured by
different vendors to activate control strategies according to OpenADR signals.
To this point, we concluded that 1) OpenADR can support the price and DR interactions defined by the
deregulated and restructured market in NYS; 2) price response to day-ahead hourly pricing can be made
easier through Auto-DR; and 3) Auto-DR helps customer’s DR participation by eliminating human labor
and costs to provide DR and making it a repeatable and error-free process.
Auto DR enablement and commissioning at all sites were completed in early summer 2013. The DR
testing has taken place throughout the summer and fall of 2013.
31 Introduction
Demand response (DR) – allowing customers to respond to reliability requests and market prices by
changing electricity use from their normal consumption pattern – continues to be seen as an attractive
means of demand-side management and a fundamental smart-grid improvement that links supply and
demand. Large customers are often the first and most cost effective target for DR because they are major
contributors to peak demand for electricity and they are equipped with centralized building management
system (BMS). With increased adoption of interval meters, standards-based building control networking,
and building automation systems, an enormous opportunity lies ahead for medium and large customers to
exercise their full DR potential. However, today most adjustments to building controls and operations are
done manually, making responding to more frequent reliability events, hourly price response and daily peak
shaving impractical. Customers’ ability to perform DR can significantly improve by enabling automated
demand response (Auto-DR) [1]. By reducing the need for humans-in-the-loop, Auto-DR can reduce the
operational burden to provide real-time response and lower the cost associated with monitoring and
responding. It also helps customers leverage the flexibility of their buildings by automating responses to
price and reliability signals. Therefore, Auto-DR can help make the grid more sustainable and cost-
effective.
Since October 2011, the Demand Response Research Center (DRRC) at LBNL and New York State
Energy Research and Development Authority (NYSERDA) have conducted a demonstration project
enabling automated demand response (Auto-DR) in large commercial buildings located in New York City
(NYC) using OpenADR. New York State’s (NYS’s) market structure provides several mechanisms
intended to encourage larger customers to reduce their impact on the grid. These include hourly prices for
energy constraints; retail demand tariffs and utility DR programs for distribution system constraints;
wholesale DR for capacity constraints; and even dispatchable DR for providing Ancillary Service to the
New York Independent System Operator (NYISO).
The project focuses on following:
1) demonstrate how OpenADR can automate and simplify interactions between buildings and various
stakeholders in NYS including the NYISO, utilities, retail energy providers (REPs), and
curtailment service providers (CSPs);
2) automate building control systems to provide event-driven demand response, price response, and
demand management according to OpenADR signals; and
3) provide cost-saving solutions to large customers by actively managing day-ahead hourly prices
and demand charges.
The rest of the report is organized as follows. In Chapter 2, we provide an overview of DR programs in
NYS’s wholesale electricity markets and discuss cost control opportunities under day-ahead hourly pricing.
In Chapter 3, we explain some of the key concepts of OpenADR specifications and describe how
OpenADR can assist smart-grid interactions between the stakeholders in NYS. In Chapter 4, we describe
general methods used for Auto-DR implementation in large commercial buildings in NYC. In Chapter 5,
we describe the specific demonstration buildings and DR strategies developed for each participating
building. Lastly, we summarize the key findings in Chapter 6 and suggest future research opportunities in
Chapter 7.
42 Background
Prior to the project implementation, the DRRC commissioned an overview study of the wholesale and retail
electricity markets in NYS; the types of DR programs; retail pricing structures; and Mandatory Hourly
Pricing (MHP) [2, 3]. In this chapter, we summarize the findings from this study and discuss cost control
opportunities under the day-ahead hourly pricing. The demonstration sites for this project are in Manhattan
and therefore in Con Edison’s service territory.
2.1 Demand Response Forms Currently Present in New York State
The NYISO administers several DR market programs aligned to the following wholesale markets:
Capacity (installed capacity);
Energy (day-ahead balancing auctions); and
Ancillary services (regulation, spinning reserve and non-spinning reserve).
Additionally, utilities offer out-of-market DR programs to address their own transmission- and distribution-
level constraints and emergencies.
There are four generic forms of demand response present in NYS: 1) facility peak-shaving; 2) utility direct
load control, 3) reliability DR programs (curtailment and distributed generation) and 4) dynamic pricing.
Direct load control in NYS is a Con Edison program specific to small customers and is therefore not
examined in this project, but this project will examine Auto-DR as a means of facilitating the other three.
In NYS, several incentive-based reliability programs are offered by the NYISO and utilities. Table 1 lists
the name, service type, and trigger mechanism of all incentive-based programs currently available in NYC.
Table 1. Demand response curtailment programs in New York City
Program Name Operator Service Type Trigger
1. Installed Capacity Special Case Resources (SCR) NYISO Capacity Reliability
2. Emergency Demand Response Program (EDRP) NYISO Energy Reliability
3. Commercial System Relief Program (CSRP) (aka Peak) Con Edison Out-of-market Reliability
4. Distribution Load Relief Program (DLRP) (aka Contingency) Con Edison Out-of-market Reliability
Energy, Reserve Market
5. Day-Ahead Demand Response Program (DADRP) NYISO
and Regulation bid/dispatch
Customers are compensated for committing to reduce their electricity use during DR events by receiving
seasonal reservation payments based on market prices and tariffs respectively. Customers typically
participate in curtailment programs through CSPs. CSPs manage a portfolio of DR resources and their
response during DR events as well as aggregating smaller resources.
Dynamic pricing communicates variations in wholesale prices that may induce changes in customers’
energy consumption behavior in addition to the utility tariff components such as demand/delivery charges
which are not dynamic but also may induce peak shaving. Dynamic pricing exists as an optional or
mandatory utility tariff, or retail third-party energy supplier contract. In NYS, MHP is the default utility
service tariff for electricity for large commercial and industrial customers which indexes energy supply to
wholesale market prices1.
1
MHP was mandated as part of the decision made by the State of New York Public Service Commission in 2005 [4].
52.2 Barriers to Hourly Price Response in NYS
Although utilities offer MHP as the default service to large customers, NYS’s retail access policy allow
customers to purchase their energy from any retail third party supplier with various pricing structure as an
alternative to the utility so MHP is not strictly ‘mandatory’. In practice it is widely understood that NYS
customers for whom MHP may apply (roughly over 500kW demand) typically contract with a REP and
choose energy pricing that is not dynamic. The form of these retail supply contracts are not regulated and
often are flat-price contracts. REPs represent their customers in the wholesale market as load serving
entities (LSEs) for the purchase of forward capacity, forward and scheduled energy and ancillary services.
This structure is intended to equitably allocate wholesale costs to customers and provide sufficient forward
signals to the capacity and energy markets.
As of 2011, only 15% of the MHP-eligible customers were enrolled in MHP and the rest (85%) were retail
access customers [5]. Anecdotally, it is thought that flat price contracts are compelling for customer to
contract with a REP. The problem of this trend is that flat price retail contracts hedge against price
fluctuations and therefore do a poor job of reflecting wholesale near-term market prices (day-ahead, hour-
ahead and real-time). Flat price contracts are more expensive due to the inherent risk premium of offering
a less variable rate [6]. When retail prices are not tied to wholesale market variations, they can
“inefficiently increase the level of peak demand by underpricing” electricity and can also “discourage
increased demand during off-peak hours by overpricing it” [9]. The net effect is inefficiency and added
costs in the near term energy markets. NYS customers are allowed to pay a premium for the security of a
flat rate, but the premium does not cover the added costs to other customers having to absorb higher energy
prices (LBMPs). Thought retail products with dynamic prices indexed to the near-term wholesale energy
prices exist, there is no method for making day-ahead prices broadly available.
The recent report by KEMA identified the primary barriers to the adoption of MHP and indexed retail
contracts as insufficient resources to monitor hourly prices and inflexible labor schedule [5]. This is not
surprising since most customers rely on manually adjusting their systems and operations to provide DR.
Providing DR manually is a labor-intensive process. If customers do not have the capability to monitor
daily or hourly price variations and manage their loads in an automated way, they are likely to choose a
more conventional rate such as a flat rate. It should be noted that customers often prefer stable energy
prices for budgeting purposes. Moreover, customers have not yet found a compelling business case to stay
with MHP or choose indexed retail products. Many customers presume that the cost of monitoring and
automation outweighs the potential savings. Even if the savings exist under day-ahead hourly prices, they
are not as obvious and repeatable as the DR payments because the savings are a function of the market and
are embedded in the total electricity bill. Therefore, in order to increase the adoption of MHP and
dynamic-price retail contracts, we not only need to make the prices broadly available but also automate
customers’ price response. Moreover, potential savings and ways to achieve it should be clearly
communicated to customers.
2.3 Cost Control Opportunities
Day-Ahead Hourly Price Management
Customers’ electricity bills are made up of a number of different charges but they can be generalized into
three large categories: supply, delivery, and miscellaneous charges. MHP is used to calculate the supply
portion of electricity bills for large commercial customers unless the customer purchases electricity from a
retail energy supplier. Con Edison’s customers who are subject to the default MHP tariff are billed under
Rider M for their electricity supply. Under this rider, the cost of energy is calculated based on the
customer's actual hourly energy usage multiplied by the NYISO's day-ahead zonal locational based
marginal price (DA LBMP) [7]. The price variation in DA LBMP is perceived by customers to be wide
and unpredictable. Although a market is inherently unpredictable, our analysis over a year ending August
2012 revealed a different story: 1) DA LBMP stayed within a narrow range most of the time and 2) spikes
in DA LBMP were concentrated on cooling and heating dominated hours. Following figures support our
findings. Figure 1 displays the price duration curves of DA LBMP for Zone J: NYC between September
2011 and August 2012 [8].
6All day Weekday Weekend and holiday
Zone J: New York City
LBMP ($/MWh)
300
200
100
0
0 1 5 10 20 30 40 50 60 70 80 90 100
Percent Time (%)
Figure 1. Price duration curves: New York City LBMP from Sept 2011 to Aug 2012
DA LBMP did not vary significantly between weekdays and weekend/holiday. The price mostly stayed
below $100 per MWh. Deviation from that was only seen during the top one percent of the hours where
the price increased up to $363 per MWh. When plotted against the time of day, as shown in Figure 2, it
was clear that the prices corresponding to the top one percent of the hours were concentrated around
cooling season (summer afternoon) and heating season (winter morning and evening).
$300/MWh
$300/MWh > LBMP $200/MWh
$200/MWh > LBMP $100/MWh
$100/MWh > LBMP $98/MWh
24
18
Time of Day (hour)
12
6
0
Jan Feb Mar Apr May Jun Jul Aug Sep Oct Nov Dec
Figure 2. Distribution of New York City LBMP over month and time-of-day during the top 1% of
the time between Sept 2011 and Aug 2012
Therefore, controlling loads during the top one percent of the time, over the period we analyzed, would
have helped customers reduce their electricity bills were they on MHP. The same would be true for retail
customers whose electricity prices were tied to wholesale market variations. Moreover, reductions in
demand during peak hours by large customers can increase the efficiency of markets and reduce generating
costs in the long run [9, 10].
Demand Management
In addition to supply charges, large customers under Con Edison’s Service Classification 9 (SC-9) or those
with a retail energy supplier pay delivery charges to utilities for the delivery of electricity [11]. Table 2
shows the table of Con Edison’s delivery charges under SC-9, Rate II – Time-of-Day applied to customers
whose monthly maximum demand exceeds 1,500 kW.
7Table 2. Con Edison SC-9 - General Large, Rate II - Time-of-Day Delivery Charges2
Component of Delivery Charges Charges/Units
Demand Delivery Charges
Summer, all days, all hours $16.62 / kW-max demand
Summer, weekday, 8am-6pm (additive) $8.28 / kW-max demand
Summer, weekday, 8am-10pm (additive) $15.49 / kW-max demand
Winter, all days, all hours $5.33 / kW-max demand
Winter, weekday, 8am-10pm (additive) $11.42 / kW-max demand
Energy Delivery Charges
All months, all days, all hours 0.82¢ / kWh
Other Charges
Metering Services $/month
Reactive Power Demand Charge $/kVar
Additional Delivery Charges and Adjustments varies
The delivery charges have two main components: demand delivery and energy delivery. The demand
delivery charges have a tiered pricing structure calculated based on the maximum demand of each billing
cycle. The demand delivery charge is more expensive in summer than winter and additional charges apply
during peak hours. Hence, customers need to reduce energy demand during expensive periods in order to
save electricity bills. The energy delivery charge is a flat fee charged based on the total consumption of the
billing cycle; therefore, customers are not penalized for one-time peak demand for this charge. Additional
charges such as metering, reactive power, and payment processing fees are applied to include the cost of
the distribution infrastructure that the utility must maintain.
Sample Case
A sample breakdown of customer’s electricity bills is shown in Figure 3 and Figure 4. Figure 3 was
developed based on the actual monthly electricity bills in 2011 collected from one of our demonstration
buildings that purchased electricity from and is billed by the New York Power Authority (NYPA). NYPA
applies Time-of-Day (TOD) rates to calculate the supply portion of electricity bills. Using the customer’s
interval meter data from 2011, we created shadow bills as if this customer had taken service and had been
billed by Con Edison in 2011 under the MHP tariff (SC-9 with Rider M) shown in Figure 4. The numbers
are shown in percentage where 100% represents the total annual electricity cost in 2011. The charges are
grouped by seasons and the type of charges.
Figure 3. NYPA: actual electricity bill breakdown for a sample office building in 2011 3
2
effective as of 04/01/2012, available at http://www.coned.com/documents/elecPSC10/SCs.pdf
3
Spring includes March, April, and May. Summer includes June, July, and August. Fall includes September, October, and November.
Winter includes December, January, and February.
8Figure 4. Con Edison: predicted electricity bill breakdown for a sample office building in 2011
Some of the key observations are summarized below.
Despite of the concerns of being subject to hourly price variations for energy supply, the biggest
share of the customer’s annual electricity cost was delivery (60.6%), not supply (38.9%) over the
one-year period we analyzed. Delivery consistently outweighed supply in all four seasons under
the Con Edison’s MHP scenario.
In the case of NYPA, most of the delivery charges came from summer months, representing about
20% of the total annual electricity cost. Under NYPA, the customer paid more for supply (57.3%)
than delivery (40.7%) for this year.
Supply cost can be controlled by optimizing energy usage according to price variations and
delivery cost can be controlled by managing peak demand during expensive periods.
OpenADR can help customers reduce their energy bills by automating price response and peak
shaving.
It is worth noting that all of our demonstration buildings purchase electricity from a retail access supplier
with a flat rate and are not on Con Edison’s MHP tariff, though the one building taking their supply from
NYPA was on a time-of-day rate. For the purpose of the project, we assumed that the demonstration
buildings purchased electricity under Con Edison’s MHP tariff and therefore exposed all of their
consumption to the day-ahead hourly price variation of MHP.
93 OpenADR in New York State
In this chapter, we describe the key concepts of OpenADR and describe how the OpenADR data model
supports all of the common NYISO, utility, REP and CPS interactions with commercial customers in NYS.
Individually, these interactions are not complicated. However, as the number of interactions increases, the
customer’s burden to respond to multiple interactions also increases. OpenADR can simplify this process
by standardizing how each interaction will present its signals in a standards-based machine readable format,
enabling automated buildings response to benefit of a smarter grid in NYS.
3.1 OpenADR Specifications and Key Concepts
OpenADR is an open and interoperable communication standard that facilitates smart-grid information
exchange among ISO, utilities, aggregators, energy services providers and end-users. OpenADR is
different than other demand response application protocols, like Smart Energy Profile (SEP) intended for
home-based device interactions over advanced metering infrastructure (AMI) based transport [13]. The
original OpenADR version 1.0 specification was published in 2009, creating a technical framework for
automated communication of price and reliability signals between servers (e.g. utilities) and clients (e.g.
end-user) [12]. Building on this framework, the OpenADR version 2.0 specifications have been developed
to standardize testing and certification of Auto-DR. This effort is supported by the National Institute of
Standards and Technology (NIST) along with organizations including: the Organization for the
Advancement of Structured Information Standards (OASIS), the Utilities Communications Architecture
International User’s Group (UCAIug), and the North American Energy Standards Board (NAESB). The
OpenADR 2.0 standard consists of following profiles.
Profile A (OpenADR 2.0a): is designed for low-end embedded devices to support basic DR
services and markets.
Profile B (OpenADR 2.0b): is designed for high-end embedded devices and includes
reporting/feedback capabilities for past, current, and future data reports.
The OpenADR 2.0a and 2.0b specifications are available on the OpenADR Alliance’s website.4
A new concept introduced in OpenADR 2.0 is the ability to support two types of communication nodes: the
Virtual Top Node (VTN) and the Virtual End Node (VEN). The VTN represents a server that publishes
and transmits OpenADR signals to end-devices or other intermediate servers. The VEN is a client, an
energy management system, or an end-device that accepts OpenADR signals from the VTN and responds
to them. An end node can be both a VTN and VEN at the same time. The OpenADR signals are
transported via standards-based Internet Protocols (IP) such as Hyper Text Transfer Protocol (HTTP) or
XML Messaging and Presence Protocol (XMPP). The message exchange is accomplished in either a
PUSH mode or in a PULL mode. In the PUSH mode, the VTN initiates the communication and sends
signals to the VEN. In the PULL mode, the VEN initiates the communication by periodically polling
updates from the VTN to retrieve the information published by the VTN. The PULL mode can be used to
poll day-ahead price signals from ISO or a utility at the client’s request.
To use the PUSH mode, the VEN must expose an endpoint URL to create a channel to which the VTN can
send price or reliability signals. However, communicating in the PUSH mode can face technical challenges
because the VEN may reside behind a network firewall [14]. Moreover, customers may not want to expose
the endpoint URL of their server due to network security reasons. In the PULL mode, the network firewall
issues can be avoided and the requirement of a server is removed on the VEN. However, the PULL mode
introduces latency due to limited polling frequency and requires increased bandwidth [14]. Hence,
OpenADR clients should select the mode of communication in consideration of communication needs and
technical requirements.
The message exchange patterns for the event PUSH and PULL mode are shown in Figure 5 and Figure 6.
4
http://www.openadr.org/
10Figure 5. OpenADR 2.0 Event PUSH Pattern (Source: OpenADR 2.0b)
Figure 6. OpenADR 2.0 Event PULL Pattern (Source: OpenADR 2.0b)
Using the PULL mode, the VEN can provide real-time usage data to the VTN by requesting pending
service operations from the VTN and then sending the real-time usage data when the communication
channel is established. OpenADR 2.0b provides additional feedback and reporting capabilities including
historic usage logs, baseline, and forecast which can help aggregators predict and verify the DR
performance of their resources.
3.2 OpenADR Sample Use Cases
To show how OpenADR can facilitate smart-grid information exchange among New York stakeholders, we
provide two sample use cases: 1) event-driven DR programs and 2) day-ahead hourly pricing. Figure 7
shows the diagram of the event-driven DR programs in NYC. All communication is exchanged in the
PULL mode to avoid opening the building’s network firewall. An exception is made for the Direct Load
Control program in which case customers agreed to allow utilities to control their equipment or systems
during DR events.
11Figure 7. OpenADR communication architecture for event-based DR programs in New York City
Using OpenADR, the NYISO or Con Edison can publish DR event notifications including the program
type, date, time, and duration as well as target type (by geographic location, pricing node, or program
associations) [14]. Based on the DR event information received from the NYISO or Con Edison, a CSP
can activate a DR response for all or selected resource groups. The end-users (i.e. BMS systems or
individual devices) can pull the DR event information from the entity where they subscribe their DR
participation (likely the CSP). The end-users can respond to the DR event by manually changing control
set points or by automatically triggering pre-programmed control strategies via the facility’s BMS.
OpenADR communication of dynamic pricing works in much the same way as the event-based DR
programs. Figure 8 shows the OpenADR use case scenario for day-ahead hourly pricing in NYC.
12Figure 8. OpenADR communication architecture for dynamic pricing in New York City
OpenADR can be used to publish the NYISO’s wholesale prices (day-ahead or day-of zonal LBMP) via
OpenADR communication networks. Con Edison and REPs can receive the price signals from the NYISO
and determine their rates (i.e., MHP or Index) to reflect the wholesale market variations. End-users who
respond to dynamic pricing can pull the price information from Con Edison or a REP from their OpenADR
client and manage energy usage accordingly.
There are several manners of varying level of complexity for Auto-DR implemented in the buildings
systems of large customers. If the end-user BMS has the real-time processing capabilities, the building’s
Auto-DR system can change system operations dynamically throughout the day according to the day-ahead
price schedule received from Con Edison or a REP. More simply and potentially nearly as effective, a
BMS having received the day-ahead price schedule could be programmed with price thresholds above
which certain curtailment modes are invoked. Similarly, the utility’s or energy supplier’s OpenADR server
could, as a value added service, translate the price information into simple operational modes (Normal,
Moderate, High, Critical or Special modes) and communicate to the building’s Auto-DR system via
OpenADR client based on the preferences of the building management. In this implementation, the BMS is
not making a decision on how to respond to prices, eliminating the need for a dynamic control algorithm.
The OpenADR server (VTN) can have a web application with a user interface where the building
management can set thresholds and associate its Auto-DR modes. The site’s OpenADR client (VEN) is
then, merely triggering those pre-programmed control strategies.
134 Methods
In this chapter, we describe the methods used for Auto-DR implementation at the demonstration sites
including communication, hardware and software installation, and DR control strategies. Some of the on-
site implementation details had to be tailored to address site-specific conditions such as the existing control
systems and buildings automation protocols. However, the overall architecture of the OpenADR
information exchange was consistent for all demonstration sites.
4.1 OpenADR Communication Architecture and Security
The information exchange in the demonstration project was accomplished via the Internet. OpenADR 1.0
specification was used as the smart-grid communication protocol to facilitate the communication of price
and reliability signals as might be done among customers, the NYISO, Con Edison, and CSPs. The
OpenADR 2.0a and 2.0b specifications, which are currently available, were not released at the time of the
project implementation; therefore, they were not used for this project. Nevertheless, OpenADR 1.0 profiles
were sufficient for communicating day-ahead hourly prices and DR event notifications as would be needed
for the most common DR and price signals NYS. Figure 9 shows the OpenADR communication
architecture for this project. Our demonstration sites all received DR event notifications from their CSP,
not directly from the NYISO or Con Edison.
NYISO/Utility
Standard Participant Interface
Day-Ahead
Hourly Price
Secure Internet
via web scraping Operation Modes
via OpenADR
OpenADR
Client
DR Interval Meter Data
Test/Event BMS
Notification
CSP via email
OpenADR Server Facility
Figure 9. OpenADR communication architecture for the New York demonstration site
Currently, the NYISO, Con Ed, and CSPs do not publish their price and DR signals using OpenADR
protocols. To mimic price and reliability signals from these entities, we used a centralized OpenADR
server. To generate pricing signals, the OpenADR server scrapes the day-ahead LBMP published on the
NYISO's website in tabular format and converts the data into OpenADR signals. This task was automated
by the server and is performed daily after the NYISO publishes the day-ahead LBMP. A CSP currently
sends DR test/event notifications to the customer via email. During the demonstration the OpenADR
server would receive the same email and convert the message into an OpenADR signal(s). Upon receiving
the OpenADR signals, the site’s OpenADR client activates pre-programmed control strategies via the
facility’s BMS. The OpenADR server also collects electric meter data for monitoring purposes. All
information exchange was accomplished through a secure Internet connection with 128-bit Secure Sockets
Layer encryption.
Akuacom, a Honeywell subsidiary, provided the OpenADR server called the Demand Response
Automation Server (DRAS) for this project. The security policy which governs the DRAS is largely based
on the NIST’s Interagency Reports 7628: Guidelines for Smart Grid Cyber Security. Appendix A includes
the cyber security plan for the DRAS. The North American Electricity Reliability Corporation’s Critical
Infrastructure Protection Standards (NERC-CIP) provides comprehensive security requirements for critical
cyber assets in the bulk electric system. It is mandatory for selected assets that belong to the Responsible
Entity category.5 The DRAS does not fall under the NERC-CIP requirements because it controls less than
5
NERC-CIP is mandatory for Responsible Entity (control centers and backup control centers, transmission substations, generation
resources, systems and facilities critical to system restoration, automatic load shedding capable of shedding 300 MW or more, special
protection systems, and any additional assets that support reliable operation of the Bulk Electric System [15].
14300 MW of potential shed. However, its security policy was written with NERC-CIP requirements in mind;
hence, it is capable of supporting the NERC-CIP requirements.
4.2 Auto-DR System Design and Configuration
A site’s Auto-DR system design and configuration depends heavily on the capabilities of existing control
systems and communication protocols. It is common for large commercial buildings to have several
control systems and devices (i.e., HVAC, lighting, electric, security, etc.) used for building operation. A
centralized BMS integrates individual control systems/devices to provide greater controllability and
efficiency to building managers. Installing a centralized BMS can be a seamless process if all
systems/devices use an open building automation communication protocol, which facilitates
interoperability between different vendors’ systems. However, this is not always the case due to different
communication protocols used across control systems/devices in the same building.
The building automation communication protocols are largely grouped into two categories: proprietary and
open protocols. Proprietary protocols are vendor-specific and used for individual control. Open building
automation communication protocols are vendor-neutral supporting all building systems and devices
equally and used within a building. The open protocols such as BACnet, Modbus, and LONWORKS are
standard communication protocols for building automation and control. They provide interoperability
between different vendors’ systems. The use of an open building automation communication protocol is
advantageous for Auto-DR when multiple systems/devices need to respond to the same OpenADR signals.
Three of the four demonstration sites’ BMS use BACnet as the building automation communication
protocol and one building uses a proprietary protocol.
Equipment Installation and Programming
Each demonstration building had a vendor-specific BMS, namely Honeywell’s Enterprise Buildings
Integrator (EBI), Automated Logic Corporation’s WebCTRL® , Schneider Electric's Andover Continuum,
and Johnson Control Inc.’s Legacy respectively. Honeywell provided the overall system design and
equipment installations for the project and the services at each site. Programming of the control strategies
for EBI was done by Honeywell’s engineering team. As for WebCTRL® , Andover Continuum, and
Legacy, subcontractors were hired for programming in each vendor’s software. Most of the control
strategies were HVAC-related. We proposed lighting strategies for two buildings in addition to the HVAC
strategies. However, the lighting system was not integrated into the BMS prior to the project and additions
would increase costs and further delay the project.
None of the buildings had BMSs that were natively equipped with an OpenADR client. An OpenADR
client was provided within a gateway device called a Java Application Control Engine® (JACE® ) box, in
each of the four buildings to provide connectivity between DRAS (VTN or OpenADR server) and building
systems/devices. A physical connection (via a meter splitter or a direct line) was made between JACE®
and the building’s electric meters to poll meter readings via kyz pulses. The meter data was sent from
JACE® to DRAS for monitoring purposes. Currently, the meter data is being polled at a 15-minute
interval to match the interval of Con Edison’s meter reading. However, JACE® can increase the polling
frequency (i.e., 5-min or 1-minute) as long as the building’s network bandwidth can support. In recent
years, a number of vendors have begun to offer OpenADR embedded BMSs so that BMSs can directly
send or receive OpenADR messages without a gateway device such as JACE® box.
Open Protocol
For the buildings using BACnet as the communication protocol, the JACE® translated OpenADR signals
into BACnet messages and sent them to Honeywell’s ComfortPoint™ Open Plant Controller (CPO). The
CPO is a computer where Auto-DR intelligence resides. It maps each OpenADR signal into target
systems/devices through a BMS according to pre-programmed control strategies. The CPO also hosts a
web-based user interface (UI) for building managers to opt in/out of individual control strategies. The UI
can be accessed remotely over the Internet. The Auto-DR system configuration using BACnet is shown in
Figure 10.
15Figure 10. Auto-DR System Configuration for Buildings with Open Protocol
Proprietary Protocol
One building used Legacy BMS which communicated using proprietary protocol. Since there was no
common communication protocol across the systems/devices, we provided a physical connection between
the JACE® box and and Legacy system. The installation of a CPO was not necessary since the direct
connection was established between the JACE® box and Legacy system. For simplicity, the project’s
implementation provided building managers the ability to opt-out of Auto-DR via the DRAS client
interface accessible over the Internet. Since the CPO is not installed in this building, the building managers
cannot opt-in/out of individual control strategies which reside within their on-site Auto-DR control system.
The Auto-DR system configuration for this building is shown in Figure 11.
16You can also read