FARMS UNDER THREAT The State of America's Farmland - Farmland Information Center
←
→
Page content transcription
If your browser does not render page correctly, please read the page content below
FARMS UNDER THREAT
The State of America’s Farmland

                   FA R M S U N D E R T H R E AT: T H E S TAT E O F A M E R I C A’ S FA R M L A N D   A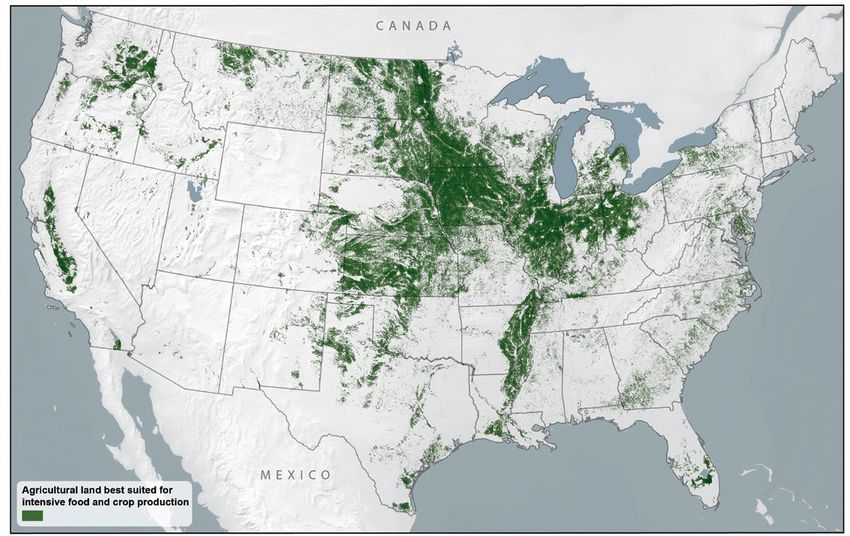
ROB BYRON/SHUTTERSTOCK
cover image :
Farmland and urban
sprawl collide in
Lompoc, California.
About the Quotes in this Report
AERIAL ARCHIVES/ALAMY
Farms Under Threat: The State of America’s Farmland honors
STOCK PHOTO
two former chiefs of the USDA’s Soil Conservation Service
(now NRCS): Hugh Hammond Bennett, who led the soil
above :
A new housing conservation movement in the United States and was the first
development head of the agency; and Norm Berg, who worked with Bennett
encroaches on and rose through the ranks to serve as chief between 1979 to
farmland. 1982. After he retired, Berg served as a senior policy advisor to
Anywhere, USA. American Farmland Trust and the Soil and Water Conservation
Society. To learn more about these influential voices, see
www.nrcs.usda.gov (Bennett) and www.farmlandinfo.org/
norm-berg-collection (Berg).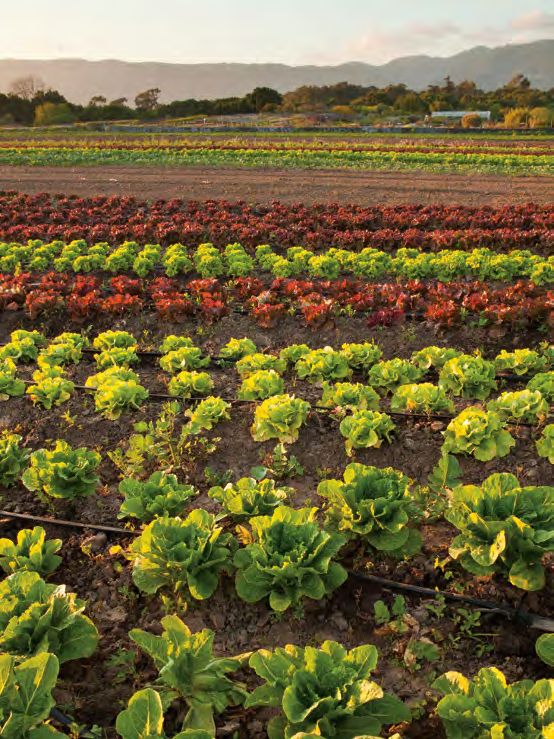
MAY 9, 2018

“Take care of the land and
 the land will take care of you . . . .”
—Soil conservation pioneer
 Hugh Hammond Bennett, 1947
Acknowledgments                                       Lead authors: A. Ann Sorensen,
                                                                                                              Julia Freedgood, Jennifer Dempsey and
                                                        Critical support from USDA’s Natural Resources        David M. Theobald
                                                        Conservation Service (NRCS), the Sarah K.             Suggested citation: Sorensen, A. A., J.
                                                        deCoizart TENTH Perpetual Trust, and American         Freedgood, J. Dempsey and D. M. Theobald.
                                                        Farmland Trust’s members, supporters, and Board       2018. Farms Under Threat: The State of
                                                        of Directors made possible this analysis of the       America’s Farmland. Washington, DC:
                                                        past losses of, and future threats to, America’s      American Farmland Trust.
                                                        farmland and ranchland. NRCS shared data and
                                                        guidance, reviewed reports, and provided financial    © 2018 American Farmland Trust
                                                        assistance through an AFT-NRCS Contribution
                                                        Agreement 68-3A75-14-214. We also appreciate
                                                        the guidance offered by our Advisory Committee
                                                        and other external reviewers. Additional
                                                        investments will help us continue these analyses,
                                                        broadly distribute the results, and act to conserve
                                                        our agricultural land for future generations.

                                                        About American Farmland Trust and
                                                        Conservation Science Partners
                                                        American Farmland Trust (AFT) is a nonprofit
                                                        conservation organization founded in 1980
                                                        to protect farmland, promote sound farming
                                                        practices, and keep farmers on the land. For
                                                        more information, visit www.farmland.org/
                                                        FarmsUnderThreat or our technical
                                                        information center at www.farmlandinfo.org.

                                                        Conservation Science Partners (CSP) is a
                                                        nonprofit scientific collective established to
                                                        meet the analytical and research needs of
DAVID R. FRAZIER PHOTOLIBRARY, INC./ALAMY STOCK PHOTO

                                                        diverse stakeholders in conservation projects.
                                                        More information is available online at
                                                        www.csp-inc.org.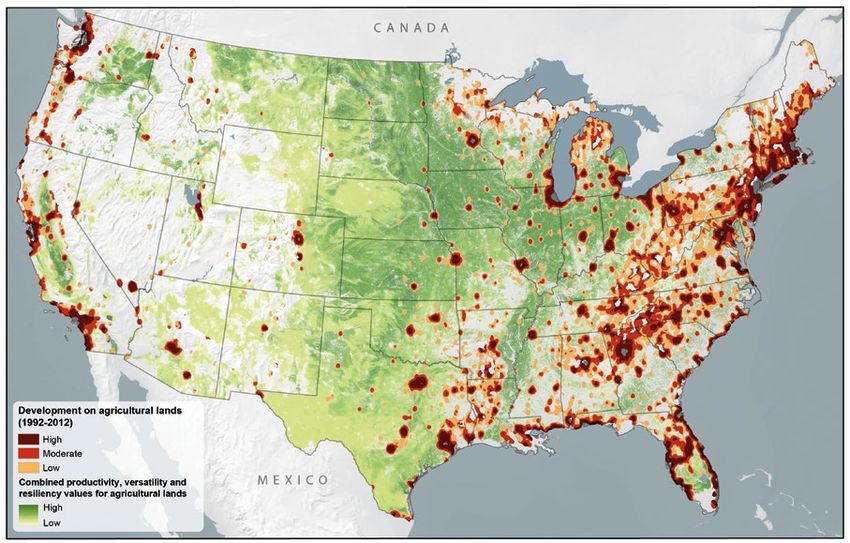
CONTENTS
     v    Executive Summary                1   Introduction             34   Recommended

   viii   Key Findings                    3    What Is at Risk               Actions

     x    Key Recommendations             5    Tracking the Status 		   37   Future Farms Under

                                               of Agricultural Land          Threat Releases and
                                                                             Analysis
                                          9    Methods
                                                                        38   References
                                         17    Findings

                                         27    Discussion

A crop of onion grown for seed in Payette County, Idaho.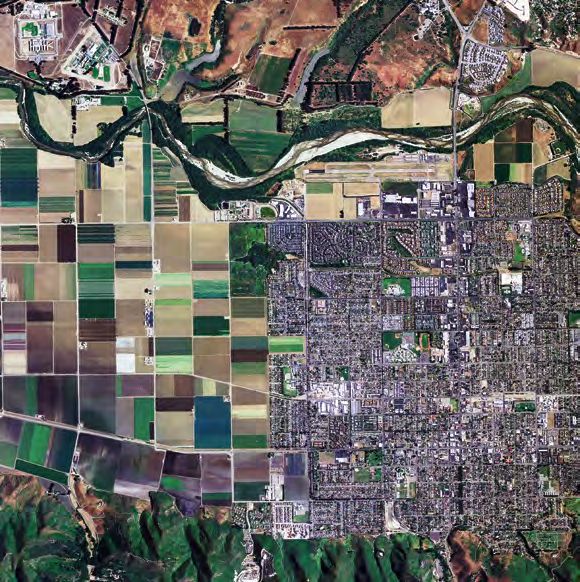
CHUCK PLACE/ALAMY STOCK PHOTO

                                        A selection of lettuce varieties at Lane Farms in Santa Barbara, California.
                                iv   A M E R I C A N FA R M L A N D T R U S T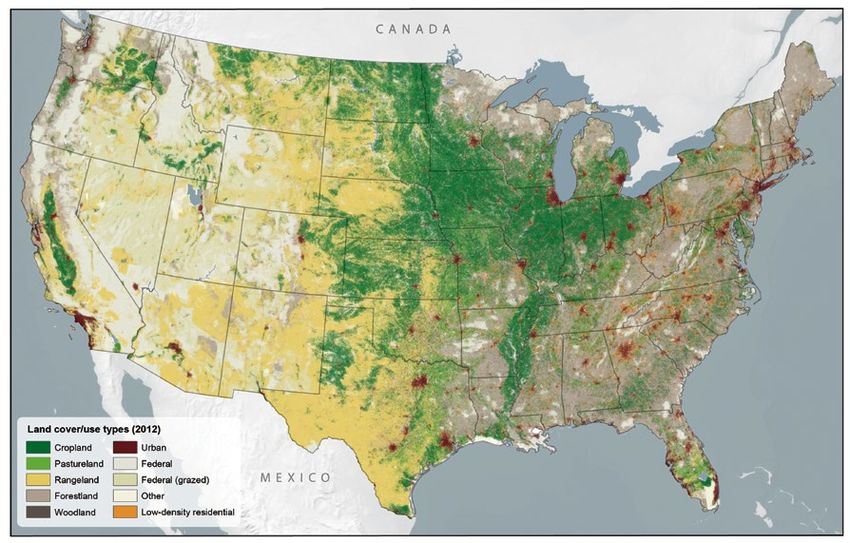
Executive Summary
WITH KEY FINDINGS AND RECOMMENDATIONS
T
he United States is blessed with a remarkably productive agricultural
landscape. Cropland, pastureland, rangeland, and woodland support
a regionally diverse food and farming system capable of ensuring
INGA SPENCE/ALAMY STOCK PHOTO
domestic food security. Agricultural land contributes to state and local
economies, supplies lucrative export markets, and bolsters the nation’s
balance of trade. These exceptional natural resources sustain valuable
wildlife habitat, provide flood control and fire suppression, scenic views,
and resources for hunting and fishing. This land also acts as an enormous
carbon sink, drawing down carbon from the atmosphere, which helps
combat climate change. By 2050, the demands on agriculture to provide
sufficient food, fiber, and energy are expected to be 50 to 70 percent
Beets in Inyo County, California.
higher than they are now. Given a limited land area in the United States
and the need to feed and house an increasing number of people, it is
more important than ever to protect the agricultural land and natural
resources needed for long-term sustainability. U.S. AGRICULTURE RELIES ON
HIGH-QUALITY FARMLAND
This call for action is documented and reinforced by the findings of
Farms Under Threat: The State of America’s Farmland by American
Farmland Trust (AFT). The report’s research shows that between 1992
17%
and 2012, almost 31 million acres of agricultural land were irreversibly
lost to development. That is nearly double the amount of conversion
previously documented and is equivalent to losing most of Iowa or New
York. As alarming, this loss included almost 11 million acres of the best
land for intensive food and crop production. This is land where the
soils, micro-climates, growing seasons, and water availability combine
to allow intensive production with the fewest environmental impacts.
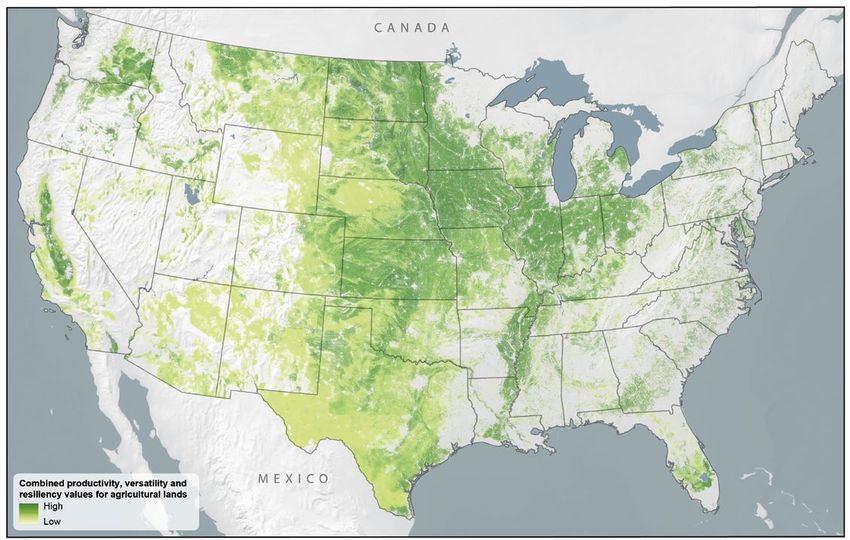
These precious and irreplaceable resources comprise less than 17
percent of the total land area in the continental United States. Their
conversion was equivalent to losing most of California’s Central Valley,
an agricultural powerhouse. Only 17 percent of the land in the
continental U.S. is agricultural land
Over 20 years ago, AFT released the groundbreaking report, Farming on with the productivity, versatility,
the Edge. This compelling study and extensive mapping gained global
and resiliency (PVR) to produce a
media attention by showing how sprawling development consumed
wide variety of crops with minimal
America’s highest quality farmland in critical regions across the country.
environmental limitations.
Now, new threats to the nation’s agricultural lands create a pressing need
to update the old analyses and assess threats to America’s agricultural
land in the 21st century. Improvements in the availability of national
data and models now enable AFT to more accurately track the scale and
spatial location of the threat of development to the nation’s agricultural
FA R M S U N D E R T H R E AT: T H E S TAT E O F A M E R I C A’ S FA R M L A N D v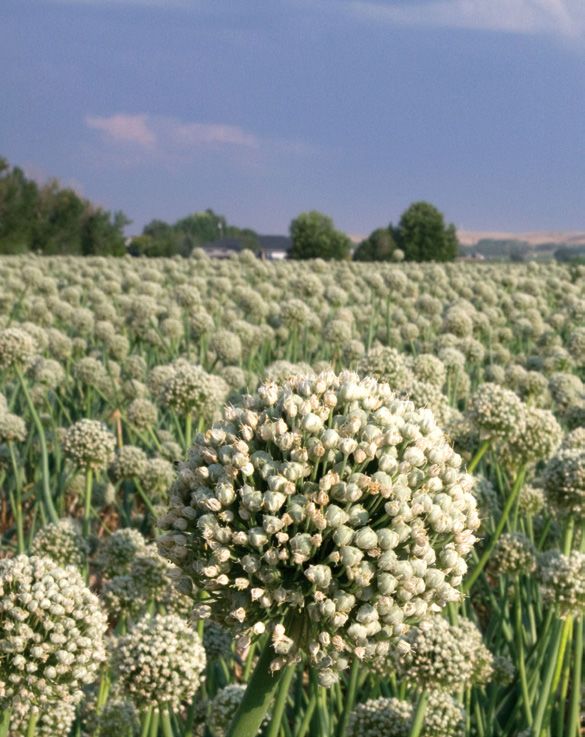
EXECUTIVE SUMMARY
land.1 They also make it possible to assign values to measure the land’s
productivity, versatility, and resilience. These advances make it possible
for AFT not only to examine past conversion patterns but also to forecast
future development patterns likely to occur without better land use
planning and policy intervention.
These analyses underpin Farms Under Threat, AFT’s multi-year
initiative to complete the most comprehensive assessment of the loss
of U.S. farmland and ranchland ever undertaken, both past and future.
AFT’s goal is to document the threats and offer policy solutions to
ensure the long-term protection and conservation of agricultural land
in the United States to sustain an expanding population and protect
biodiversity. This first report, Farms Under Threat: The State of America’s
Farmland, examines the nation’s irreversible loss of agricultural land to
AFT’s goal is to document development between 1992 and 2012. A subsequent report will analyze
state-level data on past farmland conversion and the effectiveness
the threats and offer of state-level farmland protection policies. In a third report, Farms
policy solutions to ensure Under Threat will assess a range of future threats, forecast potential
impacts to 2040 and recommend effective policies that help conserve
the long-term protection agricultural land.
and conservation of
agricultural land in the AFT is working with Conservation Science Partners (CSP), a non-profit
conservation organization, to ensure these assessments are grounded in
United States to sustain an reliable data and strong science. This partnership is supported by the
expanding population and USDA’s Natural Resources Conservation Service (NRCS). A national
Advisory Committee provided additional guidance, and NRCS shared
maximize biodiversity.
data and reviewed findings. Farms Under Threat significantly advances
our understanding of the patterns of past farmland conversion and
provides information about the location, quantity, type, and quality
of the agricultural land lost to development in the continental United
States between 1992 and 2012. These maps and data can serve to
improve agricultural land conservation and permanent protection across
the nation.
Farms Under Threat: The State of America’s Farmland significantly
improves the national inventory of agricultural land in multiple ways:
1) It maps and analyzes the extent of low-density residential development
on agricultural land; 2) It identifies agricultural land based on its
productivity, versatility, and resiliency to support intensive food and crop
production (PVR values); 3) It includes a new class of agricultural land that
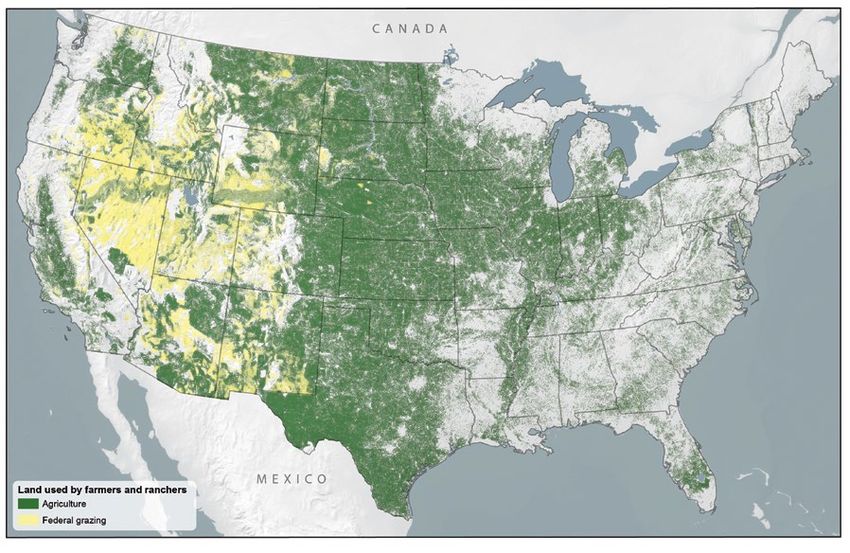
estimates woodland associated with farm enterprises; 4) It maps grazing
on federal land; and 5) It shows the spatial patterns of agricultural land
1 Farms Under Threat defines agricultural land as cropland, pastureland, rangeland, and
woodland associated with farms in the continental United States (48 states), excluding federally
owned grazing land. This non-federal agricultural land is called farmland and ranchland by the
public. The analysis uses the USDA National Resources Inventory (NRI) definitions for cropland,
pastureland, rangeland, and forestland.
vi A M E R I C A N FA R M L A N D T R U S T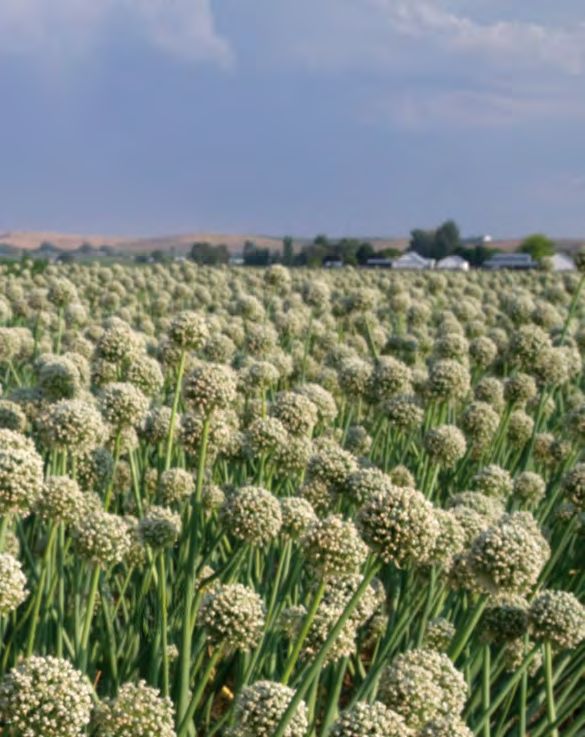
EXECUTIVE SUMMARY

                                                                                                                                                                    DESIGN PICS INC/ALAMY
An Iowa soybean field.

uses and conversion to development in a consistent way over time so that
people can see the patterns of change.

Assigning PVR values to agricultural land helps quantify the quality
of the agricultural land converted by development. Land with lower
PVR values has progressively greater limitations that restrict how it
can be used and whether it can be cultivated. The land best suited for
intensive food and crop production has much higher PVR values and is
geographically limited to areas where the nation’s soils, micro-climates,
growing seasons, and water access combine to allow production with the
fewest environmental impacts.

                                                                           FA R M S U N D E R T H R E AT: T H E S TAT E O F A M E R I C A’ S FA R M L A N D   vii
EXECUTIVE SUMMARY
KEY FINDINGS 2
The U.S. converted almost 31 million acres of agricultural land
between 1992 and 2012. By including woodlands associated with farms
and low density residential development, this analysis found nearly
twice the conversion previously reported. The loss is equivalent to
developing most of Iowa or the entire state of New York.
BOB NICHOLS/USDA NRCS
Overall, development disproportionately occurred on agricultural
lands. More than 70 percent of urban development and 62 percent
of all development took place on agricultural land. Expanding urban
areas accounted for 59 percent of the loss, including the commercial,
industrial, transportation, and high-density residential development
New homes replace farmland in Dane County,
Wisconsin.
which reflect the expanding footprint of U.S. cities and towns. Low-
density residential development accounted for 41 percent of the loss and
included residential areas with houses built on one- to 20-acre parcels
and exurban homes on even larger lots that effectively removed these
properties from agricultural uses.
Urban development favored cropland while low-density residential
development posed an equal threat to cropland and pastureland.
Urban development most frequently converted cropland (41 percent)
and lower percentages of pastureland (25.9 percent), rangeland
(23.8 percent), and woodland (9.3 percent). In contrast, low-density
residential development posed an equal threat to cropland and
pastureland (34.5 percent each) and favored woodland (19.9 percent)
over rangeland (11.1 percent). For forestland, low-density residential
development presented a greater threat than urban development.
The impact of these development patterns puts high quality
agricultural land at risk. The analysis assigned values to reflect the
productivity, versatility, and resiliency (PVR value) of agricultural land
for cultivation. As the PVR value increased, fewer acres of land qualified.
The analysis found that the median PVR value of agricultural land lost
to development was 1.3 times higher than the median PVR value of land
that stayed in production. These cumulative and irreversible losses of
most productive, versatile, and resilient lands have serious implications
for agricultural productivity and domestic food security.
2 AFT is solely responsible for the conclusions and recommendations in this report. Although
information from NRCS data comprises a major component of this analysis, the conclusions and
recommendations are AFT’s alone.
viii A M E R I C A N FA R M L A N D T R U S TEXECUTIVE SUMMARY
By 2012, the best land to support intensive food and crop production
had dropped to less than 17 percent of the total land area in the
continental United States. Only 324.1 million acres of agricultural
land had PVR values with the optimal soil characteristics and growing
conditions to support intensive food and crop production with minimal FARMLAND LOST TO
environmental limitations. This is slightly more than one third of DEVELOPMENT, 1992–2012
agricultural land.
In less than one generation,3 the United States irrevocably developed
nearly 11 million acres of its best land for intensive food and crop
production. While a 3.2 percent loss does not sound devastating, it is
roughly equivalent to losing one of the most productive growing regions
in the United States, California’s Central Valley.
Beyond food security and economic prosperity, well-managed agricultural
land provides open space, recreational resources for activities like
hunting and fishing, and critical ecological services such as wildlife
habitat, carbon sequestration, groundwater recharge, and flood control.
This incredible diversity provides the United States with invaluable
options to help the nation optimize the use of agricultural resources to All farmland lost:
sustain future generations.
almost 31 million acres
(nearly equivalent to the land
It is time for the United States to recognize the strategic value of our
mass of New York State)
agricultural land and step up our efforts to protect it. It is critical to
balance the growing demands for energy, housing, transportation, and
water to ensure our best agricultural land remains available for food and
other crop production. Through thoughtful and carefully implemented
land use and agricultural policies, the nation can protect farmland and
strategically direct development away from critical agricultural resources
while nourishing the land with conservation practices and helping the
farmers and ranchers who manage this landscape to thrive.
Some of our best farmland was
irreversibly lost: almost 11 million
acres (equivalent to 47% of the
land mass of Indiana)
3 A generation is considered to be about 25.5 years in length.
FA R M S U N D E R T H R E AT: T H E S TAT E O F A M E R I C A’ S FA R M L A N D ixEXECUTIVE SUMMARY
KEY RECOMMENDATIONS
Based on these national findings, AFT believes a bold and comprehensive
national strategy is needed to save the land that sustains us, including:
DESIGN PICS INC./ALAMY STOCK PHOTO
A dramatic increase in federal investments in agricultural land
protection through the USDA Agricultural Conservation Easement
Program—Agricultural Land Easements (ACEP-ALE);
Supporting and fully funding the USDA agencies and their programs
that provide unbiased information to help monitor changes to U.S.
agricultural resources, including the NRCS’ National Resources
Ripe cranberries in Valley Junction, Wisconsin. Inventory (NRI), the National Agricultural Statistics Service’s (NASS)
Tenure, Ownership and Transfer of Agricultural Land (TOTAL)
survey, and the Economic Research Service’s (ERS) Major Land Uses
reports; and,
Enacting a 21st century federal agricultural land protection platform
to more effectively address the interconnected threats to farmland
from development, climate change, agricultural viability, and
farm succession.
x A M E R I C A N FA R M L A N D T R U S TIntroduction
T
he precious arable land that sustains life on Earth is a finite and
irreplaceable resource that is under heavy stress. Less than six
percent of the Earth’s surface is suitable for agriculture and growing
BLEND IMAGES/ALAMY STOCK PHOTO
food. When climate, soils, and topography are factored into the equation,
just over half of this land can be farmed without any physical constraints
(FAO 2011). Over 10 percent of the world’s arable acres are in the
United States.4
The United States is blessed with a varied and extensive agricultural
landscape comprised of cropland, pastureland, rangeland and woodland
associated with farms, making agriculture a significant contributor to
rural and urban economies. However, agricultural land, both domestically By 2050, the demands on agriculture
and globally, faces unprecedented challenges as the world’s population to provide the necessary food, fiber,
continues to expand. By 2050, the demands on agriculture to provide
the necessary food, fiber, and energy are expected to be 50 to 70 percent and energy are expected to be 50 to
higher than they are now. To meet these demands, all countries must 70 percent higher than they are now.
sustainably improve their agricultural productivity, protect their
natural resources, and deal with changing weather patterns and the
intensification of natural hazards (FAO 2011; FAO 2017).
Because the United States is home to such a significant amount of the
world’s arable land, the protection of this resource is a national and
global concern.
Since our founding in 1980, AFT has been concerned about the loss of
agricultural land. Over 20 years ago, AFT released the groundbreaking
report Farming on the Edge to call attention to the sprawling
development that consumes America’s highest quality farmland in every
state in the nation (Sorensen et al. 1997). Farming on the Edge was a
wake-up call about the impacts of farmland loss and the need to act to
protect our agricultural land base from poorly planned development. The
report led to policy action at the federal, state, and local levels. While
development slowed significantly during the recession from 2007 to
2012, it has rebounded with the strengthened economy. Recognizing the
need to update AFT’s old analyses and assess the threats to America’s
agricultural land in the 21st century, AFT launched its Farms Under
4 Arable land is land capable of being farmed productively (i.e. being plowed or cultivated and
used to grow crops).
FA R M S U N D E R T H R E AT: T H E S TAT E O F A M E R I C A’ S FA R M L A N D 1INTRODUCTION
Threat initiative, the most comprehensive and ambitious assessment
ever undertaken of the status and threats to U.S. farmland and ranchland.
Farms Under Threat is a multi-year initiative to complete the most
comprehensive assessment ever undertaken of the status and threats
to U.S. farmland and ranchland. Its analyses underpin AFT’s goal
GBALDAUF/ISTOCKPHOTO
to document the threats to the nation’s agricultural resources and
offer policy solutions. The goal is to ensure the long-term protection
and conservation of America’s diverse agricultural landscape to
support farmers and ranchers, sustain an expanding population, and
maximize biodiversity.
California pastureland.
This report, Farms Under Threat: The State of America’s Farmland, is
the first in a series of analyses of past and future threats to America’s
agricultural land. AFT defines agricultural land as the non-federal
cropland, pastureland, rangeland, and woodland associated with farms
that is managed to support agricultural production. For the first time,
data and models are available to spatially portray the extent, diversity,
and quality of America’s agricultural land and the threat of development.
These tools make it possible to examine past conversion rates and map
the scale and location of that development. Future Farms Under Threat
assessments will analyze farmland conversion at the state level and the
effectiveness of state policies to address it; study demographic shifts and
the impending transition of agricultural land ownership; and use housing
density and climate projections to forecast what could happen to the
nation’s agricultural land by 2040 if no actions are taken.
AFT is working with Conservation Science Partners (CSP) to ensure
these assessments are grounded in reliable data and strong science. This
partnership is supported by the USDA’s Natural Resources Conservation
Service (NRCS). Additional guidance was provided by a national
Advisory Committee, and NRCS shared data and reviewed findings and
drafts of maps and reports.
2 A M E R I C A N FA R M L A N D T R U S TWhat Is at Risk
U
.S. agricultural land supports state and local economies, s ignificant
export markets, and the nation’s balance of trade. Locally, this FOOD IN THE PATH OF
agricultural land contributes to fiscal balance: as with other DEVELOPMENT
commercial land uses, the property taxes generated by agricultural Metropolitan counties and adjacent
land typically exceeds the expense of providing it with public services.5 areas supply the majority of domestically
Collectively, this land supports a regionally diverse food and farming
produced:
system and contributes to a secure food supply. Fifteen percent of
U.S. counties are classified as farming-dependent (in terms of jobs),
and nearly 60 percent of the market value of U.S. farm production
comes from metropolitan counties and adjacent areas.6 These counties
supply 91 percent of domestically sourced fruits, tree nuts, and berries;
77 percent of vegetables and melons; 68 percent of dairy; and 55 percent
of eggs and poultry. Farms in metropolitan counties often supply local
and regional markets, making up 81 percent of food sold directly to
consumers; 76 percent of community-supported-agriculture (CSA) 91%
farms; and 74 percent of farms selling directly to retail outlets.7 Fruits
and vegetables often require unique soils and microclimates, access to fruits, tree nuts
91%
water and labor, an existing infrastructure that has built up over time and berries
(e.g. farm equipment, storage, processing, and packing facilities, etc.),
and markets to support production and sales (Plattner et al. 2014). The
difficulty in moving production of these high-value crops elsewhere has 77%
likely kept producers from expanding production, even though domestic
demand for fruit and vegetables now exceeds supply by 203 percent and vegetables and
164 percent, respectively (White and Hall 2017). melons
Agriculture, food and related industries contribute $992 billion 68%
(5.5 percent) to the U.S. GDP (USDA ERS 2015). Agriculture and
its related industries provide 11 percent of U.S. employment. Many dairy
economic sectors rely on agricultural inputs, including forestry, fishing
and related activities; food, beverages, and tobacco products; textiles,
apparel, and leather products; food and beverage stores; and food service,
eating, and drinking establishments. U.S. agricultural exports support 55%
5 The median cost to provide public services for each dollar of revenue raised is $0.30 poultry and
for business, $0.37 for agriculture, and $1.16 for residential (www.farmlandinfo.org/cost-
eggs
community-services-studies).
6 Analysis by AFT’s Farmland Information Center (FIC) combines information from the 2012
Census of Agriculture with 2013 USDA Economic Research Service (ERS) Urban Influence
Codes (UIC). ERS classifies counties into 12 groups. The FIC uses UICs 1-5 to identify the “most
urban” counties. These 1,652 counties comprise 54 percent of U.S. counties.
7 See AFT’s “Food in the Path of Development” fact sheet: www.farmlandinfo.org/food-path-
development-talking-points.
FA R M S U N D E R T H R E AT: T H E S TAT E O F A M E R I C A’ S FA R M L A N D 3W H AT I S AT R I S K
output, employment, income, and purchasing power in both the farm
AGRICULTURAL LAND PROVIDES and nonfarm sectors, and each dollar of agricultural exports stimulates
BENEFITS BEYOND FOOD another $1.27 in business activity.
Agricultural land also plays a significant role in the nation’s l andscape
and psyche. Along with food, fiber, and energy, Americans highly value
the contributions that agricultural land makes to the environment and
quality of life. Well-managed agricultural land provides open space and
scenic views; biodiversity and wildlife habitat; and critical ecological
open space and scenic views services like fire suppression, floodplain management, and carbon
sequestration (Heimlich and Krupa 1994; Northeast Regional Center
for Rural Development 2003; Hellerstein et al. 2002; Farm Foundation
2004; Swinton et. al. 2007; Duke 2008; Freedgood and Fydenkez
2017). Agricultural land also supports rural lifestyles and recreational
opportunities like hunting, fishing, and horseback riding. Many of the
nation’s agricultural regions are deeply important to U.S. heritage, such
as the glacially borne wild blueberry barrens of Down East Maine; the
biodiversity and wildlife habitat
wild rice region of the upper Great Lakes; New Mexico’s Hatch Valley,
known as the “chili pepper capital of the world”; and Michigan’s Grand
Traverse cherry region, which produces most of the nation’s tart cherries
(Hilchy 2008).
As an added benefit, agricultural land can help stabilize and r educe
future greenhouse gas emissions. Keeping land in agriculture and limiting
low-density residential development can curb one of the largest sources of
fire suppression, floodplain carbon emissions: transportation. Emerging studies show that the average
management, and carbon greenhouse gas (GHG) emissions from urban land uses are orders of mag-
sequestration nitude higher than those from cropland (approximately 66–70 times higher
per unit area) (Culman et al. 2014; Shaffer and Thompson 2015; Arjomand
and Haight 2017). In addition, GHG emissions from lower density, subur-
ban-style developments account for roughly half of the GHG emissions in
the United States (Jones and Kammen 2013). Although a full accounting
of emissions benefits from protecting farmland will take more time, intact
agricultural landscapes provide communities with future opportunities
to further reduce emissions and sequester carbon in agricultural soils
recreation and vegetation (Culman et al. 2014). Farmers and ranchers manage more
than one billion acres of U.S. land, and agricultural practices that sequester
carbon and improve soil health—increasing soil productivity, resiliency, and
versatility—are the next frontier of agricultural innovation.
“ We have been too wasteful too long in this country—indeed, over most of the
world. We had so much good land in the beginning we thought the supply was
limitless and inexhaustible.” —Hugh Hammond Bennett, 1943
4 A M E R I C A N FA R M L A N D T R U S TTracking the Status of Agricultural Land
S
ince the 1930s, the USDA has closely monitored the conditions
and threats to the nation’s natural resources. The Dust Bowl of
the 1930s in the Great Plains dramatically called attention to the
dangers of severe drought and poor land management, leading to the
establishment of the USDA Soil Conservation Service (SCS) in 1935,
now NRCS (USDA 1992). Since its founding, SCS/NRCS has periodically
USDA NRCS ARCHIVES
inventoried the nation’s land and natural resources and, in 1975, released
the Potential Cropland Study to examine the loss of the nation’s best
agricultural land to urban development (Schnepf and Flanagan 2016).
The advent of NRCS’ National Resources Inventory (NRI) in 1977 A Colorado ranch during the Dust Bowl.
made it possible to track the conditions and trends of soil, water, and
related resources. NRCS conducts this statistical survey of natural
resource conditions and trends on nonfederal land in cooperation with
Iowa State University’s Center for Survey Statistics and Methodology.
Among other attributes, the NRI tracks changes in land cover/use,
which provides critical data on how much farmland is converted and
other trends affecting the nation’s strategic land and natural resources
(Schnepf and Flanagan 2016). The precision of NRI statistical estimates
vary with the number of samples involved in a particular inventory
activity. Based on statistical area sampling, as opposed to full areal
coverage, it is most applicable for monitoring state and national levels
of gross land conversion (Lark et al. 2017). The NRI currently releases
state-level estimates to the public and is exploring ways to achieve
statistical reliability for county-level sub-state estimates (Schnepf and
Flanagan 2016). These periodic inventories remain the primary source
of information about changes in land use in the United States. However,
leveraging the NRI by mapping the patterns of land cover/use and
trends over time provides powerful information to inform planning and
decision-making at state, county, and municipal levels. The planners
queried by AFT at the start of Farms Under Threat agreed that having
access to spatial maps was important for planning purposes.
The 1977 NRI data also became the primary data source for the National
Agricultural Lands Study (NALS) undertaken by USDA in 1979 (USDA
and the President’s Environmental Council 1981). When the NALS opted
to use the 1977 NRI data on urban and built-up uses of land, it not only
focused more national attention on the inventory work by SCS, but it also
generated considerable controversy in academic circles over how much
FA R M S U N D E R T H R E AT: T H E S TAT E O F A M E R I C A’ S FA R M L A N D 5T R A C K I N G T H E S TAT U S O F A G R I C U LT U R A L L A N D
Federal Farmland Protection: The Farmland Protection Policy Act (FPPA)
Congress enacted the FPPA as and private efforts to protect Federal agencies are required to
a subtitle of the 1981 Farm Bill farmland. (For the purposes of develop and review their policies
to minimize the impact that the law, federal programs include and procedures to implement
federal programs have on the construction projects—such as the FPPA every two years. NRCS
unnecessary and irreversible highways, airports, dams, and is charged with oversight of the
conversion of farmland to federal buildings—sponsored FPPA (www.farmlandinfo.org/
nonagricultural uses. The FPPA or financed in whole or part by sites/default/files/FPPA_8-06_1.
stipulates that federal programs the federal government, and the pdf).
be compatible with state, local, management of federal land.)
agricultural land was actually being converted to nonagricultural uses.
This controversy led USDA to establish new procedures for identifying
and recording urban and built-up areas that were incorporated into the
1982 NRI and subsequent sampling (Schnepf and Flanagan 2016). The
findings in the NALS, along with a Congressional report that concluded
federal infrastructure grants and mortgage subsidies had led to wasteful
farmland conversion (U.S. Congress 1980), prompted the passage of
the Farmland Protection Policy Act (FPPA) as a subtitle in the 1981
Farm Bill.
In addition to the NRI, USDA monitors other trends that impact the
nation’s agricultural resources. The USDA Economic Research Service’s
(ERS) major land use estimates and related cropland series provide a
comprehensive accounting of all major uses of public and private land
in the United States (www.ers.usda.gov/data-products/major-land-uses).
Every five years, the USDA National Agricultural Statistics Service’s
(NASS) Census of Agriculture does a complete count of U.S. farms and
ranches, providing information about land use and ownership, ownership
characteristics, production practices, income, and expenditures (www.
agcensus.usda.gov). In 2014, ERS and NASS completed the Tenure,
Ownership and Transfer of Agricultural Land (TOTAL) survey, the
first survey since 1999 to focus solely on the ownership and transfer
of agricultural land (Bigelow et al. 2016). TOTAL provided invaluable
information about agricultural land ownership and otherwise unavailable
data on agricultural landlords. All of this critical information helps USDA
evaluate the status of the nation’s soil, water, and related resources on
non-federal land every 10 years as required by the 1977 Soil and Water
Resources Conservation Act (RCA). RCA appraisals assess the capacity
of the nation’s resources to meet present and future demands and play
a key role in shaping conservation strategies, but they are scheduled to
6 A M E R I C A N FA R M L A N D T R U S TT R A C K I N G T H E S TAT U S O F A G R I C U LT U R A L L A N D
terminate on December 31, 2018 (www.nrcs.usda.gov/wps/portal/nrcs/
PAT & CHUCK BLACKLEY/ALAMY STOCK PHOTO
rca/national/technical/nra/rca/ida).
Both NRI and RCA appraisals indicate the United States is developing
its more productive agricultural land at a disproportionate rate. AFT
identified the same trend when it documented the relationship between
highly productive farmland, land development trends, and farmland loss
over 20 years ago (Sorensen et al. 1997). The need to improve the nation’s
understanding of the scale and spatial location of this threat provided the
impetus for AFT’s Farms Under Threat initiative.
The Sneffels Range in Ridgeway, Colorado.
Mapping the quality of agricultural land and tracking its loss is a
critical step to better understanding the impacts of conversion that
has already occurred. However, this is not easy to do because the various
databases and maps available at the national level differ in purpose,
scope, and how various land categories and uses are defined (Nickerson
et al. 2015). The collected data also differs in scale, including their extent
and spatial resolution, as well as in duration, accuracy, update frequency,
and timing. As a result, estimates from different federal agencies do not
agree on how much agricultural land the United States has—let alone
how much the nation is losing.
To meet the need for more accuracy, AFT and CSP applied advanced
geospatial and remote sensing analysis to fill in the data gaps and
create the most comprehensive and most accurate national analysis
ever undertaken of agricultural land and conversion patterns from
urban and low-density residential development. Farms Under
Threat: The State of America’s Farmland adds value to the national
inventory of agricultural land in multiple ways: 1) It includes a new
class of agricultural land that estimates woodlands associated with
farm enterprise; 2) It maps grazing on federal land; 3) It identifies
agricultural land based on its productivity, versatility and resiliency to
support intensive food and crop production (PVR values); 4) It maps
“ Each day, each year—individually and on a national scale—the conversions
of cropland to non-agricultural uses may not have been large in proportion
to the total national landscape. However, collectively and cumulatively,
these land use shifts are seriously reducing the world’s supply of important
farmlands. Moreover, while these continued losses are ‘significant’ or ‘rather
serious’ on a global scale, they may already be critical for individual, local, or
regional areas.” —Norm Berg, 1979
FA R M S U N D E R T H R E AT: T H E S TAT E O F A M E R I C A’ S FA R M L A N D 7T R A C K I N G T H E S TAT U S O F A G R I C U LT U R A L L A N D
and analyzes the extent of low-density residential development on
agricultural land; 5) It shows the spatial patterns of agricultural land
uses and conversion to development in a consistent way over time so that
people can see the patterns of change.
“ Productive land is neither limitless nor
inexhaustible.” —Hugh Hammond Bennett, 1959
Federal Farmland Protection: Agricultural Conservation Easement Program (ACEP)
USDA’s NRCS is a key partner development and keep the protected agricultural land for
for state and local governments, land available for farming. The agriculture, improved agricultural
private land trusts, and recognized funds from selling agricultural viability, encouraged on-farm
tribes working to protect farmland conservation easements allow conservation, and helped farmers
and ranchland from development. farmers to free up capital gain access to land (Esseks and
The agency’s Agricultural without having to sell their land Schilling 2013). Although the
Conservation Easement Program outright and are most often demands for the federal, state,
(ACEP), authorized in the farm used to improve or expand the and local programs remains very
bill, protects agricultural land farm operation (Esseks and high, the limitations in funding at
and conserves wetlands. The Schilling 2013). Since 1996, NRCS all levels constrains each partner’s
Agricultural Land Easements has invested about $1.5 billion ability to protect this critical land.
(ALE) enrollment option in agricultural conservation For more information about the
provides matching funds to easements through ACEP-ALE impact of the federal farmland
buy conservation easements and its forerunners, leveraging protection program, see www.
on farmland and ranchland. state, local, and private funds farmlandinfo.org/impacts-federal-
An agricultural conservation to contribute to the long- farm-and-ranch-lands-protection-
easement is a deed restriction term protection of more than program-assessment-based-
that landowners voluntarily place 1.2 million acres of agricultural interviews-participating-1.
on their property to restrict land nationwide. The program has
8 A M E R I C A N FA R M L A N D T R U S TMethods
C
SP analyzed the location, quantity, type, and quality of the agricultural
PAT & CHUCK BLACKLEY/ALAMY STOCK PHOTO
land converted to development in the continental United States to a
30-meter resolution with mapping units of about five to 10 acres. To
achieve this level of precision and inform future forecasting, CSP focused
on the 20-year time period8 between 1992 and 2012 when there were
sufficient databases with the national coverage necessary to complete
the more detailed spatial mapping. The most recent releases of databases
with the coverage needed for a national assessment are 2011 and 2012.
To show the extent of land in agricultural uses, the analysis identifies
and maps woodland, a new class of agricultural land, and also maps Dickie Brothers Orchard in Roseland, Virginia.
grazing on federal land. To provide greater clarity on the extent of
agricultural land conversion, it improves on previous efforts to spatially
map low-density residential development, which extends beyond the
suburbs into rural parts of counties. The conversion of working land to
very large lot developments not only diminishes the agricultural land
base, it also threatens the vitality of rural economies. Finally, to more
fully understand the quality of the agricultural land being converted,
it identifies and spatially maps agricultural land based on values that
denote their productivity, versatility, and resiliency (PVR) for cultivation.
This complex approach significantly advances the understanding of
farmland conversion.
Developing the base map.
CSP started the assessment with the 2011 U.S. Geological Survey (USGS)
National Land Cover Dataset (NLCD)—a 30-meter-resolution national
database that provides spatial reference and descriptive data of land
surface characteristics. It adds in critical data from the NRI and Soil
Survey Geographic Database SSURGO datasets (soil suitability and
capability classes), the NASS Cropland Data Layer (CDL) and Census
of Agriculture data (median farm size), the USGS NLCD accuracy
assessments, National Elevation Dataset (at 10 m) and Protected Areas
Dataset (PAD-US), and housing data from the U.S. Census Bureau
at census block level. It directly incorporates NRI data to generate a
8 CSP initially applied this approach to map conversion over a 30-year period based on
1982 data from the NRI. However, because many of the datasets used to model land cover/
use represented conditions in the early 1990s, the results were too inconsistent and had too
much variability.
FA R M S U N D E R T H R E AT: T H E S TAT E O F A M E R I C A’ S FA R M L A N D 9METHODS
suitability model that produces maps of land cover/use at 1992 and 2012
and then applies additional geospatial analyses to quantify change.
PHILIP SCALIA/ALAMY STOCK PHOTO
Farms Under Threat adds a new class of agricultural land: woodland
associated with farms. This is a subset of forestland that CSP mapped
by approximating the area of woodland reported by operators in
the 2012 Census of Agriculture. To show the total extent of land in
agricultural uses, it includes federal land that is grazed based on grazing
permits issued by the U.S. Forest Service and the U.S. Bureau of Land
Management in 2014 and 2015, respectively. It also identifies low-density
Farmland in the Mohawk Valley, New York. residential development as another land cover/use class. 9 Depending
on location, once this intensity of residential development occurs on
agricultural land, the analysis assumes it is no longer primarily used for
agricultural purposes.
The assessment focuses on the continental United States (the contiguous
48 states) because of data availability and spatial data processing
efficiencies. A number of datasets used in the analyses were either not
available or had limited (less than 25 percent) spatial coverage in Alaska
and/or Hawaii. For Alaska, the NRCS NRI and SSURGO soils databases
were very limited; for both Alaska and Hawaii, data are not available for
the CDL or grazing allotments, and the earliest availability of the NLCD
is 2001 (not 1992).
Mapping and assessing irreversible losses due to both
rbanization and low-density residential development.
u
Previous work by the technical mapping team, access to unique national
data, and a geospatial model enabled CSP to map urbanization and the
low-density residential development that extends beyond the suburbs.
CSP started with the NLCD urban land cover/use class. The satellite
imagery used to create the NLCD dataset detects the high-density
urbanized or built-up areas but misses urban development hidden
under forested canopies, as well as low-density residential areas. This
shortcoming became apparent when CSP compared the detailed land use
observations from the NRI to the NLCD 2011. Roughly 30 percent of the
area represented by the NRI as urbanized did not fall on urban/built-up
classes in the NLCD.
The next step was to figure out how to spatially map low-density
residential development, especially large-lot development occurring
in exurban areas. AFT interviewed farmland protection practitioners,
county planners, and other key stakeholders at the start of the Farms
9 Farms Under Threat uses the NLCD definition for urbanization: areas occupied by urban
development or “built-up” areas of commercial, industrial, transportation, and high-density
residential (NLDC categories 21–24). Low-density residential includes residential areas with
more than one housing unit per one to two acres up to homes on 10–20 acres as well as exurban
homes on even larger lots that effectively remove these properties’ agricultural uses.
10 A M E R I C A N FA R M L A N D T R U S TMETHODS
Under Threat initiative. In some parts of the country, these stakeholders
identified exurban development as the principal threat, and they urged
AFT to investigate the lower-density residential development missed by
BLEND IMAGES/ALAMY STOCK PHOTO
the NRI.
The NRI urban classification captures residential land areas with more
than one housing unit per one to two acres up to homes on 10–20 acres.
This resulted in another gap between what the NLCD captures and the
NRI samples. To bridge the gap between NLCD and NRI, CSP sought
to map both the NRI residential land areas and the nonagricultural
development on larger lots. A crop farmer in Oyster, Virginia.
To do this, CSP created an additional land cover/use category of low-
density residential. The low-density residential model filled in the NRI
urban projections up to one house per 10–20 acres. It also captured
exurban homes on even larger lots that effectively removed even more
land from agricultural uses. To identify these larger lot residences,
AFT asked NASS to generate the quartiles of farm size from the 2012
Census of Agriculture for each county. The size of a viable farm or ranch
varies considerably from region to region and from county to county. To
distinguish between a viable agricultural operation and a rural estate
(also called a “farmette” or “ranchette”), CSP identified the low-end tail
(approximately the 10th percentile) of the entire distribution of farm
sizes in each county by using 50 percent of the lowest (25 percent)
quartile. Based on feedback from scientists involved with the NRI, CDL,
Limitations of the Data from Farms Under Threat: State of America’s Farmland
The Farms Under Threat: State of unit should be aggregated to the challenging, and so we suggest
America’s Farmland datasets are sub-county level (approximately that appropriate scales for
produced at a resolution of 30 10,000 acres or greater), the calculating change or trends with
meters (about 1/4 acre), though equivalent of a Hydrologic Unit data from Farms Under Threat:
the minimum mapping unit is Code 12 or HUC12 level. CSP and State of America’s Farmland
five to 10 acres, which is useful to AFT recognize that there may should be done at county, state,
inform and support sub-county be some utility for using these and national scales. Fine-scale
decisions regarding mapped data at relatively fine-scales, but analysis should proceed under
patterns at extents of roughly caution that the interpretation of advisement of the data developers
1,000 acres or greater. Calculating the results be used appropriately (CSP) on a case-by-case basis. As
summaries of the data at scales and considered in a probabilistic with any map, there is some level
finer than this generally is not perspective, particularly when of uncertainty associated with the
recommended. To characterize using the data for site-scale data, and the statistical uncertainty
broader-scale patterns and trends, planning exercises. Calculating associated with our findings has
the minimum analytical (decision) landscape change is particularly been fully documented.
FA R M S U N D E R T H R E AT: T H E S TAT E O F A M E R I C A’ S FA R M L A N D 11METHODS
and NLCD, this best represents the point below which land previously
identified as agricultural land is likely too small or fragmented to support
an agricultural operation. These farm-size thresholds (calculated as
roughly the 10th percentile of farm size in the county) vary widely from
county to county and state to state and ranged in size from two acres (e.g.
in parts of the Northeast) to 186 acres (e.g. in parts of Great Plains, etc.).
LANCE CHEUNG/USDA
This land was then re-classified as most likely low-density residential.
Then CSP harmonized this data with the housing density data from the
U.S. Census and used housing density to help distinguish large lot, low-
density residential from agricultural uses.
Fields of squash in Virginia.
Assigning values to agricultural land based on their productivity,
versatility, and resilience for long-term cultivation.
Farmers and ranchers make decisions about how to use their land based
on soil type, water resources, climate, adjoining land uses, proximity
to markets and transportation, access to farm equipment, and other
factors (Olson and Lyson 1999). However, the long-term sustainability of
keeping the land in cultivation or in other agricultural uses depends on
the productivity,10 versatility11 and resiliency12 (PVR values) of the land
base. The research team looked for factors that offered reliable national
coverage and could act as proxies to rank agricultural land nationally
based on these key factors and chose soil suitability, land cover/land
use, and food production to assess the land’s potential to support long-
term cultivation.
10 Productivity is output per unit of input (often measured as crop yield per acre). The
highest productivity occurs in coastal areas where climate, soil, location, and irrigated conditions
favor the production of perishable crops (fruits and vegetables) or where integrated livestock
operations draw from an extended cropping area. Unfortunately, productivity can often mask
environmental or heath components of soil quality (Widbe and Gollehon 2006). The PVR
analysis considers soils, their limitations, climate, type of production, and whether the land can
produce commonly cultivated crops and pasture plants without deterioration over a long period
of time.
11 Versatility is the ability of land to support production and management of a wide range of
crops. It is mainly assessed in terms of soil and land physical characteristics (Bloomer 2011).
12 Resiliency (the land’s ability to maintain its potential to provide ecosystem services)
depends on the same factors that determine potential productivity (topography, relatively static
soil properties and climate (UNEP 2016).
12 A M E R I C A N FA R M L A N D T R U S TMETHODS
“ Each acre not retained for use in agriculture, and each acre exceeding the
tolerance value in erosion loss, removes flexibility for future decisions and
reduces the nation’s options for directing our own destiny.” —Norm Berg, 1981
National Factors Used in the Productivity, Versatility and Resiliency
(PVR) Analysis
Soil suitability uses important AFT reclassified Michigan locally Food production was included
farmland designations, which important soils in counties in recognition of the fact that
interpret soil survey information adjacent to Lake Michigan as a primary goal of agriculture
to indicate relative suitability unique (since these areas support is to feed people. This factor is
and productivity of soils. fruit trees or vineyards) and especially important as a proxy
Important farmland designations reclassified the locally important for characteristics that support
are an attribute in the NRCS soils in remaining counties as production of specialty crops
SSURGO database. This factor statewide important. For Ohio, we that may require unique soils and
gets at the capacity of soils to reclassified locally important soils microclimates. Using data from
support agricultural production as statewide important. the USDA NASS Cropland Data
(productivity) and provides Layer, we grouped 132 Individual
clues to the land’s versatility and Broad land cover/use shows cropland types into five main
resiliency to withstand weather where different major types of groups: 1. fruit and nut trees;
extremes. We consulted with agriculture are conducted. Land 2. fruits and vegetables grown as
state soil scientists and included cover is the vegetation or other row crops; 3. staple food crops
the following important farmland kind of material that covers the (e.g. wheat, rice, barley, oats, dry
designations: prime farmland, land surface. Land use is the beans, potatoes); 4. feed grains,
prime farmland with limitations, purpose of human activity on the forages, and crops grown for
unique farmland, farmland of land; it is usually, but not always, livestock feed and processed
statewide importance, and related to land cover. Continuous foods (corn and soybean; hay
farmland of statewide importance production indicates there are and alfalfa; oilseeds and sugar
with limitations. We reclassified relatively fewer limitations and beets and sugarcane); and 5.
locally important soils in all environmental consequences. non-food crops (i.e. crops used
states except Michigan and Ohio It indicates resiliency over time. for energy production excluding
as not prime, because states We mapped land cover/use corn, fiber, tobacco, and nursery/
inconsistently define their locally by combining data from the greenhouse).
important soils and most states NRI, the USGS National Land
identify fewer than 1,000 acres Cover Dataset for 2011, and the
as locally important. Working SSURGO database.
with the NRCS state soil scientist,
FA R M S U N D E R T H R E AT: T H E S TAT E O F A M E R I C A’ S FA R M L A N D 13METHODS
Farms Under Threat then used a structured, replicable process to elicit
feedback from 33 national experts to decide the importance of each
factor in determining the land’s potential. The experts assigned the
PHOTOGRAPHY/ALAMY STOCK PHOTO
strongest weight to soil suitability (given the value of 1.0), followed by
food production (= 0.522), and land cover/land use (= 0.398). For soil
suitability, the experts ranked the soil types in the following order: prime,
unique, prime with limitations,13 state important, and state important
DANIEL DEMPSTER
with limitations. For land cover/use, types, the ranked order was
cropland, pastureland, rangeland, and woodland. For food production,
the ranked order was fruit and vegetables, fruit and nut trees, staple
food crops, feed grains, and forages and non-food crops. Because fruits,
Pumpkin plants in Starlight, Indiana.
nuts, and vegetables occupy only a small percentage of total cropland
acres and often depend on unique microclimates that limit their range,
their ultimate weighting within the analysis was higher to reflect their
disproportionate value.
Factoring in critical limitations to production and versatility.
To strengthen the soil suitability analysis, the analysis included a
secondary factor based on production limitations documented within
NRCS Land Capability Classes (LCC) (USDA SCS 1961). USDA
developed this classification to group soils primarily on the basis of
their capability to produce commonly cultivated crops and pasture
plants without deteriorating over a long period. The LCC considers
management hazards (e.g. erosion and runoff, excess water, root zone
limitations, and climatic limitations). It also helps identify production
versatility, identifying whether soils can be used for cultivated crops,
pasture, range, woodland, and/or wildlife food and cover. The LCC
identifies eight categories with increasing limitations. Land in Classes
I through IV is suited to cultivation, although Classes II through
IV have increasing limitations that reduce the choice of plants and
require the use of progressively more conservation practices. Classes
V through VIII are not suited to cultivation, and their use is limited
largely to pastureland, rangeland, woodland, or wildlife food and cover.
To improve the food production factor, the analysis also incorporated
information about growing season length that limits production in parts
of the country but allows almost year-around production in some of
the southern states and in some coastal regions. After completing these
refinements, CSP assigned each agricultural land mapping unit (5–
10 acres) a combined PVR value based on the PVR factors and weighting
(see Figure 4).
13 Farms Under Threat uses the NRI definitions for the various soil types. In this case,
limitations denote the conditions that must be addressed before the soil qualifies as prime (e.g.
prime if irrigated, prime if drained, prime if drained and either protected from flooding or not
frequently flooded, etc.) or statewide important.
14 A M E R I C A N FA R M L A N D T R U S TMETHODS
Identifying the best land for intensive food and
crop production.
After assigning combined PVR values, CSP then applied a scenario model
to identify the best land for intensive food and crop production (includes
the production of fruits, vegetables, staple foods, grains, and animal
feed). The scenario model included soils that are prime, unique, or prime
JESS MERRILL/ALAMY
with limitations; cropland and pasture; and the relevant cropland types.
The land with values at or above the resulting PVR threshold value
has the highest potential for food and crop production with the fewest
limitations and environmental impacts. This subset of agricultural land
is the best land for intensive food and crop production in terms of its Cherry Bomb peppers growing in northern
ability to support cultivation. Illinois.
Checking the PVR continuum against other
classification schemes.
To help put the PVR value continuum into context with other
classification schemes, CSP examined the PVR values generated for the
NRI points. For the NRI points designated as prime, the mean PVR value
was 0.45. For Land Capability Class designations, the mean PVR value
for LCC Class I points was 0.53, Class II was 0.49, Class III was 0.40,
Classes IV and V were 0.29, Class 6 was 0.20 and Classes VII and VIII
were 0.15. Farms Under Threat: State of America’s Farmland identifies
land with a PVR value above 0.43 as best suited for intensive food and
crop production. In other words, the threshold the scenario model uses
to identify the best land for intensive food and crop production picked up
all the prime farmland identified by the NRI points, all the agricultural
land in LCC Classes I and II, and some of the agricultural land in LCC
Class III.
FA R M S U N D E R T H R E AT: T H E S TAT E O F A M E R I C A’ S FA R M L A N D 15You can also read