Environmental Management Framework for Ekurhuleni June 2007
←
→
Page content transcription
If your browser does not render page correctly, please read the page content below
Environmental Management Framework for Ekurhuleni

                         June 2007

   Produced by :                     Produced for:
   Environomics
   Environomics                      Ekurhuleni Metropolitan
   In association with               Municipality,
   MetroGIS                          and
   Mawatsan                          Gauteng Department of
   ABEMS                             Agriculture
   Deon van Zyl                      Conservation and
   Kweyama Consulting                Environment
   Index

                                                               1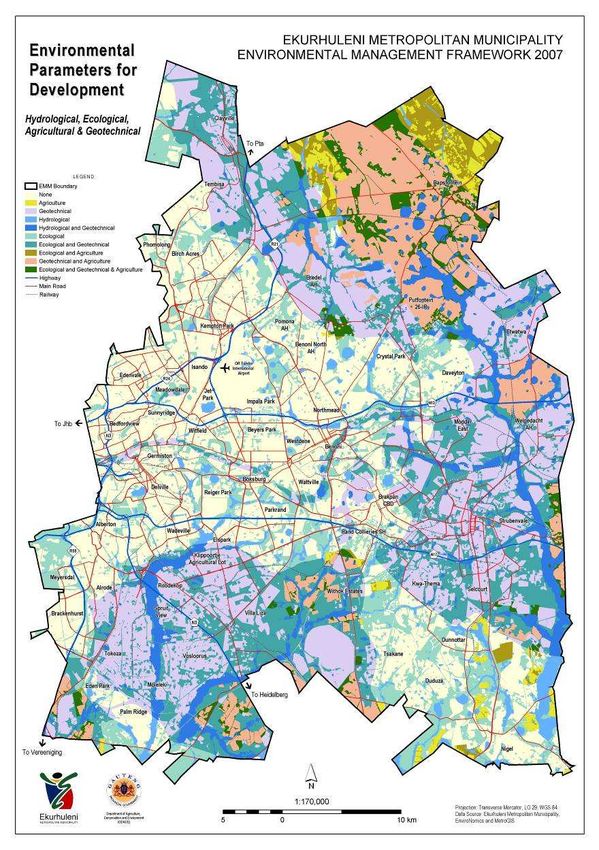
TABLE OF CONTENTS

1.    THE REGIONAL CONTEXT.............................................................................................................................................. 5

2.    GEOLOGY......................................................................................................................................................................... 6

3.    TOPOGRAPHY ................................................................................................................................................................. 6

4.    HYDROLOGY.................................................................................................................................................................. 10

5.    WATER QUALITY........................................................................................................................................................... 12

6.    CLIMATE......................................................................................................................................................................... 12

7.    AGRICULTURAL POTENTIAL ....................................................................................................................................... 12

8.    BIOLOGICAL ENVIRONMENT ....................................................................................................................................... 14

9.    THE GAUTENG CONSERVATION PLAN ...................................................................................................................... 14

10.      CONSERVATION ASSESSMENT............................................................................................................................... 15

11.      BLESBOK SPRUIT RAMSAR SITE ............................................................................................................................ 15

12.      USE OF LAND AND TRANSPORTATION.................................................................................................................. 19

13.      WASTE MANAGEMENT ............................................................................................................................................. 22

14.      POLLUTION ................................................................................................................................................................ 23

15.      CULTURAL AND HISTORIC FEATURES................................................................................................................... 25

16.      POPULATION CHARACTERISTICS........................................................................................................................... 25

17.      ECONOMIC CHARACTERISTICS .............................................................................................................................. 26

18.      ECONOMIC DRIVERS................................................................................................................................................. 26

19.      LAND USE PLANNING POLICIES.............................................................................................................................. 27

20.      PUBLIC PERCEPTIONS ............................................................................................................................................. 27

21.      INTRODUCTION TO THE SEMP................................................................................................................................. 28

22.      DEVELOPMENT CONSTRAINT ZONES .................................................................................................................... 28

23.      AREAS IDENTIFIED IN TERMS OF NEMA ................................................................................................................ 31

24.      INTRODUCTION TO STRATEGY ............................................................................................................................... 34

25.      KEY ASPECTS THAT MUST BE INCORPORATED INTO THE STRATEGY ............................................................ 34

26.      FORMULATING AN ENVIRONMENTAL STRATEGY ................................................................................................ 35

27.      ENVIRONMENTAL STRATEGY.................................................................................................................................. 36

BIBLIOGRAPHY .................................................................................................................................................................... 39

                                                                                                                                                                                      2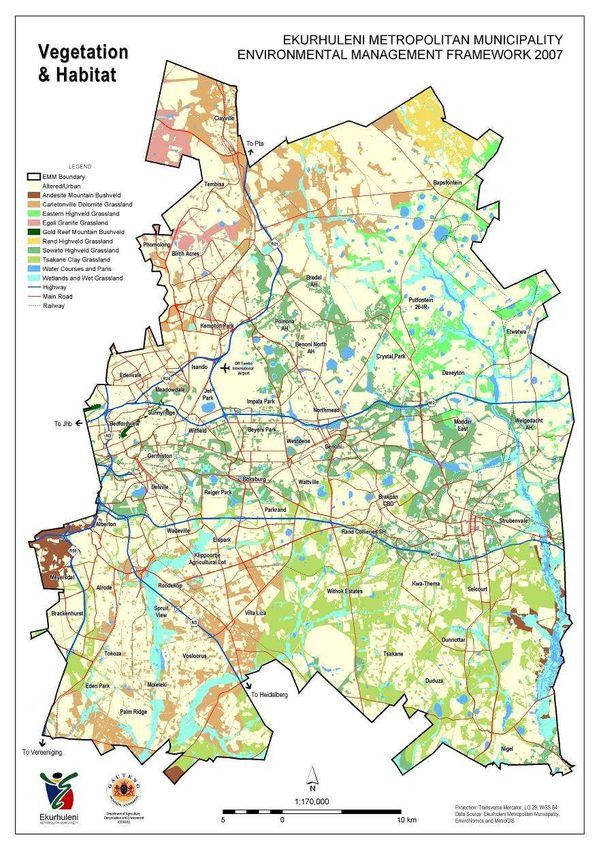
List of Maps
Map 1: Gauteng Context Map                                                                                 5

Map 2: Ekurhuleni Context Map                                                                              5

Map 3: Geology                                                                                             7

Map 4: Dolomite and Undermined Areas                                                                       8

Map 5: Topography                                                                                          9

Map 6: Surface Hydrology and Relief                                                                        11

Map 7: High Potential Agricultural Land                                                                    13

Map 8: Vegetation and Habitat                                                                              16

Map 8b: C-Plan 2 Important and Irreplaceable Sites                                                         17

Map 9: Blekbokspruit Catchment and Ramsar Site                                                             18

Map 10: Current Use of Land                                                                                20

Map 11: Transportation Infrastructure             `                                                        21

Map 12: Potential Pollution Sources                                                                        24

Map 13: Environmental Parameters for Development (Hydrological, Ecological, Agricultural & Geotechnical)   29

Map 14: Environmental (Potential Air, Noise & Water Pollution)                                             30

Map 15: Geographical Areas                                                                                 33

List of tables
Table 1: Extracts from the National Biodiversity Assessment 2004                                           15

Table 2: Vegetation type assessment in Ekurhuleni                                                          15

Table 3: Conservation opportunity analysis                                                                 15

Table 4: Use of land in Ekurhuleni                                                                         19

Table 5: Area/activity matrix for additional specified activities in identified geographical areas         31

Table 6: Area/Activity matrix for the exclusion of certain activities from assessment                      32

                                                                                                                3
region of the EMM. These frameworks were compiled by
PREFACE                                                                         the project team and will aid decision-making processes in
                                                                                respect of present land-use, as well as decisions on new
The Environmental Impact Regulations (Regulations in
                                                                                development activities in the area.
terms of Chapter 5 of the National Environmental
Management Act, 1998 (Act 107 of 1998), were published                          The clients
on 21 April 2006 in Government Gazettes R385, R386 and
R387. These regulations came into effect on 3 July 2006                         The EMM and GDACE are the clients for this project.
and make provision for environmental management
frameworks as regulatory instruments.                                           The EMM was created in the year 2000, when eleven local
                                                                                authorities merged as part of the municipal rationalisation
EMFs assist MECs responsible for the environment and                            and transformation process.
other government decision-makers to make informed
decisions on environmental matters.                                             Keeping the background of national and provincial
                                                                                legislation in mind, almost all use of land in South Africa is
This document is the combination of two studies that were                       under the control of local government. This includes
integrated in order to form a single EMF and represents                         planning and allocation of land. In Gauteng, it is mainly
the combination of two reports namely:                                          controlled in terms of the Town Planning and Townships
   The Environmental Management Framework of the                               Ordinance, 1986 (Ordinance 15 of 1986), various town
    Northern Service Delivery Region of the Ekurhuleni                          planning schemes, surface rights in terms of mining
    Metropolitan Municipality, December 20051; and                              legislation and Annexure F of the Township Establishment
   the Status Quo Report of the Environmental                                  and Land Use Regulations, 1986 issued under the Black
    Management Framework of the Eastern and Southern                            Communities Development Act, 1984 (Act 4 of 1984).The
    Service Delivery Regions of the Ekurhuleni                                  conditions of town establishment and title conditions of
    Metropolitan Municipality, January 20062.                                   properties may also influence land use.
In combining the two studies, much of the information                           The GDACE draws its mandate mainly from national and
contained in the first study has been updated or been                           provincial legislation. A long list of agricultural and
replaced. This document does not attempt to duplicate the                       environmental legislation exists in terms of which the
previous studies. Its purpose is to give a brief summary of                     Gauteng Provincial Government has accepted a five-year
the background information contained in the previous                            programme for 2004-2009. The programme focuses, inter
studies, reflect the updated sections and to provide a                          alia, on the alleviation of poverty and job creation,
combined Strategic Environmental Plan section that                              reduction of inequalities, healthy communities and caring,
covers the whole area.        In addition the EMF also                          responsive and responsible governance.
incorporated the following recent changes:
   The Gauteng policy on the Protection of High Potential                      The project team
    Agricultural land, 2006;
                                                                                The following member organisations were part of the team:
   the Environmental Impact Assessment Regulations,
    2006; and                                                                      Environomics;
   the implementation of sections 24(2)(b) and (c) on the                         MetroGIS;
    National Environmental Management Act,1998(Act 107                             Abongi    Bemvelo     Environmental   Management
    of 1998) as amended.                                                            Consultants;
The delays that were necessarily to accommodate the                                Mawatsan;
                                                                                   Deon van Zyl Property Development Consultants;
above were inevitable but have provided the opportunity to
deliver a product that is current and relevant for the whole                       Kweyama Consulting; and
                                                                                   Index.
of Ekurhuleni.
                                                                                The project was managed by a steering committee with
Terms of reference                                                              members from the EMM, the GDACE and the project team.
                                                                                The steering committee was chaired by the EMM.
Government agencies in the Republic of South Africa are
committed to sound and sustainable development. In                              The Environmental Management              Framework      and
terms of Chapter 2 (the Bill of Rights) of the Constitution of                  Spatial Development Frameworks
the Republic of South Africa 1996, (Act 108 of 1996),
everyone has the right to a healthy and pollution-free                          The EMF provides a framework that sets out the
environment. Furthermore, the Bill of Rights specifies that                     environmental attributes of Ekurhuleni in a way that
pollution and environmental degradation should be                               determines environmental opportunities and constraints for
prevented through sustainable environmental conservation,                       development of the area while Spatial Development
ecologically sustainable development and wise use of                            Frameworks (SDFs) provides frameworks for interpreting
natural resources. Protection of the environment must thus                      the development vision, planning principles and structuring
be in balance with the socio-economic well-being of the                         elements of Ekurhuleni.
inhabitants of an area. The Ekurhuleni Metropolitan
                                                                                The EMF, in terms of the Environmental Impact
Municipality (EMM) and the Gauteng Department of                                Assessment Regulations, 2006, must be taken into
Agriculture and Environment (GDACE) have therefore
                                                                                account in the consideration of applications for
embarked on a programme to establish environmental                              environmental authorisation.
management frameworks for the entire service delivery
1
                                                                                The SDFs that are developed for Ekurhuleni, at its different
  The report deals with the Northern Service Delivery Region and includes the
OR Tambo International Airport, Kempton Park, Clayville, Tembisa,
                                                                                scales, should also take the EMF into account and
Bapsfontein, Bredell, Bedfordview, Putfontein, Daveyton, Pomona                 incorporate its information as appropriate. In instances
Agricultural Holdings, Benoni, Rynfield, parts of Boksburg (Jetpark),           where especially Local SDFs generate more detailed
Edenvale, Isando, Sunnyridge and Bedfordview. Sections of three major           information than what is currently contained in the EMF,
freeways – ie the R21, R24 and N12 – traverse the area.                         such information should be made available for inclusion in
2
  The report deals with the Eastern and Southern Service Delivery Area and
encompasses Germiston, Boksburg, Brakpan and Strubenvale in the north to
                                                                                periodic updates of the EMF.
Eden Park, Palm Ridge, Vosloorus, Duduza and Nigel in the south. The N3,
N12, R24 and R23 form axes through this area and link industrial and
commercial nodes.

                                                                                                                                            4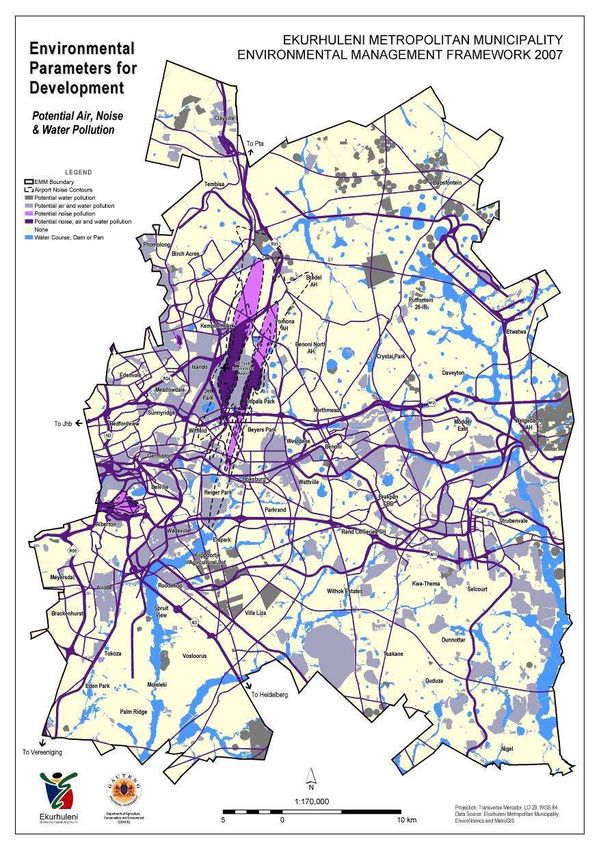
SECTION A: Background Information

1.        The regional context                                     Map 1
In 2006 GDACE produced a map, as depicted in Map 1,
that indicates the extent of urban development together
with conservation areas, sensitive areas and areas with
high agricultural potential. In addition to its other functions,
the map gives a good indication of the spatial
characteristics of the Gauteng as a whole. The light yellow
areas (indicated as “NEUTRAL” in the legend) are of
particular significance as these areas are the most likely
areas for further urban expansion from an environmental
perspective as it is still vacant land and also, at a
provincial scale, have relatively few environmental
constraints.

Due to its relatively central location also means that it will
continue to have a high demand for development.
Compared to the rest of Gauteng, Ekurhuleni has very little
“spare capacity” to accommodate additional development
in areas that have little to no constraints. Ekurhuleni
therefore faces a significant challenge to densify and
redevelop existing built up areas as well as old mining and
other land that is no longer used optimally.

 Map 2

                                                                           5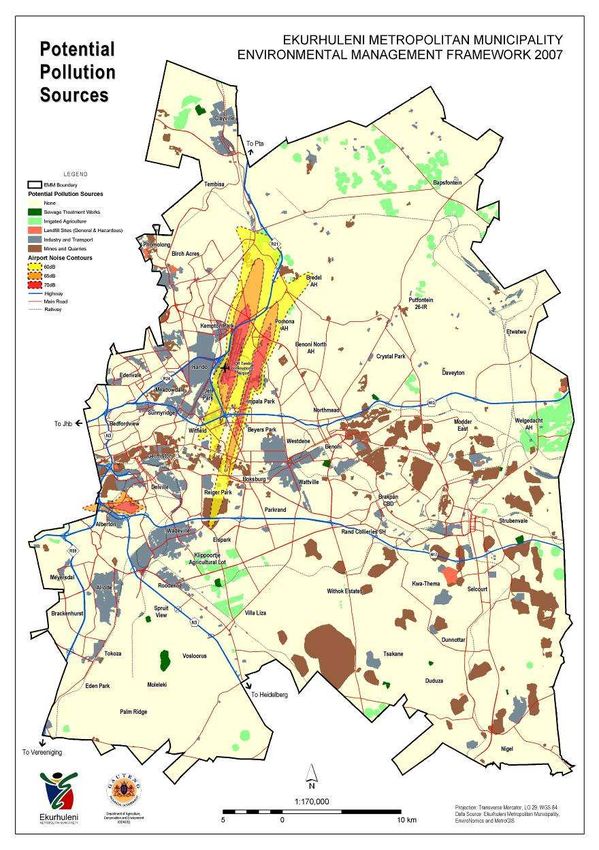
The study focused on a localized area of approximately 2
                                                                km² around the intersection of the R25 and R50. However,
2.          Geology                                             the findings are also applicable to the wider area stretching
                                                                from Rietvlei Dam in the north in a south-easterly direction
Five main geological formations dominate the study area.        through the study area. This area has similar geological
                                                                and land-use conditions in the band of dolomite overlain by
In the north-west at Tembisa and to the west of Clayville,      an intermittent layer of Karoo rocks such as sandstone and
areas of granite-gneiss are found.                              shale of a much younger age. A number of sinkholes and
                                                                dolines are visible in the area. The area at Bapsfontein is
Dolomite dominates the northern area between Clayville in
                                                                characterised by densely populated agricultural holdings
the west and Bapsfontein in the east and all along the
                                                                each with its own infrastructure, an informal settlement, the
eastern boundary of the study area towards Putfontein,
                                                                Bapsfontein Hotel and chicken and mushroom farms. The
Strubenvale as far south as Kwa-Thema and Dunnotar.
                                                                study confirmed that the large-scale pumping for irrigation
Another extensive area of dolomite is found in the south-       purposes from the aquifer is a probable primary cause of
west of Ekurhuleni in the Katorus area.                         sinkhole formation. Intensive maize and vegetable crop
                                                                farming is being practiced in the immediate area and as far
Quartsite dominates the north-south central area from the       afield as Delmas, with many centre-pivot irrigation
west of Clayville in the north through Kaalfontein, to the      installations.
east of OR Tambo Airport and in a broad band from west
to east from Germiston to Springs. It also occurs north of
Bapsfontein. Surface shale is found in the west, south of
Bapsfontein and in the east, south of OR Tambo
International Airport towards Germiston.

Amphibolite occur in the area around Edenvale east of
Kempton Park and OR Tambo International Airport. A
small area of surface dolorite occurs in the extreme south
between Duduza and Vosloorus.

The geology of the area is indicated on Map 3.

The geological stability of an area should be one of the key
considerations when planning development. The possibility
of sink holes or earth tremors should be taken into account
when considering medium to long-term development                The extent of the sinkhole at Bapsfontein
projects. Dolomitic areas that may be problematic as well
as shallowly undermined areas are indicated on Map 4.           The process of sinkhole formation is closely linked to the
The potential negative effects that this may hold for           lowering of the water table in the substrata. The stability is
development should in all cases be assessed before              then dependent on the rate of abstraction, continued
development is allowed in these areas.                          infiltration of water from the surface, the size of the cavity
                                                                and the thickness of cover over the cavity. Recent
Earth tremors are quite common in the central area of the       sinkholes of up to 30 m in diameter have appeared at
study area where deep gold mining takes place and               Bapsfontein. The water table in the aquifer has shown a
extensive areas have been undermined. Such tremors              marked decrease in recent years. The recently developed
sometimes result in the cracks appearing in buildings,          sinkhole is a cause for concern due to its proximity to a
roads and other structures and this should be considered        densely populated informal housing settlement, as well as
in the planning of new developments.                            subsidence of the R25 that presents a traffic safety
                                                                hazard. Further studies should be undertaken in the wider
Sink holes are not uncommon in the dolomitic areas of           dolomitic area and strict controls in terms of land use and
Gauteng, especially in areas where substantial extraction       infrastructure development should be placed on any
of underground water takes place.                               applications for further development.

                                                                Several dolomite studies have also been completed for the
                                                                Katorus area. These were further supported by an
                                                                awareness sustainability proposal. While de-watering is
                                                                the major cause of sinkhole formation in the northern part
                                                                of Ekurhuleni, the leaking wet municipal services is the
                                                                main cause of sinkhole formation in the Katorus area.

                                                                3.          Topography
                                                                The study area forms part of the major watershed between
                                                                the rivers that drain west towards the Atlantic Ocean and
                                                                those that drain east towards the Indian Ocean. The area
                                                                can generally be regarded as flat with few outstanding
A typical sinkhole
                                                                topographical features. The following topographical
                                                                features occur:
Sinkhole study for Bapsfontein                                    Plains with pans
                                                                  Undulating plains with pans
EMM appointed Jones and Wagener to investigate the                Strongly undulating plains
stability of the area near the Bapsfontein Hotel in view of a     Superimposed river valley (Blesbok Spruit) on plains
sinkhole that attracted media attention and is a concern to        with pans
the local population and the authorities. Jones and              Ridges
Wagener completed the first phase of their study and the        The topography is depicted on Map 5.
following summary is taken from sections of their report
numbered JW21/04/9401 and dated 16 February 2004.
                                                                                                                            6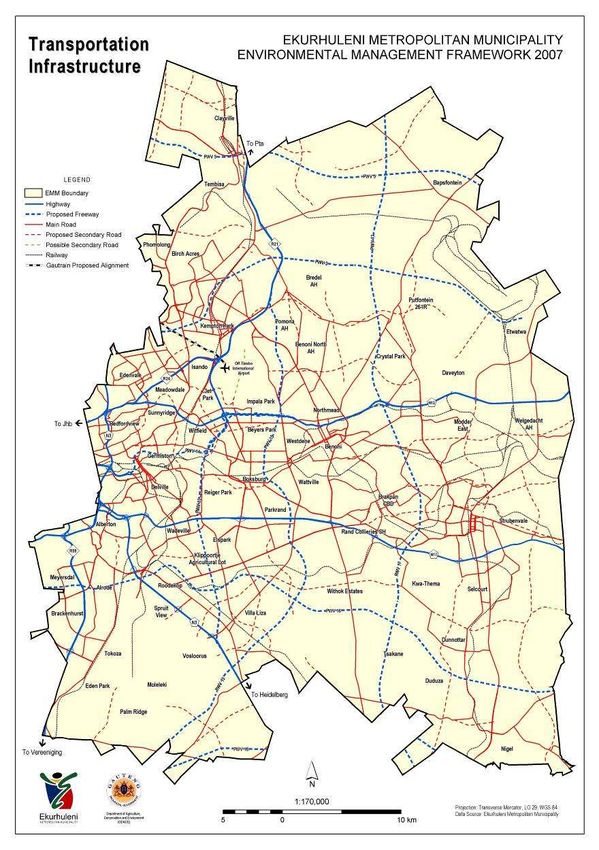
Map3

       7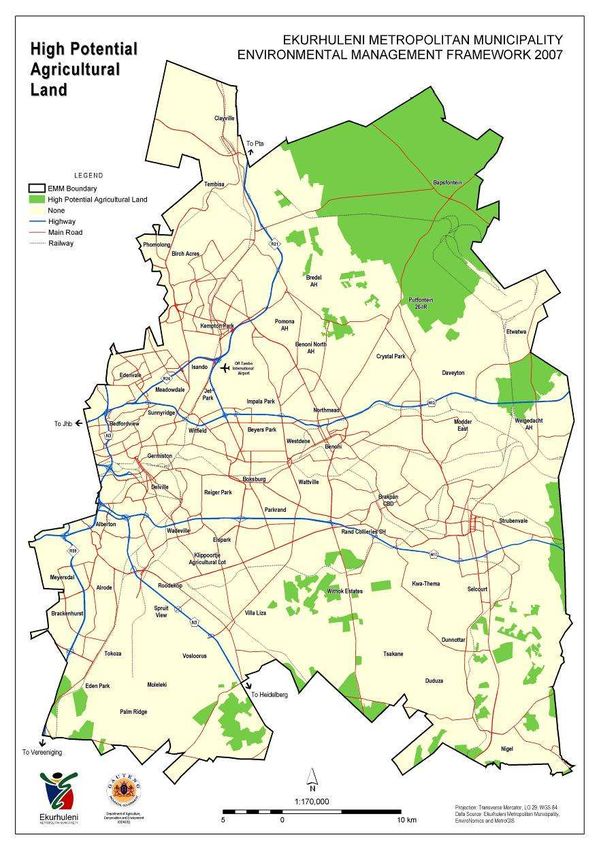
Map 4

        8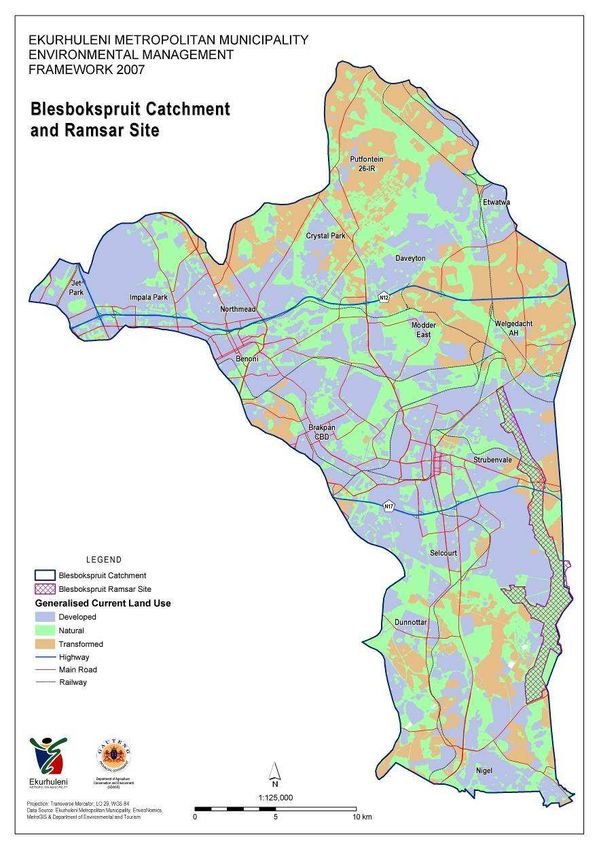
Map 5

        9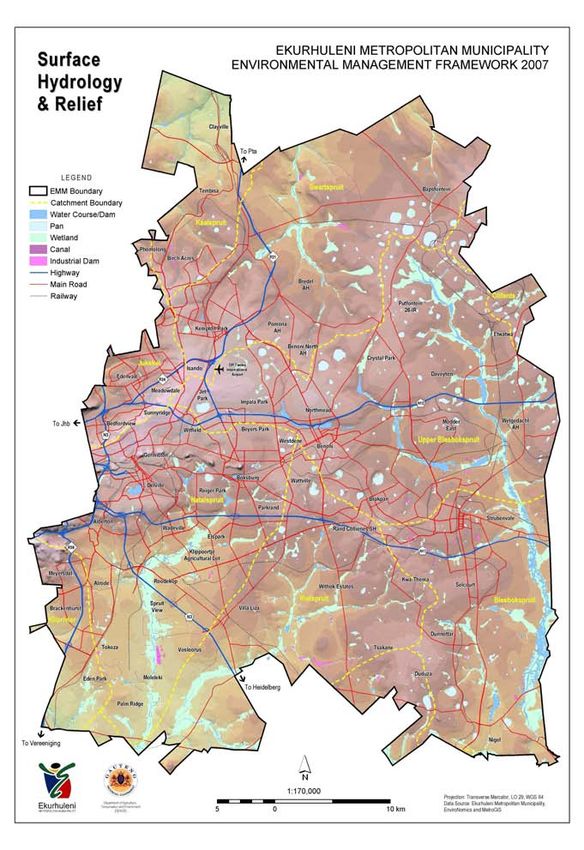
the Ramsar Convention. The catchment also include the
4.            Hydrology                                                        Marievale Nature Reserve. The eastern part of the
                                                                               catchment contains extensive natural wetlands, while the
The study area is dominated by dolomite of the                                 western part is highly modified by agriculture and human
Chuniespoort Group and tillites of the Dwyka group, both                       settlement. Key industries, such as mines (mine dumps
of which carry water. The presence of various geological                       and slimes dams), waste disposal sites, intensive
structures, such as faults, fissures, and fracture zones, as                   agriculture and sewage works impact negatively on water
well as contact zones of intrusions such as dykes and sills,                   quality.
dictate the occurrence of groundwater.
                                                                                Klip River and its tributaries
                                                                               Riet Spruit originates south-west of Benoni and joins the
                                                                               Klip River outside the study area. Another tributary of the
                                                                               Klip River, Natal Spruit, rises in and around Germiston and
                                                                               Boksburg. The upper reaches of the Klip River proper
                                                                               originate in Katlehong. These spruits are all very polluted
                                                                               due to farming, human settlement and industries. Due to
                                                                               the fact that the rivers join the Vaal River below the Vaal
                                                                               Dam, it however does not have major implication for the
                                                                               quality of drinking water in Gauteng as Rand Water
                                                                               subtracts it water from the Vaal Dam. The aesthetic
                                                                               impact on the recreational use of the Vaal River in the
                                                                               Barrage area represents the biggest current impact of this
                                                                               pollution. The following rivers draining towards the Indian
The extensive Blesbok Spruit hydrological system flanked by mining and other
                                                                               Ocean occur in the area:
activities
                                                                                Kaal Spruit/Olifant Spruit
Karst and Intergranular and Fractured Aquifers are the two                     These spruits originate at Kempton Park and Tembisa and
dominant aquifer types in the study area. The Karst                            flow northwards to join the Hennops River in Centurion.
Aquifers occur in the dolomites of the Chuniespoort Group.                     Agricultural activities and human settlements are
This is the most important aquifer type in South Africa.                       responsible for serious pollution.
Infiltrating rainwater containing weak carbonic acid
                                                                                Jukskei Spruit
dissolves dolomites resulting in caves and cavities that
may facilitate the formation of sinkholes, especially if the                   Numerous small tributaries of the Jukskei Spruit drain a
water from these cavities is extracted through boreholes.                      small portion of the south-western areas of the northern
Boreholes with the highest yield are found in the dolomites                    service delivery area.
that occur from Wadeville to a point south of Vosloorus.                        Bronkhorst Spruit
Yields of more than 10 litres per second are common. High
recharge of underground water and significant                                  Koffie Spruit in the Sentrarand area and Os Spruit in the
underground flow result in low density surface drainage in                     Bronkhorst Spruit Agricultural Holdings area drain two
dolomitic areas. This underground flow often supports high                     small areas on the eastern side of the northern service
yielding springs at an impermeable boundary, such as a                         delivery area.
dyke or lithological contact point. Ground water quality in                     Rietvlei River
the study area is generally acceptable for any use. In
some areas contamination with chlorides, sulphates and                         This river rises in the smallholding areas of Kempton Park
nitrates has been recorded and care should be taken with                       and flows northwards past the OR Tambo International
groundwater used for human consumption.                                        Airport to Rietvlei Dam. The Rietvlei Dam contributes a
                                                                               high percentage of the water supplied by the Tshwane
                                                                               Municipality. The primary water supply to this river
                                                                               originates from agricultural run-off and industrial areas.
                                                                               The river is also fed by a tributary, Grootvlei River, which
                                                                               originates in the Bapsfontein area.           Sewage works
                                                                               situated at Kempton Park is responsible for serious
                                                                               pollution. A series of wetlands between the sewage works
                                                                               and the dam, however, filters out most of the pollution.
                                                                               The Tshwane Metropolitan Municipalty, nevertheless,
                                                                               operates an extensive filtering plant at the dam.

                                                                               The prevalence of a large number of pans across
                                                                               Ekurhuleni is one of the outstanding characteristics of the
                                                                               area and is directly linked to the flat topography. They
                                                                               cover a total area of 3 559 ha and are mostly seasonal. A
Part of the Blesbok Spruit                                                     few are perennial and most are in agricultural areas. A
                                                                               number of lakes also occur. These were mostly created by
Groundwater from the Dwyka Group is generally suitable                         the gold mines in the area and some are extensively
for any use. Groundwater yield from aquifers in this                           utilised as outdoor recreational parks. The Germiston,
formation is, however, low.                                                    Benoni and Boksburg lakes are typical examples.
The surface hydrological system, together with a relief of                     Most of the rivers and spruits have been dammed for
the area, is depicted on Map 6. The following rivers,                          agricultural purposes. Only a few dams were created for
draining towards the Atlantic Ocean, occur in the area:                        industrial or recreational purposes. Many of the rivers have
                                                                               been canalised, mostly for storm-water control in build-up
 Blesbok Spruit
                                                                               areas or for agricultural purposes. The lakes, pans and the
The Blesbok Spruit originates to the north of Benoni and                       abundant wetlands (vlei’s and spruits) attract large
Daveyton and flows southwards through Springs and Nigel                        numbers of water birds and other aquatic life. Due to ever
towards the Vaal River. It is a site of international                          increasing human pressure, the wetlands of the area are
importance, as it has been accepted as a wetland under                         unfortunately in an downward cycle of deterioration.

                                                                                                                                         10
Map 6
11expected periodically and mild damage to fruit usually
5. Water quality occurs in two out of three years, while severe damage
occurs every two out of five years. According to the
The term “water quality” is used to describe the microbial, agricultural potential criteria of the National Department of
physical, chemical, toxological and radiological properties Agriculture, the study area is suitable for rainfed crop
of water. Information supplied by the Department of Water production, provided that the crops are grown in areas with
Affairs and Forestry was used for the Eastern and deep soil which stores water for use during dry periods in
Southern Service delivery Regions (ESSDR). Eight the growing season.
variables were used to determine water quality, i.e
temperature, pH, faecal coliform bacteria, dissolved Severe frost occurs frequently from mid-April to September.
oxygen, total suspended solids, turbidity, total phosphate Temperatures below freezing are common in winter.
and total nitrate. Summers are mild with temperatures seldom above 30ºC.
In the ESSDR, the results from samples taken from the Northerly and north-westerly winds blow during winter and
two major catchments, revealed that river health is below spring and north-easterly to north-north-easterly winds
acceptable standards, but within tolerable limits. All during summer. Winds are usually gentle, and strong
indications are that the water quality is deteriorating, winds are only experienced 15% of the time. Moderately
mainly due to industrial pollution, treated waste water from high-speed winds occur from late winter to early spring.
sewage treatment plants and mining operations. Wind damage to field crops is rare, but damage to
deciduous fruit quite common.
At one of the sample points in the Blesbok Spruit,
phosphate levels are above tolerable levels. In the Klip
River catchment, unacceptable levels of pollution were 7. Agricultural potential
recorded at three sample points. Sulphates, chloride and
sodium should be included as monitoring parameters in The Gauteng policy on the protection of high potential
future in order to adequately capture the impacts of mining agricultural land (2006) defines high potential agricultural
and industry. land as “Having the soil and terrain quality, growing
season and available moisture supply needed to produce
Most of the streams and rivers in the Northern Service sustained high yields of crops economically when treated
Delivery Region (NSDR) have good quality water, although and managed according to best possible farming
very poor water quality was found in the lower reaches of practices”.
the Rietvlei River and Kaal Spruit. Poor water quality was
recorded downstream of Tembisa and Olifantsfontein and Applying this definition, a land capability mapping study
three of the tributaries of the Jukskei River. was completed during 2006 for Gauteng Province with the
objective to identify and protect areas of high agricultural
In the NSDR the ability of the aquatic habitats to support a potential. The result of this study was subsequently
wide variety of organisms was calculated through the classified and grouped into the following 5 classes:
assessment of the absence/presence of various aquatic
creatures. Agricultural hubs: High potential agricultural land that
resides outside the urban edge. Seven hubs have been
The river health classification in the NSDR, based on identified in the Gauteng Province.
aquatic insect diversity, ranges between fair and poor. The Important agricultural sites: All land identified as high
top northern reaches of the Blesbok Spruit are most agricultural potential land and located outside the urban
probably the cleanest of the rivers in the northern region. edge but not within an identified Agricultural hub. A
Water in the middle reaches of the Swart Spruit was found complete agricultural specialist study is required for any
to be acceptable during a survey. The Swart Spruit, proposed development on these areas.
however, suffers severe environmental degradation from Incorporated within the urban edge 3 : All land
time to time. Waste water treatment plants at identified and classified as high potential agricultural
Hartebeestfontein are mostly to blame. Waste water land but incorporated completely within the boundaries
treatment at Kempton Park is similarly responsible for the of the urban edge will not be regarded as viable land
polluted waters of Rietvlei River. Illegal squatting, such as for future agricultural development.
at Kaalfontein and Tembisa, causes littering and dumping Overlapping the urban edge³: High potential
in river and stream beds. agricultural land that is located in close proximity and /
or overlapping the urban edge boundary is regarded as
Poor stormwater management also impacts negatively on
agricultural land that could be utilized for agricultural
streams. Only a few of the stormwater control systems
production purposes. A complete agricultural specialist
include retention ponds and pollution control litter traps.
study is required for any proposed development on
Regular stormwater management audits should be
these areas.
undertaken at construction sites, slimes dams, feedlots
Protected area: High potential agricultural land within
and livestock sheds. Regular clearing of dirt road
protected areas will not be used for agricultural
shoulders, kerbs and drains could also alleviate the
purposes.
problem. A problem common to all areas is the
degradation and erosion of stream and river banks. All
The high potential agricultural land in Ekurhuleni is
sectors should be alerted to this problem. Loss of soil, loss
depicted on Map 7 Only one agricultural hub as defined by
of riparian vegetation, loss of aquatic habitats and loss of
GDACE, occurs in Ekurhuleni in the Bapsfontein area.
biodiversity should also be addressed.
Several important agricultural areas are scattered across
The ingress of polluted surface water into mines and the Ekurhuleni and are also indicated.
groundwater is also a potential significant problem that
needs to be addressed further.
6. Climate
Rainfall in the study area is typical of the Highveld summer
rainfall where more than 80% occur from October to April.
3
Average rainfall is 715mm to 735mm annually. Hail can be The urban edge refers specifically to the Gauteng Provincial Urban Edge of
2002).
12Map 7
13Red Listed plant species that occur in the study area
8. Biological environment include:
A large percentage of South Africa’s biodiversity is Khadia beswickii (khadi – a species of mesemb or vygie)
represented in this small area of Gauteng province. The is Critically Endangered. It is endemic to Gauteng
number of species per unit area is exceptionally high. This Province where it grows in open areas and in shallow
biodiversity is, however, threatened by the high levels of soils over rocks in grasslands. The plant is threatened by
industrial, economic and urban development activities. urban settlement, invasive alien vegetation and
harvesting for beer brewing purposes. Approximately
The entire study area falls within the Grassland Biome in 50% of the known populations of the plant occur in the
which grass dominates and geophytes occur abundantly. study area
Trees are usually absent, except along river courses and Delospermum purpereum - (Endangered) a mesemb,
on koppies. Establishment of trees is curtailed by frost, 30% of the known population occur in the area
veld fires and grazing. Today, only a few areas of high Cineraria longipes – (Endangered) 20% of known
quality grassland remain, due to the severe transformation population occur in area
that has taken place. Only 34% of the total area remains Trachyandra erythrorhiza - (Vulnerable) (lily species),
under natural vegetation in various states. The eastern 25% of known population in area
parts of Gauteng is covered by Acocks’ veld type 48 Boweia volubilis (Near threatened)
(Cymbopogon/Themeda veld). The dominant grass is red Calamagrostis egyus var.capensis – (Near threatened)
grass (Themeda triandra). It grows on sandstones and Habenaria bicolour - (Near threatened), a ground orchid
shales with deep sandy loam soils. In Ekurhuleni this veld Kniphofia typhoides- (Near threatened) red hot poker
type covers the area south of Bapsfontein and east of The following threatened bird species occur in the study
Benoni North and almost the entire Southern and Eastern area:
service delivery areas. According to the SANBI 2004
Vegetation Map of South Africa, Lesotho and Swaziland Greater Flamingo
(VEGMAP), depicted on Map 8, three sub-types of Grass owl
vegetation occur: Painted snipe
Lanner falcon
Eastern Highveld Grassland; Melodious lark – near Tembisa
Soweto Highveld Grassland; and
Tsakane Clay Grassland. The threatened bullfrog, marsh sylph butterfly (Metisella
meninx) and the white-tailed rat also occur in the area.
Veld type 61 (Bankenveld) covers the area in the northern
part of the area. Dominant grass species include giant
speargrass (Trachypogon spicatus), broadleaf bluestem
(Diheteropogon amplectens), red autumn grass
(Schizachyrium sanguineum), Loudetia simplex and many 9. The Gauteng Conservation Plan
others. Trees occur in a scattered clusters with common Biodiversity data collected for the Gauteng province as
hook thorn (Acacia caffra) dominant, and white stinkwood part of the Gauteng Biodiversity Gap Analysis Project
(Celtis africana), blue guarri (Euclea crispa ) and sweet (Gauteng BGAP) was analysed to produce the Gauteng
thorn (Acacia karroo) are also present. Conservation Plan (Version 2). The purpose of the
Gauteng BGAP is to identify and map areas that are of
The VEGMAP, identifies three sub-types of vegetation: conservation significance, and to provide
Carletonville Dolomite Grassland; recommendations and policy strategies for the
Egoli Granite Grassland; and conservation and management of these areas.
Rand Highveld Grassland.
Version 2 of the Gauteng Conservation Plan contains
A small area of Mountain Bushveld occurs west and north three different types of sites:
of Alberton to the west of highway R59 and also north of
the N12 highway. Small patches of this veld type also Irreplaceable sites, which are essential in meeting
occur along the Blesbok Spruit south of Springs towards targets set for the conservation of biodiversity in
Nigel. Gauteng. Irreplaceable sites specifically contribute
towards the conservation of confirmed populations and
Wetlands represent the most important habitat type in the suitable habitat of Red Data and other conservation-
Ekurhuleni area because of their vital role in the regulation worthy species of fauna and flora and should be
of water, filtering capabilities and harbouring of biodiversity. protected from transforming land uses.
Wetlands are superimposed over the grassland types of Important sites are sensitive areas that are important
the study area and represent a transition between aquatic for the conservation of biodiversity in Gauteng.
and terrestrial systems. Dominant vegetation in these Important sites specifically contribute towards the
wetlands are Phragmitis australis (reed) and Typha conservation of vegetation types and some Red Data
capensis (bulrush). bird species, as well as the conservation of localities of
conservation-worthy plant and invertebrate species.
The Blesbok Spruit wetland, depicted on Map 9, enjoys a Reserved sites, include all existing level 1 and 2
high conservation priority, as it includes the Maryvale protected areas. Level 1 protected areas are
provincial nature reserve and the Blesbok Spruit proclaimed in terms of relevant legislation specifically
internationally recognised RAMSAR site. Unfortunately, for the protection of biodiversity (or for purposes of
mining, human habitation, and industries impact extremely nature conservation) and are subject to an ecological
negatively on the system. Siltation occurs due to road and management plan with conservation of biodiversity as
pipe crossings and industrial effluents are discharged in the primary management objective. Level 2 protected
the system. areas are proclaimed in terms of relevant legislation
specifically for the protection of biodiversity (or for the
Alien invasive species, mainly Eucalyptus-species (gums) purposes of nature conservation) or are subject to an
and Australian wattles ( Acacia dealbata, silver wattle; ecological management plan with conservation of
Acacia mearnsii , black wattle and Acacia decurrens, biodiversity as the primary management objective.
green wattle) are the most common invaders in Gauteng.
Other significant invaders include lantana, poplars, Version 2 also includes a layer that maps spatial
bugweed, white mulberry and privet. surrogates which support ecological processes that are
essential for the maintenance and generation of
14biodiversity in sensitive areas. Spatial surrogates include Table 2: Vegetation type assessment in Ekurhuleni
Vegetation Type
dolomite, ridges, perennial and non-perennial rivers,
% of national
remaining in
Percentage
Ekurhuleni
wetlands and representative quaternary catchments that
Area (ha)
retain a high proportion of their natural or remnant
ecological functions.
Altered Urban 115153.39 59.79 N/A
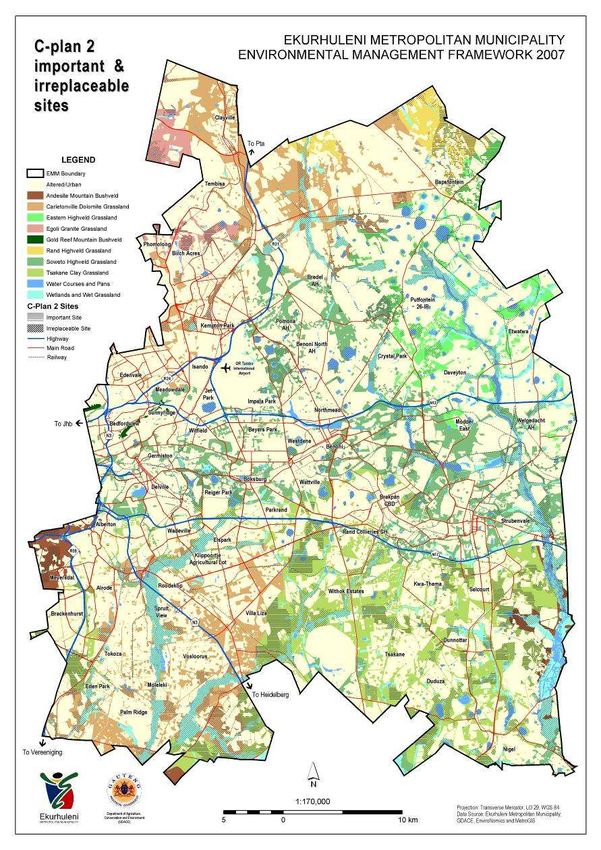
C-Plan 2 irreplaceable and important sites are indicated Andesite Mountain Bushveld 1850.48 0.96 1.09
over the vegetation of the area on Map 8b Carletonville Dolomite Grassland 15117.76 7.85 2.18
Eastern Highveld Grassland 5116.80 2.66 0.73
Egoli Granite Grassland 2017.10 1.05 5.84
Biodiversity in the EMM area is under a lot of pressure Gold Reef Mountain Bushveld 161.49 0.08 0.09
from certain human activities. The conversion of natural Rand Highveld Grassland 2240.59 1.16 0.37
Soweto Highveld Grassland 14833.25 7.70 1.95
habitats into man-made structures has fragmented the Tsakane Clay Grassland 19219.78 9.98 26.91
natural Grasslands in the EMM. Pans have been filled in Water courses and pans 5165.82 2.68 N/A
Wetlands and associated wet grassland 11709.54 6.08 N/A
for urban development, and wetlands and surface water
bodies have become isolated. All these developments in Table 3: Conservation opportunity analysis (area based, quality information not
the area have resulted in the loss of natural ecosystem available)
Vegetation type
function and biodiversity.
conservation
(1 = highest)
areas 100ha
areas 300ha
Remainaing
Remaining
Remaining
Remaining
priority for
Proposed
to 500ha
to 300ha
500ha
Natural migration of animal species is prohibited by fences
areas
areas
and walls built on the edges of the pans and wetlands. The
symbiotic relationship within the ecosystem is also Andesite Mountain Bushveld 7 479.13 813.75 N/A 557.61
disturbed by human activities and the introduction of alien Carletonville Dolomite 6 4531.30 1556.98 2550.84 6478.64
Grassland
invasive species. Trade in medicinal plants has increased Eastern Highveld Grassland 4 1385.72 593.90 N/A 3137.19
and is practiced in an unsustainable manner by traditional Egoli Granite Grassland 2 356.76 327.20 399.30 933.84
healers, shop traders, street traders and commercial Gold Reef Mountain 8 161.49 N/A N/A N/A
Bushveld
gatherers in the area. The EMM area is also faced with the Rand Highveld Grassland 5 43.82 314.96 406.66 1475.15
challenge of increasing its number of protected areas. It Soweto Highveld Grassland 3 5502.31 2565.00 732.72 6033.23
Tsakane Clay Grassland 1 3923.65 2626.65 2868.51 9800.97
also needs to involve the Working for Water Programme to Wetlands and associated 1 8022.53 2936.25 750.76 N/A
identify and remove the vast number of invasive alien plant wet grasslands
species.
11. Blesbok Spruit Ramsar Site
10. Conservation assessment
As part of the EMF study an overall broad assessment of The extent of the Ramsar site is indicated in the context of
the conservation potential was undertaken. The results its catchment (only the Ekurhuleni portion). It is evident
this assessment are incorporated in the GIS of the EMF that the catchment is significantly affected by development
that will be available for the EMM and GDACE for further and stands to be affected even more in the longer term.
more detailed evaluation and ground truthing. GDACE has undertaken done several investigations into
the management and protection of the area. It is however
A summary of the most salient aspect of the assessment is not recommended that the boundaries of the site be
included in Tables 1,2 and 3. extended at this stage as the management implications
are by no means clear. As a fist step a catchment
Table 1 Extracts from the National Spatial Biodiversity Assessment 2004 assessment should be undertaken to pin down the
Vegetation activities that impact on the site more precisely, That will
Conservation
Original Area
type
% remaining
% protected
enable better management and also provide ground for
Ecosystem
Remaining
Protection
Area (ha)
extending the site or not.
Status
target
level
(ha)
Andesite 199530 169605 85 6 24 LT hardly
Mountain protected
Bushveld
Carletonville 911780 693463 76 2 24 VU hardly
Dolomite protected
Grassland
Eastern 1266904 702248 55 0 24 EN hardly
Highveld protected
Grassland
Egoli Granite 109319 34523 32 1 24 EN hardly
Grassland protected
Gold Reef 203098 171727 85 21 24 LT moderately
Mountain protected
Bushveld
Rand 1026192 599136 58 1 24 EN hardly
Highveld protected
Grassland
Soweto 1451033 761968 53 0 24 EN hardly
Highveld protected
Grassland
Tsakane Clay 128381 71429 56 1 24 EN hardly
Grassland protected
15Map 8
16Map 8b
17Map 9
1812. Use of land and transportation
The current use of land in Ekurhuleni is reflected in Table 1 below and depicted on Map 10 and transportation infrastructure
is reflected on Map 11.
Table 4: Use of land in Ekurhuleni
North East South Total Area
74679.68ha 69850.97ha 47624.3ha 192154.25ha
% % %
Area % of of Area % of of Area % of of Area % of % of
Category Feature (ha) category area (ha) category area (ha) category area (ha) category area
Agriculture Dry Land Agriculture 13769 84 18 9519 86 14 2564 64 5 25852 1 13
Grain Storage Cilos 6 0 0 3 0 0 0 0 0 9 0 0
Intensive Agriculture 272 2 0 50 0 0 7 0 0 329 0 0
Irrigated Agriculture 2315 14 3 1453 13 2 985 24 2 4752 0 2
Urban Agriculture 0 0 0 20 0 0 473 12 1 493 0 0
Total 16362 100 22 11044 100 16 4029 100 8 31435 100 16
Airfields Airfields and landing strips 1865 100 2 75 100 0 74 100 0 2014 1*100 1
Business/Commercial CBD - Mixed use 1 0 0 204 25 0 287 25 1 492 18 0
Commercial/Industrial 295 39 0 440 54 1 642 57 1 1377 51 1
Public Garage 0 0 0 24 3 0 48 4 0 72 3 0
Retail 467 61 1 146 18 0 151 13 0 764 28 0
Total 763 100 1 814 100 1 1128 100 2 2705 100 1
Engineering Services Electricity Sub Station *
4 * * 32 17 0 53 22 0 86 20 0
Sewage Works * * * 122 64 0 137 56 0 259 59 0
Water Reservoirs * * * 36 19 0 56 23 0 92 21 0
Total 190 100 0 246 100 1 437 100 0
Industrial Industrial Use 3364 100 5 1511 73 2 2728 85 6 7603 88 4
Open Veld 9 0 0 556 27 1 474 15 1 1039 12 1
Total 3373 100 5 2068 100 3 3202 100 7 8642 100 4
Mining Disturbed Land * * * 1873 16 3 155 4 0 2027 12 1
Evaporation Paddocks 6 0 0 402 3 1 15 0 0 422 3 0
Industrial Use 34 2 0 358 3 1 96 3 0 487 3 0
Mine Dumps 573 38 1 1542 13 2 186 5 0 2300 14 1
Open Veld 122 8 0 2951 25 4 1922 51 4 4995 30 3
Quarries/Borrow Pits 545 36 1 311 3 0 7 0 0 863 5 0
Residential 21 1 0 205 2 0 30 1 0 257 2 0
Sand Mines & Pits 51 3 0 17 0 0 0 0 0 68 0 0
Slimes Dam 144 10 0 3955 34 6 1323 35 3 5421 32 3
Total 1495 100 2 11613 100 17 3734 100 8 16842 100 9
Open Space Disturbed Land 605 2 1 540 2 1 874 6 2 2019 3 1
Golf Course 6 0 0 416 2 1 156 1 0 578 1 0
Open Veld 18712 75 25 21330 84 31 12109 78 25 52151 79 27
Parks And Passive
Recreational Areas 4580 18 6 2938 12 4 2365 15 5 9884 15 5
Road & Rail Reserves 757 3 1 25 0 0 0 0 0 782 1 0
Conservation Areas 434 2 1 0 0 0 76 0 0 510 1 0
Total 25095 100 34 25249 100 36 15580 100 33 65924 100 34
Residential Farm Workers Houses 86 1 0 31 0 0 5 0 0 122 0 0
Farmstead 422 3 1 120 1 0 73 1 0 615 1 0
New Residential
Development 347 2 0 245 2 0 215 2 0 808 2 0
Residential 14289 89 19 10800 82 15 12495 94 26 37583 88 20
Unsurveyed Informal
Settlement 861 5 1 1943 15 3 570 4 1 3374 8 2
Total 16005 100 21 13139 100 19 13358 100 28 42502 100 22
Services Cemetery 93 4 0 267 13 0 235 13 0 595 10 0
Community Hall 3 0 0 37 2 0 33 2 0 72 1 0
Educational Facilities 718 32 1 483 23 1 367 20 1 1568 26 1
Electricity Sub Station 46 2 0 1 0 0 0 0 0 48 1 0
Emergency And Security
Services 37 2 0 14 1 0 12 1 0 63 1 0
Hazardous Waste Disposal
Sites 236 10 0 64 3 0 0 0 0 300 5 0
Health Services 59 3 0 69 3 0 46 3 0 174 3 0
Institutional And
Government 41 2 0 219 10 0 170 9 0 430 7 0
Religious 0 0 0 8 0 0 4 0 0 12 0 0
Sewage Works 72 3 0 46 2 0 0 0 0 117 2 0
Sports Fields & Active
Recreational Areas 935 41 1 716 34 1 861 48 2 2512 41 1
Waste Disposal 15 1 0 170 8 0 63 4 0 249 4 0
Total 2255 100 3 2093 100 3 1791 100 3 6139 100 3
Small Holdings Commercial/Industrial * * * 104 5 0 105 5 0 209 2 0
Dry Land Agriculture 1726 25 2 28 1 0 106 5 0 1860 17 1
Irrigated Agriculture * * * 10 1 0 10 1 0 20 0 0
Open Veld * * * 1488 73 2 1493 76 3 2981 27 2
Residential 5140 74 7 410 20 1 248 13 1 5798 53 3
Unidentified 120 2 0 0 0 0 0 0 0 120 1 0
Total 6987 100 9 2041 100 3 1961 100 4 10989 100 6
Transportation Railway Station 405 90 1 226 15 0 73 3 0 704 16 0
Road & Rail Reserves 43 10 0 1236 84 2 2301 96 5 3579 83 2
Taxi Rank * * * 16 1 0 27 1 0 43 1 0
Total 448 100 1 1478 100 2 2401 100 5 4326 100 2
Unidentified Unidentified 33 100 0 48 100 0 120 100 0 200 100 0
TOTALS Total 74679 100 69850 100 47624 100 192154 100
4
In the NSDR these elements were captured and included inr other categories. Please also note that the categories in which Electricity sub-stations and sewage
works were captured are also not consistent though the three service delivery regions (reflected under “services” or “engineering services”).
19Map 10
20Map 11
2113. Waste management Investigations into the potential use of landfill gas are,
however, continuing. During 2004, four landfill sites were
Domestic waste disposal investigated for gas yield potential and extraction
continued. Advantages of these schemes include;
The Ekurhuleni Metropolitan Municipality offers a reduced risk of explosions, reduced emissions of
comprehensive waste management service in the area at greenhouse gases, more efficient use of dumping space,
substantial expenditure. Waste collection services are job creation, as well as energy production from sources
provided by the municipality, either with own staff and other than fossil fuels.
equipment, or through agents. Five strategically located
landfill sites are operated in the area. In the Eastern Hazardous and industrial waste
Region, Weltevreden is permitted to receive general waste.
Rietfontein is permitted to receive general waste as well as The only hazardous landfill site in Gauteng is situated at
delisted waste, liquids and incinerated medical waste. In Holfontein within the study area. It is operated by
the Southern Region Rooikraal is permitted to receive Enviroserve. This landfill site accepts all hazardous waste
general waste as well as asbestos powder and solids, types including waste for encapsulation. The site accepts
while Simmer & Jack is permitted to receive general waste. on average 263 446 tons of waste per annum. The
In the Northern Region the private Chloorkop waste quantity of hazardous waste received for disposal has
disposal site is permitted to receive general waste and the increased by an average of less than 1% per year over the
proposed new Zesfontein will receive only general waste. last three years. The landfill site at Platkop also accepts
asbestos waste.
The current life expectancy of the waste sites varies
between 15 and 30 years, but in the light of the rapid A facility for the treatment of hazardous waste through
growth being experienced in the areas these life incineration has been established at Olifantsfontein. The
expectancies may have to be adjusted downwards. plant accepts most hazardous waste types for destruction,
including health-care risk waste and mercury. It is the only
Four of these are situated in the southern service delivery high temperature hazardous waste treatment plant in
area and the fifth one is located on the border between the Gauteng.
northern and eastern service delivery regions. An
additional site has been proposed for the northern region
east of Bredell. This site will have a lifespan of seventy
years if approved. The location of landfill sites are
indicated on Map 12.
Plastic in the waste stream
The EMM does not provide a comprehensive health-care
risk waste treatment service. However, a privately-owned
facility has been established at Dunswart. It treats 300
Disposal of waste on a landfill site tons of health- care waste per month. Two thermal
treatment facilities are planned for the EMM, one at
Operation of these sites is allocated to private waste Dunswart and one at Wadeville. A pilot system for the
management contractors under strict performance criteria. collection of small quantities of health-care waste (e.g.
The sites were constructed to conform to the minimum needles and dialysis equipment) from minor sources, were
requirements of the Department of Water Affairs and implemented. Small-scale sources, such as general
Forestry and are externally audited every year. Eight practitioners, home users of needles, traditional healers
transfer sites are also operated where the waste is and mortuaries are targeted.
collected, compacted and loaded for transport in an effort
to optimise the payloads of trucks. The private company, Associated issues
Enviroserv, operates a commercial landfill site at
Chloorkop. Almost 1, 5 million tons of waste is handled An integrated waste management plan should be
annually at these landfill sites. The rate of disposal has formulated that inter alia address the following issues:
increased by 6% per annum over the past three years. The
expected lifespan of the sites are estimated from 14 years The potential water and air pollution of landfill sites;
for the site at Simmer and Jack to 27 years for the site at
the identification of additional landfill sites in a strategic
Rooikraal and 30 to 70 years for the other sites. Public off-
and environmentally risk averse manner to cater for the
loading and voluntary recycling are available at each site.
eventual closure of existing sites; and
Safe disposal of household hazardous waste, such as
batteries, oil and paint is provided at Rietfontein and waste avoidance, reduction and recycling.
Weltevreden sites.
The municipality launched its first project to extract
methane and carbon dioxide from the Weltevreden site
during 1998. The methane was initially compressed and
used to power diesel engines of waste collection vehicles.
The project was successful but not sustainable.
2214. Pollution in flight paths, take-off and landing directions and
frequency of use of certain runways.
Air, water and soil pollution sources in the study area
include: Noise from OR Tambo Airport could impact on the future
potential of the R21 development corridor.
Mines and quarries;
Industry and transport; Using current noise contours and the national noise
Landfill sites; standards as guides, the following limits are proposed:
Irrigated agriculture; and
Sewage treatment plants. Sound sensitive land use such as hospitals and
educational facilities should be restricted to areas
Noise pollution is mainly caused by airports and major outside the 45dB(A) contour.
roads. Residential and office development should be restricted
to areas outside the 55dB(A) contour but should
The potential pollution sources are indicated on Map 12.
preferably be accommodated outside the 50dB(A)
Water pollution contour.
Retail and general commercial activities should be
Water pollution is discussed in previous chapters under restricted to areas outside the 60dB(A) contour, but
the headings, Hydrology and Water Quality. preferably outside the 55dB(A) contour.
Industrial activities should be restricted to areas outside
Air pollution the 70dB(A) contour, but preferably outside the 65dB(A)
contour.
The Air Quality management plan for EMM, 2005, No development of land uses other than service
Identified the following sources to be significant in terms of infrastructure should be allowed inside the 75dB(A)
their contributions to ambient air pollutant concentrations contour.
and associated health risks:
Household fuel burning;
Industrial and commercial fuel burning;
Vehicle exhaust emissions;
OR Tambo International Airport;
Unrehabilitated tailings and impoundments; and
Large industries associated with various stack, vent
and fugitive emissions.
It also identified priority areas that may be subject to
elevated levels of air pollutants that include:
Household fuel burning areas;
Central business districts and residential areas
transacted by highways, on-ramps and main feeder
roads;
Residential areas in close proximity to industrial areas Freeways are significant sources of noise
such as Olifantfontein, Clayville, Isando, Wadeville,
Alrode, Benoni South, Apex, Nuffield and New Era; Noise contours for roads and railway lines in the study
Residential areas in the proximity of the OR Tambo area are not available. The same criteria as for OR Tambo
International airport; and International Airport and other airports should be applied. It
Residential areas near uncontrolled mine tailing dams. is recommended that noise impact assessments be
undertaken in zones of 800 m from all major highways and
roads in the area, and where educational and health care
facilities, as well as residential and office development are
being considered.
Impact of mining on groundwater
Mining in the areas has a significant impact on the quality
(especially acidification) of groundwater as well on
fluctuations of the water levels in the area. Inadequate
information in this respect is available at this stage to
make definite recommendations. There is a need to
investigate the matter further and if the relevant
information cannot be obtained from the Department of
Minerals and Energy, extensive further studies may be
necessary.
A potential pollution incident
The potential impact of radon gas emissions and the
Noise general toxicity of soils should be investigated where it is
proposed to reuse old slimes dam sites before plans for
Noise pollution sources are not static and change the re-use of such areas are formulated. The
continuously. assessments should focus on finding the most appropriate
land use options for such areas.
The major sources of noise pollution in the study area are
the OR Tambo Airport and high traffic volume roads and
railway lines.
Noise contours around an airport change depending on
factors such as number of take-offs and landings,
improvement and changes in aircraft and airports, changes
23Map 12
2416. Population characteristics
15. Cultural and historic features
Background
Early history
The EMM’s area of jurisdiction includes the municipal
The cultural heritage of the study area has been shaped areas of Kempton Park, Tembisa, Edenvale, Boksburg,
by almost continuous human occupation over the past 500 Benoni (including Daveyton and Etwatwa), Brakpan
000 years. Occupation of the area began during the early (including Tsakane), Springs (including Kwa-Thema), Nigel
Stone Age and stretches through Iron Age settlement to (including Duduza), Germiston and Alberton.
colonial settlement in the 1840s. In the early years, human
use of the area was focussed on hunting, gathering and Population distribution
farming. Relatively little has remained of early settlements,
except in less disturbed areas, where development has not Population growth for the total EMM area is 2,7% per
encroached on archaeological sites. annum. The largest portion of the EMM’s population
resides in the southern service delivery area (38%).The
Stone Age sites probably occurred throughout the study total population of the northern service delivery area has
area, but most have been obliterated by mining and other grown by more than 30% between 1996 and 2001, while
development activities. the population in the southern and eastern service delivery
area has grown by 20% during the same period.
A considerable number of Late Iron Age stone-walled sites,
dating from the 18th and 19th centuries, occur along the top Statistics on the various population groups during 2001
of rocky ridges in the area. Some of these may have been were as follows:
occupied as early as the 16th century. Pottery shards and
metal items are common on the sites. Black 1 914 485
Coloured 66 504
Sotho-Tswana speaking peoples who herded livestock, Indian 32 228
probably occupied these settlements. This occupation was White 465 577
disrupted during the difiqane when Mzilikazi lived near the
Vaal River before he moved north across the In the northern service delivery area, the Indian population
Magaliesberg. has shown the highest growth of all groups over the period
1996 to 2001 (175,6%), while the same group grew by
Recent history only 17,7% in the southern and eastern service delivery
region.
The first Europeans appeared in the area during the early
1820s. They were hunters, traders, missionaries and The Coloured population grew by 78% in the northern
explorers. Permanent occupation by Europeans started region and by 14,8% in the south and east.
with the arrival of the Voortrekkers in the early 1840s. The
farms which they occupied were only formally surveyed The Black population has shown the highest growth rate of
and mapped in the 1880s. The original farms were all the groups in the east, as well as in the south (24%).
subdivided many times as the number of farmers The population of Blacks increased by 40% in the north.
increased.
The White population grew by 12,5% in the northern area
The discovery of gold on the Witwatersrand completely and by 1,66% in the south and east.
changed the cultural heritage of the area. The discovery of
coal led to the construction of railway lines to supply the Proportionately, the number of Black has has grown to
gold fields with coal. The lines were linked to the Orange 65% of the total population in the north and to 80,15% in
Free State and the Cape in 1892 and to Pretoria in 1893. the south and east. In the north, the proportion of Whites
The railway connection to Natal followed in 1896. All these decreased from 39% to 34%, and from 14,85% to 12,53%
lines connected at Elandsfontein (Germiston). The railway in the south and east.
stimulated the development of villages and the supply of
electricity became necessary. The first coal-fired power Population structure (age and gender)
station north of the Vaal River was built at Brakpan in the
1890s. The majority of people living in the EMM fall in the age
group 15 to 35. Almost 51% are males.
Gold and coal was the driving force of the economy until it
was superseded by commerce and manufacturing. Gender
Municipalities were proclaimed in the early 1900s.
1271049
The management of the cultural heritage of this area took
469674
place on ad hoc manner. Many heritage sites have been Male
vandalised and/or neglected due to lack of funds, lack of 424727
376648
capacity and low priority. This applies in particular to the Series
Series
1 = EM M 2001
2 = SSD R 2001
following heritage resources: Series
Series
3 = ESD R 2001
4 = N SD R 2001
1231631
Old mining sites (headgear, offices, workshops, houses,
452297
compounds); Female
423867
Monuments and memorials;
355467
Cemeteries;
Railway sites and;
Late Iron Age sites. 0 200000 400000 600000 800000 100000 120000 140000
0 0 0
No. of people
A list of heritage resources are contained in the status quo
reports on the three service delivery regions.
Income distribution
In the northern service delivery region, 16% of households
have no income, compared to 25% in the southern and
eastern region. In the north, 44% of households have an
25You can also read