3.3 AIR QUALITY - City of Santa Rosa
←
→
Page content transcription
If your browser does not render page correctly, please read the page content below
3.3 AIR QUALITY
3.3 AIR QUALITY

This section includes a description of existing air quality conditions, a summary of applicable
regulations, a description of existing air quality conditions, and an analysis of potential air quality
impacts associated with the proposed North Station Area Specific Plan project. Mitigation
measures are recommended, as necessary, to reduce significant air quality impacts. This air quality
analysis and associated modeling was conducted by Ambient Air Quality and Noise Consulting.

3.3.1 EXISTING SETTING

PHYSICAL ENVIRONMENT

San Francisco Bay Area Air Basin

The proposed project is located in the San Francisco Bay Area Air Basin (SFBAAB). The Bay Area
Air Quality Management District (BAAQMD) is the regional air quality agency for the SFBAAB,
which comprises all of Alameda, Contra Costa, Marin, Napa, San Francisco, San Mateo, and
Santa Clara counties, the southern portion of Sonoma County, and the southwestern portion of
Solano County. Air quality in this area is determined by such natural factors as topography,
meteorology, and climate, in addition to the presence of existing air pollution sources and
ambient conditions. These factors and applicable regulations are discussed below.

Climate, Topography, Air Pollution Potential

The SFBAAB is characterized by complex terrain, consisting of coastal mountain ranges, inland
valleys, and bays, all of which distort normal wind flow patterns. California’s Coast Range splits,
resulting in a western coast gap, Golden Gate, and an eastern coast gap, Carquinez Strait,
which allow air to flow in and out of the SFBAAB and the Central Valley.

The climate is dominated by the strength and location of a semi-permanent, subtropical high-
pressure cell. During the summer, the Pacific high-pressure cell is centered over the northeastern
Pacific Ocean, resulting in stable meteorological conditions and a steady northwesterly wind
flow. Upwelling of cold ocean water from below to the surface because of the northwesterly
flow produces a band of cold water off the California coast. The cool and moisture-laden air
approaching the coast from the Pacific Ocean is further cooled by the presence of the cold
water band resulting in condensation and the presence of fog and stratus clouds along the
Northern California coast (BAAQMD 2011a).

In the winter, the Pacific high-pressure cell weakens and shifts southward, resulting in wind flow
offshore, the absence of upwelling, and the occurrence of storms. Weak inversions coupled with
moderate winds result in a low air pollution potential.

High-Pressure Cell

During the summer, the large-scale meteorological condition that dominates the West Coast is a
semi-permanent high-pressure cell over the Pacific Ocean. This high-pressure cell keeps storms
from affecting the California coast. Hence, the SFBAAB experiences little precipitation in the
summer months. Winds tend to blow onshore out of the north/northwest.

The steady northwesterly flow induces upwelling of cold water from below. This upwelling
produces a band of cold water off the California coast. When air approaches the California
coast, already cool and moisture-laden from its long journey over the Pacific, it is further cooled
as it crosses this bank of cold water. This cooling often produces condensation, resulting in a high
incidence of fog and stratus clouds along the Northern California coast in the summer.
City of Santa Rosa                                               North Santa Rosa Station Area Specific Plan
April 2012                                                               Draft Environmental Impact Report
                                                 3.3-1
3.3 AIR QUALITY
Generally in the winter, the Pacific high-pressure cell weakens and shifts southward, winds tend to
flow offshore, upwelling ceases, and storms occur. During the winter rainy periods, inversions (layers
of warmer air over colder air; see below) are weak or nonexistent, winds are usually moderate,
and air pollution potential is low. The Pacific high-pressure cell does periodically become
dominant, bringing strong inversions, light winds, and high pollution potential (BAAQMD 2011a).
Topography
The topography of the SFBAAB is characterized by complex terrain, consisting of coastal
mountain ranges, inland valleys, and bays. This complex terrain, especially the higher elevations,
distorts the normal wind flow patterns in the SFBAAB. The greatest distortion occurs when low-
level inversions are present and the air beneath the inversion flows independently of air above
the inversion, a condition that is common in the summertime.
The only major break in California’s Coast Range occurs in the SFBAAB. Here, the Coast Range
splits into western and eastern ranges; between the two ranges lies the San Francisco Bay. The
gap in the western Coast Range is known as the Golden Gate, and the gap in the eastern Coast
Range is the Carquinez Strait. These gaps allow air to pass into and out of the SFBAAB and the
Central Valley (BAAQMD 2011a).
Wind Patterns
During the summer, winds flowing from the northwest are drawn inland through the Golden Gate
and over the lower portions of the San Francisco Peninsula. Immediately south of Mount
Tamalpais, the northwesterly winds accelerate considerably and come more directly from the
west as they stream through the Golden Gate. This channeling of wind through the Golden Gate
produces a jet that sweeps eastward and splits off to the northwest toward Richmond and to
the southwest toward San Jose when it meets the East Bay hills.
Wind speeds may be strong locally in areas where air is channeled through a narrow opening,
such as the Carquinez Strait, the Golden Gate, or the San Bruno gap. For example, the average
wind speed at San Francisco International Airport in July is about 17 knots (from 3 p.m. to 4 p.m.),
compared with 7 knots at San Jose and less than 6 knots at the Farallon Islands.
The air flowing in from the coast to the Central Valley, called the sea breeze, begins developing
at or near ground level along the coast in late morning or early afternoon. As the day
progresses, the sea breeze layer deepens and increases in velocity while spreading inland. The
depth of the sea breeze depends in large part upon the height and strength of the inversion. If
the inversion is low and strong, and hence stable, the flow of the sea breeze will be inhibited and
stagnant conditions are likely to result.
In the winter, the SFBAAB frequently experiences stormy conditions with moderate to strong
winds, as well as periods of stagnation with very light winds. Winter stagnation episodes are
characterized by nighttime drainage flows in coastal valleys. Drainage is a reversal of the usual
daytime air-flow patterns; air moves from the Central Valley toward the coast and back down
toward the San Francisco Bay from the smaller valleys within the SFBAAB (BAAQMD 2011a).
Temperature
Summertime temperatures in the SFBAAB, which encompasses the proposed project site, are
determined in large part by the effect of differential heating between land and water surfaces.
Because land tends to heat up and cool off more quickly than water, a large-scale gradient
North Santa Rosa Station Area Specific Plan City of Santa Rosa
Draft Environmental Impact Report April 2012
3.3-23.3 AIR QUALITY
(differential) in temperature is often created between the coast and the Central Valley, and
small-scale local gradients are often produced along the shorelines of the ocean and bays. The
temperature gradient near the ocean is also exaggerated, especially in summer, because of
the upwelling of cold ocean bottom water along the coast. On summer afternoons, the
temperatures at the coast can be 35ºF cooler than temperatures 15 to 20 miles inland. At night,
this contrast usually decreases to less than 10ºF.
In the winter, the relationship of minimum and maximum temperatures is reversed. During the
daytime, the temperature contrast between the coast and inland areas is small, whereas at
night the variation in temperature is large (BAAQMD 2011a).
Precipitation
The SFBAAB is characterized by moderately wet winters and dry summers. Winter rains account
for about 75 percent of the average annual rainfall. The amount of annual precipitation can
vary greatly from one part of the SFBAAB to another even within short distances. In general, total
annual rainfall can reach 40 inches in the mountains, but it is often less than 16 inches in
sheltered valleys.
During rainy periods, ventilation (rapid horizontal movement of air and injection of cleaner air)
and vertical mixing are usually high, and thus pollution levels tend to be low. However, frequent
dry periods do occur during the winter where mixing and ventilation are low and pollutant levels
build up (BAAQMD 2011a).
Air Pollution Potential
The potential for high pollutant concentrations developing at a given location depends upon
the quantity of pollutants emitted into the atmosphere in the surrounding area or upwind and
the ability of the atmosphere to disperse the contaminated air. The topographic and
climatological factors discussed above influence the atmospheric pollution potential of an area.
Atmospheric pollution potential, as the term is used here, is independent of the location of
emission sources and is instead a function of factors described below.
Wind Circulation
Low wind speed contributes to the buildup of air pollution because it allows more pollutants to
be emitted into the air mass per unit of time. Light winds occur most frequently during periods of
low sun (fall and winter, and early morning) and at night. These are also periods when air
pollutant emissions from some sources are at their peak, namely, commute traffic (early
morning) and wood-burning appliances (nighttime). The problem can be compounded in
valleys, when weak flows carry the pollutants upvalley during the day and cold air drainage
flows move the air mass downvalley at night. Such restricted movement of trapped air provides
little opportunity for ventilation and leads to buildup of pollutants to potentially unhealthful levels.
A wind-rose is a graphic tool used by meteorologists to give a succinct view of how wind speed
and direction are typically distributed at a particular location. Wind-roses provide useful
information for communities that contain industry, landfills, or other potentially odorous or noxious
land uses. Each wind-rose diagram provides a general indication of the proportion of time that
winds blow from each compass direction: The longer the vector length, the greater the
frequency of wind occurring from that direction. Such information may be particularly useful in
planning buffer zones. For example, sensitive receptors such as residential developments,
schools, or hospitals are inappropriate uses immediately downwind from facilities that emit toxic
City of Santa Rosa North Santa Rosa Station Area Specific Plan
April 2012 Draft Environmental Impact Report
3.3-33.3 AIR QUALITY
or odorous pollutants, unless adequate separation is provided by a buffer zone. Caution should
be taken in using wind-roses in planning and environmental review processes. A site on the
opposite side of a hill or tall building, even a short distance from a meteorological monitoring
station, may experience a significant difference in wind pattern (BAAQMD 2011a).
Inversions
An inversion is a layer of warmer air over a layer of cooler air. Inversions affect air quality conditions
significantly because they influence the mixing depth, i.e., the vertical depth in the atmosphere
available for diluting air contaminants near the ground. The highest air pollutant concentrations in
the SFBAAB, and therefore the Specific Plan area, generally occur during inversions.
Two types of inversions occur regularly in the SFBAAB. One is more common in the summer and
fall, while the other is most common during the winter. The frequent occurrence of elevated
temperature inversions in summer and fall months acts to cap the mixing depth, limiting the
depth of air available for dilution. Elevated inversions are caused by subsiding air from the
subtropical high pressure zone and from the cool marine air layer that is drawn into the SFBAAB
by the heated low-pressure region in the Central Valley.
The inversions typical of winter, called radiation inversions, are formed as heat quickly radiates
from the earth’s surface after sunset, causing the air in contact with it to rapidly cool. Radiation
inversions are strongest on clear, low-wind, cold winter nights, allowing the buildup of such
pollutants as carbon monoxide and particulate matter. When wind speeds are low, there is little
mechanical turbulence to mix the air, resulting in a layer of warm air over a layer of cooler air
next to the ground. Mixing depths under these conditions can be as shallow as 50 to 100 meters
(164–328 feet), particularly in rural areas. Urban areas usually have deeper minimum mixing
layers because of heat island effects and increased surface roughness. During radiation
inversions, downwind transport is slow, the mixing depths are shallow, and turbulence is minimal,
all factors which contribute to ozone formation.
Although each type of inversion is most common during a specific season, either inversion
mechanism can occur at any time of the year. Sometimes both occur simultaneously. Moreover,
the characteristics of an inversion often change throughout the course of a day. The terrain of
the SFBAAB also induces significant variations among subregions. The proposed Specific Plan
area is located in the Cotati and Petaluma valleys climatological subregion of the SFBAAB
described in further detail below.
Solar Radiation
The frequency of hot, sunny days during the summer months in the SFBAAB is another important
factor that affects air pollution potential. It is at the higher temperatures that ozone is formed. In
the presence of ultraviolet sunlight and warm temperatures, reactive organic gases and oxides
of nitrogen react to form secondary photochemical pollutants, including ozone.
Because temperatures in many of the SFBAAB inland valleys are so much higher than near the
coast, the inland areas are especially prone to photochemical air pollution. In late fall and
winter, solar angles are low, resulting in insufficient ultraviolet light and warming of the
atmosphere to drive the photochemical reactions. Ozone concentrations do not reach
significant levels in the SFBAAB during these seasons (BAAQMD 2011a).
North Santa Rosa Station Area Specific Plan City of Santa Rosa
Draft Environmental Impact Report April 2012
3.3-43.3 AIR QUALITY
Sheltered Terrain
The hills and mountains in the SFBAAB contribute to the high pollution potential of some areas.
During the day, or at night during windy conditions, areas in the leeward sides of mountains (the
sides not facing into the direction of winds) are sheltered from the prevailing winds, thereby
reducing turbulence and downwind transport. At night, when wind speeds are low, the upper
atmospheric layers are often decoupled from the surface layers during radiation conditions. If
elevated terrain is present, it will tend to block pollutant transport in that direction. Elevated
terrain also can create a recirculation pattern by inducing upvalley air flows during the day and
reverse downvalley flows during the night, allowing little inflow of fresh air.
The areas having the highest air pollution potential tend to be those that experience the highest
temperatures in the summer and the lowest temperatures in the winter. The coastal areas are
exposed to the prevailing marine air, creating cooler temperatures in the summer, warmer
temperatures in winter, and stratus clouds all year. The inland valleys are sheltered from the
marine air and experience hotter summers and colder winters. Thus, the topography of the
inland valleys creates conditions conducive to high air pollution potential (BAAQMD 2011a).
Pollution Potential Related to Emissions
Although air pollution potential is strongly influenced by climate and topography, the air
pollution that occurs in a location also depends upon the amount of air pollutant emissions in
the surrounding area or transported from more distant places. Air pollutant emissions generally
are highest in areas that have high population densities, high motor vehicle use and/or
industrialization. These contaminants created by photochemical processes in the atmosphere,
such as ozone, may result in high concentrations many miles downwind from the sources of their
precursor chemicals (BAAQMD 2011a).
Cotati and Petaluma Valleys Climatological Subregion
The subregion that stretches from Santa Rosa to the San Pablo Bay is often considered as two
different valleys: the Cotati Valley in the north and the Petaluma Valley in the south. To the east,
the valley is bordered by the Sonoma Mountains, while to the west is a series of low hills, followed
by the Estero Lowlands, which open to the Pacific Ocean. The region from the Estero Lowlands
to the San Pablo Bay is known as the Petaluma Gap. This low-terrain area allows marine air to
travel into the SFBAAB.
Wind patterns in the Petaluma and Cotati valleys are strongly influenced by the Petaluma Gap,
with winds flowing predominantly from the west. As marine air travels through the Petaluma
Gap, it splits into northward and southward paths moving into the Cotati and Petaluma valleys.
The southward path crosses San Pablo Bay and moves eastward through the Carquinez Strait.
The northward path contributes to Santa Rosa’s prevailing winds from the south and southeast.
When the ocean breeze is weak, strong winds from the east can predominate, carrying
pollutants from the Central Valley and the Carquinez Strait. During these periods, upvalley flows
can carry the polluted air as far north as Santa Rosa and the proposed Specific Plan area.
Winds are usually stronger in the Petaluma Valley than in the Cotati Valley because the former is
directly in line with the Petaluma Gap. Average annual wind speed at the Petaluma Airport is 7
miles per hour (mph). The Cotati Valley, being slightly north of the Petaluma Gap, experiences
lower wind speeds. The annual average wind speed in Santa Rosa is 5 mph.
City of Santa Rosa North Santa Rosa Station Area Specific Plan
April 2012 Draft Environmental Impact Report
3.3-53.3 AIR QUALITY
Air temperatures are very similar in the two valleys. Summer maximum temperatures for this
subregion are in the low to mid 80s (in degrees Fahrenheit), while winter maximum temperatures
are in the high 50s to low 60s. Summer minimum temperatures are around 50 degrees, and
winter minimum temperatures are in the high 30s.
Generally, air pollution potential is low in the Petaluma Valley because of its link to the Petaluma
Gap and because of its low population density. Two scenarios could produce elevated
pollutant levels: (1) stagnant conditions in the morning hours created when a weak ocean
breeze meets a weak bay breeze, and (2) an eastern or southeastern wind pattern in the
afternoon brings in pollution from the Carquinez Strait Region and the Central Valley.
The Cotati Valley has a higher pollution potential than does the Petaluma Valley. The Cotati
Valley lacks a gap to the sea, contains a larger population, and has natural barriers at its
northern and eastern ends. There are also industrial facilities in and around Santa Rosa. Both
valleys of this subregion are also threatened by increased motor vehicle traffic and the
associated air contaminants. Population and motor vehicle use are increasingly significant, and
housing costs and the suburbanization of employment are leading to more and longer
commutes traversing the subregion (BAAQMD 2011a).
EXISTING AMBIENT AIR QUALITY
Criteria Air Pollutants
The California Air Resources Board (CARB) and the U.S. Environmental Protection Agency (EPA)
currently focus on the following air pollutants as indicators of ambient air quality: ozone,
particulate matter (PM), nitrogen dioxide (NO2), carbon monoxide (CO), sulfur dioxide (SO2),
and lead. Because these are the most prevalent air pollutants known to be deleterious to
human health and extensive health-effects criteria documents are available, they are
commonly referred to as criteria air pollutants. Ambient air quality standards are summarized in
Table 3.3-1.
TABLE 3.3-1
AIR QUALITY STANDARDS
Pollutant Averaging Time California Standards1 National Standards2
0.070 ppm
8 Hour 0.075 ppm
(137µg/m3)
Ozone
0.09 ppm
1 Hour --
(180 µg/m3)
9.0 ppm 9 ppm
8 Hour
(10 mg/m3) (10 mg/m3)
Carbon Monoxide
20 ppm 35 ppm
1 Hour
(23 mg/m3) (40 mg/m3)
0.18 ppm
1 Hour 100 ppb
(339 µg/m3)
Nitrogen Dioxide
Annual Arithmetic 0.030 ppm
53 ppb
Mean (57 µg/m3)
North Santa Rosa Station Area Specific Plan City of Santa Rosa
Draft Environmental Impact Report April 2012
3.3-63.3 AIR QUALITY
Pollutant Averaging Time California Standards1 National Standards2
0.04 ppm
24 Hour N/A
(105 µg/m3)
Sulfur Dioxide 3 Hour -- N/A
0.25 ppm
1 Hour 75 ppb
(665 µg/m3)
Annual Arithmetic
20 µg/m3 N/A
Particulate Matter (PM10) Mean
24 Hour 50 µg/m3 150 µg/m3
Annual Arithmetic
Particulate Matter – Fine 12 µg/m3 15 µg/m3
Mean
(PM2.5)
24 Hour N/A 35 µg/m3
Sulfates 24 Hour 25 µg/m3 N/A
Calendar Quarter N/A 1.5 µg/m3
Lead
30 Day Average 1.5 µg/m3 N/A
0.03 ppm
Hydrogen Sulfide 1 Hour N/A
(42 µg/m3)
Vinyl Chloride 0.01 ppm
24 Hour N/A
(chloroethene) (26 µg/m3)
Extinction coefficient:
0.23/kilometer-visibility of 10 miles
Visibility Reducing 8 Hour or more (0.07-30 miles or more for
N/A
particles (10:00 to 18:00 PST) Lake Tahoe) due to particles when
the relative humidity is less than
70%.
Sources: CARB 2011a, 2011b; EPA 2011
Notes: N/A = Not Applicable; mg/m3=milligrams per cubic meter; ppm=parts per million; ppb=parts per billion; µg/m3=micrograms
per cubic meter
1. This table provides a summary of current air quality standards and attainment designations at the time of this analysis. For more
information on standards visit the CARB website at http//www.arb.ca.gov.research/aaqs/aaqs2.pdf.
2. As of September 27, 2010, all carbon monoxide areas have been redesignated to maintenance areas.
The most problematic pollutants in the Specific Plan area and surrounding region include ozone
and PM. The health effects and major sources of these pollutants are described below. Toxic air
contaminants are a separate class of pollutants and are discussed later in this section.
Ozone
Ozone, or smog, is not emitted directly into the environment, but is formed in the atmosphere by
complex chemical reactions between reactive organic gases (ROG) and nitrogen oxide (NOX)
in the presence of sunlight. Ozone formation is greatest on warm, windless, sunny days. The main
sources of NOX and ROG, often referred to as ozone precursors, are combustion processes
(including motor vehicle engines) the evaporation of solvents, paints, and fuels, and biogenic
sources. Automobiles are the single largest source of ozone precursors in the SFBAAB. Tailpipe
emissions of ROG are highest during cold starts, hard acceleration, stop-and-go conditions, and
slow speeds. They decline as speeds increase up to about 50 mph, then increase again at high
speeds and high engine loads. ROG emissions associated with evaporation of unburned fuel
depend on vehicle and ambient temperature cycles. NOX emissions exhibit a different curve;
City of Santa Rosa North Santa Rosa Station Area Specific Plan
April 2012 Draft Environmental Impact Report
3.3-73.3 AIR QUALITY
emissions decrease as the vehicle approaches 30 mph and then begin to increase with
increasing speeds.
Ozone levels usually build up during the day and peak in the afternoon hours. Short-term
exposure can irritate the eyes and cause constriction of the airways. Besides causing shortness of
breath, it can aggravate existing respiratory diseases such as asthma, bronchitis, and
emphysema. Chronic exposure to high ozone levels can permanently damage lung tissue.
Ozone can also damage plants and trees, and materials such as rubber and fabrics.
Particulate Matter
Particulate matter (PM) refers to a wide range of solid or liquid particles in the atmosphere,
including smoke, dust, aerosols, and metallic oxides. Respirable PM with an aerodynamic diameter
of 10 micrometers or less is referred to as PM10. PM2.5 includes a subgroup of finer particles that
have an aerodynamic diameter of 2.5 micrometers or less. Some particulate matter, such as
pollen, is naturally occurring. In the SFBAAB, most particulate matter is caused by combustion,
factories, construction, grading, demolition, agricultural activities, and motor vehicles. Extended
exposure to PM can increase the risk of chronic respiratory disease. PM10 is of concern because it
bypasses the body’s natural filtration system more easily than larger particles and can lodge deep
in the lungs. The EPA and the State of California revised their PM standards several years ago to
apply only to these fine particles. PM2.5 poses an increased health risk because the particles can
deposit deep in the lungs and contain substances that are particularly harmful to human health.
Motor vehicles are currently responsible for about half of particulates in the SFBAAB. Wood burning
in fireplaces and stoves is another large source of fine particulates.
Nitrogen Dioxide
Nitrogen dioxide (NO2) is a reddish-brown gas that is a byproduct of combustion processes.
Automobiles and industrial operations are the main sources of NO2. Aside from its contribution to
ozone formation, nitrogen dioxide can increase the risk of acute and chronic respiratory disease
and reduce visibility. NO2 may be visible as a coloring component of a brown cloud on high
pollution days, especially in conjunction with high ozone levels.
Sulfur Dioxide
Sulfur dioxide (SO2) is a colorless acid gas with a pungent odor. It has potential to damage
materials and it can have health effects at high concentrations. It is produced by the
combustion of sulfur-containing fuels, such as oil, coal, and diesel. SO2 can irritate lung tissue and
increase the risk of acute and chronic respiratory disease.
Lead
Lead is a metal found naturally in the environment as well as in manufactured products. The
major sources of lead emissions have historically been mobile and industrial sources. As a result
of the phase-out of leaded gasoline, metal processing is currently the primary source of lead
emissions. The highest levels of lead in air are generally found near lead smelters. Other
stationary sources are waste incinerators, utilities, and lead-acid battery manufacturers.
Twenty years ago, mobile sources were the main contributor to ambient lead concentrations in
the air. In the early 1970s, the EPA set national regulations to gradually reduce the lead content in
gasoline. In 1975, unleaded gasoline was introduced for motor vehicles equipped with catalytic
converters. The EPA banned the use of leaded gasoline in highway vehicles in December 1995. As
North Santa Rosa Station Area Specific Plan City of Santa Rosa
Draft Environmental Impact Report April 2012
3.3-83.3 AIR QUALITY
a result of the EPA’s regulatory efforts to remove lead from gasoline, emissions of lead from the
transportation sector and levels of lead in the air decreased dramatically.
Volatile Organic Compounds/Reactive Organic Gases
It should be noted that there are no state or federal ambient air quality standards for volatile
organic compounds (VOCs) (also referred to as reactive organic gases [ROG]) because they
are not classified as criteria pollutants. VOCs/ROGs are regulated, however, because a
reduction in VOC/ROG emissions reduces certain chemical reactions which contribute to the
formation of ozone. VOC/ROG emissions are also transformed into organic aerosols in the
atmosphere, contributing to higher PM10 and lower visibility levels.
Although health-based standards have not been established for VOC/ROG emissions, health
effects can occur from exposures to high concentrations of VOC/ROG. Some hydrocarbon
components classified as VOC/ROG are hazardous air pollutants. Benzene, for example, is a
hydrocarbon component of VOC/ROG emissions that is known to be a human carcinogen.
Carbon Monoxide
Carbon monoxide (CO) is an odorless, colorless gas. It is formed by the incomplete combustion
of fuels. The single largest source of CO in the SFBAAB is motor vehicles. Emissions are highest
during cold starts, hard acceleration, stop-and-go driving, and when a vehicle is moving at low
speeds. New findings indicate that CO emissions per mile are lowest at about 45 mph for the
average light-duty motor vehicle and begin to increase again at higher speeds. When inhaled
at high concentrations, CO combines with hemoglobin in the blood and reduces the oxygen-
carrying capacity of the blood. This results in reduced oxygen reaching the brain, heart, and
other body tissues. This condition is especially critical for people with cardiovascular diseases,
chronic lung disease, or anemia, as well as for fetuses. Even healthy people exposed to high CO
concentrations can experience headaches, dizziness, fatigue, unconsciousness, and even
death (BAAQMD 2011a).
Criteria Air Pollutant Monitoring Data
Air quality conditions in the San Francisco Bay Area Air Basin have improved significantly since
the BAAQMD was created in 1955. Ambient concentrations and the number of days on which
the region exceeds standards have declined dramatically. Neither state nor national ambient
air quality standards of these chemicals have been violated in recent decades for NO2, SO2,
sulfates, lead, hydrogen sulfide, and vinyl chloride (BAAQMD 2011a).
The BAAQMD operates a regional air quality monitoring network that regularly measures the
concentrations of the five major criteria air pollutants. Ambient air quality in the project area can
be inferred from ambient air quality measurements conducted at nearby air quality monitoring
stations, which include the Santa Rosa-5th Street monitoring station. Table 3.3-2 summarizes the
last three years of published ambient air quality data obtained from this nearest air quality
monitoring station. As depicted in Table 3.3-2, ambient air quality standards for ozone, PM10,
PM2.5, CO, and NOX have not been exceeded during the last three years of available data.
City of Santa Rosa North Santa Rosa Station Area Specific Plan
April 2012 Draft Environmental Impact Report
3.3-93.3 AIR QUALITY
TABLE 3.3-2
SUMMARY OF AIR QUALITY DATA
Pollutant Standards 2008 2009 2010
Ozone
Maximum concentration (1-hr/8hr, ppm) 0.076/0.064 0.086/0.065 0.084/0.068
Number of days state standard (1-hr/8-hr) exceeded 0/0 0/0 0/0
Number of days national standard exceeded 0 0 0
Respirable Particulate Matter (PM10)
Maximum daily concentration (National/State, μg/m3) 48.5 N/A N/A
Number of days state standard exceeded 0 N/A N/A
Number of days national standard exceeded N/A N/A N/A
Fine Particulate Matter (PM2.5)
Maximum 24-hour concentration (National/State, μg/m3) 30.8 29.0 26.6
Number of days national standard exceeded (estimated) 0 0 0
Carbon Monoxide (O3)
Maximum concentration (1-hr/8-hr, ppm) 4.0/1.49 4.0/1.34 3.0/1.14
Number of days state standard (1-hr/8-hr) exceeded 0/0 0/0 0/0
Number of days national standard exceeded 0 0 3
Nitrogen Dioxide (NO2)
Maximum concentration (1-hr, ppm) 0.049 0.045 0.042
Number of days state standard exceeded 0 0 0
Sources: CARB 2012; EPA 2012
Notes: Ambient air quality data obtained from the Santa Rosa-5th Street air monitoring station. PM10 monitoring data for years 2009 and
2010 was not available for this monitoring station.
(μg/m3)=micrograms per cubic meter
ppm= parts per million
N/A=data not available
Attainment Status for Criteria Air Pollutants
Both the federal and state clean air laws require the identification and designation of areas that
either do or do not meet ambient air quality standards. An attainment designation for an area
signifies that pollutant concentrations did not violate the standard for that pollutant in that area. A
nonattainment designation indicates that a pollutant concentration violated the standard at least
once, excluding those occasions when a violation(s) was caused by an exceptional event, as
defined in the criteria. Areas for which there is insufficient data available are designated unclassified.
The SFBAAB, which encompasses the Specific Plan area, is currently designated as a
nonattainment area for state and national ozone standards and state particulate matter
ambient air quality standards. The SFBAAB’s current attainment status with regard to federal and
state ambient air quality standards is summarized in Table 3.3-3.
North Santa Rosa Station Area Specific Plan City of Santa Rosa
Draft Environmental Impact Report April 2012
3.3-103.3 AIR QUALITY
TABLE 3.3-3
FEDERAL AND STATE AMBIENT AIR QUALITY ATTAINMENT STATUS FOR SFBAAB
Pollutant Federal State
1-hour Ozone (O3) – Nonattainment
8-hour Ozone (O3) Nonattainment Nonattainment
Coarse Particulate Matter (PM10) Unclassified Nonattainment
Fine Particulate Matter (PM2.5) Nonattainment Nonattainment
Carbon Monoxide (CO) Attainment/Maintenance Attainment
Nitrogen Dioxide (NO2) Unclassified/Attainment Attainment
Sulfur Dioxide (SO2) Attainment Attainment
Sources: CARB 2011a, 2011b; EPA 2011
Toxic Air Contaminants
In addition to the criteria air pollutants listed above, another group of pollutants, commonly
referred to as toxic air contaminants (TACs) or hazardous air pollutants, can result in health
effects that can be quite severe. Many TACs are confirmed or suspected carcinogens, or are
known or suspected to cause birth defects or neurological damage. Secondly, many TACs can
be toxic at very low concentrations. For some chemicals, such as carcinogens, there are no
thresholds below which exposure can be considered risk-free.
Industrial facilities and mobile sources are significant sources of TACs. Sources of TACs go
beyond industry. Various common urban facilities also produce TAC emissions, such as gasoline
stations (benzene), hospitals (ethylene oxide), and dry cleaners (perchloroethylene). Automobile
exhaust also contains TACs such as benzene and 1,3-butadiene. Most recently, diesel
particulate matter was identified as a toxic air contaminant by CARB. Diesel PM differs from
other TACs in that it is not a single substance but rather a complex mixture of hundreds of
substances. BAAQMD research indicates that mobile-source emissions of diesel PM, benzene,
and 1,3-butadiene represent a substantial portion of the ambient background risk from TACs in
the SFBAAB.
The health effects associated with TACs are quite diverse and generally are assessed locally,
rather than regionally. TACs can cause long-term health effects such as cancer, birth defects,
neurological damage, asthma, bronchitis, or genetic damage, or short-term acute affects such
as eye watering, respiratory irritation (a cough), running nose, throat pain, and headaches. For
evaluation purposes, TACs are separated into carcinogens and non-carcinogens based on the
nature of the physiological effects associated with exposure to the pollutant. Carcinogens are
assumed to have no safe threshold below which health impacts would not occur. Non-
carcinogenic substances differ in that there is generally assumed to be a safe level of exposure
below which no negative health impact is believed to occur. These levels are determined on a
pollutant-by-pollutant basis (BAAQMD 2011a).
Land Use Compatibility with TAC Emission Sources
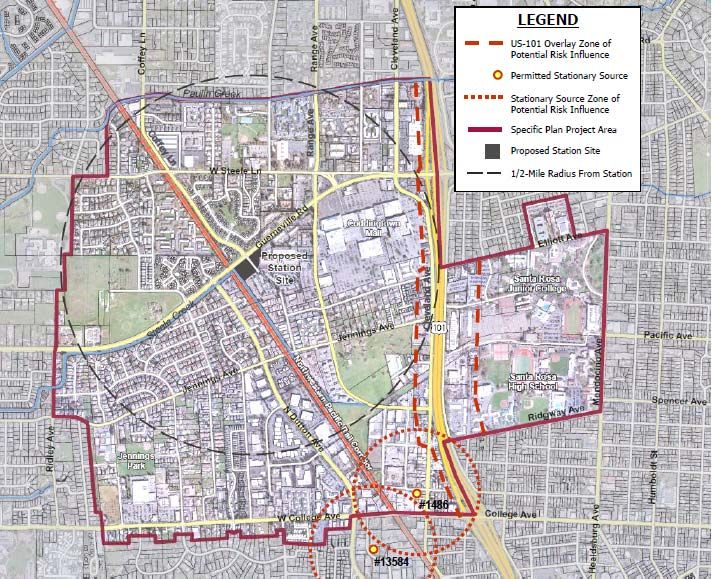
The location of a development project is a major factor in determining whether it will result in
localized air quality impacts. The potential for adverse air quality impacts increases as the distance
between the source of emissions and members of the public decreases. While impacts on all
members of the population should be considered, impacts on sensitive receptors, such as schools
City of Santa Rosa North Santa Rosa Station Area Specific Plan
April 2012 Draft Environmental Impact Report
3.3-113.3 AIR QUALITY
or hospitals, are of particular concern. Table 3.3-9 below provides a summary of the stationary
sources identified in the Specific Plan area and sources within 1,000 feet of the Specific Plan area,
as well as the cancer risk and PM2.5 concentration associated with these sources.
In 2005, CARB published an informational guide entitled Air Quality and Land Use Handbook: A
Community Health Perspective. The purpose of this guide is to provide information to aid local
jurisdictions in addressing issues and concerns related to the placement of sensitive land uses
near major sources of air pollution. The handbook includes recommended separation distances
for various land uses, summarized in Table 3.3-4. However, these recommendations are not site-
specific and should not be interpreted as defined “buffer zones.” It is also important to note that
the recommendations of the handbook are advisory and need to be balanced with other state
and local policies (CARB 2005).
TABLE 3.3-4
RECOMMENDATIONS ON SITING NEW SENSITIVE LAND USES
NEAR AIR POLLUTANT SOURCES
Source Category Advisory Recommendations
• Avoid siting new sensitive land uses within 500 feet of a freeway, urban roads
Freeways and High-Traffic Roads
with 100,000 vehicles/day, or rural roads with 50,000 vehicles per day.
• Avoid siting new sensitive land uses within 1,000 feet of a distribution center
(that accommodates more than 100 trucks per day, more than 40 trucks with
operating transport refrigeration units per day, or where TRU unit operations
Distribution Centers exceed 300 hrs/week).
• Take into account the configuration of existing distribution centers and avoid
locating residences and other new sensitive land uses near entry and exit points.
• Avoid siting new sensitive land uses within 1,000 feet of a major service and
Rail Yards maintenance rail yard.
• Within 1 mile of a rail yard, consider possible siting limitations and mitigation.
• Avoid siting of new sensitive land uses immediately downwind of ports in the
Ports most heavily impacted zones. Consult local air districts or CARB on the status of
pending analyses of health risks.
• Avoid siting new sensitive land uses immediately downwind of petroleum
Refineries refineries. Consult with local air districts and other local agencies to determine
an appropriate separation.
Chrome Platers • Avoid siting new sensitive land uses within 1,000 feet of a chrome plater.
• Avoid siting new sensitive land uses within 300 feet of any dry cleaning
Dry Cleaners Using operation. For operations with two or more machines, provide 500 feet. For
Perchloroethylene operations with three or more machines, consult with the local air district.
• Do not site new sensitive land uses in the same building with perc. dry cleaners.
• Avoid siting new sensitive land uses within 300 feet of a large gas station
Gasoline Dispensing Facilities (defined as a facility with a throughput of 3.6 million gallons per year or greater).
A 50-foot separation is recommended for typical gas dispensing facilities.
Source: CARB 2005
Notes: Recommendations are advisory, are not site-specific, and may not fully account for future reductions in emissions, including
those resulting from compliance with existing/future regulatory requirements, such as reductions in diesel-exhaust emissions anticipated
to occur with continued implementation of CARB’s Diesel Risk Reduction Plan.
North Santa Rosa Station Area Specific Plan City of Santa Rosa
Draft Environmental Impact Report April 2012
3.3-123.3 AIR QUALITY
Odors
Typically, odors are generally regarded as an annoyance rather than a health hazard. However,
manifestations of a person’s reaction to foul odors can range from the psychological (i.e.
irritation, anger, or anxiety) to the physiological, including circulatory and respiratory effects,
nausea, vomiting, and headache. The ability to detect odors varies considerably among the
population and overall is quite subjective. Some individuals have the ability to smell very minute
quantities of specific substances; others may not have the same sensitivity but may have
sensitivities to odors of other substances. In addition, people may have different reactions to the
same odor and in fact an odor that is offensive to one person may be perfectly acceptable to
another (e.g., a fast-food restaurant).
Quality and intensity are two properties present in any odor. The quality of an odor indicates the
nature of the smell experience. For instance, if a person describes an odor as flowery or sweet,
then the person is describing the quality of the odor. Intensity refers to the strength of the odor.
For example, a person may use the word strong to describe the intensity of an odor. Odor
intensity depends on the odorant concentration in the air. When an odorous sample is
progressively diluted, the odorant concentration decreases. As this occurs, the odor intensity
weakens and eventually becomes so low that the detection or recognition of the odor is quite
difficult. At some point during dilution, the concentration of the odorant reaches a detection
threshold. An odorant concentration below the detection threshold means that the
concentration in the air is not detectable by the average human.
Neither the state nor the federal governments have adopted rules or regulations for the control of
odor sources. BAAQMD Regulation 7 specifically addresses odors by establishing general
limitations on odorous substances and specific emission limitations on certain odorous compounds.
Any actions related to odors would be based on citizen complaints to local governments and the
BAAQMD. No major sources of odors have been identified in the Specific Plan area.
Existing Nearby Sensitive Receptors
One of the most important reasons for air quality standards is the protection of those members of
the population who are most sensitive to the adverse health effects of air pollution, termed
“sensitive receptors.” The term “sensitive receptors” refers to specific population groups as well
as the land uses where individuals would reside for long periods. Commonly identified sensitive
population groups are children, the elderly, the acutely ill, and the chronically ill. Commonly
identified sensitive land uses would include facilities that house or attract children, the elderly,
people with illnesses, or others who are especially sensitive to the effects of air pollutants.
Residential dwellings, schools, parks, playgrounds, child-care centers, convalescent homes, and
hospitals are examples of sensitive land uses. Sensitive land uses located in the Specific Plan
area consist primarily of residential dwellings. Other sensitive land uses located in the Specific
Plan area include, but are not limited to, neighborhood parks, educational facilities, senior living
facilities, and places of worship.
3.3.2 REGULATORY FRAMEWORK
Air quality with respect to criteria air pollutants and toxic air contaminants in the SFBAAB is
regulated by such agencies as the BAAQMD, CARB, and the EPA. Each of these agencies
develops rules, regulations, policies, and/or goals to attain the goals or directives imposed
through legislation. Although the EPA regulations may not be superseded, both state and local
regulations may be more stringent.
City of Santa Rosa North Santa Rosa Station Area Specific Plan
April 2012 Draft Environmental Impact Report
3.3-133.3 AIR QUALITY
FEDERAL
U.S. Environmental Protection Agency
At the federal level, the EPA has been charged with implementing national air quality programs.
The EPA’s air quality mandates are drawn primarily from the federal Clean Air Act (CAA), which
was enacted in 1963. The CAA was amended in 1970, 1977, and 1990.
The CAA required the EPA to establish primary and secondary national ambient air quality
standards (NAAQS), which are available at http://www.arb.ca.gov/research/aaqs/aaqs2.pdf. The
CAA also required each state to prepare an air quality control plan referred to as a State
Implementation Plan (SIP). The CAA Amendments of 1990 (CAAA) added requirements for states
with nonattainment areas to revise their SIPs to incorporate additional control measures to reduce
air pollution. The SIP is periodically modified to reflect the latest emissions inventories, planning
documents, and rules and regulations of the air basins as reported by their jurisdictional agencies.
The EPA has responsibility to review all SIPs to determine conformation to the mandates of the
CAAA and determine if implementation will achieve air quality goals. If the EPA determines a SIP
to be inadequate, a Federal Implementation Plan may be prepared for the nonattainment area
that imposes additional control measures. Failure to submit an approvable SIP or to implement the
plan within the mandated time frame may result in sanctions being applied to transportation
funding and stationary air pollution sources in the air basin (BAAQMD 2011a).
Toxic Air Contaminants
Toxic air contaminants (TACs), or in federal parlance under the CAA, hazardous air pollutants
(HAPs), are pollutants that result in an increase in mortality, a serious illness, or pose a present or
potential hazard to human health. Health effects of TACs may include cancer, birth defects,
and immune system and neurological damage.
TACs can be separated into carcinogens and non-carcinogens based on the nature of the
physiological degradation associated with exposure to the pollutant. For regulatory purposes,
carcinogens are assumed to have no safe threshold below which health impacts will not occur.
Non-carcinogenic TACs differ in that there is a safe level in which it is generally assumed that no
negative health impacts would occur. These levels are determined on a pollutant-by-pollutant basis.
It is important to understand that TACs are not considered criteria air pollutants and thus are not
specifically addressed through the setting of ambient air quality standards. Instead, the EPA and
CARB regulate HAPs and TACs, respectively, through statutes and regulations that generally
require the use of the maximum or best available control technology (MACT and BACT) to limit
emissions. These in conjunction with additional rules set forth by the BAAQMD establish the
regulatory framework for TACs (BAAQMD 2011a).
Title III of the CAAA requires the EPA to promulgate National Emissions Standards for Hazardous
Air Pollutants (NESHAPs). The NESHAP may differ for major sources than for area sources of HAPs
(major sources are defined as stationary sources with potential to emit more than 10 tons per
year of any HAP or more than 25 tons per year of any combination of HAPs; all other sources are
considered area sources). The emissions standards are to be promulgated in two phases. In the
first phase (1992–2000), the EPA developed technology-based emission standards designed to
produce the maximum emission reduction achievable. These standards are generally referred to
as requiring maximum achievable control technology (MACT). These federal rules are also
commonly referred to as MACT standards, because they reflect the maximum achievable
control technology. For area sources, the standards may be different, based on generally
North Santa Rosa Station Area Specific Plan City of Santa Rosa
Draft Environmental Impact Report April 2012
3.3-143.3 AIR QUALITY
available control technology. In the second phase (2001–2008), the EPA is required to
promulgate health risk-based emissions standards where deemed necessary to address risks
remaining after implementation of the technology-based NESHAP standards. The CAAA required
the EPA to promulgate vehicle or fuel standards containing reasonable requirements that
control toxic emissions, at a minimum to benzene and formaldehyde. Performance criteria were
established to limit mobile-source emissions of toxics, including benzene, formaldehyde, and 1,3-
butadiene. In addition, Section 219 required the use of reformulated gasoline in selected U.S.
cities (those with the most severe ozone nonattainment conditions) to further reduce mobile-
source emissions (BAAQMD 2011a).
STATE
In 1992 and 1993, CARB requested delegation of authority for the implementation and
enforcement of specified New Source Performance Standards and NESHAPS to the following
local agencies: Bay Area and South Coast Air Quality Management Districts. The EPA’s review of
the State of California’s laws, rules, and regulations showed them to be adequate for the
implementation and enforcement of these federal standards, and the EPA granted the
delegations as requested.
California Air Resources Board
CARB is the agency responsible for coordination and oversight of state and local air pollution
control programs in California and for implementing the California Clean Air Act (CCAA), which
was adopted in 1988. The CCAA requires that all air districts in the state endeavor to achieve
and maintain the California ambient air quality standards (CAAQS) by the earliest practical
date. The act specifies that districts should focus particular attention on reducing the emissions
from transportation and area-wide emission sources, and provides districts with the authority to
regulate indirect sources.
CARB is primarily responsible for developing and implementing air pollution control plans to
achieve and maintain the NAAQS. CARB is primarily responsible for statewide pollution sources
and produces a major part of the SIP. Local air districts are still relied upon to provide additional
strategies for sources under their jurisdiction. CARB combines this data and submits the
completed State Implementation Plan to the EPA.
Other CARB duties include monitoring air quality (in conjunction with air monitoring networks
maintained by air pollution control and air quality management districts), establishing CAAQS
(which in many cases are more stringent than the NAAQS), determining and updating area
designations and maps, and setting emissions standards for new mobile sources, consumer
products, small utility engines, and off-road vehicles (BAAQMD 2011a).
Transport of Pollutants
The California Clean Air Act, Section 39610(a), directs CARB to identify each district in which
transported air pollutants from upwind areas outside the district cause or contribute to a
violation of the ozone standard and to identify the district of origin of transported pollutants. The
information regarding the transport of air pollutants from one basin to another was to be
quantified to assist interrelated basins in the preparation of plans for the attainment of California
ambient air quality standards. Numerous studies conducted by CARB have identified air basins
that are impacted by pollutants transported from other air basins (as of 1993). Among the air
basins affected by air pollution transport from the SFBAAB are the North Central Coast Air Basin,
the Mountain Counties Air Basin, the San Joaquin Valley Air Basin, and the Sacramento Valley Air
City of Santa Rosa North Santa Rosa Station Area Specific Plan
April 2012 Draft Environmental Impact Report
3.3-153.3 AIR QUALITY
Basin. The San Francisco Bay Area Air Basin was also identified as an area impacted by the
transport of air pollutants from the Sacramento region (BAAQMD 2011a).
Toxic Air Contaminants
California regulates TACs primarily through the Tanner Air Toxics Act (AB 1807) and the Air Toxics
Hot Spots Information and Assessment Act of 1987 (AB 2588). The Tanner Act sets forth a formal
procedure for CARB to designate substances as toxic air contaminants. This includes research,
public participation, and scientific peer review before CARB can designate a substance as a
TAC. To date, CARB has identified over 21 TACs, and adopted the EPA’s list of hazardous air
pollutants as TACs. Most recently, diesel exhaust particulate was added to the CARB list of toxic
air contaminants. Once a TAC is identified, CARB then adopts an Airborne Toxics Control
Measure for sources that emit that particular TAC. If there is a safe threshold for a substance at
which there is no toxic effect, the control measure must reduce exposure below that threshold. If
there is no safe threshold, the measure must incorporate BACT to minimize emissions. None of the
TACs identified by CARB have a safe threshold. The Hot Spots Act requires that existing facilities
that emit toxic substances above a specified level:
• Prepare a toxic emission inventory;
• Prepare a risk assessment if emissions are significant;
• Notify the public of significant risk levels;
• Prepare and implement risk reduction measures.
CARB has adopted diesel exhaust control measures and more stringent emission standards for
various on-road mobile sources of emissions, including transit buses, and off-road diesel
equipment (e.g., tractors, generators). In February 2000, CARB adopted a new public transit bus
fleet rule and emission standards for new urban buses. These new rules and standards provide for
(1) more stringent emission standards for some new urban bus engines beginning with 2002
model year engines, (2) zero-emission bus demonstration and purchase requirements applicable
to transit agencies, and (3) reporting requirements with which transit agencies must demonstrate
compliance with the urban transit bus fleet rule. Upcoming milestones include the low sulfur
diesel fuel requirement, and tighter emission standards for heavy-duty diesel trucks (2007) and
off-road diesel equipment (2011) nationwide. Over time, the replacement of older vehicles will
result in a vehicle fleet that produces substantially less TACs than under current conditions.
Mobile-source emissions of TACs (e.g., benzene, 1-3-butadiene, diesel PM) have been reduced
significantly over the last decade and will be reduced further in California through a progression
of regulatory measures (e.g., low emission vehicles/clean fuels and Phase II reformulated
gasoline regulations) and control technologies. With implementation of CARB’s Risk Reduction
Plan, it is expected that diesel PM concentrations will be reduced by 75 percent in 2010 and 85
percent in 2020 from the estimated year 2000 level. Adopted regulations are also expected to
continue to reduce formaldehyde emissions from cars and light-duty trucks. As emissions are
reduced, it is expected that risks associated with exposure to the emissions will also be reduced
(BAAQMD 2011a).
LOCAL
Bay Area Air Quality Management District
BAAQMD attains and maintains air quality conditions in the SFBAAB through a comprehensive
program of planning, regulation, enforcement, technical innovation, and promotion of the
understanding of air quality issues. BAAQMD’s clean air strategy includes the preparation of
plans for the attainment of ambient air quality standards, adoption and enforcement of rules
North Santa Rosa Station Area Specific Plan City of Santa Rosa
Draft Environmental Impact Report April 2012
3.3-163.3 AIR QUALITY
and regulations concerning sources of air pollution, and issuance of permits for stationary
sources of air pollution. The BAAQMD also inspects stationary sources of air pollution and
responds to citizen complaints, monitors ambient air quality and meteorological conditions, and
implements programs and regulations required by the Clean Air Act, Clean Air Act
Amendments, and California Clean Air Act.
In 2009, the BAAQMD released the update to its CEQA Guidelines. This is an advisory document
that provides lead agencies, consultants, and project applicants with uniform procedures for
addressing air quality in environmental documents. The handbook contains the following
applicable components (BAAQMD 2011a):
• Criteria and thresholds for determining whether a project may have a significant adverse
air quality impact;
• Specific procedures and modeling protocols for quantifying and analyzing air quality
impacts;
• Methods available to mitigate air quality impacts;
• Information for use in air quality assessments and environmental documents that will be
updated more frequently such as air quality data, regulatory setting, climate, and
topography.
Rules and Regulations
The BAAQMD develops regulations to improve air quality and protect the health and welfare of
Bay Area residents and their environment. BAAQMD rules and regulations most applicable to the
project area include, but are not limited to, the following:
• Regulation 2: Specifies the requirements for authorities to construct and permits to
operate stationary sources of emissions.
• Regulation 2, Rule 2: New Source Review. Applies to new or modified sources. Rule 2
contains requirements for best available control technology and emission offsets. Rule 2
implements federal New Source Review and Prevention of Significant Deterioration
requirements.
• Regulation 2, Rule 5: New Source Review of Toxic Air Contaminants. Applies
preconstruction permit review to new and modified sources of toxic air contaminants;
contains project health risk limits and requirements for toxics best available control
technology.
• Regulation 6, Rule 2: Commercial Cooking Equipment. The purpose of this rule is to
reduce emissions from commercial cooking equipment, including highly utilized
charbroilers in restaurants.
• Regulation 6, Rule 3: Wood-burning Devices. The purpose of this rule is to limit emissions of
particulate matter and visible emissions from wood-burning devices, such as fireplaces
and stoves. This rule also bans the burning of wood or firelogs in household fireplaces and
woodstoves during wintertime Spare the Air health advisories and also prohibits the sale
and installation of non-EPA-certified wood-burning devices in new construction or
remodels.
City of Santa Rosa North Santa Rosa Station Area Specific Plan
April 2012 Draft Environmental Impact Report
3.3-17You can also read