MICHIGAN REDISTRICTING DRAFT MAP ANALYSIS - PLEASE SEE LATEST DRAFT AT IPPSR.MSU.EDU/REDISTRICTING
←
→
Page content transcription
If your browser does not render page correctly, please read the page content below
I N S T I T U T E F O R P U B L I C P O L I C Y
A N D S O C I A L R E S E A R C H

MICHIGAN REDISTRICTING
DRAFT MAP ANALYSIS

 PLEASE SEE LATEST DRAFT AT IPPSR.MSU.EDU/REDISTRICTING

 WITH SUPPORT FROM
 THE JOYCE FOUNDATION

 OCTOBER 2021
EXECUTIVE SUMMARY
Michigan has embarked on an historic redrawing of boundaries for its 13 U.S. House, 38 Senate and
110 House districts. Redistricting was entrusted this year to 13 members of the Michigan Independent
Redistricting Commission (MICRC) randomly selected from a pool of qualified applicants.
This report provides a quantitative analysis of the collaborative Draft Proposed maps, as those maps
were collaboratively drawn by the MICRC and released on Oct. 11, 2021. For the collaborative maps,
the Commission voted to release four congressional maps, three Michigan Senate maps, and three
Michigan House maps. These Draft Proposed maps will be subject to a round of public hearings to be
conducted around the state from Wednesday, Oct. 20 to Wednesday, Oct. 27.
In this report, the Institute for Public Policy and Social Research at Michigan State University analyzes
these 10 collaborative Draft Proposed maps, each bearing a number identifier and the names of trees
found in Michigan’s forests, orchards and backyards.
This report offers a powerful tool and a guide the Commission and the public can use to compare and
evaluate each of the maps to weigh the benefits of adhering closer to some criteria over others, and
how maps can change characteristics as they change shape and move toward different metrics. The
unique feature is a comparison of the Draft Proposed maps against maps submitted by the public as
well as computer-generated maps, enabling an assessment of where MICRC maps stand out.
The report also includes a brief description of answers to survey questions posed to Michigan citizens,
and to Michigan policy leaders who work in state politics, about their understanding of the MICRC and
likelihood of engaging with the commission. Michigan’s citizens seem positive about the MICRC and
its goal of preventing gerrymandering and bringing about more fairness in new districts and elections.
This review doesn’t evaluate whether a complete map is “good” or “bad;” it proposes a battery of
objective quantitative analyses reflecting how each Proposed Draft map performs on each of the seven
criteria specified in a modification of the Michigan Constitution in 2018.
The report, based on analysis to date, makes a set of observations due immediate consideration:
 • Some maps appear to be incomplete, with a number U.S. Census blocks not assigned to
 districts, a finding that can be repaired with revision.
 • Population deviations from perfect equality may need justification.
 • Draft plans pursue an unusual path to compliance with the Voting Rights Act, maximizing
 districts that are near 40 percent African-American population, but below majority.
 • It isn’t yet clear whether the MICRC has followed a systematic way to choose among
 Communities of Interest.
 • Most Commission maps show a partisan lean toward Republicans on most measures, but
 that is likely due to the geographic concentration of Democrats rather than Commission
 intent. Maps look well within the range of scores for the public- and computer-generated
 maps, with a few seeming to minimize any partisan lean.
Some maps also await analysis and some measures are not yet available. Please see
ippsr.msu.edu/redistricting as analysis is updated. Under MICRC mapping guidelines, a final vote is
expected Thursday Dec. 30, 2021. In addition to this initial analysis, IPPSR plans a full report of
Michigan’s new redistricting initiative in 2022.
MICHIGAN REDISTRICTING PAGE 2
INTRODUCTION
As Michigan’s Independent Citizens Redistricting Commission embarked on its history making
work, Michigan State University’s Institute for Public Policy and Social Research helped provide
training and technical assistance to the fledging commission. In all its work, the Institute for Public
Policy and Social Research (IPPSR) applies research to pressing public policy issues and builds
problem-solving relationships between the academic and policymaking communities. For the
Michigan Independent Citizens Redistricting Commission (MICRC) and its staff, IPPSR has
played a role in promoting and conducting research on redistricting and related public policy
issues, has provided survey research, and produced education and training programs.
In this role, IPPSR worked alongside the University of Michigan’s Center for Local, State and
Urban Policy in the Ford School of Public Policy at the University of Michigan (CLOSUP). All work
was under the direction of IPPSR Director Dr. Matt Grossmann and CLOSUP Executive Director
Tom Ivacko. This work was undertaken with the support of The Joyce Foundation, which invests
in evidence-informed public policies and strategies to advance racial equity and economic mobility
in the nation’s Great Lakes heartland states.
Before the Redistricting Commission began drawing any lines, IPPSR and CLOSUP were
involved in orienting the Commission. The first day, on the afternoon of Sept. 17, 2020 the
Commission heard about the Basics of Article IV, Section 6 of the Michigan Constitution. That
article and section held the constitutional mandate giving the MICRC the exclusive authority to
redistrict the state. The discussion included information on process and especially the mapping
criteria, the constitution’s seven priorities – in order – for proposing and adopting a redistricting
plan. As part of that session, the panel presentation brought together Dr. John Chamberlin,
professor emeritus of public policy, University of Michigan, and Dr. Jon Eguia, professor of
economics, MSU. Dr. Grossmann moderated the session.
The following morning, Ivacko moderated a discussion on redistricting history and the Voting
Rights Act. That panel included Ellen Katz, professor of law, University of Michigan Law School,
and Justin Levitt, professor of law, Loyola Law School.
Dr. Grossmann moderated a second panel presentation that day on redistricting in Michigan. The
panelists were Chris Thomas, former director of the Michigan Bureau of Elections, and John
Pirich, veteran elections attorney and faculty member, Michigan State University Law School.
A third session, on Michigan demographics and the U.S. Census, took place just a month later.
In that session, the Redistricting Commission heard from Michigan State Demographer Eric
Guthrie; Lisa Neidert, retired data archivist from the U of M Population Studies Center and Noah
Durst, an MSU assistant professor of urban and regional planning whose expertise focuses on
population measures of housing and location. Commissioners heard about Michigan’s diversity
of people, economic sectors and regional interests, especially as those are measured through the
U.S. Census. The goal: to give redistricting commissioners the knowledge needed to identify most
likely Michigan locations for public hearings and to understand population dynamics.
The following spring brought a series of four panels outlining and explaining redistricting duties
as they relate to the Voting Rights Act, Communities of Interest and Map-Drawing. These duties
are essential to complying with laws and constitutional requirements of Michigan’s newly enacted
redistricting mandates calling for a fairly drawn, citizen-led and transparent process to map
boundaries for the state Congressional, House and Senate district lines.

MICHIGAN REDISTRICTING PAGE 3
Three experts were scheduled to speak about the Voting Rights Act details and requirements.
Those specialists were Leah Aden, deputy director of litigation, NAACP Legal Defense and
Educational Fund, Inc.; David J. Becker, executive director and founder, Center for Election
Innovation & Research and Michael Li, senior counsel, Brennan Center for Justice. IPPSR
Director Grossmann moderated.
A second spring session featured a panel of experts who described and defined Communities of
Interest for the MICRC work. Those specialists were Mariana C. Martine, Director of Civic
Engagement Initiatives, Michigan Nonprofit Association; Susan Smith, Vice President –
Advocacy, League of Women Voters of Michigan. Ivacko, CLOSUP executive director,
moderated.
In a highly interactive presentation, IPPSR then brought together software expertise, a
demographer and political scientists to lead the discussion of how maps would ultimately be
drawn and the challenges in outlining their shapes and the people who would vote within them.
The first session presented tips about understanding trade-offs among the criteria and difficulties
in the mapping process, led by Grossmann and Guthrie. Members of the Redistricting
Commission were then invited to begin their own map drawing practice of the State of Ohio and
receive feedback from experts on their practice maps.
IPPSR and CLOSUP consulted with experts to review the commissioners’ maps and to conclude
the exercise with a process of collectively practicing map-drawing. Those experts were Dr. Moon
Duchin, professor of mathematics, Tufts University; Dr. Ashton Shortridge, professor, Department
of Geography, Environment and Spatial Sciences, MSU; Dr. Corwin Smidt, interim director,
Department of Political Science, MSU; Chamberlin, of the University of Michigan; Ivacko of
CLOSUP; Dr. Eguia. State Demographer Guthrie and Dr. Grossmann of IPPSR led the collective
practice mapping process of Ohio congressional districts.
In the fall of 2021, IPPSR, with CLOSUP, helped produce three online webinars sharing resources
on redistricting and communities of interest (COIs). Recordings of these events, open to the
public, illuminated the importance of public input, data collection and aggregation and how, even
as preliminary redistricting commission maps were made available for public hearings, members
of the public were still invited and empowered to make their views known.
From the start, IPPSR helped to prepare and compile -- in conjunction with the Michigan
Department of State, which oversees elections and redistricting within Michigan, CLOSUP and
the Princeton Gerrymandering Project, -- a set of publicly available Commissioner Orientation and
Resource Materials. These materials outlined an initial agenda for the commission’s convening,
constitutional language setting forth required redistricting criteria, hands-on mapping resources,
draft timelines for meetings and decision-making and a glossary of terms.
In 2021, Michigan State University’s Institute for Public Policy and Social Research was the
recipient of a two-year, $250,000 grant extended from The Joyce Foundation of Chicago.
The grant engaged IPPSR to provide training and technical assistance to the Michigan
Independent Citizens Redistricting Commission. IPPSR was also to evaluate the state’s first
redistricting process under the MICRC.
Through the life of the two-year grant, IPPSR is working with the University of Michigan’s Center
for Local, State, and Urban Policy, sharing resources, conducting educational programming and
evaluating the redistricting process. This report is the preliminary version of the evaluation. In
addition to updating this report, IPPSR and CLOSUP will provide a final report on the full
MICHIGAN REDISTRICTING PAGE 4
redistricting process in 2022. This report is designed to provide information and materials that the
Commission and the public can still use now before voting on final maps.
IPPSR is engaging with Dr. Eguia, lead author of this report, to conduct the evaluation of
preliminary maps.
We have also used materials made public by Dr. Duchin’s Metric Geometry and Gerrymandering
Group (MGGG Redistricting Lab) at Tisch College of Tufts University, which include many metrics
and scores for the MICRC plans, the plans submitted by the public, and randomly generated
alternative plans.
IPPSR also provided race-of-candidate data from Dr. Eric Gonzales Juenke for use in the
Commission’s Voting Rights Act analysis by Dr. Lisa Handley, president of Frontier International
Consulting, an election consulting firm.
Under the US Constitution, Congressional and Legislative districts must be redrawn every 10
years upon completion of a new U.S. Census. The Voters Not Politicians amendment approved
by Michigan voters in 2018 empowered a commission randomly selected from a pool of pre-
qualified applicants to draw the boundaries outlining the state’s U.S House, state Senate and
House of Representative districts.
The constitutionally revised task that had traditionally been overseen by Michigan’s Legislature
and governor instead moved into the hands of the MICRC – constituted of four people aligned
with the Democratic Party, four identified as Republicans and five members who claimed
allegiance to no specific party.
This effort was complicated by the COVID pandemic and associated delay in receiving U.S.
Census data. This redistricting will be written about, evaluated, tested, retested and challenged
in the coming months and years – potentially decades – as Michigan and its populace, policy and
politics follow this new path to drawing the boundaries from which voters will cast their ballots.
Our full evaluation of the Commission and its final maps will come in the summer of 2022.
We are indebted to The Joyce Foundation, to postdoctoral fellow Christian Cox at the Jackson
Center for Global Affairs at Yale University, to IPPSR Director Matt Grossmann and CLOSUP
Director Tom Ivacko, to Dr. Duchin and her team at MGGG, to MICRC Director Suann
Hammersmith and staff, and to all those at Michigan State University and the University of
Michigan who contributed to this informative and educational effort, especially Cindy Kyle, Bonnie,
Roberts, Nick Pigeon, Julian Trevino, Natalie Harmon and Lia Bergin.

MICHIGAN REDISTRICTING PAGE 5
LEAD AUTHOR

Jon X. Eguia, Ph.D., is a Professor of Economics and (by
courtesy) of Political Science at Michigan State University.
He joined Michigan State in 2014. He has also worked at
New York University the University of Bristol and at Harvard
University. He serves as an Associate Editor for the Journal
of the European Economic Association. His expertise is in
Collective Choice, Institutional Design and Political
Economy. His work on partisan fairness in redistricting is
forthcoming in the Election Law Journal. He earned his
doctorate in Social Sciences at Caltech in 2007

MICHIGAN REDISTRICTING PAGE 6
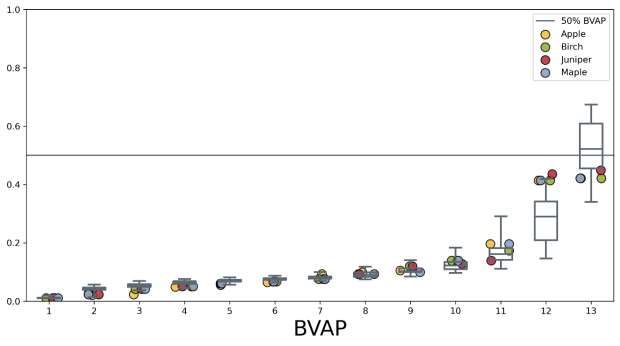
TABLE OF CONTENTS
PART I About This Report

PART II The Seven Constitutional Criteria

PART III Analysis of Proposed Draft Maps for Michigan’s Congressional Districts

PART IV Analysis of Proposed Draft Maps for Michigan’s State Senate Districts

PART V Analysis of Proposed Draft Maps for Michigan’s State House Districts

PART VI Assessing Michigan’s New Redistricting Process

PART VII Recommendations

PART VIII Michigan’s Redistricting History

MICHIGAN REDISTRICTING PAGE 7
PART I. ABOUT THIS REPORT
This report provides a quantitative analysis of the collaborative Proposed Draft maps for Michigan
congressional districts, for Michigan Senate districts, and for Michigan House districts, released
to the public by the Michigan Independent Citizen Redistricting Commission consideration during
a second round of public hearings to be conducted from Oct. 20, 2021 to Oct. 27, 2021.
On October 11, the Commission voted to release four congressional maps, three Michigan Senate
maps, and three Michigan House maps, all drawn collaboratively by commissioners. We analyze
these 10 collaborative Proposed Draft maps. The Commission assigned each plan a name, and
a codename based on a tree native to Michigan. We refer to the maps by these codenames. Here
is a table with the maps and their names, obtained from the Commission’s website at
https://www.michigan.gov/micrc/.

 TABLE. List of Collaborative Proposed Maps
 Type of District Codename Plan Number
 State Senate Elm 199
 State Senate Cherry 220
 State Senate Spruce 226
 State House Peach 228
 State House Oak 229
 State House Pine 227
 Congressional Apple 201
 Congressional Birch 230
 Congressional Maple 219
 Congressional Juniper 218

Each Commissioner also had an opportunity to submit an individually drawn map of each type
(Congressional, state House, state Senate) of district, but we do not analyze the individual maps
here. To inform the public in a timely manner, this first report on the Proposed Draft maps contains
the analysis that was available on time for the first hearing of the second round of public hearings.
We will subsequently complement this report with additional analyses. The report is thus intended
as a “living document”, updated as more content becomes available. The latest version of this
report is available at: ippsr.msu.edu/redistricting
A complete redistricting plan must divide the entire area of the state into districts, so that each
point in the geography of the state is in one — and only one — district in each of three maps:
districts for the U.S. Congress, for the state House, and for the state Senate. The Michigan
Constitution, Art IV, § 6(13) states that in proposing and adopting each redistricting plan, the
Commission shall abide by seven criteria, ranked in order of priority.

MICHIGAN REDISTRICTING PAGE 8
We first check that each proposed map is a complete redistricting map that assigns each place
of residency to exactly one district. We then assess each of the collaborative Proposed Draft
maps on the basis of these seven criteria. We assess the congressional district maps in Part III;
the Senate district maps in Part IV; and the House district maps in Part V. For each type of map,
and for each criterion, we describe quantitative measures of performance. Then, we report how
each map performs according to each of these measures. Our analysis is based on the map
boundaries reported on the Commission website, though the Commission is using different
software so some variations are possible.
For comparison, we report the distribution of scores across all maps in what we term the “Public
Ensemble,” maps submitted by the public on the MICRC online portal, and what we term the
“Computational Ensemble,” a set of 100,000 computer-generated maps. For each type of map,
and for each criterion, we describe quantitative measures of performance on the basis of this
criterion. The Commission has reviewed measures of its maps’ performance, but it has compared
them against a theoretical baseline, rather than the range of maps submitted by the public and a
range of computer-generated maps.
The scores on some of our measures are easy to interpret directly. For instance, if we have a
measure of “contiguity” (Criteria Two) that assigns a value “1” if each district is connected in one
piece, and a value of “0” if it is not. If a proposed map scores a “1” on this measure, then we know
that all the districts on this map are connected. Other measures follow more complicated
mathematical formulas, and any given score is harder to interpret in isolation. Comparing the
performance of the MICRC draft maps to both the Public Ensemble and the Computational
Ensemble makes scores easier to interpret.
For each of the three types of districts (Congressional, Michigan Senate, and Michigan House),
the Public Ensemble is the collection of all complete and sufficiently close to valid maps of districts
submitted by the public through the MICRC’s submission portal. at https://www.michigan-
mapping.org by Oct. 1, 2021.1 The Public Ensemble of Congressional district maps contains 112
maps; the Public Ensemble of Senate maps contains seven maps. Unfortunately, all Michigan
House plans submitted by the public have a population difference across districts greater than
25%, so we are not able to include any to construct the Public Ensemble for the state House. In
other words, no citizen succeeded in drawing 110 Michigan House districts of near equal
population (partially because many maps were drawn before the new Census data was available).
For each of three types of districts, the Computational Ensemble contains 100,000 maps of
districts of this type, created by the MGGG Redistricting Lab using the Recombination (ReCom)
algorithm. All the computationally generated maps are within 1% of the ideal district population,
and attempt to respect county boundaries, but are not designed to follow any other criteria. This
algorithm starts with a starting map, also known as a “seed” map. From that start, the algorithm
constructs new maps following a random path (what we know in statistics as a “Markov Chain
Monte Carlo” or “MCMC”) that at each step transforms a given map into the next map. At each
step of this path, the algorithm randomly selects two adjacent districts in the current map, it

1 MGGG deemed a map sufficiently close to valid if it leaves unassigned no more than five Census’ Voting
Tabulation Districts (all must be assigned); the maximum population deviation from the ideal equal
population across its districts is below 5% (it must be much lower than that), and if it violates contiguity, it
is only in a minor way.
MICHIGAN REDISTRICTING PAGE 9
merges them, and then it re-splits the merger into two new districts, thus generating a new map.2
At each step, the change from the prior map to the next one is therefore small.
In this way, our report offers a powerful tool and a guide that the public can use to compare and
evaluate each of the maps so they can weigh the benefits of adhering closer to some criteria over
others, and how maps can change characteristics as they change shape and move toward
different metrics.
We stress that we do not evaluate whether a complete map is “good” or “bad,” nor do we offer an
opinion as to whether it is legal or illegal under the Michigan Constitution. We leave it up to each
Michigan citizen to decide how each map meets the criteria, and up to jurists and courts to
determine if the maps meet legal tests.
What we hope to offer is a battery of objective quantitative analyses reflecting how each Proposed
Draft map performs on each of the seven criteria specified in the Michigan Constitution.

2 https://mggg.org/uploads/ReCom.pdf
MICHIGAN REDISTRICTING PAGE 10
PART II. THE SEVEN CONSTITUTIONAL CRITERIA
Article IV §6 (13) of the Michigan Constitution instructs that “The commission shall abide by the
following criteria in proposing and adopting each plan, in order of priority:

Criterion A. Districts shall be of equal population as mandated by the United States constitution,
and shall comply with the [Voting Rights Act] and other federal laws.
Criterion B. Districts shall be geographically contiguous. Island areas are considered to be
contiguous by land to the county of which they are a part.
Criterion C. Districts shall reflect the state’s diverse population and communities of interest.
Communities of interest may include, but shall not be limited to, populations that share cultural or
historical characteristics or economic interests. Communities of interest do not include
relationships with political parties, incumbents, or political candidates.
Criterion D. Districts shall not provide a disproportionate advantage to any political party. A
disproportionate advantage to a political party shall be determined using accepted measures of
partisan fairness.
Criterion E. Districts shall not favor or disfavor an incumbent elected official or a candidate.
Criterion F. Districts shall reflect consideration of county, city, and township boundaries.
Criterion G. Districts shall be reasonably compact.” 3

3

http://www.legislature.mi.gov/(S(4kdli1sqztuxeeo1svfgodhz))/mileg.aspx?page=getObject&objectName=
mcl-Article-IV-6
MICHIGAN REDISTRICTING PAGE 11
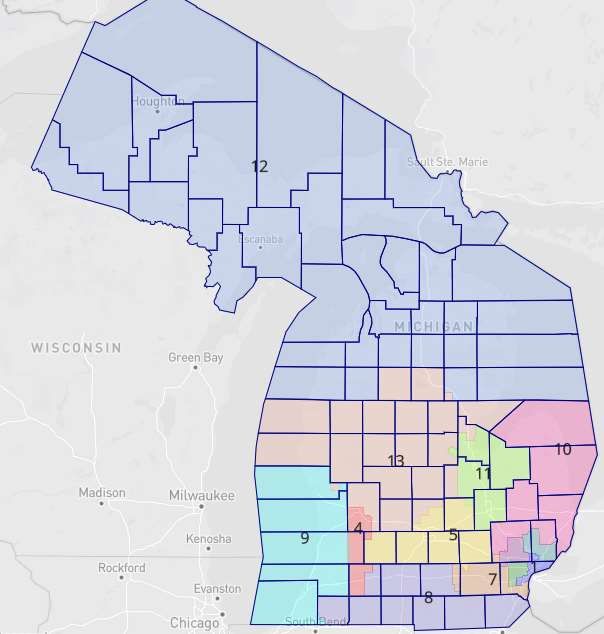
PART III. ANALYSIS OF PROPOSED DRAFT MAPS FOR
 MICHIGAN’S CONGRESSIONAL DISTRICTS
III.1. THE PROPOSED DRAFT CONGRESSIONAL DISTRICT MAPS
On October 11, the MICRC approved the following collaborative Proposed Draft maps for U.S.
Congressional districts, for consideration in the Second Round of Public Hearings (Oct 20th – Oct
27, 2021): 4
 -Plan “Apple”, name “10-05-21 v1 CD DW” (map number #201), on a vote of 13-0.

 Plan Apple
4These maps are available for download here:
https://michigan.mydistricting.com/legdistricting/michigan/comment_links
MICHIGAN REDISTRICTING PAGE 12
-Plan “Juniper”, name “10-07-21 v1 CD AE” (map number #218), on a vote of 13-0.
 Note that the Juniper map appears to not be a valid redistricting plan, as it fails to assign a
 district to all the areas of Michigan. A triangle contained in Census Block 2000 in Ray
 Township (Macomb Co.) is unassigned to any district. This triangle is delimited by 29 Mile
 Rd, Indian Trail, and the line divider between Ray Township and Lenox Township, and
 contains 14 residents.5

 Plan Juniper (incomplete)
5See grid map 7 in Census map
https://www2.census.gov/geo/maps/DC2020/DC20BLK/st26_mi/county/c26099_macomb/DC20BLK_C26099.pdf
MICHIGAN REDISTRICTING PAGE 13
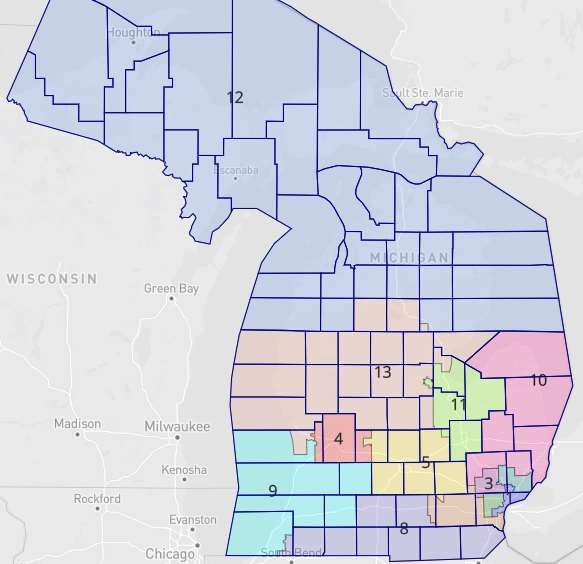
-Plan “Maple”, name “10-07-21 v1 CD DC” (map number #219), on a vote of 13-0.

 7

 Plan Maple

MICHIGAN REDISTRICTING PAGE 14
-Plan “Birch”, name “10-08-21 v1 CD RAS” (map number #230), on a vote of 12-1.
 Note that the Birch map appears to not be a valid redistricting plan, as it fails to assign a
 district to all the areas of Michigan. Plan Birch fails to assign any district to census blocks
 1010 and 1014 in census track 1724 in Oak Park (Oakland County.) These blocks contain
 25 inhabitants. These blocks must be assigned to a district.6

 Plan Birch (incomplete)

6See grid map 35 and Inset J on Census map
https://www2.census.gov/geo/maps/DC2020/DC20BLK/st26_mi/county/c26125_oakland/DC20BLK_C261
25.pdf
MICHIGAN REDISTRICTING PAGE 15
III.2. MEASURING PERFORMANCE ON EACH CRITERIA

CRITERION A: POPULATION BALANCE AND VOTING RIGHTS ACT
 “Districts shall be of equal population as mandated by the United States constitution, and shall
 comply with the voting rights act and other federal laws.”

Understanding the Criterion.
This criterion has three parts. The first is that districts shall be of equal population. The second is
that they shall comply with the Voting Rights Act. And the third is an open-ended guarantee for
future redistricting cycles that complying with criteria B through F will always be secondary to
complying with any future federal law.
With regard to equal population, the population is the total number of inhabitants, as measured
according to the most recent US Census, in this case the 2020 US Census. The Michigan
population according to the 2020 US Census is 10,077,331 inhabitants. Michigan has 13
Congressional districts. So, the ideally equal population is 775,179 inhabitants per district. The
United States Supreme Court has ruled that any deviation from exact equal population must be
“necessary to achieve some legitimate state objective,” but “small differences in the population of
congressional districts” are acceptable if these differences are required to satisfy a state’s
redistricting criteria. 7 In practice, The Court has accepted a deviation as large as 0.79% of
difference between the most and least populous district.8 Therefore, any deviation from perfect
population equality must be required to better satisfy one of the criteria A-F, and such deviation
must be small, probably not much larger than 0.79%. If there is any substantial deviation from
population equality, supporters of one party should not be systematically placed in larger districts.9
With regard to the Voting Rights Act, its Section 2 as amended by Congress, currently prohibits
enacting electoral maps that have “the result of denying a racial or language minority an equal
opportunity to participate in the political process.”10
The “equal opportunity to participate” clause includes an equal opportunity to elect candidates of
their choice. It does not require that, nor is it necessarily satisfied if, members of the relevant
minority are themselves elected in any proportion. For a district to provide to a minority an
opportunity to elect its preferred candidate requires that if the minority overwhelmingly votes for
a candidate, then this candidate wins both the party primary and the general election, given the
standard voting patterns of voters not in this minority. Any such district is a “district of opportunity”
for the relevant minority. This opportunity to elect candidates of their choice does not require –but
it is guaranteed— if the relevant minority is a majority of the population in the district (a so called
“majority-minority” districts).

Measures of performance on Criterion A.
A1. Measure of population inequality.

7
 Karcher v. Daggett, 462 U.S. 740-741 (1983)
8 Tennant v. Jefferson County 567 U.S. 758 (2012)
9 Cox v. Larios, 542 U.S. 947
10 https://www.justice.gov/crt/section-2-voting-rights-act#sec2

MICHIGAN REDISTRICTING PAGE 16
We compute the difference between the most and least populous district, using the formula:

 − 1,

in percentage points.
For convenience, we also report the largest deviation to the ideal population size of a district,
namely,

 − 1,
 775,179
again, in percentage points.

A2. Number of Districts of Opportunity.
The ideal way to quantify a measure of compliance with the Voting Rights Act is to use past
election results by race and precinct, in both primary and general elections, to estimate how many
districts of opportunity for minorities there are there in a new redistricting plan.
To determine whether a new district is a district of opportunity for a given minority, we need to
know which candidate the minority preferred in each past election under consideration, and
whether or not the candidate preferred by the minority won most votes in the primary and in the
general in this district.
We first need to determine which candidate is preferred by the minority under consideration.
Because voting is private, this is not a given. Rather, we infer it from the difference in voting
patterns in precincts with a large share of minority adult population, compared to precincts with a
small such share. Popular methods to estimate this minority vote are the Ecological Inference
methods proposed by Gary King, and other ecological regression method. 11 While the precise
statistical methods vary, the idea is always that if Candidate A’s vote share grows with the share
of minority voting age population, we can infer that minority voters for Candidate A more than
non-minority ones, and under some assumptions, we can quantify how much more.
Having established minorities’ preferences, we could then check whether these candidates won
the most votes in the proposed districts to determine how many districts of opportunity exist in the
proposed redistricting plan. We can then compare this number to the proportion of minority
population. For instance, the “Black Alone” population is 13.7% of the Michigan population, a
percentage that corresponds to approximately two congressional districts. We can also compare
it to the number of opportunity districts in the previous redistricting plan, which is again two
districts. Further, the U.S. Supreme Court has ruled that a pre-condition for the VRA to apply to
any given minority is that this minority is “sufficiently large and geographically compact to
constitute a majority in a single-member district.”12 We can then find how many such
geographically independent minority groups we can construct in Michigan, and we can estimate
whether each of these minority groups lives in a district of opportunity.

11 King, Gary, Martin A. Tanner, and Ori Rosen, eds. Ecological inference: New methodological strategies.
Cambridge University Press, 2004.
12 Thornburg v. Gingles, 478 U.S. 30.

MICHIGAN REDISTRICTING PAGE 17
Unfortunately, the data for this preferred analysis is insufficiently available. In particular, there is
no centralized repository of primary election results by precinct, precluding the preferred analysis.
That means the Commission can estimate how often a minority population has succeeded in
having its preferred candidate win general elections, but is severely limited in assessing whether
a minority party would have succeeded in nominating its preferred candidate in a contested
primary election. The 2018 Democratic primary for Governor included two candidates from the
Detroit area against the eventual winner; group voting determinants in this primary may have had
idiosyncratic determinants that would not match racial group preferences in congressional
primaries.
Nonetheless, following the Commission’s intent, we pursue a simpler analysis that bypasses the
need for the unavailable data by race and precinct. We refer to “determining if a redistricting plan
complies with the Voting Rights Act” by Dr. Handley, presented to the MICRC. Based on an
analysis of four counties (Wayne, Oakland, Genesee, and Saginaw) and on only one election with
a primary on the Democratic side (the 2018 gubernatorial race), plus an additional 12 general
elections with no primary on the Democratic side, she estimates that any district that is at least
40% Black would be likely to elect the Black-preferred candidate, and most districts having a
population at least 35% Black would as well. This analysis was based on Dr. Handley’s finding
that there is significant shared support for the same candidates among black and non-black voters
in many of the Detroit area precincts. This is undoubtedly true in general elections, but there may
be insufficient data to know how true it is in primary elections.
In a simpler analysis that bypasses the need for the unavailable data by race and precinct, we
can use Dr. Handley’s estimates, and simply compute the number of districts in the proposed plan
that are at least 35% or at least 40% Black. If Dr. Handley’s estimates are correct, any 40% Black
district is a district of opportunity and will elect candidates preferred by the Black minority. We
report these measures:
-Number of districts with >50% of their voting age population identifying as Black.
-Number of districts with >40% of their voting age population identifying as Black.
-Number of districts with >35% of their voting age population identifying as Black.
We compare these measures to the number of districts (two) proportional to the Black population
in the state, and to the number of districts with these percentages of Black voting age population
in the previous congressional districts plan.
We do not find a sufficient geographic concentration of Hispanic or Latino, or other minorities, in
any county, to constitute a majority in a geographically compact district.
The data for these measures are from the 2020 US Census.

Results
We present the results of Population Equality in the following table. Each row lists a redistricting
plan for Michigan Senate districts. The first column reports difference between the most and the
least populated district. The second column reports the maximum deviation from the ideal district
population.

MICHIGAN REDISTRICTING PAGE 18
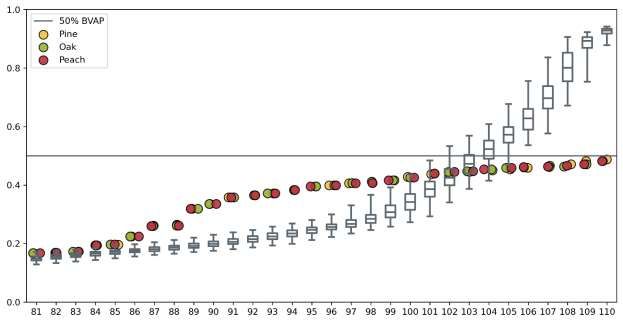
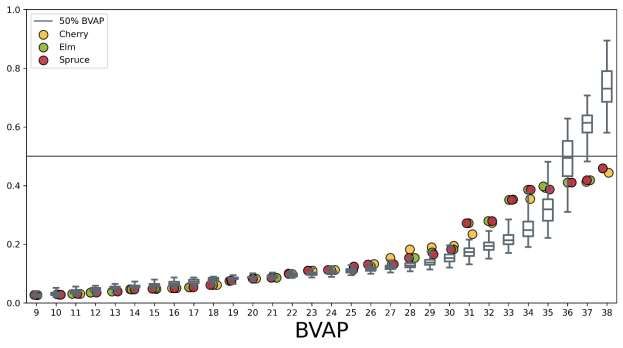
TABLE 1. Population Equality in Congressional maps.
 Pop. difference Max. deviation
 % %
 Plan Apple 0.12% 0.07%
 Plan Juniper 0.20% 0.12%
 Plan Maple 0.28% 0.17%
 Plan Birch 0.27% 0.15%
Note that all these population deviations are small; they are less than half the deviation that the
U.S. Supreme Court has deemed admissible if necessary to pursue appropriate state goals. But
such small deviations require justification. If any of these plans were adopted, the Commission
should explain why these small population differences were necessary to better comply with other
criteria in the state Constitution, such as, for instance, to preserve whole precincts in order to
evaluate VRA claims more accurately (Criterion A), or to preserve Communities of Interest
(Criterion C).
We report the number of districts in which more than 50%, more than 40%, and more than 35%
of the Voting Age Population (VAP) identifies as “Black” or “African-American” (alone), as
computed by the MGGG Lab for this report, in the following table. These numbers serve as proxy
for the number of Black-minority districts of opportunity. As comparison benchmarks, we list the
numbers for the Congressional map in place in the 2012-2021 redistricting cycle, and the number
that would be proportional to the share (13.7%) of the state population that identifies as “Black.”
 TABLE 2. Black minority districts of opportunity in congressional draft proposed maps.
 # > 50% VAP Black # >40% VAP Black # >35% VAP Black
 Plan Apple 0 2 2
 Plan Juniper 0 2 2
 Plan Maple 0 2 2
 Plan Birch 0 2 2
 2012-2021 Official Plan 2 2 2
 Proportional to Pop. 2
The most striking result is that neither of the two majority-minority districts in the previous plans
survives in any of the four proposed plans. The following graph shows the Black share of the
Voting Age Population in each district. Districts are ordered from lowest to highest Black share
(that is, the labels in the horizontal axis are not the district number in the Plan; rather, they should
be interpreted as lowest Black VAP share (1), 2nd lowest Black VAP share (2), all the way to the
district with the highest Black VAP share (13). The colored dots represent each map. The boxes
represent the typical Black VAP shares in maps in the Computational Ensemble, and the arms
stretching out of the boxes represent the Black VAP share at the borderline extreme map such
that only 2.5% of maps have shares above or below the range covered by the arms.

MICHIGAN REDISTRICTING PAGE 19
Figure 1. Distribution of Black VAP by Congressional District
As we can see, the four congressional plans are unusual, but not extremely so, in that they take
what in most maps are a pair of districts — in and around Metro Detroit — with Black VAP shares
of about 55% and 30%, and reconfigure them into two districts, both with slightly over 40% of
Black VAP. Keep in mind that the computer-generated maps are just drawing lots of different
districts that would maintain equal population and are not designed to maximize Black
representation or comply with the VRA.

MICHIGAN REDISTRICTING PAGE 20
CRITERION B: CONTIGUITY
 “Districts shall be geographically contiguous. Island areas are considered to be contiguous by
 land to the county of which they are a part.”

Understanding the Criterion.
Contiguity means that a district is all connected in a single piece.
Two issues arise. The first is about islands. Islands are physically disconnected into a separate
piece, separated from the mainland by water. The criterion says that islands are to be imagined
to be physically attached to the county of which they are a part. If the county of which a given
island is a part of is split into two districts is the island interpreted to be contiguous to the nearest
point of mainland in the county? Or are commissioners free to imagine the island attached to any
part of the county of their choosing? For example, Mackinaw Island is to the Southeast of
Mackinaw County. Suppose a map assigned the island to a district that took only the westernmost
part of Mackinaw County. Would that satisfy “contiguity”? It would not if we imagine the physical
attachment to land to be at the nearest point, i.e. by St. Ignace.
The second issue is about what constitutes contiguity. A laxer definition, so called “queen
contiguity” allows for contiguity only at a single point, like the diagonal pieces of a chess board
that queen, king and bishop chess pieces can transit but other pieces cannot. A stricter definition
is “rook contiguity”, which requires that the connection between pieces be everywhere by more
than a single point. For instance, Van Buren County and St. Joseph County satisfy queen
contiguity, as their corners touch upon a single point, but they do not satisfy rook contiguity.

B1. Measure of Contiguity.
We report a binary “Yes” or “No” for whether a plan satisfies the stricter definition of contiguity,
satisfying rook contiguity with islands attached to the land at the nearest point in the county of
which they are a part of.

Results.
All four draft proposed congressional maps satisfy contiguity.
 TABLE 3. Contiguity.
 Are all districts contiguous?
 Plan Apple Yes
 Plan Juniper Yes
 Plan Maple Yes
 Plan Birch Yes

MICHIGAN REDISTRICTING PAGE 21
CRITERION C: COMMUNITIES OF INTEREST
“Districts shall reflect the state's diverse population and communities of interest. Communities of
 interest may include, but shall not be limited to, populations that share cultural or historical
 characteristics or economic interests. Communities of interest do not include relationships with
 political parties, incumbents, or political candidates.”

Understanding the Criterion.
The Brennan Center for Justice defines communities of interest as “groups of individuals who are
likely to have similar legislative concerns, and who might therefore benefit from cohesive
representation in the legislature.”13 The goal is to keep such communities of citizens with common
legislative concerns together in the same district, so that they can better press their common
concern to their representatives.
The difficulty is to identify which geographic areas represent one such community of interest. The
language of the criterion gives a suggestion: “populations that share cultural or historical
characteristics or economic interests”, but this list is non-exclusive, and these common
characteristics or interests are difficult to ascertain.
The Brennan Center for Justice suggests two means to identify communities of interest.14 One is
top-down, in which mapmakers can use quantitative data to find geographic areas of the state
with aligned indicators of shared cultural, historical or economic characteristics. A second
approach is bottom-up, in which mapmakers, instead of trying to pro-actively find communities in
the data, can sit back and allow the public report the communities of interest that mapmakers
should consider.
The Michigan Independent Citizen Redistricting Commission in 2021 has followed this second
option, a bottom-up approach, inviting the public to submit maps and descriptions of communities
of interest for the Commission to consider. We can distinguish two ways in which communities of
interest could be revealed from public input.
One is for communities to be self-declared: every geographic area has some elected boards that
represents it (neighborhood associations; city, town or county councils; county commissions,
etc.). Any such organization could declare that the community it represents is a community of
interest with shared cultural, historical and economic interests. Any community of interest that
cuts across several of these units of democratic representation (for instance, a community of
interest comprising parts of two adjacent townships) could be self-declared by a proclamation
made jointly by representatives of units of democratic representation that together cover the entire
community.
A second mode of public input allows individual members of the public to submit their conceived
community of interest, without requiring democratic consent from the rest of the conceived
community to be grouped in this manner. A stricter version of this form of individual submissions

13 “Communities of Interest.” Brennan Center for Justice report, November 2010. Retrieved from
https://www.brennancenter.org/sites/default/files/analysis/6%20Communities%20of%20Interest.pdf on
Sept. 2021.
14 Yurij Rudenski and Annie Lo. “Creating strong rules for drawing maps.” Brennan Center for Justice report,

last updated January 29, 2020.
MICHIGAN REDISTRICTING PAGE 22
requires the individual to be a member of the community, so that submissions amount to “This is
my community and we should be together” A laxer forms waives this requirement, allowing
submissions of the kind “that is their community and they should be together.”
The Michigan Independent Citizen Redistricting Commission allowed for the laxer form of public
input, encouraging any form of public input on communities of interest, including through
submissions by individual citizens about communities that do not include the individual making
the submission.
The public responded, uploading —as of October 13, 2021— 1,225 Community of Interest (COI)
submissions through the Commission’s portal.
Such broad collection of public submissions poses challenges for rigorous quantitative analysis.
The submissions vary in their nature, from the whimsical (a combination of dislocated precincts
whose geography spells out the word “Hello“), to those more thoughtful; some explaining in detail
the common interests that bind the community together, while others lacking such explanation.
And while undoubtedly many of the public submissions were drawn in a good-faith to
communicate a true community of interest to commissioners, it is impossible to rule out that some
were calculated attempts to influence commissioners for partisan gain.
We also note that some submissions were as large as congressional districts and may have been
more designed as full-district proposals rather than communities to be kept together within larger
districts. Some citizens used this criterion as an invitation to describe more broadly what kinds of
people and geographic areas they wanted to see in their districts and what kinds of people and
areas they wanted to see out of their districts. Commissioners sometimes referred to these public
comments, stating that one area wanted to be with another or did not want to be with another
without identifying a particular community of interest. This criterion is not a general attempt to
maximize district homogeneity, but to respect communities that can be contained within districts.
It would therefore be somewhat misleading to treat all individual public submissions equally, as if
they all represent equally true and valid communities of interest. It would be more informative to
conduct a qualitative analysis, sifting through each of the submissions to ascertain which of them
constitute a veritable community of interest with a valid explanation. If we could, without
controversy, separate the submissions that truly reflect communities of interests, from ones that
do not, we could then consider the subset of submissions that do represent communities of
interest, and we could quantify how many of these had been kept together in the Commission’s
maps.
Alas, we cannot easily evaluate whether individual submissions are valid or not. We are left then
with a limited quantitative analysis of the pool of submissions. But evaluating an aggregate
measure of communities enables less responsiveness to any one submission or type of
submission.

C1. Measure of Respect for Communities of Interest.
The MGGG Redistricting Lab and Open-Maps Coalition have released a report on “Communities
of Interest Clusters for Michigan.”15 This report identifies 34 communities of interest clusters that
were identified through aggregation from all Community of Interests submissions by the public up

15 We follow version 2.0 of this report, dated September 13, 2021.
MICHIGAN REDISTRICTING PAGE 23
to September 1, 2021. A “cluster” is a geographic area in which several individual submissions
overlap. The choice of how to organize the hundreds of submissions into a smaller number of
clusters presents a trade-off: we can have either more clusters, each of them backed by fewer
individual submissions; or fewer clusters, each of them backed by more individual submissions.
In settling for 34 clusters, the MGGG and Open-Maps report aimed to strike a balance between
having enough testimony of support for each cluster and having clusters that are small enough to
demonstrate tightly connected themes in the submissions supporting each of them.
At the website districtr.org/Michigan, viewers can observe the 34 clusters, and the individual COI
submissions supporting each of them. After uploading or opening a new district map of Michigan,
under the tab “communities,” viewers can toggle each of the clusters “on” or “off” to superimpose
its boundaries on the Michigan district map, so as to visually observe the overlap with the map’s
districts.
Respect for communities of interest should be assessed holistically, taking into account not just
the number or share of COI submissions that an individual map respects, but also the strength of
the arguments in support of each individual submission. We can report the number of clusters
that are split and that are mostly contained within a district, together with the population and
demographics of each cluster. We use a cut off of whether a COI cluster that is between 0 and
100 percent of a district size has two-thirds of its residents contained within a district.

Results
The quantitative analysis on COI cluster splits is underway by the MGGG Lab and is not yet
available.

MICHIGAN REDISTRICTING PAGE 24
CRITERION D: PARTISAN FAIRNESS
“Districts shall not provide a disproportionate advantage to any political party. A disproportionate
 advantage to a political party shall be determined using accepted measures of partisan
 fairness.”

Understanding the Criterion.
The “seat outcome” of an election is the number of seats each party obtains. This seat outcome
depends on how each registered voter in the state votes, and on the redistricting map in use to
aggregate votes by district. The idea behind partisan fairness is that given how people vote, there
is a fair seat outcome, and that the redistricting plan is fair if the seat outcome under this plan is
close to the fair seat outcome. The following question is fundamental: what is the “fair” seat
outcome, given the vote tally in each precinct in an election?
There are two alternative ideas as to what is “fair.” One notion of fairness is an idea of symmetry:
each party must be equally able to translate statewide vote share into seats. For instance, if two
parties each net exactly half the votes, symmetry requires that they each are awarded half the
seats. Despite its intuitive appeal, the Supreme Court of the United States has ruled that this idea
of fairness as symmetry is “based on a norm that does not exist in our electoral system.”16
The Supreme Court of Pennsylvania proposed a different notion of fairness: the seat outcome is
“neutral” if it is similar to the outcome we would expect if the electoral institutions were designed
without considering partisan considerations. A redistricting map is “fair” under this second notion
if it leads to neutral seat outcomes.
In practice, the symmetry and the neutrality notions lead to the same fair seat outcomes if voters
for each party are distributed similarly across the state. However, if voters are distributed
geographically so that even if two parties split the vote evenly, one party wins heavy landslides in
a few areas while another party wins smaller majorities in a larger share of communities across
the state, then the symmetric and the neutral notions of fairness diverge. Namely, if the
redistricting map is drawn without partisan considerations, the party that wins smaller majorities
over more communities will win most seats. Under the neutral notion, this unequal outcome is
“fair,” as it corresponds to the actual geographic distribution of voters’ political preferences.
Whereas, under the symmetry notion of fairness, the districts should be drawn to favor the party
with concentrated support, until the map leads to an equal split of seats.
If the geographic distribution of partisan support is sufficiently uneven, the quest for symmetric
outcomes comes into tension with other criteria, such as respecting Communities of Interest
(Criterion C), respecting county and town boundaries (Criterion E), or compactness (Criterion F),
because in order to favor the party with concentrated support enough for this party to attain a
symmetric seat outcome, non-compact districts that break communities of interest and
jurisdictions apart must be drawn. In Michigan, Democratic voters are more geographically
concentrated, especially in urban areas, which might make it more difficult to draw districts with
fully symmetric outcomes that also meet these other criteria.
We evaluate the maps according to several measures of symmetry and neutrality.

16 Opinion of the Court in Rucho v. Common Cause, 139 S. Ct. 2484, 2499 (2019).
MICHIGAN REDISTRICTING PAGE 25
Measures of partisan fairness
D1. Partisan Bias
The Partisan Bias17 is a measure of symmetry for a given pair of parties, and for a given vote
share. Given recent election results in Michigan, we compute it for the pair of two largest parties
(Republican and Democratic), and for an equal vote share between these two parties.
The Partisan Bias is then the difference between the number of seats that the Republican Party
wins, and the number of seats that the Democratic Party wins, given that each of the two parties
obtains the same number of votes. Perfect fairness, under the symmetry notion, requires a
Partisan Bias of zero. For less than perfectly fair values, it is standard to report them as
percentages of the total number of seats in the delegation.
The Partisan Bias is a value obtained in a hypothetical election in which both parties obtained an
equal number of votes. No such election exists. Instead, MGGG uses actual results from five
elections to construct this tied hypothetical: the Governor’s election, the U.S. Senate election, the
Secretary of State election and the Attorney General election in 2018; and the Presidential
election in 2016. For each of these elections, we construct a hypothetical election result in which
the statewide vote share is tied, and in which the party that won the most votes in the real election
wins only the districts in which it won the real election by a greater vote share margin than its
statewide vote share margin. For instance, if the GOP candidate won the 2016 Presidential
election by 0.2% of the vote, in the hypothetical tied election constructed from the 2016
Presidential results, GOP candidates only win districts in which in the real election the GOP
candidate won by more than 0.2%.18 We therefore obtain a Partisan Bias score for each of the
five hypothetical elections. We average across all five to obtain the Partisan Bias score.

D2. Efficiency Gap
The Efficiency Gap19 is a measure of symmetry in how parties translate statewide votes into seats.
The Efficiency Gap is the difference in the number of “wasted” votes for each party, where all
votes cast for a losing candidate and all votes cast for a winning candidate beyond the 50%+1
number necessary to win are deemed “wasted.” The Efficiency Gap is typically expressed as a
percentage of the total number of votes, so that it can be interpreted as the share of votes for a
party that did not contribute to giving the party more seats.
If turnout is equal across districts, then the Efficiency Gap is just the difference between seat
share, and 50% + 2(vote share – 50%). That is, under equal turnout, this symmetry measure
defines the fair seat outcome to be such that parties with vote share between 25% and 75% get
2% seat share per each 1% of vote share above 25%. The measure is not meaningful, and not
intended to be used in states in which a party gets more than 75% of votes.

17
 Butler, David E. 1951. ‘‘Appendix: An Examination of the Results.’’ In The British General Election of
1950, ed.
H.G. Nicholas, 306–333. London, UK: McMillan.
18 This construction is based on the idea of a “uniform swing”, by which we shift vote share results by an

equal percentage in every district, but it avoids the logical impossibility that arises when uniform swing
pushes the vote share in some district below 0% or above 100%.
19 Stephanopoulos, Nicholas O., and Eric M. McGhee. "Partisan gerrymandering and the efficiency gap."

U. Chi. L. Rev. 82 (2015): 831.
MICHIGAN REDISTRICTING PAGE 26
This is one of four measures used by Dr. Handley in her memo on Partisan Fairness, presented
to the MICRC on Oct. 1, 2021.20

D3. Deviations from proportionality
This is perhaps the simplest measure of symmetry. The deviation from proportionality is the
difference between the seat share and the vote share. This is a second of the four measures used
by Dr. Handley in her memo on Partisan Fairness, presented to the MICRC on Oct. 1, 2021.

D4. Median-Mean difference
The median-mean is a measure of symmetry that captures how difficult it is for a party to obtain
a majority of the delegation.21 Suppose we order the districts from least to most Republican, by
vote share in a previous election. The median-mean difference then compares the vote share in
the 7th most Republican district (the median in a delegation with 13 seats) to the statewide vote-
share (the mean). If this number is positive, then the party can win seven districts (a majority of
the delegation) even if it loses the vote statewide, and the magnitude of the median-mean
difference shows by how much it can lose the statewide vote and still win seven seats.
This measure is more informative for state legislatures where winning the median district gives a
party a majority. This is a third of the four measures used by Dr. Handley in her memo on Partisan
Fairness, presented to the MICRC on Oct.1, 2021.

D5. Lopsided Test
The lopsided test is a measure of symmetry defined as the difference between the average vote
share of Party A in the district won by Party A, and the average vote share of Party B in districts
won by Party B. 22
This is the fourth of the four measures used by Dr. Handley in her memo on Partisan Fairness,
presented to the MICRC on Oct. 1, 2021.

D6. Partisan Advantage
The Partisan Advantage is a measure of neutrality that computes the difference between the seat
outcome and a neutral benchmark based on the state’s jurisdictions. This benchmark is the seat
outcome in which seats are assigned to jurisdictions in proportion to their population.23 The neutral
benchmark depends on which list of jurisdictions we use: counties, or cities and towns. For the
U.S. Congressional map in Michigan, we use the counties. For each county, the benchmark
assigns seats in proportion to the population of the county, to the party that won most votes in
this county. Aggregating by counties in this manner, the benchmark takes into account the
geographic distribution of votes for each party across the state. The Partisan Advantage based
on this county benchmark is then the difference between the seats that a party obtains given the
map, and the seats that it would obtain under this county benchmark.

20 Handley, Lisa. “Measuring Partisan Fairness.” Presented on Oct 1, 2021. Retrieved from:
https://www.michigan.gov/documents/micrc/MICRC_Measuring_Partisan_Fairness_737248_7.pdf
21 McDonald, Michael D., and Robin E. Best. "Unfair partisan gerrymanders in politics and law: A diagnostic

applied to six cases." Election Law Journal 14.4 (2015): 312-330.
22 Sam Wang, “Three Tests for Practical Evaluation of Partisan Gerrymandering,” Stanford Law Journal,

16, June 2016.
23 Jon X. Eguia. “A measure of partisan fairness in redistricting.” Election Law Journal, forthcoming.

MICHIGAN REDISTRICTING PAGE 27
You can also read