Development of Wind Energy in Africa
←
→
Page content transcription
If your browser does not render page correctly, please read the page content below
No 170 – March 2013

        Development of Wind Energy in Africa

Alli D. Mukasa, Emelly Mutambatsere, Yannis Arvanitis, and Thouraya Triki
Editorial Committee                                 Rights and Permissions

                                                     All rights reserved.
Steve Kayizzi-Mugerwa (Chair)
Anyanwu, John C.
Faye, Issa                                           The text and data in this publication may be
Ngaruko, Floribert                                   reproduced as long as the source is cited.
Shimeles, Abebe                                      Reproduction for commercial purposes is
Salami, Adeleke
Verdier-Chouchane, Audrey                            forbidden.

                                                     The Working Paper Series (WPS) is produced
                                                     by the Development Research Department
                                                     of the African Development Bank. The WPS
Coordinator                                          disseminates the findings of work in progress,
Salami, Adeleke                                      preliminary research results, and development
                                                     experience and lessons, to encourage the
                                                     exchange of ideas and innovative thinking
                                                     among          researchers,       development
                                                     practitioners, policy makers, and donors. The
                                                     findings, interpretations, and conclusions
                                                     expressed in the Bank’s WPS are entirely
Copyright © 2013                                     those of the author(s) and do not necessarily
African Development Bank                             represent the view of the African Development
Angle de l’avenue du Ghana et des rues               Bank, its Board of Directors, or the countries
Pierre de Coubertin et Hédi Nouira                   they represent.
BP 323 -1002 TUNIS Belvédère (Tunisia)
Tel: +216 71 333 511
Fax: +216 71 351 933                                 Working Papers are available online at
E-mail: afdb@afdb.org                                http:/www.afdb.org/

    Correct citation: Mukasa, Alli D.; Mutambatsere, Emelly; Arvanitis, Yannis; and Triki, Thouraya (2013),
    Development of Wind Energy in Africa, Working Paper Series N° 170 African Development Bank, Tunis, Tunisia.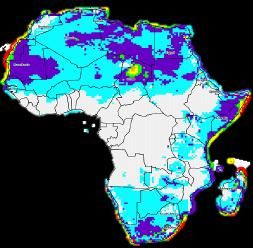
AFRICAN DEVELOPMENT BANK GROUP

                          Development of Wind Energy in Africa

     Alli D. Mukasa1, Emelly Mutambatsere2, Yannis Arvanitis3, and Thouraya Triki4

                                         Working Paper No. 170
                                              March 2013

                                      Office of the Chief Economist

1
  Investment Officer at the Private Sector and Microfinance Department of the AfDB (a.mukasa@afdb.org)
2
  Principal Research Economist at the Development Research Department of the AfDB (e.mutambatsere@afdb.org)
3
  Research Economist at the Development Research Department of the AfDB (y.arvanitis@afdb.org)
4
  Principal Research Economist at the Development Research Department of the AfDB (t.triki@afdb.org)
The authors are grateful for the insights provided by Khalid Benhamou who was an external reviewer of the paper. The
paper greatly benefited from comments received from colleagues at the AfDB (Tanja Faller, Bertrand Belben and Ignacio
Tourino Soto), participants of the Wind Energy Workshop at the “Tunis-Med Industrie” Conference (2012) and the 2012
African Economic Conference. The authors also acknowledge excellent research assistance from Kolawole Dairo and
Ahmed Jeridi and contributions from Linus Mofor.
Abstract This paper describes how Africa’s wind GW installed wind power capacity in energy markets have evolved over the Africa at USD 1.8 billion, out of which years and the structural characteristics 59 percent was contributed by affecting the development of wind development finance institutions as non- energy projects on the continent; concessional funding. We also notice a providing what we believe is the first shift from the use of concessional mapping of the continent’s wind energy funding on projects towards non- market. Results from our analysis of 94 concessional funding from development projects on the continent suggest that finance institutions, an increasing wind energy markets remain small, participation of the private sector and concentrated and nascent in nature. greater use of specialized funds and While we observe an increasing trend in Clean Development Mechanism funding. the number and size of projects being There is also emerging south-south implemented, we show that wind energy cooperation with some experienced contribution to the energy mix in Africa African firms seeking new markets will remain unchanged over the long across the continent. The paper finds term. A key observation in the paper is that the public sector remains a key that wind energy has limited potential to player in the wind energy sector, not address the issue of access to electricity only as a financier but also as a local in Africa mainly due to the intermittent partner that ensures smooth project nature of electricity output from wind implementation. The paper also power plants. Wind energy is more discusses technical, environmental and likely to complement electricity financial considerations that African generation from conventional sources, countries need to take into account when as has been observed in more mature developing wind energy projects. markets. We estimate the cost of the 1.1 JEL Codes: O13, O55, Q01, Q42 Keywords: renewable energy, infrastructure financing, wind energy markets, Africa
i

Table of Contents
Figures ....................................................................................................................................... ii
Tables......................................................................................................................................... ii
Boxes .......................................................................................................................................... ii
Abbreviations ........................................................................................................................... iii
1.0.      Introduction ................................................................................................................... 1
2.0.      Africa’s Wind Energy Market: Setting the Stage ...................................................... 2
3.0.      Mapping Wind Energy Projects in Africa .................................................................. 5
   3.1        The Profile of Wind Energy Projects .......................................................................... 5
   3.2        Models of Industry Development ................................................................................ 8
   3.3        Key Players in Wind Markets .................................................................................... 10
   3.4        Financing of Wind Energy Projects in Africa ........................................................... 12
4.0.      Explaining Market Development Trends .................................................................. 18
   4.1        Technical Considerations .......................................................................................... 18
   4.2        Economic Considerations .......................................................................................... 20
   4.3        Climate Change Considerations ................................................................................ 22
   4.4        Business Environment Considerations ...................................................................... 23
5.0.      Conclusion and Policy Implications ........................................................................... 26
   5.1        Conclusion ................................................................................................................. 26
   5.2        Policy Implications .................................................................................................... 27
Annex 1: Sources of Financing for Wind Projects in Africa .............................................. 29
Annex 2: Projects Benefitting from CDM Financing.......................................................... 30
Annex 3: Feed-in Tariffs for Wind Energy Projects ........................................................... 31
Figures
Figure 1.1: Growth in Global Wind Generation Capacity ......................................................... 1
Figure 2.1: On-shore Wind Potential (mtoe) .............................................................................. 3
Figure 2.2: Off-shore Wind Potential (mtoe) ............................................................................. 3
Figure 2.3: Wind Speeds in Africa at an Altitude of 50 m ......................................................... 3
Figure 2.4: Historic, Current and Projected Trend of Africa’s Electricity Generation Mix ...... 4
Figure 3.1: Installed Wind Capacity in Africa ........................................................................... 5
Figure 3.2: Installed Capacity by country and Stage of Development ....................................... 6
Figure 3.3: Geographic Location of Projects by Stage of Development.................................... 6
Figure 3.4: Regional Coverage of Projects by Stage of Development (% of projects) .............. 6
Figure 3.5: Distribution of Projects by Installed Capacity ........................................................ 7
Figure 3.6: A Phased Approach of Wind Energy Development ................................................ 8
Figure 3.7: Trend in Total Project Costs .................................................................................. 12
Figure 3.8: Distribution of Total Project Costs ........................................................................ 12
Figure 3.9: Distribution of Costs per Unit of Installed Capacity ............................................. 13
Figure 3.10: Capital Costs per Unit of Installed Capacity ....................................................... 13
Figure 3.11: Distribution of Costs per Unit of Installed or Planned Capacity ......................... 14
Figure 3.12: Per Unit Cost by Type of Sponsor ....................................................................... 14
Figure 3.13: Financing of Projects ........................................................................................... 16
Figure 3.14: Financing for Completed Projects ....................................................................... 17
Figure 4.1: Capacity Factors for Selected Technologies .......................................................... 19
Figure 4.2: Levelized Cost of Electricity Generation by Technology .................................... 20
Figure 4.3: Potential from Other Renewable Energy Source, mtoe ......................................... 21
Figure 4.4: Potential from Conventional Thermal Energy Source, mtoe ................................. 21
Figure 4.5: Correlation of wind energy potential to installed capacity .................................... 21
Figure 4.6: Greenhouse Gas Emission from Electricity Generation ....................................... 22

Tables
Table 1.1: Developing Countries with the Highest Potential for Solar, Wind, Hydro and
Geothermal Energy .................................................................................................................... 1
Table 3.1: Projects’ Capacity by Stage of Development (MW)................................................. 7
Table 3.2: Key Operators in the Wind Energy Market in Africa ............................................. 10
Table 3.3: Wind Turbine Manufacturers with a Presence in Africa ........................................ 11
Table 4.1: Greenhouse Gas Emission from Power Generation ................................................ 23
Table 4.2: Renewable Energy Promotion Policies in Africa.................................................... 24

Boxes
Box 3.1: Funding Cabeolica Wind Farm, Cape Verde ............................................................ 15
Box 4.1: Feed-in-Tariffs and competitive bidding in South Africa ......................................... 25

                                                                   ii
Abbreviations
ACF Africa Carbon Facility
AFD Agence Française de Développement
AfDB African Development Bank
AGF Africa Green Fund
BOO Build-Own-Operate
BOOT Build-Own-Operate-Transfer
CCC Conventional Combined Cycle
CDM Clean Development Mechanism
CED Compagnie Eolienne du Détroit
CER Carbon Emission Reduction
CIF Clean Investment Fund
CTF Clean Technology Fund
DANIDA Danish International Development Agency
DFI Development Finance Institutions
ECA Export Credit Agency
EIB European Investment Bank
EPC Engineering Procurement and Construction
EUR Euro
FAD Development Assistance Financing (Spain)
FiT Feed-in-Tariffs
GEF Global Environment Facility
GHG Green House Gas
GW Giga Watt
IEA International Energy Agency
IFC International Financial Corporation
IPP Independent Power Producer
IRR Internal Rate of Return
JBIC Japan Bank for International Cooperation
KfW Kreditanstalt für Wiederaufbau - German Development Bank
kWh Kilowatt hour
LIC Low Income Country
MDB Multilateral Development Bank
MIC Middle Income Country
MIGA Multilateral Investment Guarantee Agency
Mtoe Million tons of oil equivalent
MWh Megawatt hours
NATO North Atlantic Treaty Organization
NREA New and Renewable Energy Authority (Egypt)
O&M Operation and Maintenance
ODA Official Development Assistance
OECD Organisation for Economic Co-operation and Development
ONE Office National de l’Électricité (Morocco)
PIDG Private Infrastructure Development Group
PPA Power Purchase Agreement
PPP Public Private Partnership
REACT Renewable Energy and Adaptation to Climate Technologies
REIPPP Renewable Energy Independent Producers Procurement Programme
SAWEP South Africa Wind Energy Programme
SEFA Sustainable Energy Fund for Africa
STEG Société Tunisienne de l’Electricité et du Gaz (Tunisia)
TZS Tanzanian Shilling
UN United Nations
UNFCCC United Nations Framework Convention on Climate Change
UNIDO United Nations Industrial Development Organization
USAID United States Agency for International Development
USD United States Dollar
VAT Value Added Tax
ZAR South African Rand
iii1.0 Introduction
With over half a billion people on the continent lacking access to electricity, Africa is faced with the
challenge of generating more power to meet existing and future demand. For many countries, an
opportunity exists to do so in a clean and sustainable manner. The continent is well endowed with
renewable energy resources which constitute plausible solutions to address existing power shortages
(Table 1.1). Indeed, Africa’s reserves of renewable energy resources are the highest in the world, and
the continent has enough renewable energy potential to meet its future energy needs (World Energy
Council, 2010). It is estimated that 18 of the top 35 developing countries ranked highest in renewable
energy reserves, normalized by annual domestic energy consumption, are located in Africa (Buys et al,
2007). Similarly, at least 8 African countries are among the developing world’s most endowed in terms
of wind energy potential.
Table 1.1: Developing Regions with the Highest Potential for Solar, While global wind-based
Wind, Hydro and Geothermal Energy electricity generation is still
Region Total underdeveloped relative to
Renewable Solar Wind Hydro Geothermal exploitation of other renewable
Energy
Africa 18 24 8 11 9 fuels such as hydro, it has grown at
East Asia/Pacific 4 5 3 6 4 an average annual rate of about 30
Europe/Central Asia 3 0 6 5 14 percent between 1996 and 2008;
Latin America/ 7 5 8 9 3 making wind one of the world’s
Caribbean fastest-growing energy resources
Middle East 1 0 1 0 0
South Asia 0 0 1 1 0 in terms of both coverage and
All World Bank 33 34 27 32 30 technological innovations (Figure
Regions* 1.1). The growth reflects mainly
Source: Buys et al. (2007). *188 countries (close to world total of 193 advances in technology and energy
countries per the World Almanac statistics 2012) security concerns in a decade that
saw some of the highest oil prices recorded in history. Climate change considerations have played a
role as well.
Figure 1.1: Growth in Global Wind Generation Capacity However, despite these positive trends
250,000 70 and Africa’s potential supply of wind
60
energy, installed capacity of wind-based
200,000 electricity in Africa, of about 1.1 GW in
50
2010, does not exceed 0.5% of global
Capacity (MW)
150,000
Growth (%)
40 capacity. The disparity between potential
30 and extent of exploitation raises
100,000
questions about constraints to
20
50,000
development of wind energy on the
10 continent. The absence of detailed
0 0 information at individual project level
further restricts developers’ and policy
1995
1996
1997
1998
1999
2000
2001
2002
2003
2004
2005
2006
2007
2008
2009
2010
makers’ understanding of the market.
Capacity (MW) Growth (%)
Source: World Wind Turbine and Wind Farms Database The goal of this paper is to improve
understanding of how wind energy
1markets have been developing in Africa. There are two key objectives: provide a mapping of wind
energy potential and projects developed on the continent so far; and identify impediments hindering
further development of wind energy markets on the continent. We use a hand-collected sample of 94
wind projects in Africa to perform what we believe is the first continent-wide mapping for the markets.
The paper is structured as follows: Section 2 provides an overview of the continent’s wind potential
and installed capacity. Section 3 provides a micro picture of the sector by mapping wind energy
projects, describing their main characteristics and financing sources, and identifying incentives that
have been established to promote the sector. In section 4, physical, technical and economic peculiarities
that prevent African countries from harnessing their wind energy potential are examined. Section 5 is a
conclusion of the discussions in the paper and also provides policy recommendations.
2.0 Africa’s Wind Energy Market: Setting the Stage
To contextualize the development of the wind market in Africa, it is important to set the backdrop
against which projects are being developed. This includes mapping of locations with wind resources
and the size of potential output, reviewing the electricity generation mix for currently installed
capacity, as well as assessing the outlook of the industry. The mapping of potential is important to
establish the upper limits of wind energy development on the continent. These limits are most
meaningful when cast against existing technologies and other important considerations in wind energy
development.
While multiple dimensions exist on which wind energy potential could be defined, we adopt for the
purposes of this paper, a characterization based on the technical wind energy potential for African
countries. This approach takes into consideration the physical upper limit given observed wind speeds,
technological efficiency, and other structural and ecological restrictions5. We defer to section 4 the
discussion on soft constraints to wind energy development such as legislative restrictions and limited
competition in the energy markets.
Using a technical feasibility method based on technologies available in 2005, Buys et al. (2007)6 find
that eight African countries, namely; Somalia, Sudan, Libya, Mauritania, Egypt, Madagascar, Kenya
and Chad have large on-shore wind energy potential (Figure 2.1). Mauritania’s potential, for example,
is about four times its annual energy consumption in tons of oil equivalent, while Sudan’s is equivalent
to 90% of its annual energy needs. Yet, there is variability in terms of geographic location of wind
potential across countries. In particular, the study finds that five additional African countries –
Mozambique, Tanzania, Angola, South Africa and Namibia – have potentially large off-shore wind
energy resources (Figure 2.2).
5
Wind potential could be (i) theoretic: the physical upper limit of an energy resource, (ii) conversion: theoretic capacity
accounting for technology efficiency, (iii) technical: conversion capacity accounting for other technological, structural and
ecological restrictions (iv) economic: technical capacity which is economically feasible (Teske et al 2011).
6
Buys et al. (2007) estimate potential electricity generation from renewable energy resources based on a geo-referenced
database of energy indicators from a variety of sources. A key merit of this database is that it adopts a standard unit of
measurement – million tons of oil equivalent (mtoe) – which makes estimates ideal for comparison of potential across
energy types.
2Figure 2.1: On-shore Wind Potential (mtoe*) Figure 2.2: Off-shore Wind Potential (mtoe)
60 60
50 50
High High
Low 40 Low
40
30 30
20 20
10
10
0
Congo,…
0
Congo,…
Madagasc…
Mozambi…
South…
Namibia
Egypt
Madagascar
Somalia
Chad
Kenya
Tunisia
Sudan
Angola
Mauritania
Ethiopia
Cape Verde
South Africa
Mozambique
Congo
Comoros
Mauritius
Morocco
Tanzania
Libya
Seychelles
Chad
Somalia
Egypt
Tunisia
Kenya
Namibia
Sudan
Cape Verde
Mauritania
Ethiopia
Morocco
Congo
Comoros
Mauritius
Tanzania
Angola
Libya
Seychelles
Source: Buys et al (2007). The ‘high’ scenario assumes technical feasibility at 2007 wind rotor density for Germany –
world leader in 2005 – in terms of installed wind energy capacity; ‘Low’ scenario assumes 60 percent of Germany’s
density. * Mtoe: stands for million tons of oil equivalent.
Figure 2.3: Wind Speeds in Africa at an Altitude of 50 m A study undertaken by the African
Development Bank to create a wind atlas for
Africa also revealed significant potential on the
continent (AfDB, 2004). This study produced a
quantitative map of wind speeds on the
continent (Figure 2.3) simulated using the
Wind Energy Simulation Toolkit (WEST)7
model at an altitude of 50 meters and a
resolution of 50 km. Results demonstrated that
the best wind in Africa is found in the coastal
regions of the continent: in the North (Algeria,
Wind Speed at 50 m (m/s)
Egypt, Morocco Tunisia and Mauritania), the
East (Djibouti, Eritrea, Seychelles and
7.5 and higher
7.0 to 7.5 Somalia), West (Cape Verde) and South (South
6.5 to 7.0 Africa and Lesotho). Notably, this study
6.0 to 6.5
5.0 to 6.0
identifies wind potential in some countries not
4.0 to 5.0 identified by Buys et al in 2007, highlighting
Less than 4.0 the need for further work to establish accurate
data on wind energy resources on the
Source: AfDB, 2004
continent.
In general though, sources show that the highest wind potential exists in coastal areas, which tend also
to have both on-shore and off-shore potential (Figure 2.3). With the exception of countries like Chad
and Ethiopia, whose topographies give rise to high speed winds in certain high altitude areas, the rest of
mainland (land-locked) Africa’s wind intensity is too low to be harnessed for electric power generation.
7
The Wind Energy Simulation Toolkit (WEST) is a dynamic three-dimensional model of wind circulation on a horizontal
plane which integrates physical phenomena such as radiation and condensation and parametric analyses of effects such as
turbulence and convention (AfDB, 2004).
3Despite the high wind energy potential in some African countries, wind powered electricity generation
is still very limited, with an estimated 1.1 GW installed capacity in 2011. Notably, wind-based
electricity contributes less than 1 percent to installed electricity generation capacity on the continent.
This share falls below that for OECD countries (3.8 percent) and for non-OECD emerging markets (1.1
percent).
Among developing countries, Africa’s wind energy potential is comparable to that of Latin America
and the Caribbean. While the installed capacity for wind in Africa is expected to increase twelvefold
over the next decade, in line with global trends in renewable energy development and technological
innovations, the contribution of wind energy to Africa’s electricity generation mix will remain very
limited as illustrated by Figure 2.4. A similar trend is expected for Latin America whose current
capacity falls below that observed in Africa. According to the International Energy Agency’s
projections (2010) wind energy is expected to contribute only 2% of generated electricity in Africa by
2030 under a business as usual scenario, as compared to other conventional energy sources like coal
(37%), gas (32%) and hydro (18%); and relative to a global share of nearly 5% of total electricity
generation capacity.
Wind installed capacity in Africa is not only small – both in absolute terms measured by installed
capacity, and relative terms as measured by its contribution to the energy mix – but has also been
highly concentrated with 3 countries (Egypt, Morocco and Tunisia) holding about 96% of total
installed capacity as at end-2011. Further details about this market feature are provided in the next
section.
Figure 2.4: Historic, Current and Projected Trend of Africa’s Electricity Generation Mix
100%
Geothermal
90%
Solar PV
80%
Wind
70%
60% Nuclear
50% Biomass & waste
40% Oil
30% Hydro
20%
Gas
10%
Coal
0%
1990 2008 2015 2020 2030 2035
Source: International Energy Agency 2010
43.0 Mapping Wind Energy Projects in Africa
In this section we first take a historic perspective on wind energy development in Africa to provide
stylized facts on the industry and its funding sources, then analyze the market’s outlook. Inevitably,
there is a strong focus on market leaders including analyses of specific policies, strategies and
financing instruments adopted in these countries to develop the market. We use a hand collected
sample of 94 wind energy projects, compiled from various data sources including the AfDB’s project
portfolio, Thomson One database, the Wind Power database, the Global Energy Observatory, research
papers and various websites as detailed in the References section. Our sample is comprehensive with a
near full list of completed projects in Africa between 1980 and 2010; and an extensive, though non-
exhaustive, list of ongoing and planned projects8.
3.1 The Profile of Wind Energy Projects
Based on the individual capacity of projects we identified, Africa’s installed wind energy capacity
increased twelvefold between 1995 and 2010 (Figure 3.1), with most of the growth taking place
starting early 2000. Notably, between 2000 and 2010, Africa’s installed wind capacity grew at a rate of
41%; much faster than the average global growth rate of 27%. Africa’s great performance is a
reflection of the embryonic nature of the African market characterized by limited initial capacity.
Indeed, Africa’s growth rate between 2000 and 2010 is very similar to the one reported for other
regions during their early stages of market development (i.e. 35% over the period of 1995-2000).
Figure 3.1: Installed Wind Capacity in Africa A distribution of projects based on their
location and stage of development is
1200
provided in Figure 3.2 and Figure 3.3.
Out of the 94 projects identified, about a
1000 third (30) is completed. Of the completed
projects, 93% came on stream after 2000,
800 which is consistent with the nascent
Capacity (MW)
Annual capacity
Cumulative capacity nature of this market on the continent.
600
Our database also shows a high
400
concentration of installed wind capacity,
with 73% of completed projects located in
200 3 North African countries – Egypt,
Morocco and Tunisia – which collectively
0 account for 96% of total installed capacity
1988
1989
1990
1991
1992
1993
1994
1995
1996
1997
1998
1999
2000
2001
2002
2003
2004
2005
2006
2007
2008
2009
2010
at end-2010. Egypt leads this market,
contributing 33% of total completed
Source: Authors’ analysis projects and 50% of total installed
capacity on the continent. Egypt is
followed by Morocco which accounts for 30% of total completed projects and 41% of total installed
capacity. Tunisia has three completed projects, all located at Sidi Daoud, with a total installed capacity
of 54 MW (about 5% of Africa’s installed capacity). In southern Africa, Namibia, Mauritius,
Mozambique and South Africa already have installed wind energy capacity. So far, South Africa has an
installed capacity of only 9 MW. In East Africa, two small projects have been completed; one in Kenya
8
‘Ongoing’ projects are defined as projects for which construction activities have commenced while ‘planned’ projects are
those in the pre-construction phase.
5(Ngong Hills) and the second one in Eritrea (Assab Wind Park). No completed wind energy projects
were identified in West and Central Africa.
Figure 3.2: Installed Capacity by Country and Stage of Development
Although North Africa remains the
leading region in wind energy
4000
markets in Africa, southern and
3500 eastern African countries are
3000 expected to reduce the gap,
Capacity (MW)
2500 Planned contributing 36% and 8%
Ongoing respectively of combined ongoing
2000 Completed and planned projects (Figure 3.4).
1500 For instance, 35% of all planned
1000 projects are located in South Africa
500
followed by Egypt (27%) and
Morocco (21%). East Africa is also
0
gaining ground with several projects
Namibia
Ghana
Egypt
Kenya
Djibouti
Ethiopia
Eritrea
South Africa
Tanzania
Algeria
Cape Verde
Mauritius
Tunisia
Mozambique
Mauritania
Nigeria
Morocco*
in the region such as the two ongoing
commercial scale projects in Ethiopia
and Tanzania (Ashegoba and
* Excluding the planned Sahara Wind Project (5000 MW) Njiapanda wind farms, respectively);
Source: Authors’ analysis and some planned projects in Kenya,
Djibouti and Ethiopia. The latter
include the Lake Turkana wind farm in Kenya, which is the largest wind energy projects planned in
Sub Saharan Africa. No ongoing or planned projects were recorded for Central Africa.
Figure 3.3: Geographic Location of Projects by Stage of Figure 3.4: Regional Coverage of Projects by Stage of
Development Development (% of projects)
80%
70%
60% Complete
Ongoing and Planned
50%
40%
30%
20%
10%
0%
North Southern East West Central
Source: Find Local Weather (wind map) plus authors’ mapping of Source: Authors’ Analysis
wind projects
6Interestingly, concentration is reported for ongoing and planned projects as well with three countries –
Egypt, Morocco and South Africa – collectively contributing about 75% of the total number of projects
either ongoing or planned (or 83% of total capacity) on the continent. This is due to, among other
factors, a stronger political commitment to renewable energy from what are comparatively energy-
intensive countries and the high electricity access rates that already exist in these countries (see section
4.2).
It is worth noting that the bulk of Africa’s completed projects are located either in coastal areas, or sit
on islands. The exception is Kenya, which has its largest potential inland around the Lake Turkana
highlands whilst having significant coastal potential as well. Both its pilot facility and planned projects
are located inland. The wind farms in Algeria, Nigeria and Tanzania are also located inland.
The small size of the African wind market documented earlier reflects not only the limited number of
wind farms but also the small scale nature of the projects. The individual capacity of most projects in
Africa, whether completed, ongoing or planned, remains small and broadly ranges between 1 MW and
100 MW (Figure 3.5). Only 3 completed projects have installed capacity exceeding 100 MW (Zafarana
VI and VIII in Egypt and Tangier in Morocco). Notably, most of the larger wind farms have been
implemented in phases whereby the individual project sizes generally fall within the abovementioned
range. For example, the Zafarana and Gulf of Zayt wind farms in Egypt consist of 8 and 7 separate
projects respectively, whereas the Touahar wind farm in Morocco is made up of 3 individual projects.
Each individual project in the aforementioned examples may be unique in terms of project sponsors,
sources of funding and sometimes the technology used. There is however an increasing trend in the size
of projects being implemented. For instance, while only 3 completed projects have installed capacity
exceeding 100 MW, half of ongoing and planned projects have capacity greater than 100 MW. No pilot
projects were identified in our sample of ongoing and planned projects, which comprise only of
commercial scale wind farms (Table 3.1). This suggests either progress toward maturity of the market,
or transferability of technologies already tested on the continent.
Figure 3.5: Distribution of Projects by Installed Capacity Table 3.1: Projects’ Capacity by Stage of
Development (MW)
60
Number of Projects
50 Installed
Planned Completed Ongoing Planned9
Capacity
40 Ongoing
Completed Total 1,104 1,731 10,907
30
Range 0.2 – 140 5 – 300 10 – 5,000
20
Mean 37 108 227
10
Median 25 95 110
0 Standard
500 Deviation 40 86 701
Installed Capacity (MW)
Source: Authors’ analysis Source: Authors’ analysis
9
The sample includes the planned 5,000MW Sahara Wind Project, whose planned capacity is an outlier. Excluding this
project, average capacity of planned project drops to 126 MW. The Sahara Wind Project is an ambitious project aimed at
generating electricity to supply Europe and the Mediterranean region via high voltage Direct Current transmission lines that
will run from North Africa to Europe as well as other targeted markets. The project has already attracted interest from the
North Atlantic Treaty Organization (NATO) and the United Nations Industrial Development Organization (UNIDO),
among other global leaders in the energy sector, but is still a long way from being realized.
7The 16 ongoing projects we identified are expected to add a cumulative capacity of about 1.5 GW to
the current installed wind capacity. The 48 planned projects would add at least another 10 GW
inclusive of the Sahara Wind Project, also known as the Moroccan Wind Plan, which is expected to
have an installed capacity of 5GW.
3.2 Models of Industry Development
The observed trends emerging from the profiling of projects can be traced back to how the wind energy
industry has developed in Africa. Most African countries pursued a phased approach to develop wind
energy projects. This often started with pilot and field testing wind projects followed by semi-
commercial wind farms, and subsequently by large scale commercial projects (Figure 3.6). The phased
approach at pilot stage reflects need to test available technology, insufficient geo-referenced resources
and data sets to gauge feasibility and guide investments, and low public sector capacity to oversee the
industry’s development. Once technologies have been proven feasible in pilot projects, a phased
approach towards commercialization is often adopted, mainly reflecting lack of sufficient resources to
fund large scale operations initially.
Figure 3.6: A Phased Approach of Wind Energy Development
Pilot Semi-commercial Commercial
Source: Authors
The first wind farms in Africa were established during the 1980’s. In Egypt, a pilot wind farm was
developed at Ras Gharib, near the Gulf of Suez, in 1988 which laid the foundation for large scale
projects that were later established. The project was co-sponsored by the then Egyptian Electricity
Authority (now Egyptian Electricity Holding Company, or EEHC) and the state-owned General
Petroleum Company, to partly meet the energy needs of General Petroleum Company (USAID, 1986).
This was immediately followed by the establishment of the Wind Energy Technology Center at
Hurghada, which was established initially as a measurement and turbine testing center. A small scale
demonstration wind farm was later added at the location. Egypt’s first commercial wind project was the
first phase of the Zafarana wind farm (30 MW) commissioned in 2001. Seven subsequent phases of
Zafarana have since been completed, bringing the farm’s capacity to 545 MW as of 2010. There are
currently three ongoing developments on the Gulfs of Suez and El Zayt which are expected to add
another 200 MW capacity each, and the expansion of the Hurghada wind farm which is expected to
have an installed capacity of 1,100 MW at completion.
A strong public sector and donor presence can be observed in projects implemented in Egypt. For
example, the Ras Gharib pilot project was developed using USAID resources whereas the Hurghada
wind farm was funded by Danish and German resources. Zafarana received support from several
bilateral investment promotion agencies, mostly the Danish International Development Agency
(DANIDA) and Germany’s KfW. All completed projects in Egypt (and most ongoing and planned
projects) were sponsored by the New and Renewable Energy Authority (NREA), the public entity
created in 1986 with a mandate to plan and implement renewable energy programs. No private
developers were active in Egypt on completed projects. The Italian energy generation firm, Italgen, is
poised to become the first private developer with its planned 120 MW wind farm along the Gulf of El
8Zayt. And among NREA’s planned projects, one - the Gulf of Suez 200 MW facility - is structured as a
public-private partnership (PPP)10.
Tunisia is following a similar development path, though on a smaller scale and with concessional
official development assistance (ODA). The first wind farm at Sidi Daoud was developed in three
phases with financial support from Spain, including (i) concessional lending from the Spanish
Development Assistance Financing (FAD) to the Tunisian government, and (ii) commercial debt from
the Spanish Export Credit Agency in favor of the Spanish EPC (Engineering, Procurement and
Construction) contractor, Gamesa. The state-owned utility Société Tunisienne de l’Electricité et du Gaz
(STEG) sponsored these projects. The utility is also sponsoring the planned large scale operation (190
MW), Centrales Eoliennes de Bizerte 1 and 2, which too is expected to receive Spanish development
aid. No significant private operations were identified in the pipeline projects for Tunisia.
In Morocco, the first pilot was a 3.5 MW project near Tetouan (the Al Koudia Al baida project),
developed by the public utility Office National de l’ Électricité (ONE) with KfW support. But unlike
Egypt, Morocco immediately migrated in 2000 to private procurement of wind energy projects: the 50
MW expansion of Al Koudia Al baida was developed by a French consortium Compagnie Eolienne du
Détroit (CED) under a 19-year build-own-operate-transfer (BOOT) concession. A third of the
completed projects in Morocco were structured as public while the rest were developed as either
public-private partnerships or independent power production.
Mauritius followed a path similar to Morocco’s; first engaging with public entities for pilot phases
before turning to private sponsors. A first attempt was made in the 1980s, but did not yield satisfactory
results as cyclone-proof technology was not fully mastered. A 0.2 MW pilot project was later
commissioned in 2004 at Rodrigues Island. This project is owned and operated by state-owned Central
Electricity Board. A private French wind energy developer, Aerowatt, is expected to execute the first
two commercial operations in the country under BOOT contracts: the 18 MW Eole (Plaine Des
Roches) and the 22 MW Britannia wind farms. Similarly, Kenya’s only pilot farm at Ngong Hills was
developed by its public utility KenGen in 2009. After the successful operation of the pilot project, there
are plans to expand this wind farm to a commercial scale. Also in the pipeline is the country’s first full
blown commercial operation of 300 MW Lake Turkana wind farm which is also privately sponsored.
Some African countries are moving directly to relatively large scale projects and with private
participation. Cape Verde’s first wind farm – also the first commercial operation outside of North
Africa – was executed as a PPP. However it is interesting to note that the key private shareholders of
the project company (Cabeólica S.A.) – Africa Finance Corporation, Finnfund and Infraco – are
institutions with a development mandate. Similar developments are being observed in Algeria.
In South Africa, the wind energy market remains underdeveloped, with only two completed pilot
projects sponsored; one by its public utility Eskom (Klipheuwel wind project); and another through a
PPP arrangement with the financial backing of DANIDA (Darling Wind farm). The industry is
however poised to grow exponentially, thanks to the private sector led developments expected
following the recent conclusion of a concrete procurement framework for renewable energy
Independent Power Producers (IPP) as discussed in section 4.4. The first set of grid connected wind
10
PPPs encompass all forms of engagement involving a private party as part or full owner of the wind project, and
including a power purchase agreement with the national utility.
9power projects is currently under procurement and is expected to add 634 MW in installed capacity by
2013. New key players will emerge once these developments get under way, the largest being South
Africa’s Red Cap Investments and the Spanish firm Iberdrola (Table 3.2). Namibia is following suit:
the quasi-public entity ErongoRED led wind energy development with its pilot farm at Walvis Bay, and
a commercial project (Innowind project) is underway with financial support from DANIDA.
3.3 Key Players in Wind Markets
3.3.1 Developers, Sponsors and Operators
In order of installed capacity, NREA (Egypt) is the largest owner/operator of wind energy capacity on
the continent. It is followed by other North African public utilities, ONE in Morocco and STEG in
Tunisia. The profile of private players is heterogeneous in nature, and includes both established
international operators, as well as recently established African based firms, some of which are joint
ventures between African and international firms. Table 3.2 summarizes the key operators and
developers of wind energy projects in Africa, including the top-ten prospective entrants. French,
Spanish and Dutch investments are already present on the continent. With the exception of prospective
IPP investments by the world’s third largest wind energy developer, Iberdrola, foreign direct
investments in Africa’s wind energy market is driven by relatively small and emerging players.
Table 3.2: Key Operators in the Wind Energy Market in Africa
Ownership Domiciliation Country Coverage in Installed Pipeline
Africa Capacity (MW) Capacity (MW)
NREA† Public Egypt Egypt 550.2 2690
ONE† Public Morocco Morocco 304.3 650
STEG Public Tunisia Tunisia 53.6 190
Chaâbi Group§ Private Morocco Morocco 70 -
Compagnie Eolienne du Détroit
Private France Morocco 50 -
(CED)
La cimenterie de Tetouan§ Private Morocco Morocco 32.2 -
Cabeolica PPP Cape Verde Cape Verde 28 -
Nareva Holding‡ Private Morocco Morocco 70 750.6
InnoVent Private France Namibia - 300
KP & P Holding B.V (Lake
Private Netherlands Kenya - 300
Turkana)
Red Cap Investments Private South Africa South Africa - 277.6
Masdar Private Abu Dhabi Egypt - 200
EEPCO Public Ethiopia Ethiopia - 180
Iberdrola Private Spain South Africa - 160
Exxaro§ Private South Africa South Africa - 140
ACED, AIIM & AFPOC Private South Africa South Africa - 135
Limited
ITAL-GEN Private Italy Egypt - 120
†Includes capacity co-owned with private investors. ‡Includes a joint venture investment between Nareva and International Power §Auto-producer
whose capacity is operated by specialized firms such as Nareva.
Source: Authors’ compilation
With regard to African firms, South Africa will soon have the fastest growing wind energy industry, as
indicated by the number of prospective private operators in the market. Over 500 MW is expected to be
installed by South African private operators though all operations will be concentrated in South Africa.
The emerging south-south cooperation is also noteworthy: some well-established African firms are
already seeking investments opportunities elsewhere on the continent, for example Egypt’s El Sewedy
which has plans to invest in the Ghanaian market.
10Developments in the Moroccan market are unique in that they include some operators whose core
business lies outside of the energy sector, for example, the Chaâbi Group and La cimenterie de Tetouan
self-producers with mostly captive wind energy capacity. Nareva Holding, established in 2005 in
Morocco, is set to have the largest market share among private operators.
3.3.2 Wind Turbine Manufacturers
The choice of wind turbine manufacturers on the continent is dominated by global leaders in the
industry (Table 3.3). Data shows that the world leaders Gamesa and Vestas (fourth and largest wind
turbine manufacturers respectively on the world market) dominate in terms of installed capacity and
geographic reach.
Table 3.3: Wind Turbine Manufacturers with a Presence in Africa
Installed Pipeline
Manufacturer Domiciliation Country Coverage
Capacity Capacity
Gamesa† Spain Egypt, Morocco, Tunisia (MW) 630.8 (MW) 590.0
Egypt, Kenya, Morocco, South Africa,
Vestas Denmark 136.3 55.0
Cape Verde, Algeria
Alstom Ecotècnia Spain Morocco 100.0 -
Nordex Germany Egypt 63.0 -
Fuhrländer Germany South Africa 5.5 -
Enercon Germany Morocco 3.5 -
Wincon Denmark Egypt 2.6 -
Vergnet France Eritrea, Mauritius, Ethiopia, Mauritania 1.0 125.0
Ventis Denmark Egypt 1.0 -
Jeumont France South Africa 0.8 -
Wind World Denmark Namibia 0.2 -
Vensys Denmark Algeria - 14.0
Siemens Germany Morocco - 50.6
Alstom France Morocco - 200.0
El Sewedy Electric Egypt - - -
†Includes MADE and Eólica turbines
Source: Authors’ compilation
Production of wind turbine components on the continent has been limited to small scale system
producers mainly in South Africa and Egypt. In South Africa, manufacturers such as Kestrel
Renewable Energy, African Wind Power and Palmtree Power produce low capacity turbines (less than
300 kW) that are not adequate for large-scale commercial power production and connection to national
grids. At the higher capacity level of localised production in South Africa, Isivunguvungu Wind Energy
Converters (I-WEC) produces wind turbine systems with a capacity of up to 2.5MW. In Egypt, the
wind turbine manufacturing industry is dominated by El Sewedy through its two subsidiaries: El
Sewedy for Wind Energy Generation (SWEG) with a plant that produces wind turbines of 1.65 MW
capacity; and SET SIAG El Sewedy Towers - a joint venture with Germany’s SIAG Schaaf Industrie
AG that manufactures towers and rotor blades.
The manufacturing landscape is poised to change as more global players increase their presence on the
continent. In South Africa such developments have been encouraged through the Renewable Energy
Independent Producers Procurement Programme (REIPPP) that is targeting installation of 1,850 MW
of on shore wind power with at least 35% local content requirements. Both South Africa and Egypt
owe their success in the manufacturing industry to the existence of adequate regulatory and policy
frameworks, well established research and development institutions and a relatively low cost of doing
11business in the two countries. However, more needs to be done to boost the industry. Policy makers not
only need to focus on ways in which international technology providers could be attracted to the
continent but also focus on taking advantage of regional and intra-continental economies of scale and
encourage skills and technology transfer through partnerships between local firms and established
global manufacturers (IRENA, 2013).
Local content in a wind turbine manufacturing industry that is well integrated with the local supply
chain creates jobs and enhances capacity for local companies to become more innovative and
competitive. Studies have demonstrated that local production of wind energy components could reduce
system costs by 25% in the long term (Razavi, 2012).
3.4 Financing of Wind Energy Projects in Africa
In this section we discuss trends in project costs and funding sources. Project costs are interesting in
understanding industry development because they give an indication of both the resource needs per unit
of installed capacity, and signal affordability of wind technologies in Africa as well as the level of
maturity of the market. Project costs do not solely depend on installed capacity, but also on the
project’s location, the requisite off-take infrastructure and general costs of doing business. Therefore
for meaningful conclusions to be drawn from the cost analyses one needs to look at disaggregated cost
data at individual project level. This information was not available to us on a large enough sample size
to conduct this assessment.
From the aggregated cost data11 some broad observations can be made. Total project costs range from
as low as USD 0.5 million (the cost of the small pilot at Rodrigues Island in Mauritius), to USD 900
million – the cost of Morocco’s largest planned wind farm, the 300MW Al Koudia Al baida II Wind
Farm. As expected, the cost of projects has increased over time (Figure 3.7). About a third of the
projects, both completed and planned, for which cost statistics were available, are small, costing less
than USD 50 million (Figure 3.8).
Figure 3.7: Trend in Total Project Costs Figure 3.8: Distribution of Total Project Costs
1000 25
800 20
Project Cost, USD million
600 15
Frequency
10
400
5
200
0
0 0 200 400 600 800 1000
1980 1990 2000 2010 2020 -5
Project cost, USD million
Project completion year (actual or expected)
Source: Authors’ analysis Source: Authors’ analysis
11
From the list of compiled projects, aggregated data on project cost was available for 65 projects (29 completed, 14
ongoing and 22 planned).
12On the basis of the restricted sample for which cost data was available, on average, between USD 1.25
and 3 million is spent per MW of installed capacity (Figure 3.9). 72% of projects fall in this cost range.
This is consistent with the expected high upfront costs associated with wind energy technology, and the
range of costs observed on global markets of between EUR 1.1 million and EUR 2.25 million per MW
(International Energy Agency, 2009). Exceptionally high per unit capital costs are observed in smaller
scale operations, for example, the 0.3 MW pilot Inhambane in Mozambique which cost the equivalent
of about USD 5 million per MW. We observe a negative correlation of -0.27 between per unit capital
cost and installed capacity (Figure 3.10).
At the aggregate cost level, no clear global trend over time in costs per unit of installed capacity can be
deduced from a statistical analysis which does not control for operation size and the costs of ancillary
infrastructure such as transmission lines and access roads. Yet, there are few markets where trends can
be deduced – Egypt, South Africa and Morocco – where wind farms are located in similar geographic
areas, and there is a large enough sample. We find that costs per unit are on marginally decreasing
trend only in Egypt. In South Africa, the cost per unit MW for planned projects appears to be higher
than the unit cost for completed pilots; while in Morocco the trend is similar but not strong (Figure
3.11).
Figure 3.9: Distribution of Costs per Unit of Installed Figure 3.10: Capital Costs per Unit of Installed
Capacity Capacity
6
25
5
20
USD million per MW
4
15
Frequency
3
10
2
5 1
0 0
0 1 2 3 4 5 6 0 100 200 300 400
USD million per MW Installed Capacity per Project (MW)
Source: Authors’ analysis Source: Authors’ analysis
There are several possible explanations: different levels of maturity of the markets especially when
comparing Egypt to South Africa, and an economies-of-scale advantage for Egypt (a typical pipeline
project in Egypt is about 2.5 times as large as a typical planned project in South Africa). In Egypt,
several projects have been planned or implemented in close proximity (for example, the 8 and 6
individual projects at Zafarana and the Gulf of Zayt wind farms respectively); such occurrences
significantly reduce the need for new ancillary infrastructure. Meanwhile, South Africa’s projects are
located in different coastal areas of the country, hence the need to integrate new ancillary infrastructure
in the projects. It is also important to note that there could be mispricing in the current bids for IPP
procured wind energy projects (especially in South Africa), given that most projects were at the first
bidding stage which focuses on technical aspects, and had not yet competed on price. Unit costs can
therefore be expected to stabilize in the medium term.
These cost trends are also closely linked to the profile of project developers in the three countries:
government-sponsored projects being least expensive on average, followed by PPPs, then private
13sponsored projects. This conclusion seems to hold on the full sample as well (Figure 3.12). This
observation is partly a reflection of the terms at which governments mobilize funding for the projects as
compared to private sponsors. Whereas governments may have access to cheaper financing through
grants and concessional loans from development agencies, private sponsors mobilize financing at
commercial terms which are relatively more expensive. In addition, it is likely that private promoters of
pipeline projects adopt equipment which is more costly, but more productive in the long term in order
to maximize returns over the life of the project. However, the standard deviation of unit costs for
government sponsored projects is noteworthy; some projects (mostly the pilot projects) also have
higher unit costs.
Figure 3.11: Distribution of Costs per Unit of Installed or Figure 3.12: Per Unit Cost by Type of Sponsor
Planned Capacity
4.0 6
3.5
5
Unit cost, USD million per MW
Unit cost, USD million per MW
3.0
2.5 4
2.0
3
1.5
1.0 2
0.5 1
0.0
1980 1990 2000 2010 2020 0
0 1 2 3 4
Project completion year (actual and expected)
Egypt Morocco 1=Public; 2=PPP; 3=Private
South Africa Expon. (Egypt)
Linear (1=Public; 2=PPP; 3=Private)
Expon. (Morocco) Expon. (South Africa)
Source: Authors’ analysis Source: Authors’ analysis
Further conclusions can also be drawn on the trends in sponsorship of projects. The public sector
emerges as the main sponsor of completed wind projects in Africa for the reasons already outlined in
section 3.2. Government sponsorship has been either through domestic utilities or special agencies
established to promote clean energy projects like the NREA in Egypt. We find that 78% of all
completed projects were government sponsored, relative to 14% private sponsored and 7% public-
private sponsored projects. The private sponsored projects include Morocco’s industries self-generation
projects (for example, the La Farge Wind Farm developed by the cement manufacturer La cimenterie
de Tetouan)12, and the wind energy project sponsored by South Africa’s Eskom in Mozambique
(Inhambane Wind Project).
The landscape of sponsors is expected to significantly evolve in the coming years. Most countries will
seek private (e.g. South Africa) or public-private (e.g. Morocco) sponsorship of wind energy projects.
Egypt is expected to increase private sponsorship of projects to about two thirds of its planned projects
portfolio, although at present, NREA is still the primary promoter of pipeline projects. Only 37% of the
12
This was facilitated by the 2008 electricity self-production law and Morocco’s EnergiPro initiative.
14pipeline projects are expected to be government sponsored, relative to 52% private and 11% public-
private sponsored projects.
We also review the mode of procurement, in particular of private sponsored projects, to assess the
evolution of roles played by public and private partners in the wind energy industry. Results show that
concessions – where the government passes the responsibility and risks of building, operating and
maintaining the projects to private operators – are becoming more common. The most common PPP
model observed in completed projects is the build-own-operate (BOO) scheme on projects fully owned
and managed by the private sponsor. Morocco’s auto-producers tip the scale in favor of this model.
BOOT contracts are more common in non-captive completed wind projects, as already discussed under
section 3.2. Concession periods generally range between 20 and 30 years. PPPs are attractive from both
a resources and risk-allocation perspective, as depicted by the Cabeolica wind farm (Box 3.1).
Box 3.1: Funding Cabeolica Wind Farm, Cape Verde
Project description: Cabeolica Wind Power project was to construct, operate and maintain four wind farms, with a
combined capacity of 25.5 MW, on four islands (Santiago, São Vicente, Sal, and Boa Vista) of Cape Verde.
Developers: Cabeolica was jointly developed by the Government of Cape Verde, Electra (the state-owned power utility
company) and an infrastructure development company, InfraCo. InfraCo, which is privately managed but publicly funded
by DFIs, was heavily involved in upstream activities to design and structure the project. The early stage development
risks of the project were borne by the developers which paved the way for other investors to participate in the project.
Project structure: The project was based on a PPP structure involving the Government of Cape Verde, Electra, a private
equity fund (FinFund), the Africa Finance Corporation (AFC) and InfraCo. The project was developed using a Build Own
Operate (BOO) procurement model implying that the operators would bear the risk of building, operating and
maintaining the project.
Financing: The total cost of the project was EUR 64 million of which the sponsors (The Africa Finance Corporation,
InfraCo, FinFund, Electra and the Government of Cape Verde) mobilized equity financing worth Euro 19 million. Apart
from indirectly providing equity funding to the project through InfraCo, DFIs further contributed all the debt financing.
The AfDB and EIB provided Euro 15 and 30 million respectively in senior loans with a tenor period of 15 years and a
grace period of 2 years.
Risk management: To enhance the bankability of the project, several risk mitigation measures were adopted as
demonstrated below:
The private sponsors of the project were insured against political risk through the World Bank’s Multilateral
Investment Guarantee Agency (MIGA) facility.
A 20-year ‘take or pay’ Power Purchase Agreement was signed between the project company (Cabeolica SA) and the
national power utility company (Electra) to purchase all the electricity produced by the project.
A Support Agreement was signed by the Government and Cabeólica SA to guarantee that any payment deficiency on
the part of Electra would be covered by the Government.
A turnkey Engineering Procurement and Construction (EPC) contract and a service agreement, in form of an
Operation and Maintenance (O&M) contract, were signed with a leading company in wind energy technology to
reduce the sponsor’s exposure to risks during construction and operation of the project.
Due to the volatility of the local currency, the price for electricity purchased from the project in accordance with the
PPA was expressed in Euros.
Source: AfDB, 2010
About USD 1.8 billion has been invested to develop the 1.1GW of installed wind generation capacity
on the continent. Of the USD 1.8 billion, 59% was contributed by Development Finance Institutions
(DFI) through non-concessional funding; mostly bilateral development agencies which account for
15You can also read