PROJECTED SKILLS DEMAND AND SUPPLY FOR THE ELECTRICAL ENERGY SECTOR
←
→
Page content transcription
If your browser does not render page correctly, please read the page content below
Human Sciences        Development Policy   Sociology of Work
Research Council      Research Unit        Unit

                   RESEARCH CONSORTIUM
_______________________________________________________________

    PROJECTED SKILLS DEMAND AND
  SUPPLY FOR THE ELECTRICAL ENERGY
               SECTOR

                       Sector Studies
                      Research Project

                        MARCH 2008

            RESEARCH COMMISSIONED BY
              DEPARTMENT OF LABOUR
                  SOUTH AFRICA
Sector Report for HSRC
PROJECTED SKILLS DEMAND AND SUPPLY
FOR THE ELECTRICAL ENERGY SECTOR
Jeff Lomey and Kent McNamara
The Learning Event
September 2007
1Table of Contents
Page
Chapter One : Profile of the SA Electrical Energy Sector 3
Aims and methods 3
Sector scope 3
Note on data sources 4
The skills debate 5
Contextual overview 7
Stakeholders and linkages 9
Employment scope 10
Electrical power demand and supply 11
Alternative energy sources 13
Chapter Two : The Demand for Skills in the Electrical Energy Sector 16
Trends in electricity-related employment and occupations 16
Expansion plans 21
Forecasting job and skills demand to 2012 24
Future skills demand for renewable energy 28
Chapter Three : Sector Case Studies 32
The Eskom state-owned utility 33
Ukubona Electrical 36
City Power – Johannesburg 36
City of Cape Town 37
Darling wind farm 38
Implications 39
Chapter Four : The Supply of Skills for the Electrical Energy Sector 40
Enterprise training in South Africa 40
Supply of graduates from tertiary institutions 42
Further education and training of engineers and tradesmen 42
Higher educational output in electrical engineering and technology 46
Higher educational output for renewable energy 50
Implications 51
Matching supply and demand in the electrical energy sector 52
Linkages in the labour market 54
Chapter Five : Conclusions 56
Overall skills outlook for the electrical energy sector 56
Bottlenecks and remedies affecting supply of skills 57
References 60
List of Interviews and Contacts 62
Annexures
One : Headline Stories in Engineering News 2006-2007 63
Two : Eskom Electricity Sales, Output and Performance 2003-2006 65
2Chapter One
Profile of the SA Electrical Energy Sector
This research report provides a review of the current and future skills demand
and supply situation for the South African energy sector specifically in the
generation, transmission and distribution of electrical energy. The report also
contains a synthesis of these findings and a selection of case studies and
identifies critical skills shortages, likely blockages to skills development and
potential opportunities for job creation.
AIMS AND METHODS
The research aims to:
• Provide support for government’s AsgiSA initiative with a particular focus
on skills development and job creation;
• Contribute to the better alignment between skills development policies
with industrial or sector initiatives/policies;
• Develop a sectoral and enterprise focus in the debate about skills
development in South Africa; and
• Make a contribution to the SETA community by providing an up-to-date
analysis of the critical inter-relationships between industrial policy, sector
(or economic) growth and skills development.
This report presents the result of the research, covering :
• A high-level overview of the sector, drawing on available secondary
sources;
• An assessment of current and projected demand for skills, based mainly
on sector trends and occupational data;
• A review of case studies of selected organizations, covering skills
demand-supply variables;
• A review of the current and projected supply of skills from educational
and training institutions, as well as enterprise training initiatives, based
mainly on educational data; and
• A concluding assessment to identify possible bottlenecks and barriers
affecting the supply of skills, consider policy issues and make
recommendations.
The research methods applied included perusal of primary and secondary
literature, access to a variety of databases made available by the HSRC, recent
news items, website scans, interviews and case studies.
SECTOR SCOPE
This review focuses on the sector concerned with the generation, transmission
and distribution of electrical energy in South Africa. This includes all forms of
generation ranging from non-renewable to renewable sources. The review
excludes biofuels and natural gases, except where they are utilized to produce
electrical energy.
3This review cover a number of key electricity-related sub-sectors, notably
electricity production, collection and distribution, the manufacture and
maintenance of electric motors, generators and transformers, distribution and
control apparatus, insulated wire and cable. These sub-sectors will be reviewed
to identify any growth or changes in these sectors associated with the
expansion of energy generation and distribution and consider the implications
for skills requirements.
The report will examine not only formal employment trends relating to the
electricity sector and related sub-sectors, but will also consider patterns in
informal employment and unemployment, to identify possibly opportunities for
promoting growth in informal economic activities and reducing unemployment.
The time frame for the review will cover trends in historical statistical data for
the period 1996 to 2005. As far as future strategic projections are concerned,
the report will mainly review implications for skills demand and supply up to
2012. Beyond that, a limited assessment will be offered for the future to 2025,
given that this timeframe features in some scenario planning.
This high-level overview of the sector assesses the status of electrical energy
sector in South Africa, current and projected growth of the sector, alternative
sources of supply, power conservation and demand management, changing
market size, the role of small and medium sized enterprises, opportunities and
barriers to entry, sector performance and key statistics.
The overview sets the background and context for assessing current and future
skills requirements pertaining to key occupations, as well as broad barriers and
enablers affecting the supply of skills and the job creation potential of the
sector.
The primary skills considered are professional and technical electrical engineers
and artisans, although a broad focus will also be placed on the National
Qualifications Framework (NQF) levels in relation to formal and informal sector
skills requirements and availability.
NOTE ON DATA SOURCES
The information presented in this report has been largely dependent on:
• The available employment and educational data obtained from the
HSRC; and
• The availability of data requested from other organizations, mainly for
case study purposes.
The databases supplied by the HSRC which have been extensively used
include :
• the Department of Education’s Higher Education Management
Information System (HEMIS- DoE 2007a);
4• The DOE’s Further Education and Training (FET) output for 1996 to 2005
(DoE, 2007b);
• StatsSA’s October Household Survey (OHS) for 1996-1999 (Quantec
2007); and
• StatsSA’s Labour Force Survey (LFS) for 2000-2005 (Quantec, 2007).
The case study profiles were drawn up using mainly website information,
published sources (such as annual reports) and interviews and correspondence
with organization representatives. A number of companies in the sector
approached for skills-related information did not supply the requested
information within the available time period.
THE SKILLS DEBATE
The so-called skills shortage has been dominating news headlines in South
Africa for the past few years. Recently, the annual International Business
Report Survey from Grant Thornton, found that a shortage of skilled workers
was regarded as the main impediment to business expansion by 58 percent of
200 respondents in medium-to-large businesses (Business Day, 16 July 2007).
The skills debate has not been without controversy. The Commissioner for
Employment Equity (CEE), for example has been on record that the “shortage”
is artificial and due to the unwillingness of many employers to hire black people.
By contrast, the trade union Solidarity has claimed that affirmative action
contributes to the skills shortage by failing to recruit or retain skilled white
people (Business Day, 8 July 2007).
Many independent commentators and business leaders believe that there is
indeed a skill shortage (see comments by Ann Bernstein of the Center for
Development Enterprise and Wiseman Nkuhlu in the Sunday Times, 10 June
2007). The legacy of “Bantu Education” is recognized by many as having
stunted the development of skills in the country.
For government, acknowledgement of this legacy led to the drafting of the Skills
Development Act and Employment Equity Act (among others), with a view to
promoting the training, development and advancement of previously
disadvantaged people. More recently, government has launched the
Accelerated and Shared Growth Initiative for South Africa (AsgiSA, 2006), and
the Joint Initiative on Priority Skills Acquisition (JIPSA, 2006), which reflect its
twin concerns about skills and job creation, particularly the shortage of
professional engineers and artisans.
The demand for skills, especially intermediate and high-level engineering and
artisan skills, appears to be intensifying. According to the Department of
Labour’s (DoL) most recent report on the “State of Skills in SA” (2005), there
has been a shift towards capital-intensive production calling for more skilled
labour associated with an export-led economy. The DoL report quoted
SASOL’S claim in 2003 that the country was already short of at least 20 000
artisans.
5A number of current developments can be identified which could be placing
pressure on the supply of skills. A major drive is underway to boost the
transport infrastructure across South Africa, focusing mainly on upgrading
Transnet’s railways and ports, which needs engineers and technicians.
For the next few years at least, the infrastructural work on the Gautrain and the
2010 world cup soccer is also drawing away seemingly limited engineering and
technical skills.
Furthermore, a global commodities boom has been taking skilled artisans and
engineers away from South African mining operations to other countries,
including parts of Africa and Australia.
Government’s JIPSA anticipates that the number of engineers produced each
year will need to be almost doubled from 1400 to 2400, whereas artisans will
need to more than double from 5000 to 12500 every year over the next four
years.
Within the electrical energy sector, there has also been a reported lack of skills
and jobs. For example, the “Engineering News” periodical has made frequent
reference to these challenges in their energy-related headline stories during
2006/7 :
Table 1.1
Headline Energy Topics in Engineering News : 2006 - mid 2007
Headline Topic Category No. reports
New generation capacity * 13
Renewables and environment ** 7
Energy planning 6
Skills shortages, job creation and development 5
Contracts and agreements 3
Pricing 2
Distribution restructuring 1
Independent power producers 1
* Includes coal-fired, nuclear and gas
** Includes biofuels, landfill, wind, co-generation, solar
This range of topics reflects not only the skills/jobs issue but also the planned
expansion of the energy sector and the debate around renewable energy
sources (see Annexure One for more detail on these new items).
The main aim of the present research will be to establish, through the use of
available supply and demand information, the extent to which the electrical
energy sector can be described as experiencing a current and future skills
shortage.
The related question of job creation and unemployment will also be considered,
given government’s concern about the abundance of marginalized youth in the
6unskilled, semi-skilled and small business sectors, including the “informal
sector” :
“Sufficient employment creation remains the most crucial and most difficult of
the ASGISA objectives” (AsgiSA Annual Report 2006)
This paper is informed by the perspective that skills development in South
Africa cannot be tackled separately from job creation and poverty alleviation.
CONTEXTUAL OVERVIEW
Eskom has dominated the energy sector as the main supplier and distributor of
electricity since early in the last century, producing 96 percent of the total.
As of mid-2007, Eskom operated 24 power stations across the country :
Table 1.2
Provincial Distribution and Type of Eskom Power Stations
Province/Type of Coal- Hydro- Gas Pumped Nuclear TOTAL
Generation fired electric Turbine Storage
Mpumalanga 11 11
Eastern Cape 5* 1 6
Western Cape 1 1 1 3
Northern Cape 1 1
Limpopo 1 1
KwaZulu Natal 1 1
Free State 1 1
TOTAL 13 6 2 2 1 24
* Includes 4 smaller hydro-electric units forming part of the Distribution infrastructure
Source : www.eskom.co.za
Table 1 indicates that power generation is concentrated in the Mpumalanga
province, which has extensive coal fields in the north-eastern highveld region of
South Africa.
Ten of South Africa’s coal-fired stations provide base load power for the
national grid, with three additional “mothballed” stations currently being returned
to service (several stations were “mothballed” or shut down during the 1980s as
a result of the slowdown in economic growth during the apartheid sanctions
era).
The hydro-electric, pumped storage and gas turbine stations are “peak load”
stations which can bring additional power to the grid within a relatively short
time period to meet peak demand (pumped storage stations transfer water from
lower to upper dams when there is sufficient electricity available, and store the
water until the station needs to generate electricity again).
One of Mpumalanga’s stations (Kendal) is reported by Eskom to be the largest
fossil-fuel station in the world, with a generation output of 4116 MW. Matimba
power station in Limpopo is also the largest dry cooling station worldwide (3990
MW). The rest of South Africa’s coal-burning stations are mainly water-cooled
7(Eskom annually consumes 1,5 percent of the country’s total water consumption
in the production of electricity).
As far as interconnections across national borders are concerned, South Africa
supplies more than half of the electricity used on the African continent. It
supplies power directly to Lesotho, Swaziland, Botswana, Namibia and
Zimbabwe (although these services have been affected by the utility’s “load-
shedding” practices in recent times).
South Africa also imports around 2000MW from Cabora Bassa in Mozambique
and there are plans in future to import power from Namibia (mainly from the
Kudu gas field). There have, however, been recent problems of supply from
Cabora Bassa due mainly to poor weather conditions in Mozambique.
As power leaves each station, the electricity is boosted by step-up transformer
to higher voltages (132 kV, 400 kV or 765 kV) for conveying through the
transmission infrastructure of overhead lines. When the electricity reaches a
substation near a load centre (such as Gauteng, Western Cape or KwaZulu
Natal), it is stepped down to lower voltages for distribution to customers via the
distribution network.
As of March 2007, South Africa had a total of 27 770 km of high voltage
transmission lines and 325 000 km of distribution lines. The distribution in urban
areas is shared between Eskom and Municipal councils. Municipalities are by
law entitled to sell and distribute power and in their demarcated areas (there is
no legal role or responsibility for the provinces in respect of electricity supply).
Municipalities provide new connections and maintenance for domestic
(residential) consumers, whereas Eskom provides electricity and maintenance
services directly to “bulk” customers, such as mines and industries. (Jeff is this
right?)
In 1994, the inaugural year of South Africa’s new democracy, the average level
of electrification countrywide was 36 percent. By 2004, this had risen
dramatically to 72% (Eskom, 2007). During that time, the number of rural
households electrified countrywide rose from 12% in 1994 to 52% by 2005.
While this is a significant historical achievement, close to half of the rural
population still does not enjoy access to grid-based electricity, partly due to the
size of the country and long distance between towns.
Rural households comprise the majority of poor homes and are characterized
by "energy poverty", which is exacerbated by the increasing scarcity of fuel-
wood. The cost of providing an extended national grid to rural areas becomes
increasing expensive, given that small consumption by the end-user makes the
investment in power lines not economically viable. In these areas, alternate
sources of (renewable) energy become more attractive.
In 2004, industry consumed the lion’s share (38 percent) of electrical energy,
followed by mining (15,9 percent) and the domestic residential market (16,8
percent – NERSA, 2004). Most household energy is obtained from fuel wood
8(50 percent of net household energy), primarily in rural areas, with the
remainder from coal (18 percent), illuminating paraffin (7 percent) and a small
amount from liquid petroleum gas (South Africa Yearbook 2005/6).
STAKEHOLDERS AND LINKAGES
The electricity sector falls under the responsibility of the Department of Minerals
and Energy (DME). The DME's Energy Policy, as set out on its website, is
based on the following key objectives:
• Attaining universal access to energy by 2014;
• Accessible, affordable and reliable energy, especially for the poor;
• Diversifying primary energy sources and reducing dependency on coal;
• Good governance and the promotion of private-sector investments in the
energy sector; and
• Environmentally responsible energy provision.
At the center of the electricity market are those entities involved in the
generation, transmission and distribution of electrical power, starting with the
national supplier Eskom as a state-owned enterprise. Partly because of the
large start-up capital costs associated with generation capacity and
transmission infrastructure, there are few independent power producers (IPP) in
the country.
However, one or two IPPs have emerged in recent times, such as the German
company IFE, which has signed an agreement with the state-owned Central
Energy Fund (CEF) to establish a new company (Johanna Solar) in a bid to
help commercialise solar technology in South Africa.
Overseeing the role of Eskom and the IPPs is the National Electricity Regulator
(NERSA), which together with the DME, strives mainly to ensure that electricity
tariffs and capital expansion plans are aligned with national policy and
development objectives.
The linkages within the energy sector are characterised by both the supply side
to the sector and demand side from the sector, each of which has numerous
stakeholders.
The upstream supply side includes the many coal mining companies supplying
fossil fuel to power stations, water supply (mainly for cooling), sugar mills (for
bagasse), finance, transport, labour market, goods and services and gas
exploration. The electrical energy industry is also broadly supplied by the major
producers of steel and petroleum products, international and local equipment
manufacturers, construction companies, research and technology institutions,
professional engineering and local government associations, universities and
colleges (ESETA, 2005).
The downstream demand side includes market demand, goods and services,
the industry's own generation, transport, the environment, municipal distribution
entities and effectively the entire country, including a significant contribution to
GDP growth.
9By far the least involved stakeholders are those in the informal sector and small,
medium and micro enterprises (SMME) which may have entrepreneurial,
intermediate and low level technical skills and could contribute more effectively
to supporting the production and distribution of energy, as well as for job
creation. As will be shown in the report, however, the informal sector in the
electrical energy sector is poorly developed.
EMPLOYMENT SCOPE
According to the latest Department of Minerals and Energy web site and policy
report, energy comprised about 15 percent of South Africa's gross domestic
product (GDP) in 2003, creating employment directly and indirectly for about
250 000 people.
The delineation of the electrical energy sector depends in large part on the
boundaries set to include or exclude the demand and supply-sided institutions
listed above. For example, the coal-mining workforce which supplies fossil fuel
to coal-fired power stations, could be viewed as enjoying indirect employment in
the energy sector. However, from the perspective of this research, the mining
industry is understood to represent a separate national sector. Similarly,
whereas the construction industry may be (temporarily) engaged in the erection
of energy installations, employment numbers in this sector are also excluded
from this analysis.
In an effort to adequately delineate and quantify the size of the electrical energy
sector and determine its specific skills requirements, sectoral occupational data
was consulted (drawn from the Stats SA household and labour force surveys).
The following key sub-sectors were identified in the data :
• At the core of the sector are those formal organizations directly involved
in the production, collection and distribution of electrical energy, which by
2005 employed 70 206 people; of these, 29 697 were employed within
Eskom and 12 359 within the municipalities;
• A supporting formal sub-sector can also be identified which employed 44
520 people in 2005 and provides electrical equipment and other services
to the core, including the manufacture of motors and transformers, wires
and cables, distribution and control apparati, as well as some related
research services;
• A small informal sector can also be identified which in 2005 employed
1115 people in electricity production, distribution and research.
Within these boundaries, at least 115 000 persons can be described as being
employed, formally and informally in the South African electrical energy sector
in 2005 (the latest year for which data was available).
Apart from the 12 359 municipal personnel involved in the distribution of
electrical energy to commercial and residential end-users, roughly half of
Eskom’s workforce (14 778) is also involved in distribution, bringing the total
number of people as a distribution sub-sector to 27 137 (ESETA 2005, p.20).
10The electricity distribution industry has been characterized by some duplication.
For example, ESKOM maintenance personnel look after substations and lines
in a metropolitan area, while skilled municipal workers are doing the same in
residential suburbs. The planned formation of Regional Electricity Distributors
(REDs) which involve a merger of Eskom distribution with that of the
municipalities, is expected to partly address these overlaps, but to date the six
planned REDs for the country have not yet been implemented, mainly due to
policy uncertainty and lack of capacity.
For purposes of this research, the available quantitative data on the numbers of
personnel directly involved in the production, collection and distribution of
electrical energy, as well as the supply of electrical components and equipment,
will be the core focus, covering both the formal and informal sectors.
ELECTRICAL POWER DEMAND AND SUPPLY
For decades, electrical energy in South Africa has been among the cheapest in
the world. However, as the economy has expanded, power demand has been
increasing, hitting a record high of 35 479 MW in the winter of 2007, as a severe
cold front cut through the country, causing the mercury to plummet (Engineering
News, 22 May 07). The record was 672 MW above last year’s record of 34 807
MW, set on June 29.
The total electricity sales by Eskom in 2006 grew to 208 316 Gigawatt-hour
(GWh – see Annexure Two for detailed sales and performance of the Eskom
utility).
The frequency of power blackouts and load-shedding and the prospects of
increased prices for electrical energy in future, has become a matter of national
concern. It is clear that Eskom’s current installed capacity will be insufficient to
meet forecasted demand, as Figure 1.1 shows :
Figure 1.1
Eskom Capacity Status and Maximum Demand Forecast
(Source : ESETA Sector Skills Plan 2005-2010)
11Why has South Africa’s electricity supply become inadequate for current and
future needs? Many have argued that the demand for energy has grown
because of unexpectedly higher economic growth rates. However, Anton
Eberhard of the UCT Graduate School of Business and an acknowledged
expert on energy policy, has recently pointed out that annual peak demand for
electricity has grown on average by just over 3,6 percent per annum since
2000, and current peak demand is actually lower than that predicted in Eskom’s
strategic planning (Eberhard, 2007a).
Eberhard lists four main reasons for recent supply failures. First, policy
uncertainty has slowed investment. In 2001, Eskom was prohibited by
government from building new generation capacity (partly to encourage
independent power producers to take up the challenge).
Second, poor co-ordination has caused further setbacks. There have been
licensing delays and delays in finalizing bids for private independent power
plants, due in part to poor co-ordination between Eskom, the regulator
(NERSA), the Departments of Minerals and Energy (DME) and Public
Enterprises (DPE).
Third, some planning assumptions have been wrong. Estimates for generation
plant availability were too optimistic and reserve margins were set too low (the
national reserve margin has decreased from 25 percent in 2001 to 6 percent in
2006 – Eberhard, 2007b).
Fourth, inadequate maintenance and negligence has played a role. The
regulator concluded that the Western Cape outages were due to negligence on
the part of Eskom personnel, and procedures were inadequate (although
Eskom has disagreed with these findings).
Whatever the causes, Eberhard notes that “the primary constraint is time” and
that there will be further outages, higher demand growth, delays and an ongoing
scarcity of skills in future.
In his address to the Africa Energy Forum in Hamburg on 27 June 2007,
Eberhard warned that
“Electricity supply security is threatened not only by inadequate generation
capacity, but also by distribution failures caused by inadequate investment in
human and physical capital (which is) caused by policy uncertainty and lack of
progress in establishing REDs” (Eberhard 2007b).
For its part, the Energy Resource Center (ERC) takes a broad view of South
Africa’s energy priorities. The Center’s recent report on “Energy Policies for
Sustainable Development in South Africa” stresses the need to reduce overall
demand, improve efficiencies, improve design of buildings for energy efficiency,
make more efficient use of energy in the residential sector, apply alternative
supply-side measures such as gas, hydro and renewables, stimulate bio-diesel
production, levy a tax on coal and achieve emission reductions (Winkler, 2006).
12The ERC report did not comment directly on the skills requirements for the
sector, which are implied in its listed priorities.
To address the challenge, Eskom is embarking on a programme to establish
new generation capacity over the next five years, at a cost of R97 billion.
Beyond 2012, with an average expected growth in demand of 4 percent,
roughly 2000 MW will be added every year to 2025, to eventually double
existing capacity by that date (Eskom Annual Report for 2006).
From a skills point of view, it is clear that while skills shortages have played a
part, they do not appear to be the primary cause of the country’s electricity
supply problems, which can be traced mainly to policy uncertainty, poor
planning and co-ordination.
Going forward, however, projections of skills requirements will be affected by
the fact that rapid planning has now had to be done on a large scale to remedy
the challenges. There could well be a lag in the development and deployment of
skills to support the rapid expansion of the sector over the next 5 to 10 years
and beyond, which will be considered later in this analysis.
ALTERNATIVE ENERGY SOURCES
Electricity generation in South Africa has for long been dominated by coal,
which makes up 93 percent of the total :
Figure 1.2
Energy Sources for Electricity Generation in South Africa (2001)
5% 2%
93%
Coal Nuclear Hydro/Pumped Storage
(Source : NERSA 2004, Electricity Supply Statistics)
Nuclear energy makes up 5 percent, but the Minister of Trade and Industry
announced that Eskom could consider an additional 5000MW of nuclear energy
by 2023 to add to the generation mix (Eng News 27 Oct 2006).
Renewables currently make up a negligible part of the total supply. Eskom has
some pumped storage and hydro generation. There are co-generation, wind,
solar, landfill gas, bagasse and other projects which are experimental, planned
or in use. The low cost to date of electricity produced through burning fossil
13fuels (and the fact that external environmental, social and economic costs are
not built into the price), has mitigated against the use of renewables to date,
which can only become more attractive as the price rises in response to
reduced supply or increased demand.
Renewable resources currently in use include :
• Biomass: Supply of wood from natural woodlands in communal rural areas is
estimated at 12mt.
• Wind: Approximately 300 000 windmills are being used for watering livestock
and supplying communities with water. In 2003 the first wind-energy farm
was established.
• Solar: There is more than 2 500 hours of sunshine per year and average
daily solar radiation levels range between 4,5 and 6,5 kWh/square meter in
one day. The country's solar equipment industry is developing. Annual
photovoltaic panel assembly capacity totals 5MW and a number of
companies in South Africa manufacture solar water-heaters. Current
capacity installed includes domestic 330000 square meter and swimming
pools 327 00 square metre, commerce and industry 45 000 square metre
and agriculture 400 square metre.
• Hydro: The current installation is 2 061 MW, with potential of 3 500 MW
(ESETA, 2005, p.25).
The present wind energy projects include research and development as a major
component. These include ESKOM Klipheuwel Wind Turbine Test Centre,
Darling National Demonstration Project, Darling Visitor, Training and Education
Centre, the South African Wind Energy Project, DME/NER/CSIR/SHELL Wind
Hybrid Mini-grid Systems and Kestrel Wind Charger (ESETA 2005).
Research and trials have also been conducted into the use of energy-saving
methods (such as CFL globes) at community level, notably the Kuyasa-
Khalitsha clean development mechanism initiative (City of Cape Town), and
geyser insulation work in Cape Town suburbs.
Looking to the future, the DME in 2003 set a target of 10 000 GWh of renewable
energy contribution to final energy consumption by 2013, to be produced mainly
from biomass, wind, solar and small-scale hydro (DME, 2003).
In summary, this contextual overview of the electrical energy sector in South
Africa has revealed the following :
• Approximately 115 000 persons are employed in the production,
collection and distribution of electrical energy in South Africa, together
with the provision of electrical equipment and related services;
• Electrical energy has been dominated historically by Eskom as the key
state-owned electricity utility, and there are currently few independent
power producers (IPP) in the sector;
• The production of electrical energy has been characterized by the burning
of fossil fuels, with a negligible contribution to date of renewable sources;
• Due to supply problems arising from policy uncertainty and poor co-
ordination, the sector is embarking on a major expansion programme over
the next 15 years, mainly through the further use of fossil fuels for
14generation, but also with some consideration for a ”mix” of nuclear and
renewable options; and
• These expansion plans, together with the preferred energy mix, present a
special challenge to the development and deployment of skilled human
resources to support the planned growth of the sector over the next 5 to
10 years and beyond.
Accordingly, the current and projected demand for skills in the context of these
changes in electricity supply, will be considered in the next chapter.
15Chapter Two
The Demand for Skills in the Electrical Energy Sector
The electrical energy sector in South Africa is currently embarking on a capital
expansion plan to extend installed generation capacity. At the same time, the
sector is starting to shift away from fossil fuels to consider a range of alternative
(renewable) sources, partly in response to environmental concerns.
Will the electricity labour market have the necessary skills to support this
expansion? To address this question, this chapter will first look at trends in
employment and occupational data in the electricity supply industry, to
determine the current skills mix of the industry.
This will be followed by an assessment of the industry’s expansion plans and a
projection will be made of the likely scope for job creation in the sector.
Finally, the future skills requirements will be considered.
TRENDS IN ELECTRICITY-RELATED EMPLOYMENT AND OCCUPATIONS
To assist in forecasting the likely demand for skills, a review was conducted of
trends in employment in the electricity sector and related sub-sectors between
1996 and 2005.
Overall, employment levels in the formal electricity sector underwent a slow
decline to 2000, gradually increasing thereafter :
Figure 2.1
Formal Employment Levels in the Electrical Energy Sector 1996-2005
140000
120000
100000
80000
60000
40000
20000
0
1996 1997 1998 1999 2000 2001 2002 2003 2004 2005
Figure 2.1 – 1996 1997 1998 1999 2000 2001 2002 2003 2004 2005
Base Data
125972 110092 96149 79684 81700 93824 84311 91590 114813 114727
Source : Quantec, 2007 (StatsSA OHS Data for 1996-1999; StatsSA LFS Data for 2000-2005)
16The upward trend after 2000 can be attributed mainly to the national
electrification programme. As noted in the previous chapter, electrification in
South Africa rose from 36 percent in 1994 to 72% in 2004. To achieve this
dramatic increase, employment grew across the sector after 2000 to implement
the programme.
The main increase appear to have taken place in the core sub-sector involved
with the production, collection and distribution of electrical energy, as indicated
in Figure 2.2 :
Figure 2.2
Formal Employment Levels in Electricity-related Sub-Sectors 1996-2005
90000
80000
70000
60000
50000
40000
30000
20000
10000
0
1996 1997 1998 1999 2000 2001 2002 2003 2004 2005
Motors/gens/transformers Distr/control apparatus
Wire/cable Elec/gas/steam/hot water
Elec prod/collect/distr Nat science/eng research
Figure 2.2 – Base Data 1996 1997 1998 1999 2000 2001 2002 2003 2004 2005
Electricity production, 63307 44087 81004 50701 51040 61432 48704 51705 68142 70206
collection and distribution
Distribution & Control 4672 4538 0 6390 2923 4548 2665 4077 2900 5245
Apparatus
Motors, Generators & 4832 5447 1935 1645 4136 563 2756 3148 4720 4438
Transformers
Insulated wire and Cable 4949 4144 4930 6152 5951 14712 13825 3529 18429 4313
Electricity, Gas, Steam and 44196 48053 6607 110 1765 0 0 433 0 0
Hot Water
Natural Science and 4421 3823 1673 14683 15881 12567 16361 28697 20767 30524
Engineering Research
Source : Quantec, 2007 (StatsSA OHS Data for 1996-1999; StatsSA LFS Data for 2000-2005)
Figure 2.2 indicates that :
• Electricity production, collection and distribution dominates the sector, and
has been gradually increasing in size over the past few years, formally
employing 70206 people by 2005, mainly in Eskom and the municipalities;
17• In addition, by 2005 a total of 44520 people were active in the formal sub-
sectors of electricity supply, manufacturing distribution and control
apparati, motors, generators and transformers, wire and cabling;
• From 2001 in particular, there was some growth in the manufacture of
insulated wire and cabling, associated with the growing emphasis on
extending electrical distribution and connections; and
• From 1999 onwards, the formal employment of people in natural sciences
and engineering research has been gradually increasing, some of which
could be attributed to intensified energy planning from that time.
The informal electricity sector went on a different growth path, escalating in the
late-1990’s, but then tailing off after 2000, as Figure 2.3 shows :
Figure 2.3
Informal and Self-Employment in the Electricity Industry : 1996-2005
10000
9000
8000
7000
6000
5000
4000
3000
2000
1000
0
1996 1997 1998 1999 2000 2001 2002 2003 2004 2005
Motors/gens/transformers Distr/control apparatus Wire/cable
Elec/gas/steam/hot water Elec prod/collect/distr Nat science/eng research
Figure 2.3 – Base Data 1996 1997 1998 1999 2000 2001 2002 2003 2004 2005
Electricity production, 1481 2945 7706 3621 1306 696 1290 220 509
collection and distribution
Distribution & Control 134
Apparatus
Motors, Generators & 1058 580
Transformers
Wire and Cable 239 1049 1240 275 368
Electricity, Gas, Steam and 828 1050
Hot Water
Natural Science and 381 950 618 1034 1404 606
Engineering Research
Source : Quantec, 2007 (StatsSA OHS Data for 1996-1999; StatsSA LFS Data for 2000-2005)
Figure 2.3 indicates that the informal and self-employment of people in the
production and distribution of electrical energy reached a peak in 1998-2000,
18together with some simultaneous growth in the supply of motors, transformers
and wire cabling. This growth spurt may also have been stimulated by Eskom’s
electrification programme. A feature of this process naturally involves a greater
demand for insulated wire and cabling and related services.
However, the apparent initial impact of the electrification programme on the
informal sector does not appear to have been sustained, as evidenced by the
fall-off in informal and self-employment across most of the electricity-related
sub-sectors from 2001 onwards. By 2005, only 1115 people were recorded in
the StatsSA Labour Force Survey as being active in the informal electricity
sector.
It is possible that some informal service providers were taken up into formal
employment as the electrification programme drew on available resources, but
this take-up cannot easily be quantified.
The available data on the informal sector in South Africa must be accepted as
being incomplete and less reliable than data obtained from formal sources. At
best, the data suggest that informal employment in the electricity supply sector
is weak and undeveloped in South Africa. The implications of this feature of the
sector for skills requirements will be considered again later.
The next step in this assessment involves an analysis of trends in occupational
data, in an effort to identify specific occupational shifts over time which are
associated with the delivery of electrical energy, and which can be applied to
make projections of likely future demand for specific occupational skills.
Figure 2.4
Trends in Formal Occupations in the Electrical Energy Sector : 1996-2005
60000
50000
40000
30000
20000
10000
0
1996 1997 1998 1999 2000 2001 2002 2003 2004 2005
Snr Managers Professionals Technicians
Clerks Service & Sales Craft & Trades
Plant Operators Elementary Other/unspecified
19Figure 2.4 – 1996 1997 1998 1999 2000 2001 2002 2003 2004 2005
Base Data
Snr Managers 9475 10042 14199 5963 7281 13860 9903 14486 16721 8941
Professionals 1726 8851 8881 7634 7949 3978 6162 10969 7945 16355
Technicians 16439 6274 7333 8794 9760 15591 12223 5822 25262 16906
Clerks 11093 6086 9811 14023 13462 11177 16139 17673 12067 20912
Service & Sales 3396 4831 2023 3201 1529 1940 2195 318 2989 1413
Craft & Trades 49264 44822 29258 19022 21064 24680 19871 23235 26841 34013
Plant Operators 16919 7766 8479 9364 8135 11793 10022 8036 13997 8380
Elementary 12677 20179 12711 9250 12001 10629 6587 10535 7904 7807
Other/unspecified 4983 1241 3454 2433 519 176 1209 516 1087 0
Source : Quantec, 2007 (StatsSA OHS Data for 1996-1999; StatsSA LFS Data for 2000-2005)
Figure 2.4 above indicates that :
• The largest occupational category formally employed in the production and
distribution of electricity has been that of craft and related trades workers
(as defined in the SIC database), which has been increasing year-on-year
for the past five years to reach 34013 by 2005;
• The second-largest occupational category has been that of clerks, which
has grown strongly in recent years to reach an all-time high of 20912 by
2005;
• The third-largest category are technicians and associate professionals,
which have shown a modest increase in recent years (16906 in 2005);
• By contrast, most other occupational categories have remained largely
unchanged in size over the past ten years, or shown small and sometimes
erratic increases, notably among senior officials and managers, plant
operators and service workers.
These trends in occupational employment can also largely be accounted for in
terms of Eskom’s electrification programme, which typically requires tradesmen
and technicians to make the connections, and clerical employees to administer
the new accounts.
As far as informal sector occupations is concerned, the year-to-year data is
incomplete, but the following Figure highlights the main categories :
Figure 2.5
Informal Occupational Trends in the Electricity Sector : 1997-2005
204500
4000
3500
3000
2500
2000
1500
1000
500
0
1997 1998 1999 2000 2001 2002 2003 2004 2005
Technicians Crafts and Trades Operators
Elementary Clerks
Figure 2.5 – Base Data 1996 1997 1998 1999 2000 2001 2002 2003 2004 2005
Technicians 580 368
Crafts & Trades 124 902 2546 696 814 220 509
Operators 629 476
Elementary 948 467 372
Clerks 717
Source : Quantec, 2007 (StatsSA OHS Data for 1996-1999; StatsSA LFS Data for 2000-2005)
Figure 2.5 indicates that some informal sector occupations were stimulated in
the period 1999 to 2001. People in crafts and trades and elementary
occupations possibly became more involved in electricity production and
distribution and related services associated with further electrification.
Thereafter, informal sector craftsmen and tradesmen enjoyed a diminished but
ongoing role in electrical production and distribution over the next few years.
Once again, it is clear that despite gaps in the data, informal occupations in the
South African electricity sector seem to be poorly developed and that the initial
impact of electrification on informal employment has to date not been sustained.
In summary, the main implications of these changing occupational profiles in the
electricity energy sector are that :
• The formal demand for craft and tradesmen, technicians and clerical
employees in particular will continue to increase, mainly to support new
connections; and
• Unless special efforts are made to stimulate informal sector occupations
and SMMEs, the impact of future growth in the industry on the informal
sector can be expected to remain erratic and underdeveloped.
These findings are based on occupational trends during a period in the
electricity sector when many new connections were being made to advance
electrification in South Africa, but when there was little expansion in generation
capacity.
21Whereas these occupational trends can be expected to continue, additional
demands will be placed on the sector in respect of Eskom’s capital expansion
programme.
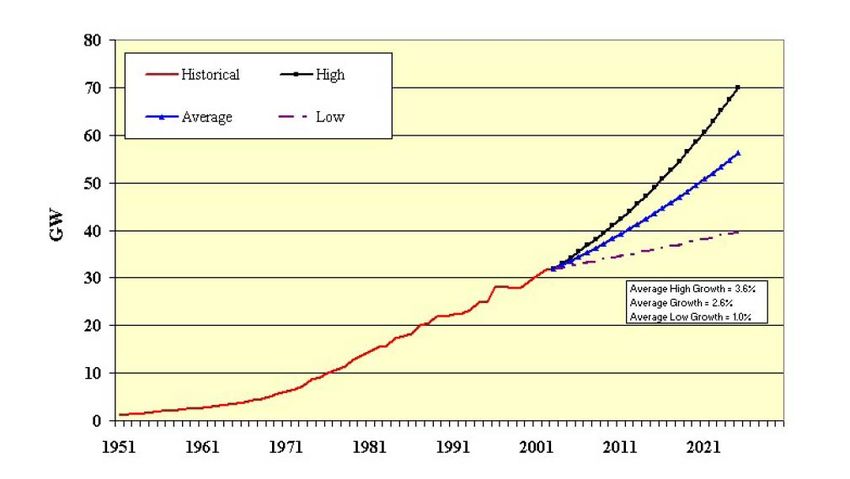
EXPANSION PLANS
Figure 2.6 below shows the maximum energy demand to 2030, based on
different growth rate assumptions :
Figure 2.6
Projected Maximum Energy Demand : 1950 to 2030
(Source : NERSA)
Which of the growth curves in Figure 2.6 are being considered in planning?
Statistics SA has established that in 2007 South Africa’s power generation
increased by 3% in April 2007 to 20 587 GWh, when compared with 2006,
suggesting that the “average growth” curve of 2,6 percent should be considered
(Eng News, 31 May 2007).
However, in its 2006 Annual Report, Eskom indicated that it has revised its
original expansion programme (originally based on 3 percent growth in
demand), in the light of the government’s drive to boost economic growth to 6
percent by 2010. Eskom has estimated that this will result in an average growth
in electricity demand of 4 percent per annum, requiring approximately 47
252MW of new capacity by 2025 – more than double the total existing capacity.
22From this point of view, the “average high growth” curve of 3,6 percent in Figure
2.6 is now being applied by Eskom.
Accordingly, in the Eskom Director’s Report for 2006, the organization
committed itself to achieving an installed generation capacity of 85000 MW by
2024.
Eskom’s current installed generation capacity stands at 38 000 MW, with a peak
demand to date of 36 513MW. The national reserve margin has declined from
25 percent in 2001 to 6 percent in 2006 (Eberhard, 2007b). This reserve margin
is regarded as being too close to current capacity, and the utility plans to extend
its reserve margin to 15 percent.
Generation plans
Eskom’s planning includes the return-to-service of three “mothballed” coal
stations, the commissioning of two open cycle gas turbine stations (OCGT),
namely Ankerlig and Gourikwa (opened in October 2007 by the Minister for
Trade and Industry), the construction of a new coal-fired station at Medupi
(scheduled for completion by 2015) and the greater use of renewables such as
wind, hydro, pumped storage, solar and bagasse.
A target has been set by government for 10 000 GWh of renewable energy
contribution to final energy consumption by 2013, to be produced mainly from
biomass, wind, solar and small-scale hydro. At the time the DME drafted its
White Paper, renewable energy sources were expected to make up 4 percent
(1667 MW) of the (then) projected electricity demand for 2013 (41539 MW).
This was equivalent to replacing two units of Eskom’s combined coal-fired
power stations (DME White paper, 2003).
The DME estimates that 20 000 new jobs could be created in the field of
renewables alone (DME White Paper, 2003). The skills required for people in
these jobs can be expected to be mainly at intermediate and high-level for the
design and build stage and moving more to artisan and semiskilled levels once
in operation.
Transmission
The transmission grid is being expanded and these investments costs are also
substantial (up to R50 billion). The need for skills will also increase, specifically
in temporary construction work. Geographical locations far from the coalfields
will either pay more for their electricity or have to be subsidized by other
customers, or invest in local sources of generation.
The Inga 111 project in the Democratic Republic of Congo (DRC) is expected to
be commissioned in 2010 (ESETA 2005). This is a hydropower project funded
by South Africa's electricity utility ESKOM, Botswana Power Corporation,
Empresa national de Electricidade of Angola, NamPower of Namibia and SNEL
of the DRC. This will see the construction of a transmission network of 500kv to
supply power to all five countries that are funding the Inga 111 project. This has
23been identified as a NEPAD project and feasibility study and construction is
likely to be implemented for this project form 2004 to 2010. Some local skills
may be drawn (temporarily) to foreign countries in the course of carrying out this
work.
Distribution
For AsgiSA, the restructuring of electricity distribution is a priority for 2007 and
beyond. The economic costs of worsening power interruptions and inefficiencies
is estimated to cost between R2,9 and R8,6 billion (AsgiSA Annual Report for
2006).
EDI Holdings CEO Phindile Nzimande recently reported that some R5-billion in
maintenance backlog has amassed over the last ten years (Engineering News
11 May 2007). Additional challenges include inequitable treatment of
consumers across the country and a noteworthy disparity in average tariffs by
distributors.
There has been a delay of at least ten years in the implementation of the
proposed Regional Electricity Distributors (REDs), a combination of Eskom and
Municipal distributors. Municipalities can use income from electricity to
subsidize other municipal functions. This firstly increases the price for
customers and secondly encourages management to reduce investment and
maintenance costs. Unfortunately, this has resulted in power blackouts in the
major cities, Johannesburg being a prime example. The networks are generally
in a poor state and will need substantial investment to upgrade and expand,
together with the related skills requirements, especially as networks reach their
full capacity and become older (see City of Johannesburg case study later).
FORECASTING GROWTH IN JOBS TO 2012
This report is aimed at assessing the jobs and skills requirements of the
electrical energy sector over the next five years, i.e. to 2012. This time frame
has been selected because the growth parameters can be more reliably
estimated than a longer-term projection, and accordingly the requirements over
the next five years can be more realistically determined.
To determine the projected increase in jobs to 2012 more precisely, the MW
contribution of specific generation projects likely to come on-line by that time
need to be combined, namely :
• The re-commissioning of three previously “mothballed” coal-fired
power stations at Camden, Grootvlei and Komati (3800MW);
• The construction of two open-cycle gas turbines (OCGT) at Ankerlig
and Gourikwa (1050MW);
• Commissioning an additional pumped storage facility at Ingula, to be
operational by 2012 (1322 MW);
• The upgrading of the Arnot and Gariep power stations (380MW);
• Achieving the current DME target for renewable energy sources (1667
MW by 2013);
• Provision for independent power producers (IPP) to contribute some
additional power (1000MW); and
24• Some progress in power delivery from the new Medupi coal-fired
power station (est. 1000MW by 2012).
As far as the latter is concerned, the Medupi station is expected to eventually
generate between 4200 and 4500MW by January 2015.
All the above generation projects can be expected to contribute an estimated
additional 10909 MW to the national grid by 2012/3. This figure must be
regarded as an estimate, given that some projects may be delayed, and new
projects may be commissioned over the next few years.
At the same time, Eskom is also involved in a demand-side management
programme to encourage users to reduce their electricity consumption by a
targeted 3500MW over the next five years (Engineering News, 25 June 2007).
However, it is unlikely that progress in reducing demand will slow down or cut
back the scope of Eskom’s planned expansion programme over that period.
Three alternative scenarios will be presented here for forecasting the projected
growth of jobs in the electrical energy sector over the next five years.
The first scenario comprises a simple arithmetic projection, calculated by
applying the current ratio of MW per employee to the projected MW growth
target for 2012.
In 2005, the electrical energy sector formally employed 114727 employees (as
indicated earlier in Figure 2.1), a figure which includes both the Eskom utility, as
well as the many other smaller organizations providing electricity-related
materials and services.
The electricity energy sector can be broken down into two sub-sectors, namely
the core sub-sector of electricity production, collection and distribution, and a
supporting sub-sector employed in the manufacture of transformers, cables and
distribution apparati, and other related services.
In 2005, the core directly employed 70 206 employees in electricity production,
collection and distribution (as indicated earlier in Figure 2.1). Given an installed
capacity at that time of 38 000 MW, a current ratio of 1,85 jobs per MW can be
derived for the core.
If that ratio is applied to the projected additional capacity to 2012 of 10909 MW,
then an additional 20182 jobs could be created within the core formal electricity
production, collection and distribution sector by then. Given that Eskom
employees currently make up 42,3 percent of the total formal jobs in the sector,
at least 8537 jobs could be created within the Eskom utility by 2012.
As far as the supporting sub-sector is concerned, an additional 44 520 people
were employed in 2005. Expressed as a ratio against the current installed
capacity of 38000MW, 1,17 people per MW were active in these “spin-off”
industries in 2005. Accordingly, the 10909 MW increase in generation could
25also stimulate the creation of an additional 12 775 formal jobs in the supporting
sub-sector.
As noted earlier, some informal employment could also be identified in the
sector (Figure 2.3). A low ratio of 0,03 informal jobs per MW can be derived
which suggests that at best 327 informal new jobs would be created by 2012
under present conditions (an active programme to stimulate informal
employment may result in bigger gains).
In terms of Scenario One then, the estimated 10909MW of planned expansion
in electricity generation to 2012 could stimulate the creation in toto of an
additional 33284 jobs in the formal and informal sectors of the electricity sector
as a whole.
The second scenario can be termed an efficiency projection, and is based on
the assumption that over time, efficiency improvements in the utilization of
human resources can and should be achieved in the sector.
Employment levels in coal-based electrical generation have been declining by
an average of 5,4 percent per annum, mainly due to increased efficiency in
production. Employment levels have halved over the past two decades while
electricity production has doubled :
Figure 2.8
Employment in Coal-Based Electricity Generation in South Africa
(Source : AGAMA, 2003 : p.iii)
To reflect the likely efficiency measures that may be applied over time with
respect to increased employment levels, the arithmetic projection developed
above for Scenario One has been reduced by 5,4 percent per annum. This was
done by identifying the annual step-up needed to eventually reach the
arithmetic projection of 33284 jobs by 2012, then subjecting each annual year-
on-year total to a 5 percent efficiency reduction.
26By applying this efficiency correction measure, the net number of new formal
and informal jobs which may be created under Scenario Two in the electrical
energy sector by 2012 is estimated at 29 879. Of these, at least 7709 jobs
would be created in Eskom itself (given that formal jobs represent 61 percent of
the total sector and Eskom jobs make up 42,3 percent of formal jobs).
The third scenario is based on the Eskom utility’s own forecasted growth in jobs
to support its capital expansion programme. Eskom’s Human Resources
division supplied the authors with an estimate of future resource requirements.
By 2012, the utility estimates that 9594 new jobs would be created within
Eskom, to be achieved through the addition of at least 1000 jobs per annum
over the five years to 2012.
This figure is somewhat in excess of what would be expected in terms of an
efficiency projection, as developed for Scenario Two (namely 7709 Eskom
jobs). Eskom’s higher jobs target to 2012 suggests that the utility plans to
achieve an earlier build–up of staffing levels so that the necessary skills and
competencies can be developed over time and be in a position to adequately
support the longer-term expansion programme in subsequent years.
From this point of view, Scenario Three can be termed a proactive growth
scenario, in that it reflects the utility’s plan to rapidly grow it’s human resources
capacity over the next few years, with a view to supporting its longer-term
objectives.
Given that the proactive growth scenario represents an internal staffing strategy
for the utility, it is unlikely to have any additional knock-on effect on job creation
on the electrical energy sector as a whole, other than that implied by the growth
in demand for equipment and services to support the expansion programme.
In terms of Scenario Three then, the total number of jobs created in the sector
can be calculated by combining Eskom’s own projected 9594 new jobs,
together with the balance of an estimated 22170 jobs for the rest of the sector
(based on the efficiency projection), i.e. an estimated 31 764 jobs in all.
In identifying the type of skills required to support this jobs expansion, a
distinction must be drawn between capital expansion requirements, on the one
hand, and operations and maintenance on the other, each of which calls for
different types of skills.
Firstly, the skills required for expanding the capital infrastructure can partly be
met with existing engineering resources deployed to facilitate the expansion on
a project management basis (particularly within Eskom). A substantial amount
of work will also be sub-contracted or outsourced, mainly through the use of
construction companies for the new build, and also to support Black Economic
Empowerment objectives.
The construction of power generation plant is a short-term process because
once built, only the operations and maintenance staff are required. If large
power stations are built in sequence, the project management and construction
27You can also read