Tourism infrastructure - Tourism Insight Series - MBIE
←
→
Page content transcription
If your browser does not render page correctly, please read the page content below
August 2016
                            infrastructure
                            Tourism

                                                          Tourism Insight Series
                         1

1. Tourism infrastructure: Tourism Insight Series   | AUGUST 2016
                                                                                   MB13611 AUG 2016
ISSN 2463-6290 (online)
ISBN 2463-6738 (print)

August, 2016

© Crown Copyright 2016

The material contained in this report is subject to Crown copyright protection
unless otherwise indicated. The Crown copyright protected material may be
reproduced free of charge in any format or media without requiring specific
permission. This is subject to the material being reproduced accurately and
not being used in a derogatory manner or in a misleading context. Where
the material is being published or issued to others, the source and copyright
status should be acknowledged. The permission to reproduce Crown copyright
protected material does not extend to any material in this report that is
identified as being the copyright of a third party. Authorisation to reproduce
such material should be obtained from the copyright holders.
MINISTRY OF BUSINESS, INNOVATION AND EMPLOYMENT   TOURISM INFRASTRUCTURE   AUGUST 2016
                                                  TOURISM INSIGHT SERIES

Contents
List of tables and figures                                                                     1
Executive summary                                                                              3
1.     Introduction                                                                            4
1.1    Context                                                                                 4
1.2    Purpose                                                                                 4
1.3    Out of scope                                                                            5
1.4    Structure                                                                               5

2      Tourism and tourism infrastructure in New Zealand                                      6
2.1    New Zealand tourism – state of play and forecasts                                       6
2.2    Role of infrastructure in tourism destination competitiveness and visitor attraction    9
2.3    Tourism and population                                                                 11
2.4    State of the Industry Survey 2015                                                      12

3      International air travel infrastructure                                                14
3.1    International air travel infrastructure demand                                         14
3.2    International air travel infrastructure supply                                         17

4      Cruise infrastructure                                                                  29
4.1    Cruise infrastructure demand                                                           29
4.2    Cruise infrastructure supply                                                           31

5      Tourism accommodation infrastructure                                                   36
5.1    Accommodation infrastructure demand                                                    36
5.2    Accommodation infrastructure supply                                                    39
5.3    Occupancy rates                                                                        45
5.4    Visitor experience                                                                     49

6      Road infrastructure                                                                    51
6.1    Road infrastructure demand                                                             51
6.2    Road infrastructure supply                                                             56
6.3    Road safety                                                                            59
6.4    Visitor experience                                                                     61

7      Rail infrastructure                                                                    62
7.1    Rail infrastructure demand                                                             62
7.2    Rail infrastructure supply                                                             63

8      Cellular network infrastructure                                                        65
8.1    Cellular network infrastructure demand                                                 65
8.2    Cellular network infrastructure supply                                                 65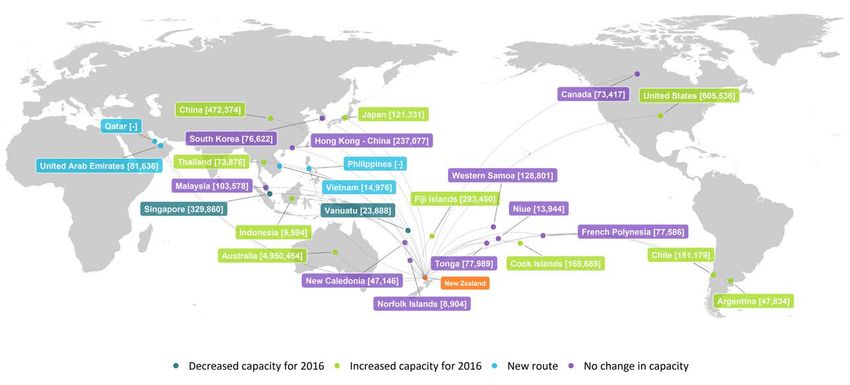
MINISTRY OF BUSINESS, INNOVATION AND EMPLOYMENT   TOURISM INFRASTRUCTURE   AUGUST 2016
                                                  TOURISM INSIGHT SERIES

9      Events and activities infrastructure                                              67
9.1    Introduction                                                                      67
9.2    National parks                                                                    67
9.3    Business events                                                                   70

Appendix 1:                                                                              73
New/Planned flight capacity to New Zealand                                               73

Appendix 2:                                                                              74
New Zealand large hotel developments (>$10 million)
at construction and planning stages                                                      74

Appendix 3:                                                                              75
Direct air routes by airport                                                             75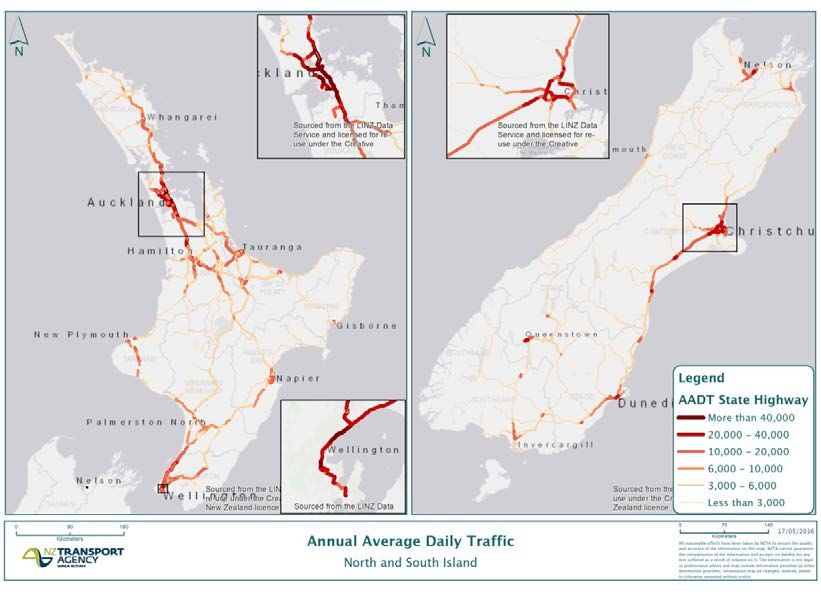
MINISTRY OF BUSINESS, INNOVATION AND EMPLOYMENT     TOURISM INFRASTRUCTURE   AUGUST 2016
                                                    TOURISM INSIGHT SERIES

                                                                                                  1
List of tables
Table 1: New Zealand air service agreements                                                  21

Table 2: Forecast growth in cruise passengers by nationality                                 31

Table 3: Key New Zealand cruise ports and berths                                             32

Table 4: Stay units vs the number of hotel rooms in construction and planning stages,
by key hotel region                                                                          43

Table 5: Holidayhouses.co.nz properties, March 2016                                          45

Table 6: Top 22 local bodies by fatal and injury crashes involving overseas drivers
(2010–2014)                                                                                  60

List of figures
Figure 1: International visitor arrivals, annual average, 2016–2022 forecasts                 7

Figure 2: Locations visited by international tourists in 2015                                8

Figure 3: Ratio of annual visitor nights to population and visitor count to population,
year ended December 2015                                                                     12

Figure 4: International visitor arrivals, monthly                                            15

Figure 5: Seasonality of international visitor arrivals                                      16

Figure 6: International visitor arrivals, annual average, by port                            17

Figure 7: Seat capacity by origin                                                            18

Figure 8: Flight capacity of international and national flights per operator                 19

Figure 9: Percentage of flight capacity of international and domestic flights, by operator   20

Figure 10: Inbound capacity to New Zealand, 2016                                             23

Figure 11: Inbound capacity – New Zealand vs Australia                                       24

Figure 12: Annual inbound capacity to New Zealand’s main international airports              25

Figure 13: Annual inbound capacity to New Zealand by origin country                          26

Figure 14: Number of historical and projected passengers and cruises to New Zealand          30

Figure 15: Cruise ship passenger capacity                                                    34

Figure 16: Guest nights in commercial accommodation by region                                37

Figure 17: Change in guest nights of commercial accommodation by region and type,
year ended January 2016                                                                      38

Figure 18: Number of visitors, by main type of accommodation used, 2015                      39

Figure 19: Number of commercial accommodation establishments by region and type              40

Figure 20: Capacity (‘stay nights’) of commercial accommodation by region and type           41

Figure 21: Change in capacity of commercial accommodation by region and type,
year ended January 2016                                                                      42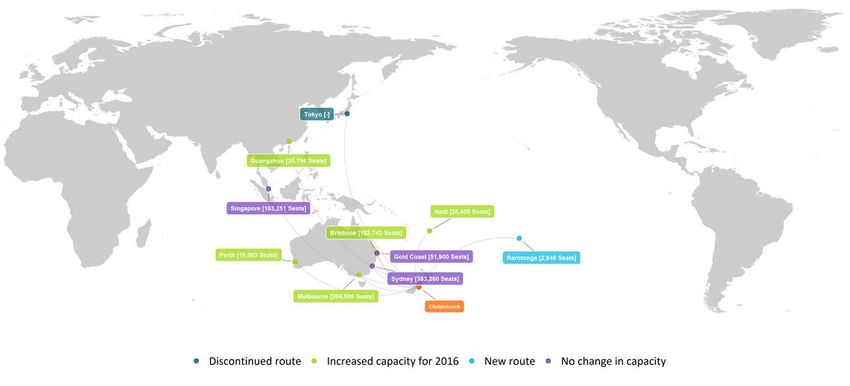
MINISTRY OF BUSINESS, INNOVATION AND EMPLOYMENT TOURISM INFRASTRUCTURE AUGUST 2016
TOURISM INSIGHT SERIES
2 Figure 22: Occupancy rates of commercial accommodation by region and type,
year ended January 2016 46
Figure 23: Capacity and occupancy of hotels, four main centres 47
Figure 24: Occupancy rate of hotels, four main centres 48
Figure 25: Occupancy rate of 3–5-star hotels, three key regions and nationally 49
Figure 26: International visitor experience: accommodation 50
Figure 27: Annual average traffic volume, 2015 52
Figure 28: Average number of vehicles per day travelling across NZTA measuring sites by
region (North Island) 53
Figure 29: Average number of vehicles per day travelling across NZTA measuring sites
by region (South Island) 54
Figure 30: Correlation between change in traffic and the number of visitors,
selected territorial authorities 55
Figure 31: Vehicle use by international visitors, 2015 56
Figure 32: Planned road infrastructure spending, National Land Transport Programme,
2016–2018 58
Figure 33: Planned road infrastructure spending per capita, National Land Transport
Programme, 2016–2018 59
Figure 34: International visitor experience: commercial transportation 61
Figure 35: Scenic Journeys capacity and demand 63
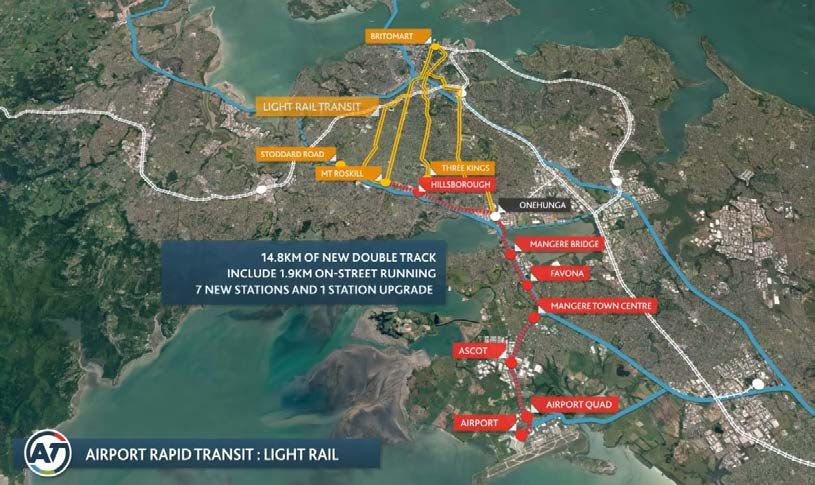
Figure 36: Suggested Auckland light rail expansion 64
Figure 37: Map of estimated cellular coverage in New Zealand 66
Figure 38: Map of New Zealand national parks 68
Figure 39: International visitor attendance for national parks 69
Figure 40: International visitor arrivals for conference and convention events 70
Figure 41: International visitor experience: activities 72
Figure 42: Auckland Airport international routes 75
Figure 43: Wellington Airport international routes 76
Figure 44: Christchurch Airport international routes 77
Figure 45: Queenstown Airport international routes 78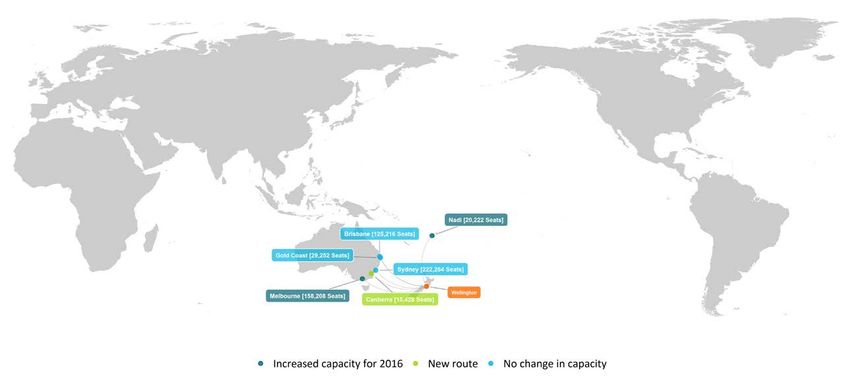
MINISTRY OF BUSINESS, INNOVATION AND EMPLOYMENT   TOURISM INFRASTRUCTURE   AUGUST 2016
                                                  TOURISM INSIGHT SERIES

                                                                                                    3

Executive summary
Over 2015, the New Zealand tourism sector has experienced exceptional growth, with record
levels of international visitors. Forecasts released by MBIE predict that visitor arrivals will
grow 5.4 per cent a year going forward, reaching 4.5 million visitors in 2022, from 3.1 million
in 2015 – assuming that there is appropriate infrastructure to support this growth.
New Zealand’s tourism infrastructure is the platform on which the growth in tourism –
and the resultant benefits to the New Zealand economy – is built. The quantity and quality
of infrastructure available dictates the overall capacity of visitors, and contributes towards
the experience of visitors who come here. Accommodation; road and rail; airport and cruise
port; communication; and activities infrastructure all have a part to play in ensuring
New Zealand’s attractiveness as a visitor destination. Tourism Industry Aotearoa’s Tourism
2025 acknowledges that, while New Zealand’s natural environment provides the setting
for a range of visitor experiences, quality infrastructure is needed to support the range
of activities that visitors enjoy.
For international air transport, inbound seat capacity can be relatively quickly changed through
adding and removing flights, assuming appropriate air service agreements are in place.
However, ensuring that the appropriate airport infrastructure is in place requires long-term
planning. New Zealand’s international airports appear to be proactively working towards the
expansion in airport infrastructure, though there could be short-term challenges before these
large-scale developments come online.
One of the main challenges facing the cruise industry is ensuring that appropriate cruise
infrastructure is provided for larger and longer cruise ships. Lack of appropriate facilities
to dock and transfer passengers may discourage cruise companies coming here, and may
negatively affect visitor experience.
Though demand for hotel accommodation has grown significantly over the past five years,
there has not been a concomitant increase in hotel capacity. This has increased occupancy
rates and room rates in peak seasons. This is most evident in Queenstown and Auckland.
Hotel construction appears to be responding to demand in Auckland and Christchurch, but
other regions are showing less investment. The vast majority of planned hotel development
expenditure is for large, high-rise buildings in Auckland.
New Zealand does not score highly for its road infrastructure when compared to other developed
nations. This may partly be due to geography and population size, which cannot support high
levels of road investment. One measure of the quality of road infrastructure is its safety, and
areas with a greater proportion of crashes involving overseas licence holders (such as Southland,
Otago and the West Coast) have been targeted for improvement by government.
While most towns and cities around the country have adequate cellular coverage, some key
tourist roads in the South Island have little or spotty coverage, largely due to mountainous
or otherwise inhospitable terrain.
Some national parks are experiencing a strain on infrastructure during peak season.
However, there is capacity in less popular sites and outside of the peak season.
Business events are becoming a larger part of New Zealand’s international offering. The tourism
industry and government have made a concerted effort in recent years to capture a larger
part of this international conference market, led by significant investments in international-
standard conference facilities in New Zealand.
MINISTRY OF BUSINESS, INNOVATION AND EMPLOYMENT TOURISM INFRASTRUCTURE AUGUST 2016
TOURISM INSIGHT SERIES
4
1. Introduction
1.1 Context
Late last year, Tourism Ministers endorsed a government tourism strategy aimed at increasing
the economic contribution made by tourism at a national and a regional level, by focusing and
coordinating government efforts to support the sector.
The strategy is designed to help:
›› attract high-value visitors throughout the year and reinforce the strong linkages
we need to get them here
›› ensure the sector has all the inputs it needs to deliver the components of a great
visitor experience
›› ensure these inputs are used productively and well
›› ensure a range of regions benefit and economic development and employment
opportunities are shared across multiple communities
›› ensure the sector retains its social license to operate and continues to be valued
by New Zealanders for the social and economic opportunities it brings.
The strategy identified three focus areas where the government needs to work together
with the sector to achieve these objectives and support the aspirations of the sector:
›› attracting the right mix of visitors to give us the biggest return on our marketing investment
›› ensuring the sector continues to provide high-quality experiences in the face of increasing
visitor numbers and a changing visitor mix
›› supporting regions to be in a position to benefit from increasing visitor numbers.
The strategy identified a number of priority actions in each of these areas across a number
of government agencies.
The provision of data and insight will be an essential component supporting work on the
priority actions.. In particular, this paper provides detailed information to help inform policy
direction and future investment in tourism infrastructure. It is the first in a series of insight
papers that MBIE will publish over the next 18 months.
Visitor growth has been strong over the 12 months to December, up 10 per cent overall,
with Chinese arrivals up 34 per cent. Anecdotal evidence points towards an undersupply of
accommodation in certain regions and a concern that this situation may worsen as arrivals
continue to increase. These two factors have created the demand for government and the
sector to have a coherent picture of the demand for and supply of tourism infrastructure.
This paper complements other work that has been completed or is underway to help build
a better picture of the future supply of, and demand for, infrastructure.MINISTRY OF BUSINESS, INNOVATION AND EMPLOYMENT TOURISM INFRASTRUCTURE AUGUST 2016
TOURISM INSIGHT SERIES
A complementary piece of work 1 , has been completed by New Zealand Trade and Enterprise, 5
Tourism New Zealand and MBIE. It focuses on identifying future gaps in the supply of high-
end hotels in New Zealand’s key tourism regions of Auckland, Rotorua, Wellington, Christchurch
and Queenstown.
Tourism Industry Aotearoa has recently started a research project exploring New Zealand’s
tourism infrastructure.
1.2 Purpose
This paper provides information on the supply and demand of tourism infrastructure
in New Zealand, providing a base level of information to help inform policy direction and
future investment.
1.3 Out of scope
The following areas are excluded from analysis in this paper:
›› estimating future supply and demand beyond MBIE’s official forecasts
›› infrastructure in and demand for usage of national parks, and measuring
concession numbers
›› supply of specific attractions/activities (eg, bungy jumps, mountain bike hire)
›› cycle trails (currently the subject of a separate MBIE evaluation)
›› public/tourism facilities and infrastructure (eg, restrooms, sewerage, items funded
through local government).
1.4 Structure
Section 2 of this report provides an overview of tourism and tourism infrastructure
in New Zealand. This report divides tourism infrastructure into seven main areas:
›› International air travel infrastructure (section 3)
›› Cruise infrastructure (section 4)
›› Tourism accommodation infrastructure (section 5)
›› Road infrastructure (section 6)
›› Rail infrastructure (section 7)
›› Cellular network infrastructure (section 8)
›› Events and activities infrastructure (section 9).
Appendices provide additional information on new international flights planned and large
hotel developments.
1 New Zealand Trade and Enterprise (2016). Regional Hotel Market Analysis and Forecasting – May 2016. Retrieved from
https://www.nzte.govt.nz/media/6495222/regional-hotel-market-analysis-and-forecasting-may-2016.pdfMINISTRY OF BUSINESS, INNOVATION AND EMPLOYMENT TOURISM INFRASTRUCTURE AUGUST 2016
TOURISM INSIGHT SERIES
6
2 Tourism and tourism
infrastructure in New Zealand
ƨƨ Key messages
›› Tourism expenditure and arrivals have both shown massive growth in the March 2016 year.
›› Forecasts for the sector show impressive growth in tourism spend, dominated by an increase
in Chinese tourists. Overall, the number of visitors is expected to increase to over 4,000,000
by 2022, assuming there is appropriate infrastructure to support this growth.
›› The quality of tourism infrastructure is important, especially in relation to visitor experience.
›› While New Zealand performs relatively well in air transport infrastructure, road and rail
infrastructure is viewed as relatively poorer on average than in other developed countries.
2.1 New Zealand tourism – state of play and forecasts
Tourism plays a significant role in the New Zealand economy in terms of generating export
revenue and creating employment opportunities. Tourism expenditure includes spending
by all travellers, whether they are international, resident householders, or business and
government travellers. International tourism expenditure includes spending by foreign
students studying in New Zealand for less than 12 months.
Total tourism expenditure was $29.8 billion for the year ended March 2015, an increase of
10.3 per cent from the previous year. International tourism expenditure increased 17.1 per cent
($1.7 billion) to $11.8 billion, and contributed 17.4 per cent to New Zealand’s total exports of
goods and services in the March 2015 year. Over the same period, domestic tourism
expenditure increased 6.3 per cent ($1.1 billion) to $18.1 billion.
Total annual overseas visitor arrivals passed 3 million for the first time in 2015 and have
continued to increase, with arrivals reaching 3.3 million in the year ended March 2016.
Higher arrivals from Australia, China and the United States drove total international arrival
growth over the last year. Australian arrivals grew at 7 per cent and made up 42 per cent of all
arrivals in the year ended March 2016, while Chinese arrivals grew at 28 per cent and made up
12 per cent of all arrivals.
The growth is expected to continue, with arrivals forecast to reach 4.5 million by 2022 (from
3.1 million in 2015). The main contributors to this growth are expected to be China, Australia
and the United States.MINISTRY OF BUSINESS, INNOVATION AND EMPLOYMENT TOURISM INFRASTRUCTURE AUGUST 2016
TOURISM INSIGHT SERIES
Figure 1: International visitor arrivals, annual average, 2016–2022 forecasts 7
Australia
1,500
Visitor arrivals (000s)
1,000
China
500
US
UK
Germany
Japan
India
Korea
0 Canada
Indonesia
2000 2005 2010 2015 2020 2022
Source: MBIE, Tourism Forecasts
While Australia, China and United States are projected to remain the three largest source
markets, all markets are growing, including the United Kingdom, Japan, and newer developing
markets in Asia and South America.
These forecasts are purely demand-based. They assume there are no constraints in the
supply of tourism infrastructure, such as air capacity, accommodation, or other factors.
Therefore, inadequate investment in infrastructure will make a significant impact on realised
demand growth.
For 2015, the largest tourist destination for international visitors was Auckland (Figure 2).
Approximately 1.5 million tourists visited Auckland during their stay in New Zealand.
This is followed by Queenstown (820,000), Christchurch (770,000), Rotorua (690,000) and
Wellington (610,000). Other significant international tourism centres include Dunedin, Taupo,
Franz Josef Glacier, Wanaka and Te Anau. These numbers are based on overnight visits only.MINISTRY OF BUSINESS, INNOVATION AND EMPLOYMENT TOURISM INFRASTRUCTURE AUGUST 2016
TOURISM INSIGHT SERIES
8 Figure 2: Locations visited by international tourists in 2015
Auckland
Rotorua
Taupo
No of People
(million)
0.1
Wellington 0.5
1.0
Franz Josef
Christchurch
Wanaka
Queenstown
Te Anau
Dunedin
Source: MBIE, International Visitor Survey
A total of 551,000 delegates attended 5,500 conferences/conventions in the year ended
December 2015. This indicates more delegates attended a greater number of events compared
to the year ended December 2014, where 500,000 delegates attended 5,200 conferences.
The number of delegate days for conferences and conventions was unchanged between the
two years, at around 1.1 million days.
Visitors cite many reasons to come to New Zealand.
›› The country is highly geographically diverse and contains a range of different scenery,
including subtropical forests, beaches, glaciers, mountains and plains in a relatively
small area.
›› New Zealand also has a reputation for outdoor adventures, including surfing, skiing,
kayaking, tramping and sailing, among others.
›› The country has several endemic animal and plant species, such as the iconic kiwi, tuatara
and ferns.
›› Travelling is seen to be relatively easy, with self-driving popular. The distances between
towns and attractions are relatively short.
›› New Zealand is famous for its high quality wines, with Marlborough and the Hawke’s Bay
being the key grape-growing regions.MINISTRY OF BUSINESS, INNOVATION AND EMPLOYMENT TOURISM INFRASTRUCTURE AUGUST 2016
TOURISM INSIGHT SERIES
›› Māori culture is often a drawcard for tourists, with Māori-centred attractions throughout 9
the country, especially in Auckland, Rotorua and many other tourist centres.
›› The population is relatively sparse. New Zealand has a land area the size of Great Britain
but only 4.5 million inhabitants, so New Zealand feels less crowded than other countries.
›› New Zealand has a temperate climate, without extremes of hot or cold.
›› Visitors also view the country as being relatively safe, even for solo travellers.
2.2 Role of infrastructure in tourism destination competitiveness
and visitor attraction
There are a variety of factors that determine why a particular location is attractive to tourists.
One recent study2 listed these as:
›› heritage and culture
›› social competitiveness (labour market factors, and staff training, TV stations, newspapers)
›› education (qualifications achieved)
›› communication facilities (ICT readiness)
›› tourism price competitiveness
›› environmental and sustainability record
›› infrastructure
›› openness (visas, trade).
2.2.1 Significance of infrastructure
The quality of a destination’s infrastructure is a key part of its tourism offering – particularly
in relation to the visitor experience at the destination. The availability and quality of hotel
rooms and other accommodation is likely to be fundamental to a visitor’s choice of the timing
and the length of a visit to the destination. Road infrastructure enhances accessibility to
different parts of the destination country, while sound airport infrastructure ensures that
tourists experience a comfortable transition from the plane to destination. Good communication
infrastructure allows quick and cheap communication between the origin and destination
country and during the traveller’s visit to the destination. Providing high-standard, online
access to essential information about the destination, and for booking accommodation and
tourism services (eg, theatre tickets), before embarking on travel reduces the traveller’s
feelings of uncertainty, fear and asymmetric information. Knowing that other infrastructure,
such as wastewater and energy, is reliable also mitigates traveller concerns and enhances the
attractiveness of the visit.
That said, while good infrastructure is an important factor in destination attractiveness,
it is likely to be less of a drawcard than other factors, like the uniqueness of local heritage
and culture.
In early models of destination attractiveness, infrastructure was described as an important
supporting factor for the real drivers of destination competitiveness – namely, core resources
and attractors, destination management, destination policy planning and development, and
2 Mazanec, J. A., Wöber, K., & Zins, A. H. (2007). Tourism destination competitiveness: From definition to explanation?
Journal of Travel Research, 46(1), 86–95.MINISTRY OF BUSINESS, INNOVATION AND EMPLOYMENT TOURISM INFRASTRUCTURE AUGUST 2016
TOURISM INSIGHT SERIES
10 amplifying determinants (eg, locations, security, market awareness).3 In other models,
infrastructure has been characterised also as a critical part of the services that add up
to the tourist destination experience.4
Researchers and planners5 studying tourism on the island of Mauritius in the Indian Ocean
have undertaken a comprehensive and systematic measurement of the influence of
infrastructure on tourism development. Their conclusions include:
The growth in tourism infrastructure (rooms and capital works) on Mauritius has contributed
positively to the number of visitor arrivals (along with, but distinguishable from, relative
prices, distance, and average incomes in the origin country).6
The transport capital stock of Mauritius contributed positively to the number of tourist
arrivals between 1971 and 2000. It was perhaps not as important as a contributor to tourism
development as the growth in the number of rooms available for tourists to rent, but it was
more significant than the amount of capital investment in communications, energy,
wastewater and defence during the same period.7
2.2.2 New Zealand’s tourism infrastructure
Within the World Economic Forum’s most recent Travel and Tourism Competitiveness Report
2015,8 infrastructure components account for 18 of the 90 competitiveness measures used
to rank 141 countries on their competitiveness as tourist destinations.
In that report, New Zealand is ranked as the 16th most competitive destination in the world.
However, it comes 21st on infrastructure (largely due to its 49th ranking for ground and port
infrastructure, which includes measures of road and rail density and quality, on which it
scores poorly).
The quality of New Zealand’s tourism infrastructure was an issue in Tourism Industry
Aotearoa’s Tourism 2025,9 which acknowledges that, while New Zealand’s natural
environment provides the setting for a range of visitor experiences, quality infrastructure
is needed to support the range of activities that visitors enjoy.
Tourism 2025 argues that:
›› Public investment in tourism infrastructure will encourage private sector investment.
Government support for convention centres and upgraded port and airport facilities
will lead to private sector investment in complementary assets like hotels, restaurants,
activities and attractions. Therefore, it recommends:
3 Crouch, G. I. & Ritchie, J. R. B. (1999). Tourism, competitiveness and societal prosperity. Journal of Business Research, 44(3),
137–152.
4 Ritchie, J. R. B. & Crouch, G. I.. (2003). The competitive destination: A sustainable tourism perspective. Wallingford, UK: CABI.
5 For example, Khadaroo, J. & Boopen, S. (2008). The role of transport infrastructure in international tourism development:
A gravity model approach. Tourism Management, 29(5), 831–840; Khadaroo, J. & Boopen, S. (2007). Transport infrastructure and
tourism development. Annals of Tourism Research, 34(4), 1021–1032.
6 Seetanah, B., Juwaheer, T. D., Lamport, M. J., Rojid, S., Sannassee, R. V., & Subadar, A. U. (2011). Does infrastructure matter
in tourism development? University of Mauritius Research Journal, 17, 105.
7 Boopen, S. (2006). Transport capital as a determinant of tourism development: A time series approach. Tourismos:
An International Multidisciplinary Journal of Tourism, 1(1), 55–73. Retrieved from http://mpra.ub.uni-muenchen.de/25402/
8 World Economic Forum. (2015). The travel and tourism competitiveness report 2015: Growth through shocks. Retrieved from
http://www3.weforum.org/docs/TT15/WEF_Global_Travel&Tourism_Report_2015.pdf
9 Tourism Industry Association of New Zealand. (n.d.). Tourism 2025. Retrieved from http://tourism2025.org.nz/MINISTRY OF BUSINESS, INNOVATION AND EMPLOYMENT TOURISM INFRASTRUCTURE AUGUST 2016
TOURISM INSIGHT SERIES
–– continued government support for the International Convention Centre in Auckland 11
and encouragement of a regional network of centres to further boost the important
convention and incentive market
–– upgrading port infrastructure to handle the requirements of larger cruise ships visiting
New Zealand more often
–– securing continued commitment from central and local government agencies for tourism
to be prioritised as a critical contributor to Christchurch’s economic recovery.
›› Better Wi-Fi connectivity and broadband services will improve the visitor experience and
raise New Zealand business capability, ensuring the tourism industry is internationally
competitive. According to analysis by Tourism New Zealand10 on the International Visitor
Survey microdata, the lack of free Wi-Fi is the main reason people rate accommodation
poorly. Tourism 2025 recommends that New Zealand extend access to low cost Wi-Fi
and broadband.
›› Local infrastructure that supports visitor activities also supports the people who live
in the communities they visit. Roads that are safe and enjoyable and offer places to stop
along the way enhance the holiday experience. Good signage, public toilets and dump
stations, recycling and other local amenities are also integral to creating an outstanding
visitor experience. Therefore Tourism 2025 recommends:
–– through New Zealand Trade and Enterprise, promoting and encouraging international
investment in tourism assets
–– supporting local infrastructure development, especially in popular visitor destinations
–– continuing the focus on improving visitor facilitation, including translation of public
agency ‘visitor facing’ information
–– continuing investing in aviation infrastructure and technology, including Airways
New Zealand’s navigation technology upgrades.
2.3 Tourism and population
Some regions are more affected by tourism than others. The ratio of visitor nights to
population is a useful indicator of how tourism may affect the local infrastructure (Figure 3).
A high ratio indicates that the relative number of tourists in relation to local residents is high,
which means that the population in the region swells considerably during the high tourist
season and there is an increased pressure on local infrastructure over that period. Among
regions, the West Coast has the highest ratio, followed by Otago, Nelson, and Marlborough.
10 Tourism New Zealand. (2015). Visitor experience. Retrieved from http://www.tourismnewzealand.com/markets-stats/
research/infographics/visitor-experience/MINISTRY OF BUSINESS, INNOVATION AND EMPLOYMENT TOURISM INFRASTRUCTURE AUGUST 2016
TOURISM INSIGHT SERIES
12 Figure 3: Ratio of annual visitor nights to population and visitor count to population,
year ended December 2015
West Coast
Otago
Nelson
Marlborough
Bay of Plenty
Tasman
Southland
Northland
Region
Wellington
Canterbury
Auckland
Waikato
Hawke's Bay
Gisborne
Taranaki
Manawatu-Wanganui
0 30 60 90 0 5 10
Ratio of annual visitor nights to population, 2015 Ratio of annual visitor count to population, 2015
Source: MBIE, International Visitor Survey
2.4 State of the Industry Survey 2015
In a survey of 269 tourism industry businesses in 2015 by Tourism Industry Aotearoa,
37 per cent of respondents stated that (lack of) investment in infrastructure was a challenge
for their business (3rd most popular response), and 21 per cent stated that it was the most
significant challenge for their business (4th most popular response).11 Conversely, 55 per cent
of respondents stated that increased air capacity was an opportunity for their business
(12 per cent considered it as their most significant opportunity), and 41 per cent stated that
infrastructure improvements were an opportunity for their business (5 per cent considered
it as their most significant opportunity).
11 Tourism Industry Association New Zealand & Lincoln University. (2015). State of the tourism industry 2015. Retrieved from
http://tourism2025.org.nz/assets/Uploads/SOI-2015-Final.pdfMINISTRY OF BUSINESS, INNOVATION AND EMPLOYMENT TOURISM INFRASTRUCTURE AUGUST 2016
TOURISM INSIGHT SERIES
The most significant challenge for tourism businesses in the survey was seasonality issues, 13
which almost half of respondents stated as their most important challenge. In open survey
answers the reason for the response was elaborated on with respondents describing issues
such as accommodation capacity, overcrowding at tourist sites, and the result these have on
tourist satisfaction.
In summary, the survey highlighted the importance of tourism infrastructure and its impact
on businesses within the industry.MINISTRY OF BUSINESS, INNOVATION AND EMPLOYMENT TOURISM INFRASTRUCTURE AUGUST 2016
TOURISM INSIGHT SERIES
14
3 International
air travel infrastructure
ƨƨ Summary
›› Current air travel infrastructure is not sufficient to meet the expected demand growth in
tourists over the next seven years.
›› Inbound seat capacity can be relatively quickly changed through adding/removing flights,
assuming appropriate air service agreements are in place. However, capacity of airport
infrastructure requires long-term planning. New Zealand’s international airports appear
to be proactively working towards the expansion in airport infrastructure, though there
could be short-term challenges before these large-scale developments come online.
›› The profitability of air routes (and therefore the likelihood of additional capacity coming online)
depends on a combination of yield (return per passenger) and load factor (how full the airplane
is). There are relatively few barriers to enter the market, so potential routes will be taken by an
air carrier if they are profitable.
3.1 International air travel infrastructure demand
Of New Zealand’s 3.5 million annual visitors, 99 per cent come by air. Regions with
international airports are widely recognised as being ‘gateways’ for international tourists
to New Zealand, and serve as hubs from which they disperse to the regions.
While domestic air travel is important for the regional dispersal of tourists from the main
international airports, it is difficult to separate tourist trips from commuting or business
trips in our data – therefore it is excluded from this analysis.
While international visitor arrivals were relatively steady over the period from 2007 to 2012,
from 2013 onwards there has been consistent growth as demand has recovered since the global
financial crisis. Large reductions in fuel prices have contributed to a significant improvement
in airline profitability and, as a consequence, their appetite for pursuing capacity growth –
especially in the delivery of long-haul international air services. From the January 2013 year
to the January 2016 year, there has been a 24 per cent increase in the number of arrivals
into New Zealand. A large proportion of this growth has happened recently, with 10 per cent
growth occurring in the March 2016 year. Annual arrivals have hit a record number, with
3.3 million international visitors in the year ended March 2016.MINISTRY OF BUSINESS, INNOVATION AND EMPLOYMENT TOURISM INFRASTRUCTURE AUGUST 2016
TOURISM INSIGHT SERIES
Figure 4: International visitor arrivals, monthly 15
Dec-2015
Dec-2014
400,000
Dec-2013
Dec-2011 Dec-2012
Dec-2010
Dec-2009
Dec-2008
Dec-2006 Dec-2007
Dec-2005
Arrivals
300,000
200,000
2006
2008
2010
2012
2014
2016
Year
Source: International Travel and Migration statistics, Statistics New Zealand
Monthly visitor arrivals are much higher in the summer, peaking in December each year.
Considering the last 10 years (2005 to 2015), December arrivals are approximately 64 per cent
higher than the annual average, while June is approximately 30 per cent lower than the
annual average (Figure 5). Air travel infrastructure, therefore, must be versatile enough to
accommodate this level of variation throughout the year. Given the fact that airports must
also deal with visitors departing after their trip, this translates into around 6 million passenger
transfers each year. When considering inbound and outbound trips of New Zealanders each
year, the total passenger movements for the year ended March 2016 were over 11.6 million.MINISTRY OF BUSINESS, INNOVATION AND EMPLOYMENT TOURISM INFRASTRUCTURE AUGUST 2016
TOURISM INSIGHT SERIES
16 Figure 5: Seasonality of international visitor arrivals
Percentage of monthly arrival exceeding annual average
Maximum
100%
Mean
50%
Minimum
0% Annual mean
Jan Feb Mar Apr May Jun Jul Aug Sep Oct Nov Dec
Source: International Travel and Migration statistics, Statistics New Zealand
The majority of the international visitors arrive at Auckland Airport (71 per cent in 2015)
(Figure 6). Auckland has seen steady growth in arrivals, up 8.6 per cent in 2015. However,
Queenstown and Wellington airports have seen stronger percentage growth over the last
year (at 24 per cent and 15 per cent, respectively). The increase in Queenstown Airport arrivals
is partly due to a reduction in volume through Christchurch, where infrastructure problems
related to the 2010 and 2011 earthquakes (especially available accommodation and travel
congestion difficulties), as well as the earthquakes themselves, may have discouraged some
tourists. In June 2016, night operations will start in Queenstown, which is expected to attract
more weekend tourists from Australia. Wellington Airport has seen growth due to new
routes starting in the last year, but the potential for future growth may be muted. Arrivals
to Christchurch Airport increased in 2015, but are still below pre-earthquake levels.MINISTRY OF BUSINESS, INNOVATION AND EMPLOYMENT TOURISM INFRASTRUCTURE AUGUST 2016
TOURISM INSIGHT SERIES
Figure 6: International visitor arrivals, annual average, by port 17
Auckland Wellington
2.5
4.7% 6.7% 0.2% 3.5% 4.3% 8.6% 0.2% 21.5% -1% 0.2% -0.7% 15.1%
2.0 0.20
Arrivals (million)
Arrivals (million)
1.5 0.15
71%
1.0 0.10
0.5 0.05
0.0 0.00
2009 2010 2011 2012 2013 2014 2015 2009 2010 2011 2012 2013 2014 2015
Queenstown 7% Christchurch
0.6
97.9% 23.8% 2.6% -12.1% -7% -0.1% -0.9% 8.1%
0.20
0.15
Arrivals (million)
Arrivals (million)
15% 0.4
0.10
6% 0.2
0.05
0.00 0.0
2013 2014 2015 2009 2010 2011 2012 2013 2014 2015
Source: International Travel and Migration statistics, Statistics New Zealand
Work undertaken by Auckland Airport suggests that there are opportunities to grow air
capacity to a number of parts of the world, most notably Germany, Canada and Australia.
Additional flights to these countries could potentially lead to higher visitor arrivals, as long
as airport infrastructure is sufficient to support this growth.
3.2 International air travel infrastructure supply
Air transport infrastructure for tourism comprises airports, airplanes and the air navigation
system. The quality and capacity of this infrastructure can have significant impact on the
quality of a tourist’s experience.12
The supply of air transport infrastructure can be broken down in to two main groupings:
›› infrastructure of airports
›› number and capacity of flights.
Sufficient capacity of both are needed to support the high growth in visitor arrivals forecast.
While new air services involve substantial commitments from airlines in terms of capital and
operating costs, the primary assets (aircraft) are ultimately mobile and can be redeployed
between markets with relatively short lead times. The number of flights to a particular
destination can adjust quickly, provided there is sufficient aircraft available and sufficient
demand at appropriate yields for airlines to operate profitably. In contrast, investment in
airport infrastructure typically involves longer lead times and financial commitments to
immobile, largely specialised assets with high fixed costs.
It is difficult to measure the available supply of airport infrastructure. However, it is
relatively straightforward to identify capacity and the number of seats occupied of flights
into New Zealand.
12 National Infrastructure Unit. (2015). Infrastructure evidence base – 2015 refresh: Transport sector. Retrieved from
http://www.infrastructure.govt.nz/plan/evidencebase/2015-nip-evidence-transport.pdfMINISTRY OF BUSINESS, INNOVATION AND EMPLOYMENT TOURISM INFRASTRUCTURE AUGUST 2016
TOURISM INSIGHT SERIES
18 New Zealand has five airports with scheduled international services: Auckland, Wellington,
Christchurch, Dunedin and Queenstown. Twenty-six airports receive scheduled domestic
services from operators of aircraft of 19 seats or more. Two airports (Auckland and Christchurch)
are capable of supporting long-haul international air services. Christchurch Airport has
a significant amount of under-utilised capacity in this regard. Most airports are owned by
local government, though some are partly owned by central government or private investors.
Airways New Zealand, a state-owned enterprise, provides air navigational infrastructure.
Aviation capacity is provided by the two domestic and 24 international passenger carriers
which operate in New Zealand. This infrastructure is for the most part privately provided.
The total air capacity is shown in Figure 7, with 28.9 million domestic seats and 7.3 million
inbound international seats in 2015.
Figure 7: Seat capacity by origin
Domestic International
29,000,000
7,250,000
7,000,000
28,000,000
Seats
6,750,000
27,000,000
6,500,000
26,000,000
6,250,000
2008
2009
2010
2011
2012
2013
2014
2015
2008
2009
2010
2011
2012
2013
2014
2015
Source: Sabre
Air New Zealand carries approximately 80 per cent of domestic traffic and, together with their
alliance partners, operates 40 per cent of international capacity into and out of New Zealand.
About 95.6 per cent of passenger seat hours are flown on large planes (greater than 30 seats).MINISTRY OF BUSINESS, INNOVATION AND EMPLOYMENT TOURISM INFRASTRUCTURE AUGUST 2016
TOURISM INSIGHT SERIES
Figure 8: Flight capacity of international and national flights per operator 19
Domestic International
Virgin Australia International Airlines
Transavia Airlines
Thai Airways International Public
Singapore Airlines Limited
Sama Air Llc
Qantas Airways Ltd.
Philippine Airlines Inc.
Malaysia Airline System Berhad
Lan Airlines S.A.
Korean Air Lines Co. Ltd.
Jetstar Airways Pty Limited
Hawaiian Airlines Inc.
Flexflight Aps
Emirates
China Southern Airlines
China Eastern Airlines
China Airlines
Cathay Pacific Airways Ltd.
Cargolux Airlines International S.A.
Airlines Air Onix
Air Vanuatu (Operations) Limited
Air Tahiti Nui
Air Pacific Ltd.
Air New Zealand Limited
Air China Limited
Air Caledonie International
Aerolineas Argentinas
0
0
5,000,000
10,000,000
15,000,000
20,000,000
25,000,000
1,000,000
2,000,000
3,000,000
Seats
Year 2013 2014 2015
Source: SabreMINISTRY OF BUSINESS, INNOVATION AND EMPLOYMENT TOURISM INFRASTRUCTURE AUGUST 2016
TOURISM INSIGHT SERIES
20 Figure 9: Percentage of flight capacity of international and domestic flights, by operator
Domestic International
Virgin Australia International Airlines
Transavia Airlines
Thai Airways International Public
Singapore Airlines Limited
Sama Air Llc
Qantas Airways Ltd.
Philippine Airlines Inc.
Malaysia Airline System Berhad
Lan Airlines S.A.
Korean Air Lines Co. Ltd.
Jetstar Airways Pty Limited
Hawaiian Airlines Inc.
Flexflight Aps
Emirates
China Southern Airlines
China Eastern Airlines
China Airlines
Cathay Pacific Airways Ltd.
Cargolux Airlines International S.A.
Airlines Air Onix
Air Vanuatu (Operations) Limited
Air Tahiti Nui
Air Pacific Ltd.
Air New Zealand Limited
Air China Limited
Air Caledonie International
Aerolineas Argentinas
0%
20%
40%
60%
80%
0%
10%
20%
30%
40%
Seats
Year 2013 2014 2015
Source: Sabre
3.2.1 Air service agreements
The pool of air routes available to carriers is governed by air service agreements. These
agreements are required before an international flight can operate between two countries.
New Zealand has 59 agreements in place, 18 agreements approved by Cabinet are awaiting
signature, one code-share arrangement is awaiting signature, and two agreements are
under negotiation.MINISTRY OF BUSINESS, INNOVATION AND EMPLOYMENT TOURISM INFRASTRUCTURE AUGUST 2016
TOURISM INSIGHT SERIES
Table 1: New Zealand air service agreements 21
COUNTRY AGREEMENT TYPE STATUS
Argentina, Australia, Austria, Belgium, Bilateral air services In place
Brazil, Cambodia, Canada, China,
Denmark, Fiji, Finland, France, Germany,
Greece, Hong Kong, Indonesia, Ireland,
Italy, Jamaica, Japan, Korea, Kuwait,
Luxembourg, Macau, Malaysia, Mexico,
Nauru, Niue, Norway, Papua New
Guinea, Philippines, Qatar, Russia, Saudi
Arabia, Seychelles, Solomon Islands,
South Africa, Spain, Sri Lanka, Sweden,
Switzerland, Taiwan, Thailand, Turkey,
United Arab Emirates, United Kingdom,
Uruguay, Vanuatu, Viet Nam
Brunei, Chile, Cook Islands, Mongolia Multilateral Agreement on the In place
(cargo-only), Singapore, Tonga and the Liberalization of International Air
United States of America Transportation (MALIAT)
Curacao, Czech Republic Code-share only air services In place
arrangement
Bahrain, Colombia, Egypt, Ethiopia, Air services Approved by Cabinet
Iceland, Israel, Mauritius, Nepal, but awaiting signature
Netherlands, Nigeria, Pakistan, Panama,
Portugal, Oman, Paraguay Serbia,
Togo, Zambia
The Bahamas Code-share only Awaiting signature
Laos, Peru Air services Under negotiation
Air service agreements specify:
›› routes that can be flown
›› capacity (frequency and aircraft types) that may be offered
›› how many airlines may operate
›› how tariffs are regulated.
Open skies agreements are a subset of air service agreements that place little or no
restrictions on available routes, number of flights or flight prices. New Zealand currently
has more than 40 agreements that could be classified as open skies agreements, depending
on the definition of open skies used by different jurisdictions. These agreements set
New Zealand as one of the most open commercial aviation markets in the world, with
relatively few barriers that could restrict air carriers flying to the country.
3.2.2 International air connections
Air connectivity is critical to the tourism industry and to the New Zealand economy as a
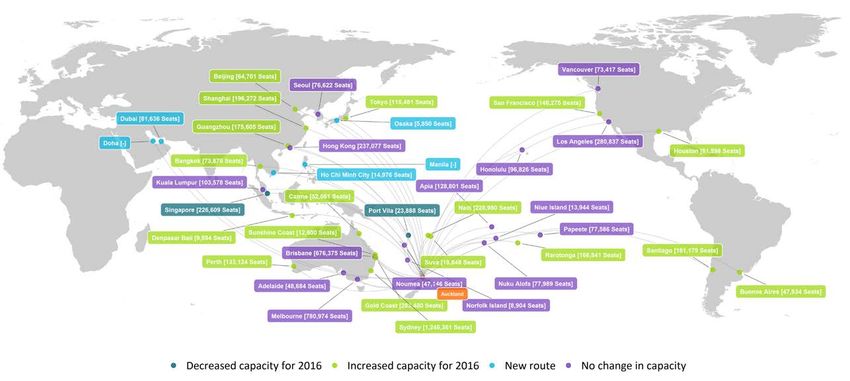
whole. Figure 10 shows all the countries flying directly to New Zealand, while Figures 42
to 45 in Appendix 3 of this report show the cities with direct flights to New Zealand by port,
along with new routes and planned expansions. Please note that in the graphs, due to
fluctuations in capacity across years, a change in capacity is only considered if it grows
or falls by more than 5 per cent. Capacity changes of less than 5 per cent are considered
to be unchanged.MINISTRY OF BUSINESS, INNOVATION AND EMPLOYMENT TOURISM INFRASTRUCTURE AUGUST 2016
TOURISM INSIGHT SERIES
22 New air routes provide increased capacity and this can influence demand. After an extended
period of little growth in annual capacity (number of seats), New Zealand saw a significant
increase in inbound flight capacity from late 2013, with this expected to continue in 2016
and 2017 (refer Figure 7). In contrast, growth in inbound capacity to Australia has been more
consistent over the period. Given its relatively small size and distance from a number of
international markets, long-haul international air services to New Zealand involved significant
commercial risks, especially in the very high fuel price environment that existed between
2009 and 2013. These risks have reduced as demand has continued to grow and the cost
of fuel has decreased significantly.Figure 10: Inbound capacity to New Zealand, 2016
MINISTRY OF BUSINESS, INNOVATION AND EMPLOYMENT
TOURISM INSIGHT SERIES
TOURISM INFRASTRUCTURE
Note: data for the Philippines and Qatar are currently unavailable.
AUGUST 2016
23MINISTRY OF BUSINESS, INNOVATION AND EMPLOYMENT TOURISM INFRASTRUCTURE AUGUST 2016
TOURISM INSIGHT SERIES
24 Figure 11: Inbound capacity – New Zealand vs Australia
Monthly capacity
Australia
4,000,000
3,000,000
Seats
2,000,000
New Zealand
1,000,000
2010
2012
2014
2016
Capacity index
Australia
140
New Zealand
120
Value
100
2010
2012
2014
2016
The recent growth in capacity has been shared across New Zealand’s four main international
airports. Capacity growth has been exceptional in Queenstown, up 97.9 per cent from 2013 to
2014, and 23.8 per cent from 2014 to 2015. The number of international arrivals in Queenstown
in 2013 was very low when compared to the other airports in New Zealand. That said,
Queenstown’s capacity is now just approaching Wellington’s. In terms of actual seats,
58.5 per cent of the growth has occurred in Auckland, with much smaller absolute growth
in capacity for the other airports.MINISTRY OF BUSINESS, INNOVATION AND EMPLOYMENT TOURISM INFRASTRUCTURE AUGUST 2016
TOURISM INSIGHT SERIES
Figure 12: Annual inbound capacity to New Zealand’s main international airports 25
Monthly capacity
1,250,000
Auckland
1,000,000
750,000
Seats
500,000
250,000 Christchurch
Wellington
0 Queenstown
2010
2012
2014
2016
Capacity index
600
Queenstown
400
Value
200 Auckland
Wellington
Christchurch
0
2010
2012
2014
2016
Source: Sabre
Approximately a million more seats have been made available from Australia over the last four
years, increasing capacity by 25 per cent. Capacity to China remains at a much lower level than
Australia, but has seen a meteoric rise, from less than 50,000 in 2008 to almost 500,000
in 2016. The capacity of flights to the United States fell over the global financial crisis period,
but has since recovered, growing above the previous high in capacity due to new flights to
Houston and San Francisco, and growth in the number of existing flights to Los Angeles.
Other growth areas include the Middle East, where a new flight from Qatar Airways from
Doha to Auckland is planned in February 2017 (which will break records for being the longest
commercial long-haul flight in the world).MINISTRY OF BUSINESS, INNOVATION AND EMPLOYMENT TOURISM INFRASTRUCTURE AUGUST 2016
TOURISM INSIGHT SERIES
26 Figure 13: Annual inbound capacity to New Zealand by origin country
South America Australia Southeast Asia
5,000,000
AUSTRALIA SINGAPORE
CHILE 4,750,000 300,000
150,000
4,500,000
Seats
Seats
Seats
100,000 200,000 MALAYSIA
4,250,000
THAILAND
50,000 ARGENTINA 100,000 BRUNEI
4,000,000 INDONESIA
VIETNAM
0 3,750,000 0
2008
2009
2010
2011
2012
2013
2014
2015
2016
2008
2009
2010
2011
2012
2013
2014
2015
2016
2008
2009
2010
2011
2012
2013
2014
2015
2016
North America Central Asia Pacific
600,000 300,000
UNITED STATES FIJI ISLANDS
400,000 CHINA
400,000
300,000
Seats
Seats
200,000
200,000
CANADA 100,000 200,000
2008
2009
2010
2011
2012
2013
2014
2015
2016
2008
2009
2010
2011
2012
2013
2014
2015
2016
COOK ISLANDS
Seats
WESTERN SAMOA
Far East Gulf
81,636.50 TONGA
100,000
300,000
FRENCH POLYNESIA
81,636.25
HONG KONG - CHINA
200,000 NEW CALEDONIA
Seats
Seats
81,636.00
VANUATU
JAPAN
UNITED ARAB EMIRATES
100,000 NIUE
SOUTH KOREA 81,635.75
TAIWAN
NORFOLK ISLANDS
0 0
81,635.50
2008
2009
2010
2011
2012
2013
2014
2015
2016
2016
2008
2009
2010
2011
2012
2013
2014
2015
2016
Source: Sabre
3.2.3 Planned/New growth in capacity
New Zealand airports have announced a number of new flights across 2016 that should
increase capacity in the short-to-medium term. A full list of these flights is presented in
Appendix 1.
3.2.4 Airport infrastructure
Several construction projects are in the pipeline to expand international airport capacity.
These projects are required to support the growth in tourist numbers that additional flights
will bring.
As part of its 30-year plan, Auckland International Airport plans to build a new terminal, a new
northern runway and a new taxi apron, at an estimated cost of $2.4 billion.13 The new terminal
will be built in stages, with the plan to be able to accommodate up to 40 million domestic and
international passengers annually,14 and have 94 spaces for aircraft to park. The first stage of
the plan, to be completed by 2019, is to merge the domestic and international terminals. More
car parking will be in place by 2022. Space has been allocated for a rail corridor and underground
station as part of the plan.
13 Auckland Airport. (2014). Airport of the future: Our vision for the next 30 years. Retrieved from http://www.aucklandairport.
co.nz/downloads/aial-masterplan.pdf
14 The existing airport terminal accommodated 16.5 million passengers in 2015.MINISTRY OF BUSINESS, INNOVATION AND EMPLOYMENT TOURISM INFRASTRUCTURE AUGUST 2016
TOURISM INSIGHT SERIES
Construction of a new 10-storey, 1,000-space car park at Wellington Airport is underway. 27
This $70 million project should be completed by the end of 2017. Work is also underway
on a new control tower, estimated to cost around $18 million, to be completed late 2016.
Wellington Airport lodged a resource consent application to extend Wellington’s runway
on 28 April 2016. The proposed $300 million extension, if successful, will increase the runway
south by 354 metres, allowing direct long-haul flights to Asia. A resource consent hearing
on the proposal is expected to occur in February 2017.
Queenstown Airport’s $18 million expansion was completed in April 2016. This was an 18-week
construction project, including widening the airport’s runway from 15 metres to 45 metres,
installing runway, taxiway, apron and approach lights, and trenching for electrical cabling.
The investment is designed to increase the capacity of the airport by allowing aircraft
operations to be extended beyond a ‘daylight hours only’ limitation.
In all, around $2.8 billion of work is in the pipeline for New Zealand’s international airports,
the lion’s share (85 per cent) being for Auckland’s long-term terminal development.
3.2.5 Sustainability of air services
Load factors measure the percentage of total seats on a flight being used by passengers.
They are one of the few readily available measures to assess how an air service might be
performing financially for an airline and whether there may be incentives to grow or reduce
capacity on a particular route. However, for airline operators, a number of other important
questions are involved in such a decision. These factors include, but are not limited to:
a. Revenue quality – a function of not only the volume of passengers but also the price
at which a given level of volume exists. This influences whether the resultant revenue
is derived at an economically sustainable level.
b. Opportunity cost/prioritisation – Given finite capital, is growth in an existing service
or the introduction of a new service the best possible option for deploying that capital
in terms of risk and return?
Both of the above factors necessarily include some consideration by an airline of how successfully
a new service is expected to compete against other airline offerings in a particular market.
New Zealand has one of the most open air services markets in the world. There are relatively
few, if any, barriers to entry other than the commercial risks inherent in operating international
flights themselves. Air services are capital intensive, labour intensive and sensitive to both
fuel price fluctuations and sudden changes in the demand environment.
Subject to an airline’s assessment of those commercial risks, opportunities for growth are
typically seized upon quickly. This is evidenced by the pace and scale of the growth seen in the
number of international air services that have either started and/or been announced over the
past 18 months across each of New Zealand’s key tourism markets, including Australia, China,
the United States, the United Kingdom/Europe, South East Asia and Japan.
From the Australia market, annual average load factors are generally growing across all
airports (apart from Queenstown). The load factor into Auckland has been increasing since
2013 from 70 per cent up to 75 per cent.
The Auckland load factor is lower than both Wellington and Dunedin. Dunedin, as a relatively
niche international airport serving only Australia, has a load factor over 80 per cent. Outside
of the Australian market, some clear patterns emerge. Pacific Island countries, including
New Caledonia, Tonga, French Polynesia and Western Samoa, have seen strong increases
in load factors over the last two to three years.You can also read