DECARBONISATION OPTIONS FOR THE DUTCH MALTINGS & BREWERIES - M.A. Muller, J.J. de Jonge & M. van Hout
←
→
Page content transcription
If your browser does not render page correctly, please read the page content below
DECARBONISATION OPTIONS
FOR THE DUTCH MALTINGS &
 BREWERIES
 M.A. Muller, J.J. de Jonge & M. van Hout

 16 March 2021

Manufacturing Industry Decarbonisation Data Exchange Network
Decarbonisation options for the Dutch maltings and breweries
© PBL Netherlands Environmental Assessment Agency; © TNO
The Hague, 2021
PBL publication number: 3482
TNO project nr. 060.47868 / TNO 2021 P10235

Authors
M.A. Muller, J.J. De Jonge & M. van Hout

Acknowledgements
Special thanks go to Anton Wemmers (TNO), Anne-Marie Niks (NL Brouwers), Susan Ladrak
(Grolsch), Jan Kempers (Heineken), Martijn van Iersel (Holland Malt) and Eric Veldwiesch
(Nederlandse Brouwers).

MIDDEN project coordination and responsibility
The MIDDEN project (Manufacturing Industry Decarbonisation Data Exchange Network) was
initiated and is also coordinated and funded by PBL and TNO Energy Transition Studies. The
project aims to support industry, policymakers, analysts, and the energy sector in their
common efforts to achieve deep decarbonisation. Correspondence regarding the project may
be addressed to: D. van Dam (PBL), Dick.vanDam@pbl.nl or S. Gamboa Palacios (TNO),
silvana.gamboa@tno.nl.

Erratum
In this version the following correction has been made: In paragraph 1.6, Figure 5, page 15,
a value has been corrected from 0.33 to 0.0325 tonne of Waste grains (culms).

This publication is a joint publication by PBL and TNO and can be downloaded from:
www.pbl.nl/en. Parts of this publication may be reproduced, providing the source is stated, in
the form: Muller, M.A., De Jonge, J.J. and Van Hout, M. (2021), Decarbonisation options for
the Dutch Maltings & Breweries. PBL Netherlands Environmental Assessment Agency and
TNO Energy Transition Studies, The Hague.

PBL Netherlands Environmental Assessment Agency is the national institute for strategic
policy analysis in the fields of the environment, nature and spatial planning. We contribute to
improving the quality of political and administrative decision-making by conducting outlook
studies, analyses and evaluations in which an integrated approach is considered paramount.
Policy relevance is the prime concern in all of our studies. We conduct solicited and
unsolicited research that is both independent and scientifically sound.

TNO Energy Transition Studies has a twofold mission: to accelerate the energy transition and
to strengthen the competitive position of the Netherlands. TNO conducts independent and
internationally leading research and we stand for an agenda-setting, initiating and supporting
role for government, industry and NGOs. The information as presented in this report is
(mostly) gathered through desktop research and public sources. During the assessment of
the current situation of the maltings and breweries sector and its options for deep
decarbonisation, several stakeholders from the sectors were consulted. PBL and TNO remain
responsible for the content. The decarbonisation options and parameters are explicitly not
verified by the companies. The visions provided in this report do not necessarily represent
the sectors’ vision on pathways for deep decarbonisation. Furthermore, the insights and data
in this report are considered as dynamic and therefore can be changed and adapted when
new insights and information becomes available.
Contents
Summary 4

INTRODUCTION 5
1 MALT PRODUCTION IN THE NETHERLANDS 7
1.1 Maltings in the Netherlands 7
1.2 Production of malt in general 10
1.3 Energy consumption of Dutch EU ETS maltings 11
1.4 CO2 emissions of Dutch EU ETS maltings 12
1.5 Malting products and use 13
1.6 Mass and energy balance 14

2 BEER PRODUCTION IN THE NETHERLANDS 16
2.2 Production of beer in general 19
2.3 Energy consumption of the four EU ETS breweries 25
2.4 Brewery products and use 27
2.5 Mass and energy balance 29

3 OPTIONS FOR DECARBONISATION 31
3.1 Decarbonisation options energy-intensive industry 31
3.2 Energy efficiency improvements 32
3.3 Decarbonisation of heat demand 35

4 DISCUSSION 46
4.1 Current activities and future decarbonisation plans 46
4.2 Concluding remarks 50

REFERENCES 52

 A MIDDEN report – PBL TNO | 3
FINDINGS

Summary
MIDDEN (Manufacturing Industry Decarbonization Data Exchange Network) aims to support
industry, policy makers, analysts and the energy sector in their common efforts to achieve
deep decarbonisation. The scope in MIDDEN are Dutch companies in the EU Emissions
Trading System (EU ETS) and the direct emissions per production location (i.e. scope 1
only). This report covers two maltings and four breweries that are in the EU ETS, which were
responsible for 142 kilotonne (kt) of CO2 emissions in 2019 (0.17% of the total Dutch EU
ETS emissions). The two maltings covered approximately 80% of the total malt production
capacity in the Netherlands and the breweries are responsible for 90 – 95% of all the beer
produced in the Netherlands.

The two maltings have a combined capacity of approximately 400 kilotonne of malt per year
and the four breweries produced approximately 25 million hectolitre of beer in 2019. The
average specific energy consumption (SEC) of the two maltings was 2,257 MJ/tonne of malt
in 2019 (627 kWh/tonne of malt). The average SEC of the four breweries is estimated to be
73.6 MJ/hectolitre (52.0 thermal energy and 21.6 electrical energy). When comparing SEC-
values that are found in the literature with the SEC values of the maltings and breweries, the
conclusion can be made that they approach the best practice-values.

In the last few decades, significant effort has been done by the maltings and breweries to
increase energy efficiency and increase the share of renewable energy. Both for the maltings
and the breweries holds that in the last decades most investments were made in energy
efficiency measures and that there is limited potential to further improve the energy
efficiency. The large quantities of emissions involved with malt and beer production all come
from the combustion of natural gas in direct-fired heating systems, on-site boilers or
combined heat-and-power (CHP) installations. Mostly, steam is the heat transfer medium,
while some sites have hot water piping systems. For deep decarbonisation therefore, most of
the potential relates to replacing natural gas, i.e. the renewable supply of heat and
electricity. Some maltings and breweries in the Netherlands have the ambition to become
climate neutral before 2030, thus implying that further decarbonisation involves investments
in so called ‘break-through’ technologies, such as geothermal energy or (waste) heat
networks combined with heat pumps. Furthermore, the use of biogas is important as a
substitute of natural gas. Using spent grains, which are left over after de-culming in maltings
or after the wort production phase in breweries, as a bio based fuel can be a very valuable
decarbonisation measure as well as generating biogas via the anaerobic fermentation of the
wastewater treatment systems.

PBL TNO | 4 – A MIDDEN report
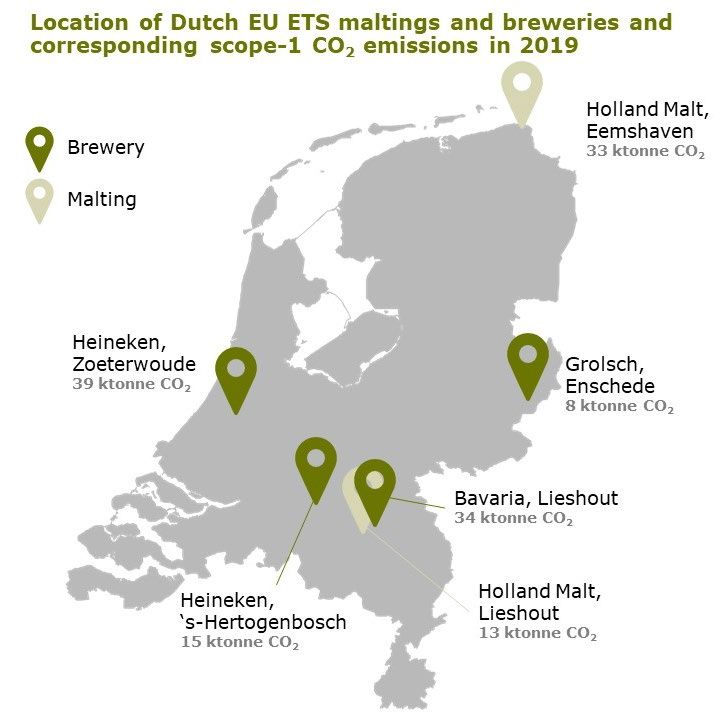
FULL RESULTS

Introduction
This report describes the current situation for the production of malt and beer in the
Netherlands and the options and preconditions for its decarbonisation. The study is part of
the MIDDEN project (Manufacturing Industry Decarbonisation Data Exchange Network). The
MIDDEN project aims to support industry, policymakers, analysts, and the energy sector in
their common efforts to achieve deep decarbonisation. The scope in MIDDEN are Dutch
companies in the EU Emissions Trading System (EU ETS) and the direct emissions per
production location (i.e. scope 1 only 1). The MIDDEN project will update and elaborate
further on options in the future, in close connection with the industry.

The two EU ETS maltings and four EU ETS breweries covered in this report were responsible
for in total 142 kilotonne (kt) of CO2 2 emissions in 2019 (which was 0.17% of the total Dutch
EU ETS emissions). The locations of the maltings and breweries and the associated CO2
emissions (2019) are presented in Figure 1.

Figure 1. Location of Dutch EU ETS maltings and breweries and corresponding
scope-1 CO2 emissions in 2019 (sources: (NEa, 2020; Royal Swinkels Family
Breweries N.V., 2021)). Note that the emissions at the breweries also include the
emissions associated with soda drinks production.

1 The emissions under scope 1 are the direct emissions on-site. Scope 2 emissions are related to imported

electricity and scope 3 emissions are emissions in the whole supply chain.
2 It would be more correct to write CO -equivalents since the EU ETS is about greenhouse gas emissions.
 2
 However, for readability reasons, we will refer to just CO2 emissions in this report.

 A MIDDEN report – PBL TNO | 5
In Figure 2 an overview is given of the total emissions per year in the malting and beer
sector since 2013 as reported by the Dutch Emission Authority (NEa). The figure clearly
shows that the sector structurally reduced emissions each year until 2017, but after 2017 the
emissions increased. This is mainly due to the expansion of most of the breweries and the
vast increase in capacity by Holland Malt. Furthermore, it is important to note that the total
amount of free emission allowances 3, that are granted by the NEa, are reduced structurally
each year.

Figure 2. Reported emissions and total free emission allowances granted by the
NEa for the whole EU ETS malting and beer sector per year (NEa, 2020).

Reading guide
The report is structured as follows; Chapter 1 and Chapter 2 provide an overview of the
current situation for maltings and breweries, respectively, elaborating on the history,
production (capacity), process steps, employment, energy use, and CO2 emissions of the
production locations.

In chapter 3, the options for (deep) decarbonisation are discussed for the maltings and
breweries in a combined fashion focusing on energy efficiency and utilities. In chapter 4, the
current and future decarbonisation measures and plans of the maltings and breweries are
presented and the findings from the MIDDEN study for the maltings and breweries section
are discussed.

3 1 EUA (European Union Allowance) = The right to emit 1 tonne of CO2-eq emissions

PBL TNO | 6 – A MIDDEN report
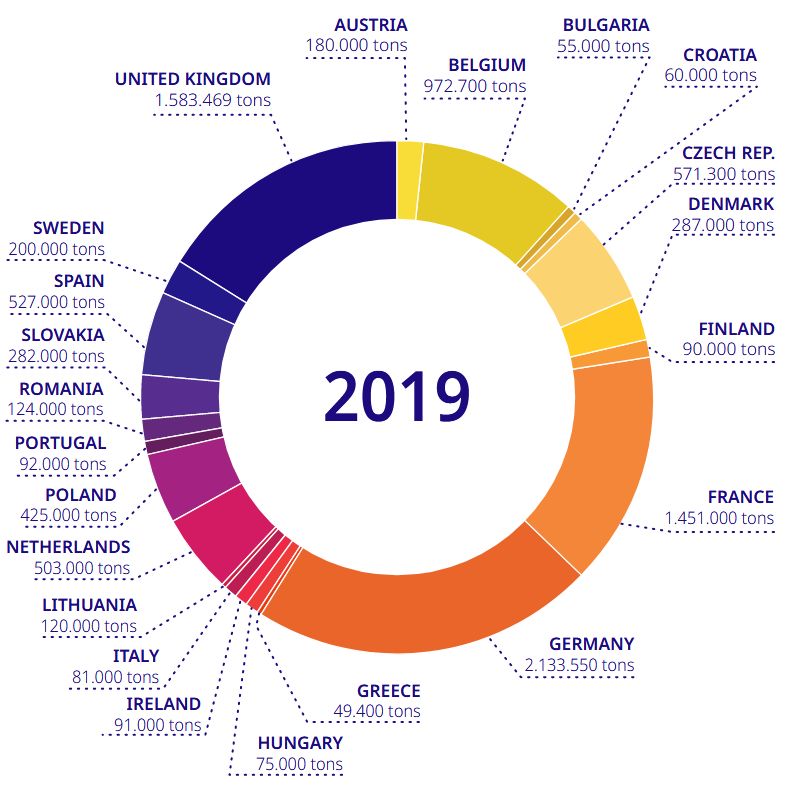
1 Malt production in
the Netherlands
1.1 Maltings in the Netherlands
Malt is produced in many countries in the European Union (EU). As presented in the figure
below, the total production capacity in 2019 of all EU countries (including the United
Kingdom) together adds up to almost 10 megatonne of malt. The Netherlands is responsible
for 5% of the EU total and there are currently four maltings with a total production capacity
of about 500 kilotonne (kt) malt per year. These four maltings are Cargill B.V. (Swalmen);
The Swaen (Kloosterzande); Holland Malt B.V. Lieshout; Holland Malt B.V. Eemshaven. Of
these four only two maltings, the ones owned by Holland Malt B.V. (locations Lieshout and
Eemshaven, are part of the EU Emission Trading Scheme (EU ETS) and are therefore covered
in this underlying study. These two maltings cover approximately 80% of the total malt
production capacity in the Netherlands. The CO2 emissions 4 related to the production of
these maltings cover about 0.06% of the total EU ETS emissions in 2019 in the Netherlands.

Figure 3. Production of malt in the EU (including the United Kingdom) in 2019.
Source: (Euromalt, n.d.)

4 Note that with regard to greenhouse gas emissions, only the CO2 emissions are of interest at maltings.

 A MIDDEN report – PBL TNO | 7
1.1.1 Holland Malt B.V. maltings
In 2003, Bavaria (57%) and Agrifirm (43%) joined forces in Holland Malt B.V. In 2014
however, the firms agreed that Agrifirm will sell all their shares to Bavaria, making Bavaria
the only shareholder of the Holland Malt maltings (Agrifirm, 2014). Since Bavaria is owned
by the Royal Swinkels Family Brewers Corporation the two maltings are currently owned for
100% by Royal Swinkels Family Brewers Corporation. In 2016, approximately 50% of the
malt production of Holland Malt B.V. was intended for the European market of which part is
consumed by Bavaria’s own breweries, and the other 50% was exported to Africa, Asia, and
Latin-America (Groningen Seaports, 2016). The net revenue of Holland Malt B.V. related to
the production of malt was 90 million euros in 2016 and 87.3 million euros in 2017 which
covers approximately 15% of the total net revenues of Swinkels Family Breweries (Royal
Swinkels Family Brewers Holding N.V., 2020a).

Holland Malt Lieshout
The malting in Lieshout was constructed during the beginning of the second World War by
the Swinkels family with a capacity of about 6 kt of malt per year (Holland Malt, 2019). The
capacity doubled in 1964 to 12 kt malt per year, and in 1988 the whole unit was modernized
and capacity was further extended to 120 kt/year. In 1990 the unit was extended with a
second germination tower and in 1995 with a second kilning tower that further increased the
production capacity. In the table below, several specifications of the malting are presented.
It should be noted however that the malting is not mentioned separately by the Netherlands
Emission Authority (NEa) because it is part of the whole production facility site of Bavaria
N.V. in Lieshout, which also includes beer and soda drinks production. Therefore, the
company name of the malting as reported by the NEa is Bavaria N.V. Furthermore, it should
be noted that the utilities/energy system of the malting in Lieshout is shared with the
Bavaria facilities that are used for the beer and soda drinks production.

Table 1. Company characteristics of the Holland Malt Lieshout malting

 Value Source
 Company Name (NEa) Bavaria N.V. (NEa, 2020)
 Subsector (SBI) 11.06 (CBS, 2018a)
 Corporate Group Royal Swinkels Family Breweries (NEa, 2020)
 N.V.
 Address De Stater 1, 5737 RV, Lieshout Company website
 Permit number (NEa) NL-200400297 (NEa, 2020)
 Year of Construction 1938 Company website
 Employment (fte)* 793 (Royal Swinkels Family
 Brewers Holding N.V.,
 2020a)
 Website www.hollandmalt.com
 Production capacity Unknown
 (tonne/yr)
 Production of malt in 121,229 (Royal Swinkels Family
 2019 (tonne) Breweries N.V., 2021)
 CO2 emissions (scope 12,828** (Royal Swinkels Family
 1) in 2019 (tonne) Breweries N.V., 2021)
 Main heat production Gas-fired CHP(‘s) (Royal Swinkels Family
 unit(s)* Gas-fired boiler(s) Breweries N.V., 2021)
 CHP biogas motor(s) (BGG’s)
 Waste heat buffer(s)

PBL TNO | 8 – A MIDDEN report
Value Source
 Characteristics heat* Steam: 180 °C, 10 barg (Royal Swinkels Family
 Hot water: 95 °C Breweries N.V., 2021)
* Value(s) for the whole Royal Swinkels Lieshout location.
** The total CO2 emissions (scope 1) of the Lieshout location amount to approximately 47 kt (47,289 ton, (NEa,
 2020)), of which 12,828 ton CO2 can be allocated to the malting processes and 31,357 ton CO2 to the brewing
 processes according to Royal Swinkels (Royal Swinkels Family Breweries N.V., 2021). Which leaves approximately
 3.1 kton CO2 that is allocated to other activities like soda production.

Holland Malt Eemshaven
Holland Malt extended its malt production capacity in 2004 by investing in a new malting unit
in the Eemshaven region (Holland Malt, 2019). It is a state-of-the-art unit and considered to
be one of the largest and modern malt plants of today. In 2018, the malting had a large
upgrade and the capacity was doubled to 280 kt of malt with the investment of a second
malting facility that took approximately 2 years to be finalized. Holland Malt has the ambition
to make this unit the largest and most sustainable maltings in Europe.

Table 2. Company characteristics of the Holland Malt Eemshaven malting

 Value Source
 Company Name (NEa) Holland Malt B.V. locatie (NEa, 2020)
 Eemshaven
 Subsector (SBI) 11.06 (CBS, 2018a)
 Corporate Group Royal Swinkels Family Breweries (NEa, 2020)
 N.V.
 Address Westlob 4, 9979 XJ, Eemshaven Company website
 Permit number (NEa) NL-201100008 (NEa, 2020)
 Year of Construction 2004 Company website
 Employment (fte) 28 (Royal Swinkels Family
 Brewers Holding N.V.,
 2020a)
 Website www.hollandmalt.com
 Production capacity 280,000 (Royal Swinkels Family
 (tonne/yr) Brewers Holding N.V.,
 2020b)
 Production of malt in 280,000 (Royal Swinkels Family
 2019 (tonne) Brewers Holding N.V.,
 2020b)
 CO2 emissions (scope 33,294 (NEa, 2020)
 1) in 2019 (tonne)
 Main heat production Direct gas combustion (Royal Swinkels Family
 unit(s) Breweries N.V., 2021)
 Characteristics heat Direct gas combustion per (Royal Swinkels Family
 installation including heat Breweries N.V., 2021)
 exchangers

The following subsections describe how malt is produced, providing an overview of the main
process inputs and outputs. In addition, where relevant, comparisons with international
literature are made. Also, the processes that lead to direct CO2 emissions are discussed.

 A MIDDEN report – PBL TNO | 9
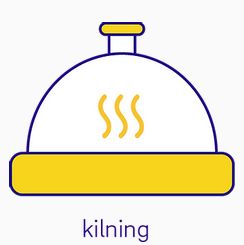
1.2 Production of malt in general
The process of the malt production, which is a batch process and therefore discontinuous, is
schematically presented in Figure 4 and entails the following steps (Carbon Trust, 2011a):

 1. Raw barley pre-processing
 The pre-processing phase covers the intake, drying, storage and screening and
 weighing of the raw barley. This step covers approximately 4% of the total electricity
 use and 0.2% of the natural gas use and in total 0.7% of the total primary energy
 use 5 in maltings.

 2. Steeping
 First stage of the core malting process is the steeping process that takes about 1-2
 days in total (Holland Malt, 2019). During this process the barley is soaked in water
 to increase the moisture content (from around 12% to 43-46%) and to clean the
 barley. When the barley starts to sprout, it enters the germination process. The
 steeping step only needs electricity, mainly for the fans and blowers, and uses
 approximately 4% of the total electricity consumption and in total 0.6% of the total
 primary energy use in maltings.

 3. Germination
 During germination the steeped barley is allowed to sprout in a moist, warm and
 light environment. The moist barley is spread out in a germination vessel and
 produces heat during the germination process. For optimal temperature control
 throughout the bed of barley, and for the grains not to entangle, the bed is turned
 every so often. At Holland Malt this is done by mechanical turners. This process takes
 5 to 6 days in total (Holland Malt, 2019). The germinated barley, also referred to as
 ‘green malt’ is then transferred from the germinating vessels to the kiln. The
 germination step also only needs electricity and uses approximately 30% of the total
 electricity consumption and in total 4.3% of the total primary energy use in maltings.

 4. Kilning
 The kilning process is the most important step, since it is crucial for the taste of the
 beer, and it is also the most energy intensive step in the production of malt. During
 the kilning process, the germination process is put to a halt by drying the green malt
 where the temperature is gradually increased up to approximately 100 °C. The malt
 is stabilized by reducing the moisture content of the green malt to about 3 - 6.5%
 that also helps to safely store the malt. The kilning process generally takes about a

5 The assumption is made that all of the electricity that is used is imported and all the natural gas use is

combusted (direct-fire) to produce heat and not used for electricity production. Therefore, from a malting
perspective, electricity can be considered a primary energy source.

PBL TNO | 10 – A MIDDEN report
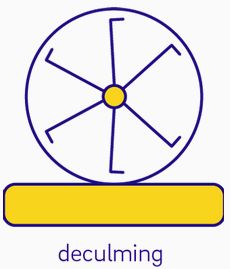
day. This step covers approximately 58% of the total electricity use and 99.8% of
 the natural gas use and in total 93.8% of the total primary energy use in maltings.

 5. De-culming
 In the final stage, the rootlets of the malt (called culms) are removed and sold as
 animal feed. This step also only needs electricity and uses approximately 4% of the
 total electricity consumption and in total 0.6% of the total primary energy use in
 maltings.

 Source pictures above: (Euromalt, n.d.)

Below, a schematic overview of the production process is presented.

Figure 4. Production of malt

1.3 Energy consumption of Dutch EU ETS maltings
As described in the previous paragraph, 99.8% of the natural gas is used for heating in the
kilning process which leaves 0.2% of natural gas to be used in processing the raw barley for
drying in the first stage of the malt house. Alongside, approximately 58% of the total
electricity consumption is consumed in the kilning process. What becomes clear therefore, is
that the kilning process is undoubtedly the most energy intensive step in the malt house.

 A MIDDEN report – PBL TNO | 11
The total energy use of the Holland Malt Lieshout malting 6 in 2019 is estimated to be 241 TJ 7
and the total energy use of the Holland Malt Eemshaven malting was 707 TJ respectively
(Royal Swinkels Family Brewers Holding N.V., 2020a). Considering the malt production
values of 2019 (121,229 tonne at the Lieshout malting and 280,000 tonne at the Eemshaven
malting), the specific energy consumption (SEC) in 2019 is estimated to be 553 kWh/tonne
malt (1,990 MJ/tonne) at the Lieshout malting and 701 kWh/tonne malt (2,525 MJ/tonne) at
the Eemshaven malting.

Comparison with abroad
The malt house of the Danish Malting Group (DMG) in Denmark, that has a comparable
production capacity (115 – 125 kt malt/yr) as the Holland Malt Lieshout malting, claims to be
one of the most energy efficient maltings in the world (Danish Energy Agency, 2015). The
electricity consumption has been reduced from 145 kWh/tonne of malt in 1997 to 83
kWh/tonne of malt (299 MJ/tonne malt) in 2014 and the heat consumption has been reduced
from 820 kWh/tonne of malt to 571 kWh/tonne of malt (2,056 MJ/tonne malt) 8.

In 2011, Carbon Trust (a not for dividend private research company in the UK) analysed the
UK’s malting sector (Carbon Trust, 2011a). The study covered 27 malting sites in the UK
which had a combined production of 1.5 million tonnes (1,500 kt) of malt in 2008/2009.
They calculated a weighted average SEC of 961 kWh/tonne of malt (3,460 MJ/tonne of malt)
with a relatively large range (between 800 and 1400 kWh/tonne) between the sites. Note
however, that this data is now approximately 10 years old and it is highly probable that the
average SEC is currently lower.

Considering the former mentioned data on SEC’s at other breweries (abroad), it becomes
clear that both of the Holland Malt maltings, and especially the Lieshout malting, could be
considered a facility with relatively low SEC’s.

1.4 CO2 emissions of Dutch EU ETS maltings
The total scope 1 emissions, related to the emissions at the production site only, for Holland
Malt Eemshaven are provided by NEa (2020) and amount to 32,294 tonnes CO2 in 2019 (=
119 kg CO2/tonne malt). The total scope 1 emissions for Holland Malt Lieshout were provided
by Holland Malt (personal communication) since the NEa only provides scope 1 emissions for
location Lieshout as a whole (including production of beer, malt and soda drinks). The CO2
emissions related to the production of malt only were estimated to be 12,828 tonnes CO2 (=
106 kg CO2/tonne malt) in 2019. The main reason why Lieshout has a smaller carbon
emission intensity could be due to recent decarbonising measures that were implemented on
the site and due to the fact that this malting has scaling and infrastructure advantages
compared to the Eemshaven malting, since it is on the same site as the Bavaria brewery.

6 This malting uses electricity and heat from the utilities at the Lieshout site (see Table 1). Since Royal Swinkels

does not clarify in their annual report whether the reported total energy use is final or primary energy use, we
assume that the electricity is ‘imported’ and the heat originates from the direct combustion of natural gas.
7 A total energy consumption of 673.5 TJ in 2016 at the Lieshout site, excluding Holland Malt, is reported in the

annual report of 2017. The reported energy consumption at the Lieshout site in 2017 was 914.7 TJ and includes
Holland Malt. Assuming that there were no significant changes in the energy consumption at the Lieshout site
between 2016 and 2017, the difference is assumed to be the energy use at Holland Malt Lieshout. This 2017
number is probably similar to the 2019 number since there was no change in malting capacity during these
years.
8 Note that the majority of the reduction of the electricity consumption per tonne of malt took place between

1997 and 2004 and has been relatively stable after that. The heat consumption per tonne of malt seems to
stabilize after 2010. The volatility of the average energy consumption per tonne of malt after the stabilisation is
most likely related to the differences in climate each year.

PBL TNO | 12 – A MIDDEN report
Compared with the energy efficient malt house of the Danish Malting Group (DMG) in
Denmark (see previous paragraph), which has a carbon intensity of 129 kg CO2 per tonne of
malt, the Dutch EU ETS maltings have a relatively low carbon intensity (Danish Energy
Agency, 2015).

Scope 2 emissions could not be provided since no data was available on the amount of
electricity that is used from the grid.

1.5 Malting products and use
Malt, the main product of maltings, is mainly produced for the breweries and distilleries.
Since malt is produced from raw barley, the price of barley is the main determinant for the
market price of malt. The price of malt also depends on the type of malt produced, but
pilsner malt is the default. The following components determine the market price for malt
(Carbon Trust, 2011a):
 • Costs of raw barley (40-60% of price of malt)
 • Costs of energy (6-15% of price of malt)
 • Added value/mark-up (investments, labour costs, profit margin etc,) (about 40% of
 price of malt).

In Table 3 the market price ranges of the input and output products of the maltings are
presented.

Table 3. Input and output products of maltings and (market) price ranges

 Products Price Country Source Comment
 (€/tonne)
 Input
 Raw 185 Netherlands (Nieuwe Oogst, Market prices (week 52,
 Barley 2020) 2020) established at two
 different markets: in
 Groningen and Middenmeer
 199 EU-27 (European Average monthly price of
 Commission, November 2020 for the
 2020) current composition of 27 EU
 Member States
 Output
 Malt (not 468* (Statista, Average sales price of malt
 roasted) 2020) in 2019 in €2020 per ton
 manufactured in the United
 Kingdom**
 Waste 150 – 200 (Van Iersel, Also in line with Carbon
 grain (avg.: 175) 2018) Trust (2011a): 125
 (culms) £2011/tonne is approximately
 162 €2019/tonne***
* Calculated with an exchange rate of 1 GBP = €2020 1.125. Source: https://www.ofx.com/en-au/forex-
 news/historical-exchange-rates/yearly-average-rates/.
** In the UK the sales prices for malt varied from 2008 to 2019 between 325 euro2020/tonne in 2010 to as high as 468
 euro2020 per tonne in 2019, with an average price of 392 euro2020/tonne in the period between 2009 and 2019.
*** Taking into account an exchange rate of 1 GBP2011 = €2011 1.15258 and an inflation rate of the Euro of 2% per year
 from 2011 to 2019.

 A MIDDEN report – PBL TNO | 13
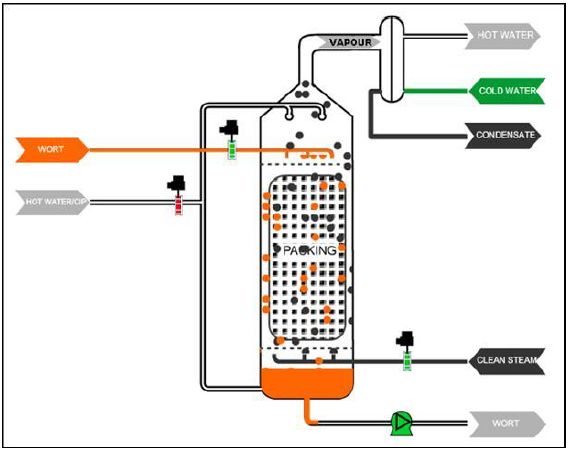
Raw barley can be bought in the Netherlands or abroad. There are different kinds of barley
that can be cultivated; the maltings mostly require specialized malting barley. Of the
approximately 30,000 hectares of barley that is cultivated in 2019 in the Netherlands, an
average of about 50 percent is malting barley (Nieuwe Oogst, 2019). Malting barley is mainly
cultivated in the northern parts of the Netherlands. However, Holland Malt imports raw
barley from abroad as well, since Dutch barley is not enough to cover the production volume
of Holland Malt. Large volumes of raw malting barley is therefore imported from, among
others, Sweden, Denmark and France.

The market for malt and barley decreased in 2020 due to the COVID-19 crisis, since demand
for beer fell (Inside Beer, 2020). Market experts say that due to this, farmers and maltings
will probably sell their surplus as animal feed during this season, which could mean a
shortage of malt and barley in the long run.

According to Holland Malt, approximately 530 kt of barley is needed to produce their
maximum yearly output of around 400 kt of malt, which means that there is a certain
amount of waste products (for instance culms). Culms are highly valued by maltings since it
can be sold as animal feed. It is not accurate to state that there will be as much culms as the
difference between input and output (considering for instance that the barley input has a
higher moist percentage than the malt output), but a certain amount of waste-product is left
over to be re-used or sold. According to Holland Malt, this adds up to about 13 kt of waste-
products per year.

Furthermore, water is used at the maltings, mainly during the steeping process. The Holland
Malt breweries used 3.25 m3 of water per tonne malt (average of the two maltings) in 2019
(Royal Swinkels Family Brewers Holding N.V., 2020a). Most of the used water will flow off to
the wastewater treatment.

1.6 Mass and energy balance
For the mass and energy balance we assumed for the energy consumption the average of
the SEC’s of the two maltings: 627 kWh/tonne of malt (electricity + heat). A schematic
overview of the malting process is presented in Figure 5. As displayed in the figure, it is
assumed that the needed heat is produced by either a combined heat and power installation
(CHP), by bio-CHP(s), by a natural gas boiler, or by direct combustion of heat, since this is
different at the two breweries.

PBL TNO | 14 – A MIDDEN report
Figure 5. Mass and energy balance of malt production in Dutch EU ETS maltings

 A MIDDEN report – PBL TNO | 15
2 Beer production in
the Netherlands
2.1.1 Breweries in the Netherlands
In 2017, around 370 breweries were active in the Netherlands (CBS, 2017). In 2017, the
total production volume in the Netherlands was roughly 27 million hectolitres (hl) 9 and the
Netherlands was, with a production value of 2.5 billion euros, the fifth largest beer producer
in Europe (CBS, 2018b).

Four of the 370 breweries are currently part of the EU ETS. These four breweries produced
approximately 25 million hectolitres in 2019 10 and are therefore responsible for more
than 90% of the total Dutch production volume yearly. The four EU ETS breweries were
responsible for approximately 93,196 tonnes of CO2 in 2019, which is approximately 0.1% of
the total Dutch EU ETS CO2 emissions (NEa, 2020). The Dutch breweries belong to the top
10% most energy and water efficient breweries worldwide (RVO, 2016). Nonetheless,
reducing CO2 emissions in this sector is one of the main challenges and ambitions of the
breweries for the coming decade(s). The main reasons to drive down CO2 emissions are:
increasing energy prices, concerns about security of energy supply, and (more stringent)
climate change legislation (Andrews, et al., 2011). Most of the EU ETS breweries currently in
the Netherlands have the ambition to become climate neutral before 2030.

Background information and plant characteristics of all the breweries are presented in the
following paragraphs.

2.1.2 Heineken Zoeterwoude
Heineken beer was originally founded in Amsterdam by Gerard Adriaan Heineken (Heineken,
n.d.). In 1867, a new brewery opened in Amsterdam followed by another brewery Rotterdam
in 1873. After the opening in 1975 of Heinekens’ largest Brewery in the Netherlands in
Zoeterwoude, the breweries in Amsterdam and Rotterdam closed down. Since 2017, the
production volume of Heineken Zoeterwoude is approximately 10.4 million hl (Kempers,
2018). The brewery in Zoeterwoude is orientated towards large production volumes, and the
majority of the production volume is exported to the Americas and Asia.

Table 4. Company characteristics of Heineken Zoeterwoude

 Value Source
 Company Name (NEa) Heineken Nederland B.V., brouwerij (NEa, 2020)
 Zoeterwoude
 Subsector (SBI) 11.05 (CBS, 2018a)
 Corporate Group Heineken Global (NEa, 2020)
 Address Burgemeester Smeetsweg 1, (Heineken, n.d.)
 Zoeterwoude
 Permit number (NEa) NL-200400202 (NEa, 2020)

9 1 hectolitre (hl) = 100 litre
10 This is the total production volume calculated when the 2019 production volumes of each individual EU ETS
 brewery, as presented in the tables in the following paragraphs, are added.

PBL TNO | 16 – A MIDDEN report
Value Source
 Year of Construction 1975 (Heineken, n.d.)
 Employment (fte) 500 (Kempers, 2018)
 Website https://www.heinekennederland.nl
 Production capacity Unknown
 (hl/yr)
 Production (2017) (hl) 10.4 million (Kempers, 2018)
 CO2-emissions (scope 38,855 (NEa, 2020)
 1) in 2019 (tonne)
 Main heat production Combined Heat and Power (CHP) Personal Communication
 unit(s)
 Characteristics heat 180 °C, 10 bar (saturated steam) Personal Communication

2.1.3 Heineken Den Bosch
Amongst the breweries that are currently in operation in the Netherlands, the Heineken-
brewery in Den Bosch - that became operational in 1958 - is the oldest. Between 1995 and
2005, the brewhouse has been renovated and in 2017 the production volume was
approximately 6.2 million hl.

Table 5. Company characteristics of Heineken Den Bosch

 Value Source
 Company Name Heineken Nederland B.V., locatie (NEa, 2020)
 (NEa) Den Bosch
 Subsector (SBI) 11.05 (CBS, 2018a)
 Corporate Group Heineken Global (NEa, 2020)
 Address Rietveldenweg 25 (Heineken, n.d.)
 Permit number (NEa) NL-200400227 (NEa, 2020)
 Year of Construction 1958 (Heineken, n.d.)
 Employment (fte) 400 (Kempers, 2018)
 Website https://www.heinekennederland.nl
 Production capacity Unknown
 (hl/yr)
 Production (2017) 6.2 million (Kempers, 2018)
 (hl)
 CO2-emissions (scope 15,428 (NEa, 2020)
 1) in 2019 (tonne)
 Main heat production Combined Heat and Power (CHP) Personal Communication
 unit(s) installation
 Characteristics heat 180 °C, 10 bar (saturated steam) Personal Communication
 production unit

2.1.4 Grolsch
The Grolsch brewery in Enschede, the latest installed brewery amongst the four EU ETS
breweries, started its operations in 2004 in Usselo (municipality of Enschede) and closed
down the other two older breweries in Enschede and Groenlo (Grolsch, n.d.). Grolsch is
currently part of Asahi-group, that took over the company from SABMiller in 2016. In 2019,
Grolsch sold approximately 2.8 million hl of beer which resulted in a 13% Dutch market
share in that year (Royal Grolsch, 2020a).

 A MIDDEN report – PBL TNO | 17
Table 6. Company characteristics of Grolsch

 Value Source
 Company Name Grolsche Bierbrouwerij Nederland (NEa, 2020)
 (NEa) BV
 Subsector (SBI) 11.05 (CBS, 2018a)
 Corporate Group Asahi Group (NEa, 2020)
 Address Brouwerslaan 1 (Grolsch, n.d.)
 Permit number (NEa) NL-200500081 (NEa, 2020)
 Year of Construction 2005 (Grolsch, n.d.)
 Employment (fte) 702 11 (Royal Grolsch, 2020a)
 Website https://www.grolsch.nl/
 Production capacity Unknown
 (hl/yr)
 Production (2020) 2.8 million (Royal Grolsch, 2020a)
 (hl)
 CO2-emissions (scope 7,556 (NEa, 2020)
 1) in 2019 (tonne)
 Main heat production Unknown
 unit(s)
 Characteristics heat 170 °C, 6 bar (saturated steam) (Royal Grolsch, 2020b)
 production unit 105 °C, 6 bar (hot water)

2.1.5 Bavaria
Since 1773, the Bavaria-brewery is owned by the Swinkels family. The name ‘Bavaria’ refers
to a type of beer originating from the German federal state ‘Bayern’ – or, Bavaria in English
(BHIC, 2011). This beer-type is bottom-fermented, and is often also referred to as ‘pilsner’.
In 1934, the brewery in Lieshout started its operations. This facility is currently the largest
brewery of Bavaria with a production volume of approximately 5.3 million hl per year (Royal
Swinkels Family Breweries N.V., 2021).

Table 7. Company characteristics of the Bavaria brewery

 Value Source
 Company Name (NEa) Bavaria N.V. (NEa, 2020)
 Subsector (SBI) 11.05 (CBS, 2018a)
 Corporate Group Royal Swinkels Family Breweries (NEa, 2020)
 N.V.
 Address De Stater 1, 5737 RV, Lieshout Company website
 Permit number (NEa) NL-200400297 (NEa, 2020)
 Year of Construction 1934 Company website
 Employment (fte)* 793 (Royal Swinkels Family
 Brewers Holding N.V.,
 2020a)
 Website www.bavaria.com
 Production capacity Unknown
 (hl/yr)
 Production 2019 (hl) 5.3 million (Royal Swinkels Family
 Breweries N.V., 2021)

11 This is direct employment, though not exclusively related to the beer production process

PBL TNO | 18 – A MIDDEN report
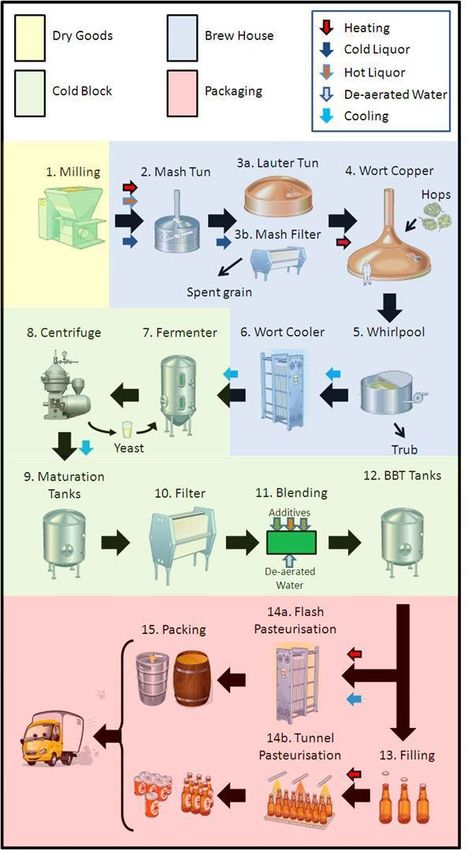
Value Source
 CO2 emissions (scope 31,357** (Royal Swinkels Family
 1) in 2019 (tonne) Breweries N.V., 2021)
 Main heat production Gas-fired CHP(‘s) (Royal Swinkels Family
 unit(s)* Gas-fired boiler(s) Breweries N.V., 2021)
 CHP biogas motor(s) (BGG’s)
 Waste heat buffer(s)
 Characteristics heat* Steam: 180 °C, 10 barg (Royal Swinkels Family
 Hot water: 95 °C Breweries N.V., 2021)
* Value(s) for the whole Royal Swinkels Lieshout location.
** The total CO2 emissions (scope 1) of the Lieshout location amount to approximately 47 kt (47,289 ton, (NEa,
 2020)), of which 12,828 ton CO2 can be allocated to the malting processes and 31,357 ton CO2 to the brewing
 processes according to Royal Swinkels (Royal Swinkels Family Breweries N.V., 2021). Which leaves approximately
 3.1 kton CO2 that is allocated to other activities like soda production.

2.2 Production of beer in general
The following subsections describe how beer is generally produced, providing an overview of
the main process inputs and outputs. Also, the processes that consume energy and lead to
direct CO2 emissions are discussed. Furthermore, the best practices in brewing are depicted.

2.2.1 Production process of beer
The processes of brewing have remained largely unchanged in the last few decades
(Andrews, et al., 2011). The brewing industry and brewing process are characterized by
several batch-type operations, where raw materials are converted into a final product
(Olajire, 2012). An illustration of the brewing process, from malt to a bottled beer, is given in
Figure 6.

Four different overall stages can be found in the beer brewing process. Starting with the first
phase, which is the dry phase, where malted barley arrives at the brewery and is milled;
milling is the crushing of malt to ensure a high yield of extracted substances in the next
steps of the beer production process (Galitsky, Martin, Worrel, & Lehman, 2003). The dry
phase uses very little electrical energy and no thermal energy. This phase is often
aggregated to the brewhouse phase.

The second phase is the brewhouse phase where large amounts of steam is needed for
heating and boiling purposes. The first step is mixing and heating the milled malt with water.
Enzymes in the mash break, due to the heating (approximately 70 °C), starch into sugars
such as maltose. When this process is finished, this sweet substance is called (sweet) wort
(Galitsky, Martin, Worrel, & Lehman, 2003). Consequently, the wort and the grains present
in the wort need to be separated; a mash filter is used to separate the wort into filtered wort
and spent grains. Next, the filtered wort needs to be boiled (using steam). Conventional
atmospheric boiling takes up to one and a half hours with an evaporation rate between 8 –
12% (Willaert & Baron, 2004). During the boiling, hops are added for bitterness and better
taste. Currently, major brewers even reduced the evaporation rate from 7-8% to 4-5%
(Andrews, et al., 2011). The vapours contain 99% water and up to 160 organic constituents
from hops and malt (Willaert & Baron, 2004). If the vapour with these volatiles (unwanted
flavour components) is allowed to leave the chimney, odour pollution is caused (Willaert &
Baron, 2004). In summary, wort boiling serves the following purposes: wort sterilisation,
wort concentration, wort stabilisation, hop isomerisation and volatile removal (Hardwick,
1994; Andrews, et al., 2011). Furthermore, metal ions, tannin substances and lipids form

 A MIDDEN report – PBL TNO | 19
insoluble complexes, and the soluble substances from the hops are extracted. The boiled
wort is then clarified (to ensure efficient fermentation) using a whirlpool (Olajire, 2012).

The third phase is the cold phase; this phase starts with the cooling of the wort, to achieve
fermentation temperature (Hardwick, 1994). In most modern breweries, the heat that is
extracted during cooling is used to pre-heat other processes in the brewery. Then
fermentation starts when yeast is added to convert the sugars into alcohol and carbon
dioxide. Fermentation takes up a few days for ales and up to 10 days for lagers (Sorrell, et
al., 2000; Carbon Trust, 2011b). Fermentation generates significant heat that must be
dissipated to avoid yeast damaging (Galitsky, Martin, Worrel, & Lehman, 2003). A centrifuge
is used to remove the yeast. Now, the beer is sent to maturation tanks and held at a
conditioning temperature of -1 to 10 °C for several days to over a month (Carbon Trust,
2011b). Then, a filter is used to remove any proteins and the beer is sent to the bright, or
filtered, beer tanks (Carbon Trust, 2011b). This third phase needs a lot of electricity for
cooling and this whole step takes up to two to three weeks (Olajire, 2012).

After maturation and stabilization, the last phase starts, which is the packaging phase.
Depending on the packaging type and/or bottling line, beer is either first pasteurised and
then packed, or first bottled and then pasteurised. Thermal energy (steam or hot water) is
needed to pasteurise the product. During pasteurisation, beer is heated to approximately 60
°C (Galitsky, Martin, Worrel, & Lehman, 2003). The aim is to remove all remaining harmful
bacteria and stop all yeast activity in the beer.

PBL TNO | 20 – A MIDDEN report
Figure 6: Brewing process diagram. Source: (Carbon Trust, 2011b)

2.2.2 Energy consumption
Energy consumption of breweries can be divided into two different forms; electrical and
thermal energy. Thermal energy (at the most breweries in the form of steam, but at some
modern breweries hot water could also be used as medium for some processes) is mostly
generated in a boiler house or in a combined heat and power (CHP) plant using (natural)
gas. This thermal energy is used for wort boiling and water heating in the brewhouse and the
packaging hall (Olajire, 2012). The combustion of the natural gas in the boiler house or CHP
causes CO2 emissions. Although most breweries also use the biogas that is produced in de
the wastewater treatment plant, large amounts of natural gas is being used to create heat at
the four EU ETS breweries. Electrical energy is either bought from the grid or generated on-
site with a CHP plant, or in some cases also with solar panels or wind turbines (Carbon Trust,
2011b; European Commission, 2006). Energy costs range between 3 – 8% of total
production costs, therefore efficient energy use has become a major factor in the profitability

 A MIDDEN report – PBL TNO | 21
of a brewery, depending on location, size and other variables (Olajire, 2012) (Xhagolli &
Marku, 2014).

Various literature on energy use in beer production is available worldwide. Different specific
energy consumption (SEC) values are summarised in Table 8. The different studies all focus
on large breweries in either Europe or the United States of America.

Table 8. SEC in beer production (in MJ per hl) according to various sources

 Source SEC Thermal energy Electrical energy
 (in MJ/hl) (in MJ/hl) (in MJ/hl)
 (Sorrell, et al., 2000) 163 Not specified Not specified
 (Galitsky, Martin, 300* Not specified Not specified
 Worrel, & Lehman,
 2003)

 (Scheller, Michel, & 169.2 – 187.2 129.6 – 144 39.6 – 43.2
 Funk, 2008)**
 (Carbon Trust, 135 Not specified Not specified
 2011b)
 (Olajire, 2012) 155 110 45

 (Xhagolli & Marku, 178.8 – 243.2 150 – 200 28.8 – 43.2
 2014)
 (Giner Santonja, 72 – 180*** Not specified Not specified
 Karlis, Stubdrup,
 Brinkmann, &
 Roudier, 2019)
* Value is an approximation since it is derived from a graph. Furthermore the original value is presented in
 kBtu/barrel and is therefore converted to MJ/hl.
** Value converted from kWh/hl to MJ/hl by multiplying with 3.6
*** Original value: 0.02 MWh/hl – 0.05 MWh/hl, data from different breweries between the years 2012 and 2014.

The two most energy-intensive steps in the brewhouse are mashing and wort boiling
(Scheller, Michel, & Funk, 2008; Olajire, 2012; Giner Santonja, Karlis, Stubdrup, Brinkmann,
& Roudier, 2019). In both steps a lot of steam is used for heating. These two processes
account for approximately 50% of steam use (Sorrell, et al., 2000; Willaert & Baron, 2004).
Wort boiling is identified as the single most energy-intensive step in the whole beer
producing process (Galitsky, Martin, Worrel, & Lehman, 2003; Kunze, 2004; Willaert &
Baron, 2004). Wort boiling accounts for 20 – 40% of all thermal energy utilised in a brewery
(Andrews, et al., 2011).

Energy consumption reduction targets have led to a plethora of approaches to reducing the
energy needed for wort boiling, such as a reduction in the evaporation of water (which
accounts for up to 60% of the total energy used in wort boiling) (Andrews, et al., 2011).
Alternative systems are even developed to remove the volatiles under vacuum, or by steam
stripping instead of evaporation, leading to equal volatile reductions combined with lower
energy inputs (Andrews, et al., 2011).

The packaging-phase can also be a large user of thermal energy, mainly for pasteurisation
and washing of returnable containers, such as kegs or casks (or even bottles, especially in
the Netherlands with our national deposit system on glass bottles). The packaging mix
impacts the SEC as small packs are known to be more energy intensive than larger volume
packs such as kegs (Carbon Trust, 2011b). When looking at returnable bottles, the bottle
washer and pasteurisation are the most energy-intensive. With non-returnable bottles,
pasteurisation is usually the largest energy consumer in the packaging-phase (Muster-

PBL TNO | 22 – A MIDDEN report
Slawitsch, Weiss, Schnitzer, & Brunner, 2011). According to Sorrell et al., there is a large
range between different types of packaging:

“The SEC for fuel use in packaging can vary from as little as 4 MJ/hl for bulk tanks to 170
MJ/hl for bottles. The fuel use for packaging in kegs, cans, PETs and retail tanks is similar at
around 30 MJ/hl. The big fuel user is packaging in bottles.” - (Sorrell, et al., 2000, p. 21)

In Table 9, an overview is given of the heat consumption values at different brewery
department or processes.

Table 9. Heat consumption (in MJ/hl beer) for different brewery
departments/processes (Giner Santonja, Karlis, Stubdrup, Brinkmann, & Roudier,
2019, pp. 306, table 4.1).

 Department/process Minimum Mean Maximum Literature* Measured*
 *
 Brewhouse 87 92 121 84 - 113 50 - 80
 Bottling installation 58 86 94 25 - 46 38 - 58
 Kegging installation 8 11 13 8 - 13 N/A
 Process water 3 4 8 4-8 N/A
 Service water N/A N/A N/A 8 - 17 N/A
 Miscellaneous N/A N/A N/A 33 - 46 95
 Total 156 193 236 162 - 243 183 - 233
* 20,000 to 500,000 hl beer sold/yr
** 300,000 to 500,000 hl beer sold/yr
 N/A = no information provided

Most important electricity consumption processes are refrigeration (44%), packaging
(20%) and compressed air (10%) (Scheller, Michel, & Funk, 2008). Furthermore, there are
a lot of small electricity consumers like pumps, ventilators, drives and lighting. Electricity is
of less importance during this research, as the focus is on direct on-site emissions (scope 1).
However, for a fully decarbonised industry also the indirect emissions from electricity
generation should be mitigated.

Considering what has been reported in literature, two main issues are important to keep in
mind:
 1. The first phase of the production process, milling, does not require significant
 amounts of energy. Brewhouse and packaging both use large amounts of thermal
 energy. The cold-phase uses large amounts of electrical energy.
 2. The SEC-values found in the literature differ notably (they range between 112 – 300
 MJ/hl).

2.2.3 CO2 emissions
Carbon Trust (2011a) computed a CO2 breakdown for a typical 2-million hectolitre brewery
(comparable to the size of the Grolsch brewery). The two main contributors to CO2
emissions, as can be seen in Figure 7, are the brewhouse and packaging phase. This follows
from the fact that during these two phases, the most energy is used.

 A MIDDEN report – PBL TNO | 23
Figure 7. CO2 breakdown from a typical 2-million hl brewery (Carbon Trust, 2011a,
p 11)

2.2.4 Best practices
According to the Reference Document on Best Available Techniques (BAT), or in short the
BREF document, for the food, drink and milk industries of the European Commission, the BAT
benchmark minimum SEC for beer production is 0.02 MWh/hl of products (72 MJ/hl) (Giner
Santonja, Karlis, Stubdrup, Brinkmann, & Roudier, 2019). Scheller et al. researched efficient
use of energy in the brewhouse (Scheller, Michel, & Funk, 2008). The most efficient brewery
they assessed was a 2.8 million hectolitre brewery in Germany (in size this brewery is
comparable to the Grolsch brewery). This brewery needs 54 MJ/hl of thermal energy and
16.2 MJ/hl electrical energy, which adds up to a total SEC of 70.2 MJ/hl. This brewery uses
an efficient internal boiler and recovers waste heat through condensation (both explained in
the chapter 3), consequently using this as process energy for the heating of wort. However,
this brewery only delivers beer in barrels, which is one of the least demanding packaging
materials in terms of thermal energy. Energy consumption and related CO2 emissions of
breweries is heavily depending on production volume, pack mix (cans, kegs, tank containers
etc.) as well as the number of different beers (SKU number) that are produced.

Muster-Slawitsch et al. developed the “Green Brewery Concept tool”, and focused on small-
(20.000 – 50.000 hl/year) and medium-sized (800.000 – 1.000.000 hl/year) breweries
(Muster-Slawitsch, Weiss, Schnitzer, & Brunner, 2011). The minimal thermal energy demand
is highest for the brewhouse, ranging from 20 – 25 MJ/hl. One of the breweries also filled
returnable bottles and had, after all the optimisation measures (such as biogas, from both
wastewater and spent grains), a remaining final thermal energy demand of 37 MJ/hl. When
using a CO2-emission factor of 56.6 kg/GJ for natural gas 12, 37 MJ/hl (with an estimated
boiler efficiency of 95%), would result in:

 (0.0566 CO2/ ∗ 37 ) / 95% = 2.18 2 ℎ .

12 (Blok & Nieuwlaar, 2016)

PBL TNO | 24 – A MIDDEN report
2.3 Energy consumption of the four EU ETS breweries
The Netherlands Enterprise Agency (RVO) published a report on the energy use of the large
Dutch breweries, also including Heineken’s Brand brewery in Wijlre (RVO, 2016). The
breweries realised a process efficiency improvement of 13.0% between 2009 and 2015. 43%
of this improvement was realised along the production chain, and 57% was realised via
sustainable energy. In 2015, the breweries’ realised primary energy use was 3,266 TJ which
was 0.8% lower compared to 2014 while production volumes remained about the same 13.
This is partially due to adaptations and optimization of cooling systems and a different way of
lagering, which resulted in a reduction of 19 TJ in the process.

When correcting for the Brand brewery in Wijlre (which is not an EU ETS brewery), based on
its share in the total production volume of the five breweries 14, approximately 3,200 TJ of
primary energy (natural gas use at the sites plus electricity and heat imported from
external locations) 15 was consumed at the four EU ETS locations in 2015. Of this 3,200 TJ,
66% (2,112 TJ) can be attributed to the combustion of natural gas 16.

The Dutch EU ETS breweries present in their annual reports some information regarding the
SEC of their operations (see Table 10). However, it is not always clear how these values
were exactly determined, which makes it difficult to compare them. It is for example not
clear whether the SEC is expressed in terms of primary or final energy use and whether the
energy consumption from all process steps are included or not. Bavaria’s value is aggregated
and is a weighted average of their breweries in Lieshout, Berkel-Enschot, Bodegraven,
Rodenbach (Belgium) and Debre Birhan (Ethiopia) (Swinkels Family Brewers Holding N.V.,
2019). The value Heineken gives is the average of the breweries in Zoeterwoude, Den Bosch
and the Brand-brewery in Wijlre (part of Heineken-group) (Heineken Nederland, 2016).
Furthermore, these values do not specify which forms of energy are used during production
and do not describe which parts of the production process are using the most energy.
According to TNO expert Anton Wemmers (interview, 2018), the energy intensities of the
four production locations should be quite comparable. Hence, we will assume the average of
the breweries to be representative for all sites.

Table 10. Specific energy consumptions as stated by the Dutch EU ETS breweries.
Note that it is unclear whether the provided SEC-value represent primary or final
energy use.

 Company Specific energy Source
 consumption (SEC)
 Heineken Netherlands 76 MJ/hl in 2015* (Heineken Nederland, 2016)
 Supply
 Grolsch 84 MJ/hl in 2019 (Royal Grolsch, 2021)
 Swinkels Family 128 MJ/hl in 2019** (Royal Swinkels Family Brewers
 Brewers Holding N.V., 2020a)
 Average 96 MJ/hl
* Average of location in Zoeterwoude, Den Bosch and Wijlre. Later data than 2015 was not available.
** Weighted average of their breweries in Lieshout, Berkel-Enschot, Bodegraven, Rodenbach (Belgium) and
 Debre Birhan (Ethiopia)

13
 Note that in this report, RVO counts electricity (which was approximately 35% of the total primary energy
use presented) as a primary energy source, while in scientific literature electricity is considered a secondary
energy carrier.
14 With the help of (Kempers, 2018)
15 RVO refers to primary energy use and does not clarify where the used electricity comes from. Therefore, the

assumption is made that the ‘electricity use’ figure is electricity that is imported and could therefore, from a
brewery perspective, be counted as a primary energy source since
16 It is not stated whether this is the HHV or LHV value, but since mostly steam is generated at the breweries

we assume LHV.

 A MIDDEN report – PBL TNO | 25
When comparing the SEC-values that are found in the literature (see Table 8) with the SEC
values as mentioned by the breweries Table 10, the conclusion can be made that the SECs
mentioned by the breweries are significantly lower than those that were found in the
literature. The Dutch EU ETS breweries even approach the best practice-values.

To further investigate the robustness of the SEC-numbers that has been published by the
companies, an interview has been conducted in 2017 with industry expert Anton Wemmers
of TNO. Wemmers researched the large Dutch breweries extensively during his career,
focusing on the application of heat pumps, heat integration and overall energy reductions.
Anton Wemmers examined different data sets he gathered during his different researches
and provided this research with some relevant data (see Table 11). In this table, the energy
use per hectolitre for large Dutch breweries, in an optimal situation with a normal packaging
mix, is presented. Furthermore, Table 11 describes the total energy demand per hectolitre
beer, divided in thermal and electrical energy and also further differentiated in the different
steps of the production process. All four breweries confirmed the values depicted in Table 11.
Relatively small differences occur between locations.

Table 11. SEC per phase for Dutch EU ETS breweries according to Anton Wemmers
(TNO)

 Energy intensity per phase for Dutch EU ETS breweries according to TNO

 MJ(th or e) % % total
 /hl thermal energy
 demand

 Thermal energy use per process
 Brewing (phase 2) 20 38.5% 27.7%
 Fermenting (phase 3) 0 0.0% 0.0%
 Packaging (phase 4) 20 38.5% 27.7% Depends on packaging
 mix (tunnel pasteurisation
 has a significant heat
 demand)
 Other 12 23.0% 16.3% Heat for buildings,
 cleaning water, usage CHP
 Total thermal energy 52 100.0% 70.7%
 use

 Electricity use per process
 Brewing (phase 2) 3.6 16.7% 4.9%
 Fermenting (phase 3) 10.8 50.0% 14.7% Cooling for 80% allocated
 to fermentation
 Packaging (phase 4) 5.4 25.0% 7.3%
 Other 1.8 8.3% 2.4%
 Total electricity use 21.6 100.0% 29.3%

 Total 73.6 100%

Table 11 also shows much lower SEC-values than the available literature. The phases
brewing and packaging are still the two dominant users of thermal energy, both use

PBL TNO | 26 – A MIDDEN report
approximately 38.5% (thus 77% in total). The milling phase (phase 1) is not included, as it
is not significant in terms of energy use. Mashing and wort boiling are the two most thermal
energy-intensive steps in the brewhouse. According to Anton Wemmers, the type of
packaging, method of pasteurisation and the type of packaging line have a significant
influence on the SEC. The proportion between brewhouse and packaging can even be 65%
(brewing) and 27% (packaging) for less energy-intensive packaging materials and operating
lines. In particular, if cans and bottles are pasteurised using tunnel pasteurisation, the
packaging material needs also to be heated during pasteurisation, which leads to increased
heat demand.

When taking into account the known production capacities of the breweries, we can calculate
the total maximum thermal and electrical energy consumption per brewery, based on the
calculations of Anton Wemmers. These results are presented in Table 12. It shows that the
total estimated energy use of the breweries combined is approximately 1,818 TJ, which is
considerably higher than that reported by RVO (2016): 3,200 TJ of primary energy in 2015.
This difference could partially be explained by the fact that RVO reported the total primary
energy and not the total actual heat and electricity consumed by the breweries. Furthermore,
the RVO data (beer production value and energy consumption data) is considerably older
than the data of Anton Wemmers and the current production values.

Table 12. Energy consumption per brewery based on the calculations of Anton
Wemmers and the most up to date production values

 Brewery Assumed Estimated Estimated Estimated
 yearly thermal electrical total
 production energy use energy use energy use
 (hl) (TJth) (TJe) (TJ)
 Heineken ZW 10,400,000 541 225 765
 Heineken DB 6,200,000 322 134 456
 Grolsch 2,800,000 146 60 206
 Bavaria Lieshout 5,300,000 276 114 390
 Total 24,700,000 1,284 534 1,818

2.4 Brewery products and use
2.4.1 Input
The main raw materials that serve as an input for the production of beer are malt, hops,
yeast and water. Mostly, malt is imported from another company, like Holland Malt and not
produced on the same site with the exception of the Lieshout site (since Bavaria and Holland
Malt belong to the same holding; Royal Swinkels). Table 13 presents the inputs that are
necessary for 1 hl beer, based on a brewery with an annual production capacity of 400,000
hl (FAO, 2009). However, note that this data is relatively old and for most breweries, the raw
input material per hl of beer is much lower currently.

 A MIDDEN report – PBL TNO | 27
You can also read