Saving windows, saving Money: evaluating the energy Performance of window retrofit and replacement
←
→
Page content transcription
If your browser does not render page correctly, please read the page content below

Saving Windows, Saving Money:
Evaluating the Energy Performance of
Window Retrofit and Replacement
A Report by:      funded by:   In Partnership with:

                                                         ECOTOPE
                                                        Consulting
                                                       Research
                                                      Design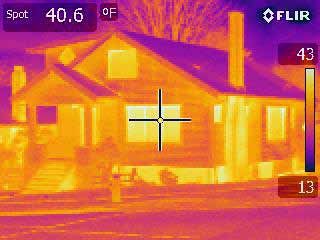
RESEARCH PROJECT TEAM

National Trust for Historic Preservation (NTHP) /
Preservation Green Lab
  Patrice Frey, Director of Sustainability, NTHP
  Rebecca Harris, Field Officer, NTHP
  Mark Huppert, Technical Director, Preservation Green Lab

Cascadia Green Building Council
  Katie Spataro, Research Director
  Jason F. McLennan, CEO

Ecotope
  Jonathan Heller, Principal
  Morgan Heater, Engineer / Modeler

Special thanks to Byrd Wood, Content Manager, National Trust for Historic
Preservation, for her review of this document and to Lynn Bingham, President/
Owner, Phoenix Window Restoration, Inc., Van Calvez, Owner, Windovative
Designs LLC, Janell Hampton, Owner, Quality Custom Blinds, Dave Martin, Presi-
dent, Allied Window, Inc., Bob Patton, Owner, Metro Tint, Marshall Runkel, Part-
ner, Green Home by EcoTech, and Patty Spencer, President, Fresh Air Sash Cord
Repair, Inc., for volunteering their time and expertise to perform cost estimating.
Thank you also to Jean Carroon, Principal, Goody Clancy, and
Barbara Erwine, Independent Consultant, for their helpful technical review of
the study.

This publication was developed under a grant from the National Center for Pres-
ervation Technology and Training, a unit of the National Park Service. Its con-
tents are solely the responsibility of the authors and do not necessarily repre-
sent the official position or policies of the National Park Service or the National
Center for Preservation Technology and Training.

This report is the copyrighted property of the National Trust for Historic Pres-
ervation, all rights reserved 2012. This report may be printed, distributed, and
posted on websites in its entirety in PDF format only and for the purposes of
education. This report may not be altered or modified without permission.

saving windows, saving money                                                          2
About the Project Partners

National Center for Preservation Technology and
Training
(ncptt.nps.gov)
The National Center for Preservation Technology and Training (NCPTT), an
office of the National Park Service, advances the application of science and
technology to historic preservation. Working in the fields of archeology, archi-
tecture, historic landscapes, and materials conservation, the National Center
accomplishes its mission through training, education, research, technology
transfer and partnerships. NCPTT is a longtime collaborator of the National
Trust, having supported the Trust’s efforts in setting up preservation statewide
organizations, developing guidance on the renovation/rehabilitation of older
and historic schools, and promoting sustainable preservation activities including
the creation of the Pocantico Proclamation on Sustainability and Historic Preser-
vation, and this publication on Residential Window Analysis.

National Trust for Historic Preservation
(www.PreservationNation.org)
The National Trust for Historic Preservation works to save America’s historic
places for the next generation. We take direct, on-the-ground action when
historic buildings and sites are threatened. Our work helps build vibrant, sustain-
able communities. We advocate with governments to save America’s heritage.
We strive to create a cultural legacy that is as diverse as the nation itself so that
all of us can take pride in our part of the American story.

Preservation Green Lab
(www.PreservationNation.org/issues/sustainability/green-lab/)
The Preservation Green Lab is a sustainability think tank and national leader
in efforts to advance the reuse and retrofit of older and historic buildings. The
Green Lab collaborates with partners to develop innovative research, advance
public policy and increase private investment to reduce demolitions and
improve building performance. By providing proven solutions to policy makers
and building professionals, the Green Lab curbs carbon emissions and enhances
the unique character of vibrant neighborhoods. A project of the National Trust
for Historic Preservation, the Green Lab was launched in 2009 and is based in
Seattle, Wash.

saving windows, saving money                                                            3
Cascadia Green Building Council
(www.cascadiagbc.org)
Cascadia, the leading green building organization in the Pacific Northwest, is
dedicated to making deep and lasting change within the building industry for
positive environmental impact. A chapter of the U.S. and Canada Green Build-
ing Councils, Cascadia is a cross-border education, research and advocacy
organization that brings a bioregional approach to problem solving and market
transformation. Cascadia is housed within the International Living Future Insti-
tute (ILFI), a U.S.-based NGO committed to catalyzing a global transformation
toward true sustainability.

Ecotope
(www.ecotope.com)
Ecotope specializes in energy and resource conservation in the built environ-
ment. Ecotope is nationally recognized for design expertise, ongoing evalua-
tions of energy and resource issues, and commitment to high-quality technical
analysis. Ecotope’s skills includes nearly every aspect of energy conservation in
buildings; from policy and program consulting for regional energy code agen-
cies and utilities, and basic scientific research into energy use in buildings, to
mechanical and plumbing system design.

saving windows, saving money                                                         4
TABLE OF CONTENTS

	EXECUTIVE SUMMARY

I.	INTRODUCTION AND BACKGROUND

II.	STUDY OBJECTIVES

III.	OVERVIEW OF HEAT TRANSFER THROUGH WINDOWS

IV.	STUDY METHODOLOGY AND TEST CONDITIONS

V.    RESULTS AND KEY FINDINGS

VI.   RECOMMENDATIONS

VII. CONCLUSIONS AND FUTURE RESEARCH

VIII. REFERENCES

IX.	ENDNOTES

X.	APPENDICES

      A. Simulation Inputs and Assumptions

      B. Simulation Data

      C. Regionally Adjusted Construction Cost Estimates

      D. 11 Steps to Home Energy Savings

      E. Passive Solar Window Design in Existing Homes

saving windows, saving money                               5
EXECUTIVE SUMMARY
Homeowners and design professionals seeking to upgrade the performance
and efficiency of existing windows are faced with many choices—from simple,
low cost, do-it-yourself solutions such as window films and weather stripping to
replacing older windows with new ones that require investments costing tens
of thousands of dollars. Often these decisions are made without a clear under-
standing of the range of options available, an evaluation of the ability of these
options to provide energy and cost savings, or proper consideration for the
historic character of the existing windows.
This study builds on previous research and examines multiple window improve-
ment options, comparing the relative energy, carbon, and cost savings of vari-
ous choices across multiple climate regions. Results of this analysis demonstrate
that a number of existing window retrofit strategies come very close to the
energy performance of high-performance replacement windows at a fraction of
the cost.
Annual Percent Energy Savings For Various Window Upgrade Options
30%
25%
20%
15%
10%
5%
0%
Portland Boston Chicago Atlanta Phoenix
Weather strip Interior window panel
Interior surface film + weather stripping Insulating cellular shades + exterior storm window
Insulating cellular shades New high performance replacement window
Exterior storm window Range of energy savings (low to high values)
Note: Percentage savings are not intended to predict actual savings. Instead, the results are meant to be
used to evaluate the relative performance of measures where other more cost-effective energy saving
strategies have been implemented first.
saving windows, saving money 6Key Findings Retrofit measures can achieve performance results comparable to new replacement windows. There are readily-available retrofit measures that can achieve energy savings within the range of savings expected from new, high performance replacement windows. This challenges the common assumption that replacement windows alone provide the greatest benefit to homeowners. The figure on the previous page shows that for all cities, at least one and often two of the selected measures can achieve energy savings within the range of savings expected from new, high performance replacement windows. Specifi- cally, interior window panels, exterior storm windows combined with cellular blinds, and in some cases even exterior storm windows alone fall within the range of performance for replacement windows. Almost Every Retrofit Option Offers a Better Return on Investment than Replacement Windows Energy savings alone should not influence decisions to upgrade windows without consideration of initial investment. For all climates, the cost analysis shows that new, high performance windows are by far the most costly measure, averaging approximately $30,000 for materials, installation, and general construction commonly required for an existing home. In cold climates, all other retrofit measures, with the exception of weather stripping and heat reducing surface films, offer a higher average return on investment when compared to new, efficient replacement windows. In hot climates, all of the study retrofit measures offer a better average return on investment than new windows, with the exception of weather stripping. saving windows, saving money 7
Financial Comparison of Various Window Upgrade Options for Boston
$40,000 9.0%
7.8%
$35,000 8.0%
7.0%
$30,000
Initial Cost (Average)
6.0%
$25,000
4.9%
5.0%
4.0%
$20,000 3.9%
4.0%
$15,000
2.4% 2.3% 3.0%
$10,000 1.3% 2.0%
$5,000 1.0%
$- 0.0%
de
m
ng
in +
w
in ce
w
w
l
ne
ha
fil
do
do
do
w es
t w an
pi
pa
rs
ce
rm ad
in
rip
en rm
w
w
fa
la
to sh
st
em rfo
do
llu
ur
rm
r s lar
er
rs
ac e
ce
in
to
th
pl h p
rio lu
rw
rio
g
rs
ea
te el
tin
re ig
te
ex g c
rio
rio
W
h
la
In
te
te
ew
tin
su
In
Ex
la
In
N
su
Average cost of window measures ROI (Average) In
Due to high utility costs and high heating and cooling loads, window upgrade options in Boston generally produced the highest return on
investment of any of the regions studied. Simple financial analysis such as Return on Investment (ROI) provides a decision making frame-
work to allow informed choices between options for a given location.
Financial Comparison of Various Window Upgrade Options for Phoenix
$40,000 9.0%
$35,000 8.0%
7.0%
$30,000
5.9%
Initial Cost (Average)
6.0%
$25,000
4.4% 5.0%
$20,000 3.7%
4.0%
3.0%
$15,000 2.6%
3.0%
1.8%
$10,000
2.0%
0.5%
$5,000 1.0%
$- 0.0%
de
m
g
in +
w
in ce
w
w
l
ne
n
ha
fil
do
do
do
w es
t w an
pi
pa
rs
ce
rm ad
in
rip
en rm
w
w
fa
la
to sh
st
em rfo
do
llu
ur
rm
r s lar
er
rs
ac e
ce
in
to
th
pl h p
rio lu
rw
io
g
rs
ea
te el
er
in
re g
ex g c
rio
io
W
hi
at
t
In
er
te
ul
ew
in
t
In
s
t
Ex
la
In
N
su
In
Average cost of window measures ROI (Average)
saving windows, saving money 8Study Objectives and Approach In recent years, awareness around energy use and its financial and environ- mental impacts have placed buildings in the spotlight. Residential buildings alone are responsible for approximately 20 percent of total U.S. energy use and carbon dioxide emissions. The vast majority of these buildings are single-family homes where heating and cooling represent the largest use of energy. Windows are one important aspect of how heat loss (and gain) affects a home’s opera- tional efficiency and cumulatively represent over $17 billion in annual U.S. house- hold expenditures on heating and cooling. In this study, computer simulation is used to model energy use in a typical, prototype home both before and after window improvements. Several com- mercially available window improvement options were analyzed ranging from simple, low cost applications to more expensive options representing the high- est energy performance on the market. The study analyzed energy, cost, and carbon savings for seven selected mea- sures: weather stripping existing windows; interior window panels; exterior storm windows; insulating cellular shades; a combination of exterior storm win- dows and insulating cellular shades; interior-applied surface films; and new, high performance replacement windows. Variations in climate and regional energy grids were addressed by evaluating the home’s performance in five U.S. cities—Boston, Atlanta, Chicago, Phoenix, and Portland. A thorough cost analysis allowed for the comparison of average return on investment for each window option in each of the cities. Recommendations and Conclusion Findings from this study demonstrate that upgrading windows (specifically older, single-pane models) with high performance enhancements can result in substantial energy savings across a variety of climate zones. Selecting options that retain and retrofit existing windows are the most cost effective way to achieve these energy savings and to lower a home’s carbon footprint. Due to the cost and complexity of upgrading windows, however, these options are not likely to be the first intervention that homeowners undertake. For many older homes, non-window-related interventions—including air sealing, adding insula- tion, and upgrading heating and cooling systems—offer easier and lower cost solutions to reducing energy bills. saving windows, saving money 9
In addition to providing insights into the energy performance and investment
costs of window options, the study’s findings reinforce several additional ben-
efits in choosing to retrofit existing windows rather than replace them. Ret-
rofits extend the life of existing windows, avoid production of new materials,
and reduce waste. Additionally, wood windows are often a character defining
feature of older homes, and conserving them helps to preserve the historic
integrity of a home. The Secretary of the Interior’s Standards for the Treatment
of Historic Properties and The Secretary of the Interior’s Illustrated Guidelines
on Sustainability for Rehabilitating Historic Buildings offer guidance on how best
to approach the preservation of windows in historically designated homes, or
homes that may be eligible for listing.

Selecting the most appropriate measure for upgrading windows requires a
detailed understanding of climate and energy costs in addition to window per-
formance and installation costs. This study provides a valuable analysis of these
variables that can be used to help inform the decision to improve the energy
performance of and reduce the carbon dioxide emissions from older and his-
toric single-family homes.

saving windows, saving money                                                         10
I. INTRODUCTION AND BACKGROUND
INTRODUCTION
Growing interest in improving the energy efficiency of residential buildings
inevitably raises questions about what to do with existing windows. Homeown-
ers often assume that replacing older, leaky windows is the only way to save
energy, an assumption actively promulgated and reinforced by companies
selling replacement windows and by the availability of federal tax incentives for
installing new, high performance windows. The confusion is often compounded
by a lack of easily accessible information on the range of window improvement
options available and the ability of these options to provide meaningful energy
savings. This study examines window replacement and retrofit objectively, eval-
uating the energy-saving potential of each approach in various climate regions.

While windows are an important consideration for achieving substantial energy
savings in a home, homeowners should consider other energy-efficiency mea-
sures first. Options such as air sealing, added insulation, or improving the effi-
ciency of Heating, Ventilation and Air Conditioning (HVAC) systems may offer
a greater return on investment. This study, however, focuses solely on windows
and assumes that an upgrade to the performance of windows is planned. It is
therefore intended as a resource to help inform homeowners and/or building
professionals about the best options based on the energy and cost savings
potentially offered by selected window upgrade choices.

This study is a follow-up to a report published by the National Trust for Historic
Preservation in 2012 titled The Greenest Building: Quantifying the Environmen-
tal Value of Building Reuse. The previous research evaluated whole-building life
cycle impacts including those from both material and energy use, finding that
reusing existing buildings and retrofitting them for greater energy-efficiency
offers immediate reductions in CO2 emissions and other environmental impacts.
Specifically, the research shows that it can take from 38 to 50 years for a new,
energy-efficient home to compensate for the initial carbon expended during
the construction process.1 While the study does not evaluate specific material
choices, it indicates that a greater understanding of the environmental impacts
of material selection is needed to highlight best practices to retain and retrofit
our existing building stock.

RESIDENTIAL ENERGY USE
In recent years, much attention has been directed to the residential energy-effi-
ciency market as a way to create local construction jobs and reduce the carbon
emissions from buildings. With housing comprising the vast majority of the U.S.
building stock, as shown in Figure 1, the opportunity for investment in energy
savings has the potential for a broad positive contribution to the U.S. economy.

saving windows, saving money                                                         11
The residential building sector consumes approximately 22 percent of all U.S.
primary energy, and is responsible for 21 percent of U.S. energy-related carbon
dioxide emissions. 2 As shown in Figure 2, space heating and cooling consume
the largest amount of residential energy.

Figure 1: Square Footage of U.S. Building Stock by Type

                                                               82.0%	Single-Family Detached
                               Residential                     6.1%	Single-Family Attached
                               256.5 billion                  3.3%	Apartments in 2 – 4 unit buildings

           Commercial          square feet                     5.7%	Apartments in 5 of more unit buildings

           71.6 billion                                       2.9%	Mobile Homes

           square feet

                                                                              Source: U.S. Energy Information Administration

Figure 2: U.S. Energy Consumption by Sector

                                                                        26.5%     Space Heating
                  Industrial
                                                                        15.8%     Space Cooling
                     30%                                                13.2%     Water Heating
                                                                        10.0%     Lighting
                                                            22%         6.3%      Refrigeration
                                  Buildings           Residential       4.8%      Electronics
                                    41%                                 4.6%      Wet Cleaning*
                                                                        2.6%      Cooking
                                                                        2.5%      Computers
             Transportation                                             13.5%     Other
                   29%
                                                                        *Wet cleaning includes washing machines,
                                                                         dryers and dishwashers.

                                                Source: U.S. Energy Information Administration and U.S. Department of Energy

saving windows, saving money                                                                                                   12
Older homes, particularly those built before the existence of energy codes,
tend to use more energy than their newer counterparts. Figure 3, from the U.S.
Department of Energy’s 2011 Buildings Energy Databook, shows that pre-1950s
homes have the highest energy use (both on a per square foot basis and a per
household basis), since these homes are more likely to have less efficient heat-
ing systems and little or no insulation. 3
Figure 3: Annual Energy Intensity by Housing Vintage
The chart on the left shows that
newer homes are more energy
efficient on a square foot basis
compared to older homes. The
115 trend toward larger home sizes
Prior to 1950 in recent decades, however, has
97
94 95 1950 to 1969 offset their improved efficiency,
1970 to 1979 showing higher energy use per
83 81 household. According to the
75 1980 to 1989
Department of Energy, pre-
66 1990 to 1999 1950s homes have the highest
59
2000 to 2005 per-household energy consump-
52
48 tion of all home vintages. This is
45
because they are on average 11
percent larger than those built
between 1950 through 1979 and
that they typically have older,
less efficient systems and little or
no insulation. 4
Per Square Foot Per Household
(Thousand BTU) (Million BTU)
Source: U.S. Department of Energy 2011 Buildings Energy Databook
As the image below illustrates, windows can be a source of heat loss. It is esti-
mated that 50.7 million residential homes in the U.S. have single-pane windows. 5
According to the U.S. Department of Energy, Energy Savers Guide, windows
account for 10 to 25 percent of heating and cooling costs in the typical Ameri-
can home.6 Windows cumulatively
Thermal imaging of an older
represent approximately $17 home shows typical areas
billion in annual U.S. household responsible for heat loss through
a home’s enclosure. Exterior
utility costs for heating and cool-
elements of the home with
ing. However, they are not the only greater heat loss to the outside
culprit. Un- or under-insulated are shown as yellow and orange,
whereas areas with lower heat
walls, roof, wall and roof penetra- loss are shown as violet and
tions (e.g., vent stacks), doors, and purple.
foundation also substantially con-
tribute to heat loss as illustrated
by the bright yellow areas in the
illustration.
Photo: Morgan Heater
saving windows, saving money 13CHALLENGES WITH SELECTING WINDOW UPGRADES
There are many options for improving the energy efficiency of existing win-
dows. While the body of information and objective data about window upgrade
options is growing, few resources are tailored to provide guidance about which
options are best suited for a particular home. Homeowners, designers, and
those in the building trades have few tools to evaluate how various strategies for
retrofitting of existing windows compare to replacing them with new windows.
Homeowners upgrade windows for a variety of reasons. Some are motivated
strictly by energy cost savings, while others want to improve the comfort of a
drafty house or reduce their carbon footprint by decreasing the greenhouse gas
emissions associated with their home’s energy consumption.7 Still others elect
retrofit strategies over replacement to extend the life of existing windows, to
avoid adding valuable resources to landfills, and to preserve a home’s original
materials, such as old growth wood, which is now scarce. Owners renovating an
older or historic home will retain the original windows to keep the historic char-
acter and aesthetic charm of the home intact through the upgrade process.
Upfront investment costs can ultimately drive (or deter) a homeowner’s deci-
sion to upgrade residential windows. Without expert energy analysis, however,
homeowners are frequently misinformed on whether specific window retrofit or
replacement measures will pay off in terms of ongoing utility savings. With the
average U.S. household spending more than $2,200 annually on energy, 8 invest-
ments to upgrade the performance of existing single-pane windows (the focus
of this study) may offer acceptable financial returns, especially during times of
rising energy costs.
When considering whether to retrofit or replace a window, questions arise about
what is more important: saving money, saving energy, retaining historic char-
acter, or reducing negative environmental effects. This study focuses solely on
energy savings, associated utility cost savings, and the potential for reducing
carbon emissions, acknowledging that many other factors must also be consid-
ered. While outside the scope of this study, additional important considerations
include:
• Characteristics of the window materials selected (such as toxicity, location
of raw material extraction, manufacture, and the potential for reuse,
recycling, or disposal at the end of their service life),
• Maintenance and longevity of the window upgrade measure.
• Stimulation of the local economy through construction expenditures.
• Reparability.
saving windows, saving money 14II. STUDY OBJECTIVES
This study analyzes the potential energy savings related to common practices
for upgrading older, existing single-pane residential windows. Variables such as
climate, regional energy costs, heating system efficiency, and window system
performance are evaluated to understand which options provide the greatest
energy savings for homeowners.
The objectives of this study are to:
• Characterize the typical performance of older, leaky, single-pane
residential windows in terms of thermal resistance, solar heat gain, and
airtightness, and identify the range of common practices for upgrading
performance through window retrofit and replacement options.
• Using computer simulations, compare the relative energy savings from
window upgrade measures for a prototype single-family home.
• Based on the results of energy modeling, provide recommendations for
improving window performance across different U.S. climate regions.
• Apply regionally adjusted construction cost estimates, demontrate the
relative cost effectiveness of the measures studied.
A number of previous studies have evaluated the energy efficiency of window
retrofit and replacement measures. These studies have included both empirical
testing and computer simulations of the thermal performance and air leakage
for various options including interior and exterior storm windows, weather strip-
ping, and insulating shades. A list of previous research referenced in this study is
located in Section VIII.
This study builds upon the data developed in these earlier studies to develop
a single data-set that evaluates and allows a comparison of the most effective
window retrofit options. The results from this study are intended to add to the
existing body of research in this field, providing greater insight into the antici-
pated relative energy, carbon, and cost savings between window retrofits com-
pared to window replacement across different climate regions. Ultimately, this
study is intended to help influence practice and policy around upgrading older
windows for energy efficiency and to help homeowners, designers, and building
professionals make more informed decisions.
saving windows, saving money 15III. OVERVIEW OF HEAT TRANSFER THROUGH
WINDOWS
Three principal factors affect heat loss/gain through windows. Each factor is
sensitive to different aspects of window design and specifications and con- Window
tributes differently to a home’s overall energy use depending on the climate in Performance
which the house is located. Characteristics
Evaluated
I. Air Leakage/Infiltration: Air leakage involves movement of air through in this Study
unintentional cracks between window components within the window frame Air-leakage Rate: A measure
itself or between the window assembly and the building structure. Driven of the rate of air infiltration
around the window due to
by air pressure differences, outside air infiltrates through these cracks in the pressure differences on either
high-pressure zone of the house, while conditioned inside air escapes in the side, expressed in units of
low-pressure zone. Pressure differences to drive this infiltration can come cubic feet per minute (cfm).
The lower a window’s air-
from wind, stack effects that cause heat to rise in the house, or pressure leakage rating is, the better
imbalances from the installed heating and cooling equipment. Infiltration its airtightness.
has its greatest energy impact during cold weather in heating-dominated Solar Heat Gain Coefficient
climates when winds can be most severe and where the temperature of (SHGC): Measures transmis-
sion of direct radiation from
outside air is significantly colder than inside air.
the sun through a window,
expressed as a number
Air leakage depends on the size of infiltration cracks, which can be evaluated between 0 and 1. The lower
a window’s SHGC, the less
with a blower door test. Leakage is minimized by filling cracks and/or using solar heat it transmits, and
an overall barrier, such as a storm window, to block airflow paths. the greater its shading abil-
ity. Windows with low SHGC
are beneficial in cooling-
II. Temperature Driven Heat Transfer (Conduction and Convection): Heat dominated climates but may
moves through materials from warm to cold; therefore, differences in potentially conflict with
passive heating strategies in
temperature (∆T) between the outside and inside air provide a forcing heating-dominated climates.
function for the movement of heat through window materials. This heat
U-factor: A measure of the
transfer happens through all parts of the window—both the glazing and rate of non-solar heat loss
the frame—and its energy impact is specified by the U-factor of the or gain through a window,
window assembly. The overall effect of these losses depends on the expressed in units of Btu/
hr-sq ft-°F. The lower the
total window area and its U-factor and the inside/outside temperature U-factor, the greater a win-
difference. Since this difference is usually greatest during cold weather, dow’s resistance to heat flow
and the better its insulating
when ∆T may exceed 60 degrees F, this heat transfer mechanism is usually value.
most significant during heating-dominated times of the year.
Reducing heat flow through windows results in interior surfaces that
are closer to the interior air temperature and not cold to the touch in
winter. This greatly improves thermal comfort of occupants and reduces
condensation along with providing energy savings. Keeping the interior
surface of the window warmer and more consistent from top to bottom
also reduces convection, further contributing to occupant comfort.
Heat flow through glazing units is minimized by using multiple glass layers,
low emissivity (low-e) coatings, inert gas fill, and warm edge spacers
between all sealed glazing layers. For window frame components, U-factor
is minimized by using low conductivity (or thermally broken) frame
saving windows, saving money 16Figure 4: Heat Transfer Through Windows
Solar
Radiation
Convection
and Conduction
Thermal
Radiation
Infiltration
Source: U.S. Department of Energy
materials. For example, wood has a lower conductivity than metal. External
measures such as adding insulating curtains, blinds, or interior shutters will
also reduce heat transfer.
III. Solar Gains (Radiation): Solar gains happen through the transparent
window glazing components and can have both positive and negative
effects on the energy performance of windows. During the heating season,
solar gains deliver heat to spaces and offset the need for mechanical
heating, but during the cooling season, these same solar gains will increase
the energy needed to cool the space. The Solar Heat Gain Coefficient
(SHGC) quantifies of the transmission of solar radiation through the
window. The amount of solar gain depends on the area of transparent
saving windows, saving money 17window glazing oriented toward the sun, the SHGC of the glazing, the
amount of shading, and local solar conditions (sun angles, cloudiness,
window cleanliness, etc.).
Solar radiation is divided into three components: visible light (roughly 45
percent), infrared (roughly 52 percent), and ultraviolet rays (roughly 3
percent). Although solar heat gains happen from all three components,
only the visible light portion of the spectrum can be seen. Since the
primary function of windows is to allow natural light in and provide views
out, the transmission of visible light is a vital consideration.
Low-e coatings added to windows decrease the effective U-factor of the
window and reduce the SHGC. These coatings or films are designed to trap
beneficial heat (infrared energy) inside the house and reflect unwanted
solar rays (infrared energy) away from the house while simultaneously
letting a large fraction of the visible light pass through to the inside.
However, where passive solar heating is desirable, such as in heating-
dominated climates, these films can reflect away more solar energy than
they trap.
While visible transmission is not linearly related to the U-factor or SHGC,
many low-e films used to improve a window’s thermal performance or
control solar gains also decrease the visible light transmission, sometimes
making the glass appear deeply tinted or reflective. This not only affects
views and natural light, it can also jeopardize the historic integrity of a home.
For this reason, test conditions evaluated in this research are limited to
products that maintain a reasonably high visible transmission (greater than
40 percent) and an acceptably low visible reflection (less than 12 percent).
Interior shades, blinds, and films and external measures such as awnings,
vegetation, or exterior shutters all help to reduce unwanted solar heat gain
through windows.
saving windows, saving money 18IV. STUDY METHODOLOGY AND TEST CONDITIONS OVERVIEW OF METHODOLOGY In this study, a set of test conditions for various window upgrade measures were applied to a prototype home. Researchers then compared these measures by simulating the energy performance of the house before and after the energy- efficient window interventions. A typical single-family home with older, leaky single-pane windows serves as the baseline case study for the analysis. The energy performance of the house, both before and after window improvements, is estimated using a whole-house, hourly, energy simulation computer program. The results are expressed in terms of energy savings (kWh/yr), energy costs ($/ yr), and reductions in carbon dioxide emissions (lbs CO2/yr) associated with increased operational efficiency for a prototype single-family home in four cli- mate regions—cold, temperate, hot/humid, and hot/arid. A representative range of low and high heating system efficiencies is modeled to determine how results may be influenced if window interventions take place before or after a home- owner has elected to upgrade the heating system. For the purposes of this study, it was assumed that the owners of the Petty- grove Residence had already performed many common energy retrofits, includ- ing insulation in the walls and attic, air sealing, and an upgraded HVAC system. This assumption was made because it has been widely demonstrated that these retrofit strategies offer better energy savings at less cost than window retrofit or replacement options. In addition, it was assumed that the window upgrades were part of a whole-house, substantial effort to improve energy efficiency, but as one of the last measures applied to a home. Because the prototype had already substantially reduced its total energy consumption through these strat- egies, window interventions made a greater percentage impact in both cost and CO2 savings than if the house had not already completed the other energy efficiency measures. Under these conditions, savings associated with window improvements may appear greater than is found in many other studies assess- ing window options. Importantly, this study also assumes that the Pettygrove Residence has leaky double-hung windows, because past research has shown that substantial air infiltration from this window type contributes to energy loss. 9 This study sought to simulate how various retrofit and replacement options would perform in this context. The analysis also assumes that high quality retrofit or replace- ment measures are applied as part of a comprehensive, whole house effort to improve energy performance. Together, assumptions about the poor perfor- mance of leaky windows and the application of high quality retrofit/replacement strategies produces energy, carbon and cost savings may not be typical of an average home or lower quality improvement measures. However, it is expected that data from this study describing the relative difference in cost and perfor- mance between different window measures will help design professionals and homeowners understand what solutions are most appropriate for a given home. saving windows, saving money 19
PROTOTYPE HOUSE AND ASSUMPTIONS
The prototype home used in the analysis (known as the Pettygrove Residence)
is a two-story, Queen Anne style home located in Portland, Ore. Constructed in
1896, the home was most recently remodeled in 2009.

By using an actual, rather than a theoretical house, the analysis is grounded in a
real-life example allowing the team to simulate an existing house with a variety
of window interventions. While the home is located in Portland, for the purposes
of this study it is “traveled” to four other cities to determine how variations in
climate and energy cost affect potential window choices.

Table 1 describes the data inputs and assumptions for the baseline home used in
the analysis. A range of low and high baseline conditions is used to model both
the windows (U-factor, SHGC, airtightness) and the heating system efficiency
(equipment efficiency, duct leakage) for the home. These ranges are based on
the cited research and on the prevalent heating/cooling system type and effi-
ciency for each region. The values are intended to represent a range of existing
conditions in a typical older U.S. home. According to the Energy Savers Guide, air
sealing, adding insulation, and upgrading old, inefficient equipment are the most
cost-effective energy upgrades for an older home. The prototype home assumes
that the furnace performs to minimum national efficiency standards, that an
average level of whole-house air sealing was performed, and that insulation has
already been installed in all un-insulated wall and under-insulated attic spaces.

The research findings and study methodology in this report are meant to guide
the application of energy-efficiency improvements in older homes. However,
homeowners or professionals working with a historically-designated home, a
home that is eligible for designation, or a home that is located in a historic dis-
trict should consult the Energy Efficiency section of the Guidelines for Preserv-
ing Historic Buildings and the technical brief on weatherization issued by the
National Park Service for guidance regarding the appropriate application of air
sealing, insulation, window treatments, and mechanical equipment upgrades. In
particular, the proper approach to adding wall insulation depends on the con-
struction of the historic wall assembly, the climate conditions to which the home
is exposed, and the materials and techniques chosen to insulate and seal the
wall cavity.

saving windows, saving money                                                          20
TABLE 1: PROTOTYPE SINGLE FAMILY RESIDENCE
 PETTYGROVE RESIDENCE
 Square Footage                                                                                        1,579 s.f.
 Unheated Basement                                                                                      900 s.f.
 No. of Stories                                                                                    2 plus basement
 Year Built/Year Renovated                                                                           1896 / 2009
 Description                                                                                         3-BR, 2.5 BA
 Number of Occupants                                                                                       3
 ENVELOPE
                                                                                       2x4 stick frame @ 16" on center,
 Envelope and Framing
                                                                                       cedar lap siding, asphalt roofing
                                                                              R-13 (blown-in insulation & existing wood siding
 Above grade walls (R values)
                                                                                   & plaster in full dimensional 2x4 wall)
 Roof Construction (R values)                                                     R-30 (blown in insulation above ceiling)
 Basement                                                                                   Un-insulated 6" concrete
 Basement Ceiling/Level 1 Floor                                                                   R-4 (wood & carpet)
 WINDOWS
                                                                                 Double hung, single pane wood windows,
 Window Type
                                                                                       no storm windows or panels
 % Glazing (window:wall)                                                                                  14%
 SHGC                                                                                                    0.74a
                                                                                       LOW                                HIGH
 U-Factor                                                                              0.77   b
                                                                                                                           1.05c
 Air Leakage                                                                  646 cfm @ 50 pad                      1360 cfm @ 50 pad
 HVAC SYSTEMS
 Heating System Type                                                                                 Gas furnace
 Heating System Capacity                                                           Heating System Capacity – 62 KBTUH
                                                                         HIGHER PERFORMANCE                    LOWER PERFORMANCE
 Heating Efficiency                                                                0.92 AFUE                           0.78 AFUE
                                                                              Located in heated                  Located in unheated
 Ducts
                                                                                 space, tight                       space, leaky
 Cooling System Type                                                                                Window Units
 Cooling Efficiency                                                                                    SEER 9.4
*Window Air Leakage rates in this table and throughout this report are expressed as total air leakage resulting from all windows in the home.
 Total air leakage of the entire home (including windows plus all other envelope infiltration) for the baseline is assumed to be 4,000 cfm50
 before window intervention and less than 3,000 cfm50 after. For the baseline, “high value” window air leakage represents about one-third of
 the home’s total, which falls within the expected performance range of untreated windows in a home that has been insulated and sealed to
 average levels.

Sources:

a ASHRAE Handbook Fundamentals, 2005, Table 19, pg 31.48 for residential single clear.

b Measured Winter Performance of Storm Windows. Joseph Klems. 2002. Table 4, “Prime only,” single-glazed double-hung.

C DOE-2 Glass Library Listing for Single Clear (code 1000) with wood frame.

d Testing the Energy Performance of Wood Windows in Cold Climates. Brad James, Andrew Shapiro, Steve Flanders, Dr. David Hemenway. 1996.
(Extensive study on air leakage.) Page 27, Table 4 “tight window” and “loose window” leakage rates normalized to CFM.

saving windows, saving money                                                                                                                    21
CITIES AND CLIMATE REGIONS ANALYZED
Researchers analyzed five cities representing various climate types and geo-
graphic regions to characterize the typical climate conditions that occur within
the continental U.S. (temperate, cold, hot/humid and hot/arid). The cities ana-
lyzed in the study were:
• Boston (cold)
• Chicago (cold)
• Portland (temperate)
• Atlanta (hot/humid)
• Phoenix (hot/arid)
Typical Meteorological Year (TMY3) climate data for each of these cities was
used in the computer simulations of the baseline and for each window upgrade
test condition. Table 2 shows these representative cities and their comparative
heating degree days (HDD), cooling degree days (CDD),10 estimated regional
rates for natural gas and electricity, and a carbon equivalent multiplier that rep-
resents the regional fuel mix used to generate electricity.
TABLE 2: CLIMATE AND FUEL CHARACTERISTICS FOR CITIES ANALYZED
HDD8 CDD Est. Gas Rate Est. Elec. Rate CO2 Conversion
City (65°F) (65°F) ($/ mmBtu)a ($/kWhr)b (Elec) (lbs/kWh)c
Boston 5630 777 1.410 0.1459 0.828
Chicago 6498 830 0.873 0.1152 1.552
Portland 4400 390 1.265 0.0887 0.859
Atlanta 2827 1810 1.607 0.1107 1.495
Phoenix 1125 4189 1.543 0.1097 1.253
a
U.S. Energy Information Administration. Average Price of Natural Gas Sold to Residential Consumers, by State, 2009-2011.
b
U.S. Energy Information Administration. 2010 Electric Sales, Revenue, and Average Price.http://www.eia.gov/electricity/sales%5Frevenue%5Fprice/
c
U.S. EPA, Clean Energy calculator. Accessed April 2012. http://www.epa.gov/cleanenergy/energy-and-you/how-clean.html
SIMULATION PROGRAM
Energy simulations for the baseline house and each window upgrade measure
were carried out using the SEEM (Simple Energy and Enthalpy Model) program.
Designed to specifically model residential building energy use, this program
conducts concurrent hourly simulations of heat transfer, moisture (humid-
ity), and infiltration. These simulations interact with each other as well as duct
specifications, equipment, and weather parameters to calculate the annual heat-
ing and cooling energy requirements of the building. The program is based on
algorithms consistent with current American Society of Heating, Refrigeration,
and Air-Conditioning Engineers (ASHRAE), American Heating and Refrigeration
Institute (AHRI), and International Organization for Standards (ISO) calculation
standards. Widely accepted as a residential simulation program, SEEM is used
to support state building energy code revisions in Washington and Oregon and
the U.S. EPA’s Northwest Energy Star Homes program.
saving windows, saving money 22SEEM offers a number of advantages over other simulation programs. The step- by-step hourly thermal calculations accurately model both air temperature and mean radiant temperature using a highly efficient forward difference algorithm. Similar to the Lawrence Berkeley National Laboratory infiltration model, SEEM infiltration simulations realistically allow airflow to fluctuate with changing weather and mechanical ventilation and have been generalized to include the effects of exhaust fans and duct leakage. This program was specifically selected for this study due to its ease of use and its ability to produce reliable outputs for residential energy use. For more information and to download the free program visit: http://www.nwcouncil.org/energy/rtf/measures/support/SEEM/Default.asp WINDOW TEST CONDITIONS The range of energy-efficiency retrofits evaluated in this research study encom- passes the improvements to window unit and glazing that might be undertaken by homeowners to improve the energy efficiency and comfort of their homes. The measures selected address infiltration, temperature driven heat losses, and solar gains, which were explained in Section 3. While homeowners have many options to choose from (or combinations of options), this study evaluates seven commonly employed approaches. The selected measures include readily avail- able, off-the-shelf products ranging from simple, low cost do-it-yourself applica- tions to more expensive options requiring professional installation. The following window upgrade test conditions were studied: • Weather stripping for existing window • Exterior storm window • Interior window panel • Insulating cellular shade • Combination of exterior storm window and insulating cellular shade • Interior surface film (including weather stripping) • New, high performance replacement window This study only considers specific retrofits/improvements to the glazing and the window frame and does not address additions of exterior architectural and landscaping elements. The addition of exterior architectural shading ele- ments (overhangs, awnings, shutters, etc.) and landscaping elements (trellises, vines, trees, etc.) can have a substantial effect on the contribution of windows to residential energy use (especially to reduce solar gains during cooling condi- tions). These measures were outside the scope of this study. The energy simula- tions did, however, assume a standard “shading factor” of 65 percent to account for shading from buildings, trees, curtains, etc. It should also be noted that this study does not provide a comprehensive assessment of all window improve- ment measures or all combinations of measures, but rather is an assessment of those that are typically used. saving windows, saving money 23
The following pages describe each test condition used in the analysis and
assumptions for thermal performance, SHGC, and airtightness values. For each
test condition, “low value” and “high value” assumptions are used to represent
the typical range of performance expected from that particular measure. “Low”
value refers to the lower end of values for U-factor, SHGC, and airtightness,
whereas “high” value refers to the larger values for these characteristics.
These values are derived from an extensive review of data from prior studies.
Empirical testing of window retrofit/replacement options was outside the
scope of this study.

COST ANALYSIS METHODOLOGY
A thorough cost analysis was performed to compare the average return on
investment (ROI), defined as the annual energy cost savings divided by the
initial installation cost, of the test conditions in each city. Estimates were per-
formed by volunteer industry experts within each installation practice, and
include the cost of labor, materials, and contractor mark-up for the prototype
home in Portland, Ore. Results were then regionally adjusted for each city using
the R.S. Means 2012 Residential Construction Cost Estimator. Low- and high-
cost values were established using the specifications defined in the Summary of
Study Assumptions listed below for each test condition. The low-cost scenarios
for the following three test conditions were assumed to be installed by the
homeowner and included only material costs: weather stripping for existing win-
dow, insulating cellular shade, and interior surface film including weather strip-
ping. The high-cost test conditions used specifications for commercially avail-
able products that were assumed to provide maximum potential energy savings
for the given condition.

ROI was chosen as the preferred measure of cost effectiveness of the test
conditions over simple payback, which is the mathematical inverse of ROI. The
primary reason for using ROI is to allow homeowners to compare investments
in home-energy efficiency to other, long-term financial investments. However,
because ROI and simple payback are inversely related, the relative difference
between window options will be equivalent using either method.

While an important consideration in extending a window’s useful life, window
repairs were not considered within the scope of this study, except in the case of
the high-cost exterior storm window test condition. In this case, repairs to the
primary window that improved operability and fit of the sashes were required
in order to accomplish the very low U-factor assumed in the Summary of Study
Assumptions for that test condition.

saving windows, saving money                                                          24
weather stripping
  Weather stripping improves the airtightness of an existing window by
  sealing gaps at head, sill, meeting rail, and at vertical edges to reduce
  air leakage.

  Options
   •        The four common types of weather stripping are spring-metal,
            plastic strips, compressible foam tapes, and sealant beads.
   •        Common materials are felt, open and closed-cell foams, vinyl, and
            metals (bronze, copper, stainless steel, and aluminum).
   •        Tension seal options block drafts by pressing against the sides of a
            crack to create a seal. Magnetic and interlocking metal channel
            options are very effective at air sealing.
                                                                                       The red arrows indicate metal
  Benefits                                                                             weather stripping that fits into a
                                                                                       routed channel along the sides and
       ++ Improves comfort by reducing drafts.
                                                                                       bottom of the sash.
       ++ Improves airtightness by reducing both air infiltration
          and exfiltration.
       ++ Maintains aesthetics of existing window.
       ++ Reduces entry points for insects and moisture.

  Drawbacks
       --   Self-stick version may be difficult to install.
       --   Some options may require professional installation.
       --   No thermal insulation benefit.

 Additional Considerations
  Installation methods vary by product type. Many use self-stick adhesives; others must be stapled, glued
  or tacked in place. Weather stripping comes in varying depths and widths and must be applied such
  that it does not interfere with the operation of the window. Some products are more durable than
  others. Replacement frequency will vary depending on material type, friction, weather, temperature
  changes, and normal wear and tear. Metal options (bronze, copper, stainless steel, and aluminum) can
  last for many years.11

  Summary of Study Assumptions

   weather strip                            Low VALUE                           High VALUE
   Specifications                           Metal interlocking gaskets and      Homeowner installed rubber or
                                            T-rail, professionally installed.   felt gaskets
   Window U-Factor                          0.77                                1.05
   SHGC                                     0.74                                0.74
   Window Air Leakage                       156                                 812
   (CFM @ 50 pa)

saving windows, saving money                                                                                                25
Exterior Storm Window
Exterior window unit applied over an existing window to protect from
weather and to improve energy performance.
Options
• Wood, aluminum, and vinyl are the most common frame materials.
• Single- or double-pane glass.
• Clear or low-e coatings.
• Panel options are:
• Triple Track: two operable glass panels with operable screen
• Double Track: one operable glass panel with operable screen
• Fixed: one, non-operable glass panel
Benefits A traditional wood storm window
++ Improves thermal performance and air-tightness of window assembly fastened by hangers at the top.
This storm window is also secured
(fixed panels are most airtight). by four screws along the perimeter.
++ Protects and may extend the life of existing windows.
++ Low-e coatings may decrease solar heat gain in cooling-dominated
climates.
++ Improves indoor comfort near windows.
++ Reduces noise infiltration.
Drawbacks
-- Fixed-panel models need to be installed/removed seasonally if window is to be opened.
-- May affect egress requirements.
-- May conflict with codes/regulations that prohibit changing exterior window appearance if low-e
glazing is used.
-- May interfere with existing window operation (i.e., outswinging casement and awning windows).
Additional Considerations
Exterior storm windows can be homeowner or professionally installed and caulked in place with “weep
holes” at the bottom of the frame to allow any moisture that collects between the primary window and
the storm window to drain out. Windows may be difficult to install on upper floors of multi-story houses.
Exterior storm windows provide added life to existing window sash, paint finish, and historic glass.
Maintenance and service life for the storm windows will depend on frame material. Exterior storm win-
dows provide added life to existing window sash, paint finish, and historic glass. Maintenance and ser-
vice life for the storm windows themselves will depend on frame material.
Summary of Study Assumptions
EXTERIOR STORM WINDOW Low VALUE High VALUE
Specifications Low-E double pane operable Single-Clear operable exterior
exterior storm; aluminum triple- storm; aluminum triple-track
track frame frame
U-Factor 0.21 0.55
SHGC 0.27 0.31
Window Air Leakage 307 1027
(CFM @ 50 pa)
saving windows, saving money 26Interior storm Panel
Plastic or glass panels mounted on the indoor side of an existing window to
improve energy performance.
Options
• Mounting: Face-mounted onto window casing or inset and mounted
on window jamb.
• Glazing: Usually clear acrylic or polycarbonate; glass with or without
low-e coating.
• Frame: Aluminum most common; steel, vinyl, and wood frames
available.
• Operability: Most are fixed panels but operable versions are available.
Interior storm panel.
Benefits
Image courtesy of: Environmental
++ Improves thermal performance, airtightness and comfort. Window Solutions, LLC
++ Easier to install than exterior storm windows.
++ Do-it-yourself friendly.
++ Require less maintenance than exterior storm windows because
they’re not exposed to the elements.
++ Doesn’t affect exterior aesthetics — an important consideration for
historic homes.
++ Reduces noise infiltration.
Drawbacks
-- Reduced visibility with plastic panels.
-- Fixed-panel models need to be installed/removed and stored seasonally if window is to be opened.
-- May affect egress requirements.
-- Potential ventilation/condensation issues.
-- Does not protect or extend the life of primary window.
Additional Considerations
Interior window panels can be installed by a homeowner or professional. Glass pane types offer better
visibility and longer life than plastic pane types, but glass is heavy and fragile. Plexiglas and acrylics are
tougher and lighter than glass, but may scratch easily when stored and may turn yellow over time when
exposed to sunlight.
Summary of Study Assumptions
INTERIOR WINDOW PANEL Low VALUE High VALUE
Specifications Low-E single pane fixed Single-Clear operable
interior storm interior window panel
U-Factor 0.36 0.48
SHGC 0.39 0.60
Window Air Leakage 203 456
(CFM @ 50 pa)
saving windows, saving money 27Insulating Cellular Shades
Pleated shades applied to the inside of the window opening to improve
thermal performance.
Options
• Accordion-like shade folds up or both up and down.
• Optional side tracks in which the edges of the shades run and weather
stripping to improve airtightness.
• Manual or motorized (wireless electronic) operation.
• Cell configuration: Single or dual cell.
• Fabric: light filtering or opaque in a range of textures and colors.
Benefits
++ Improved thermal performance when deployed.
++ Minimizes drafts near windows. Cellular shade with interior tracks.
++ Provides daylight control and privacy. Image © Comfortex Window
Fashions
++ Can be combined with air sealing and repair of existing window and
with exterior storm windows.
++ Minimal interference with existing window operability and egress.
Drawbacks
-- Requires proper deployment daily.
-- Views and daylighting reduced when deployed.
-- No energy benefit when shades are raised for light and views.
Additional Considerations
May be owner or professionally installed. Most fabrics repel dust and are inherently anti-static, but light
vacuuming or dusting is routinely required. Many shades are also fully washable. Service life depends on
the fabric selected and care in operation. Many shades carry a 10-year warranty on the mechanisms and
a 5-year warranty on the fabric, but can last longer with careful use.
Summary of Study Assumptions
INSULATING CELLULAR SHADES Low value High value
Specifications Shades with side tracks + Shades without side tracks +
existing Single Clear glazing existing Single Clear glazing
Assumes shades deployed Assumes shades deployed 70%
70% of nighttime hours; at of nighttime hours; at other
other hours performance hours performance matches
matches baseline. baseline.
U-Factor (night/day) Assumes shades deployed 70% 0.58/1.05
of nighttime hours; at other
hours performance matches
baseline.
SHGC 0.74 0.74
Window Air Leakage 156 1360
(CFM @ 50 pa)
saving windows, saving money 28You can also read