Climate Action and the Taxation of Motoring in Ireland
←
→
Page content transcription
If your browser does not render page correctly, please read the page content below
Climate Action and the Taxation of Motoring in Ireland

      Submission to the Tax Strategy Group on behalf of the Irish Car Carbon Reduction Alliance

August 2020

Colm McCarthy and Associates,

Economic Consultants,

51 Pembroke Road,

Dublin 4. DO4 TT17

colm.mccarthy@ucd.ie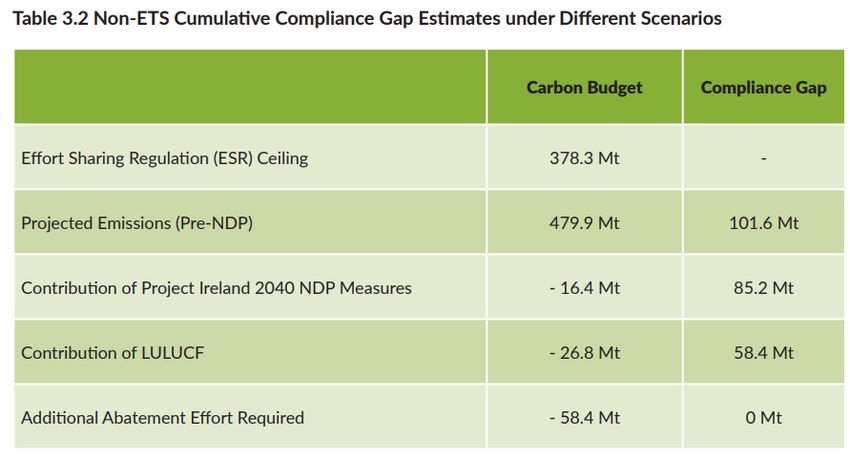
2

Contents

Introduction and Summary                                                    3

Chapter 1: Road User Taxes and Charges in the EU and in Ireland             5

           Overall Revenue from Motoring Taxes and its Composition

           Fuel Taxes in European Countries

           Acquisition Tax (VRT) in Ireland

           Charges for Road Use in Europe

Chapter 2: The Economics of the Climate Action Plan                        13

           European Union Climate Policy – the Emissions Trading System

           European Union Policy – National Emission Targets

           Ireland’s Emission Reduction Targets

           The Selection of Measures Proposed in the Climate Action Plan

           Electricity Generation and Transmission in the CAP

           The Proposals for Transport

           Agriculture in the Climate Action Plan

Chapter 3: Direct and Indirect Costs of Road Use in Ireland                29

           Estimating the Direct Costs of Road Use

           Estimating the Indirect Costs of Road Use

Chapter 4: Revenue from Taxes and Charges on Motoring in Ireland           34

Chapter 5: Taxing Road Transport in the Long Term                          36

           Road Tolls in Ireland

           Fuel Tax

           The Electrification of the Road Transport Fleet

Chapter 6: Taxing Motoring Through the Transition                          41

Appendix: Components of a System of Road User Charging                     46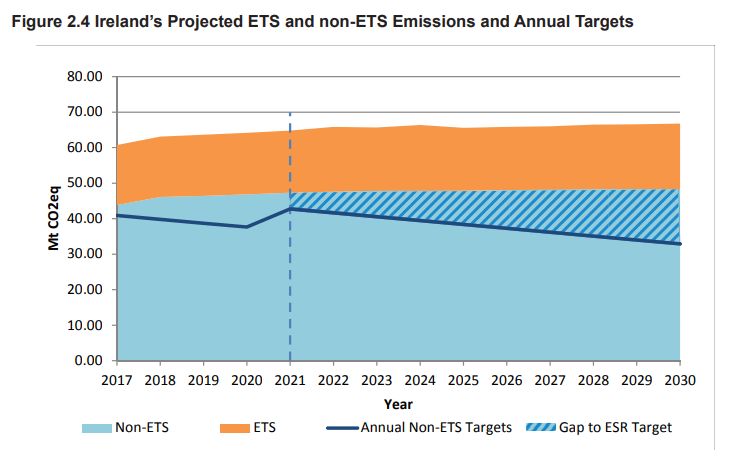
3

Introduction and Summary

Recent reports of the Tax Strategy Group have considered the structure, as well as the rates, of taxes on
motoring. This report argues that a radically different approach to raising revenue from road users is
becoming inevitable. The amounts are substantial – taxes on acquisition of vehicles, annual taxes on
ownership, and fuel taxes, with a small component of charges for actual use, add up to about €6 billion
per annum. A rough estimate of the direct and indirect costs attributable to road users totals to the same
order of magnitude: the total take from motoring, including currently unrecovered emission and
congestion costs, is at the right level. But the structure is not coherent and is unsustainable.

The decarbonisation of the vehicle fleet will progressively undermine the revenue base for fuel taxes,
currently the principal revenue raiser, and the Irish system of taxes on vehicle acquisition has perverse
effects in a context where fleet conversion is public policy.

Chapter 1 outlines the structure of motoring taxes in European countries and notes the heavy reliance in
Ireland on fuel taxes, and on the acquisition tax, Vehicle Registration Tax (VRT), which is discouraging the
purchase of new cars. Most other European countries have substantial fuel taxes but only a few share
Ireland’s reliance on upfront taxes on vehicle acquisition. Direct charging for the use of road transport
infrastructure has become more widespread in Europe but is still responsible for only a modest portion of
public revenue.

The second chapter considers the Climate Action Plan released in July 2019 and the broader context in
which policy on the taxation of transport must be enshrined. Irish emissions as measured are mainly
outside the European Union’s Emission Trading System or ETS, to a greater degree than in other EU
countries. This imposes a differential adjustment obligation, since non-ETS targets must be attained
entirely through national policy measures. Ireland’s targets are affected greatly by the measurement
system, which counts emissions from agriculture on a production basis. Most other emissions, for example
fuel combustion in the road vehicle fleet, are counted on a consumption basis. This measurement issue is
important since Ireland is a substantial net exporter of agricultural products.

Chapter 3 discusses the direct (construction, maintenance, and policing) costs of the road system and the
indirect costs, principally carbon emissions, low-level non-carbon emissions and congestion externalities.
It concludes that the non-carbon and congestion externalities are significant and are not recovered from
motorists.

The following chapter assesses the Irish system of taxes and charges on road users. The principal
conclusion is that, when non-carbon emissions, congestion, the current low levels of the carbon charge

and of direct user charges are taken into account, the total annual yield from all motoring taxes and
charges is roughly in line with identifiable direct costs and the un-collected externality costs. However,
the structure is not well aligned with the incentivisation of emission reduction and fleet replacement.
There is an unintended incentive to encourage the importation of older, high-emission, vehicles from the
United Kingdom, the only other European country with right-hand steering wheels. There is a resultant
leakage of VAT revenue. As the fleet becomes electrified, and as electricity moves to zero- or low-carbon
technologies, the current reliance on fuel taxes, over half of revenue from all sources, becomes
problematic.
4

Chapter 5 argues that the current structure of motoring taxes is not sustainable in the longer term, even
though aggregate revenue does not appear to be excessive and there is a policy prerogative to protect
revenue in current circumstances. Ultimately there will need to be a system which collects attributable
direct costs from road users while incentivizing the reduction of carbon and non-carbon emissions and
congestion externalities.

The final chapter considers the unrealistic timeline that exists for the adoption of electric passenger cars
and the policy options during the transition to a new system, which should be based on electronic road
pricing and congestion charging. Such a system has the incidental benefit that, through charging for road
space, it would restore the competitive advantage of bus-based public transport which is suppressed in
the current structure where road space is effectively free. During the transition, which could take a decade
or more, the system of motoring taxes should seek to protect aggregate revenue while promoting fleet
replacement.

The report concludes with a short appendix outlining the main components of an electronic road pricing
system. The report’s principal recommendation is that the government should undertake a detailed study
of the practicalities of introducing a comprehensive system of road-user charging in Ireland.
5
Chapter 1: Road User Taxes and Charges in European Union Countries
European countries collect substantial revenues from road users, principally through levies on vehicle
purchase, ownership, and fuel. There has been an increasing reliance in recent decades on direct charges,
including road tolling and congestion charges in addition to the conventional taxes but user charges
remain a small portion of the total in nearly all countries.
Use of the road system imposes costs directly in the form of road construction, road maintenance and
traffic management, including traffic policing, which are borne by state authorities. Users also impose
externality costs, often unrecovered, in the form of congestion and negative environmental impact, on
other road users and on the public.
Overall Revenue from Motoring Taxes and its Composition
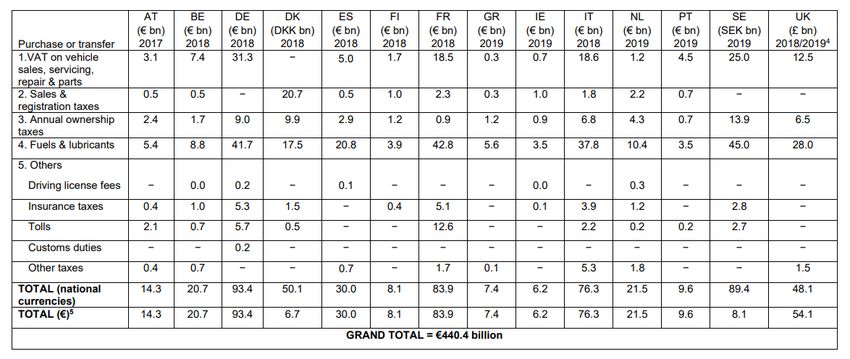
Data for a range of European countries has been collected by ACEA, the European Automobile
Manufacturers’ Association1. They include VAT as a tax on motoring, which could equally be regarded as
a general tax on consumer spending, applicable to almost all categories of goods and services and
accordingly not a recovery of the cost components listed above.
Table 1.1: Yield of Taxes on Road Users, Selected European Countries, in Euros or National Currencies.
Key: AT = Austria, BE = Belgium, DE = Germany, DK = Denmark, ES = Spain, FI = Finland, FR = France, GR
= Greece, IE = Ireland, IT = Italy, NL = Netherlands, PT = Portugal, SE = Sweden, UK = United Kingdom.
Source: ACEA Tax Guide 2020.
1
https://acea.be/uploads/news_documents/ACEA_Tax_Guide_2020.pdf
6

Taxes on motoring are substantial in all these countries. Their composition across countries varies, with
only a few relying heavily on sales and registration taxes. In the next table, the revenue from these taxes
(purchase taxes additional to VAT) is expressed as a percentage of the total.

    Table 1.2: Revenue from Sales and Registration Taxes as a Percentage of Total Motoring Taxes.

      Country             Revenue, Sales and Registration      Revenue, All sources        Percentage

        Austria                          0.5                            14.3                     3.5

        Belgium                          0.5                            20.7                     2.4

        Germany                          0.0                            93.4                     0.0

        Denmark*                        20.7                            50.1                    41.3

        Spain                            0.5                            30.0                     1.7

        Finland                           1.0                            8.1                    12.3

        France                            2.3                           83.9                     2.7

        Greece                            0.3                            7.4                     4.1

        Ireland                          1.0                             6.2                    16.1

        Italy                             1.8                           76.3                     2.4

        Netherlands                      2.2                           21.5                     10.2

        Portugal                         0.7                             9.6                     7.3

        Sweden*                           0.0                           89.4                     0.0

        United Kingdom*                   0.0                           48.1                     0.0

* = national currencies, all others in Euro.

Three countries, Germany, Sweden and the United Kingdom, have no purchase taxes aside from VAT.
Denmark has the highest purchase taxes but does not charge VAT. Ireland is next highest, but also levies
VAT. If VAT and the purchase taxes are combined, adding the first two rows from Table 1.1, Denmark,
Finland, and Ireland are the clear outliers, with 41%, 33% and 27% of motoring taxes levied on the sales
price either as VAT or a registration charge. For ten of the fourteen countries, the percentage collected as
a sales or registration tax (other than VAT) is zero or in single digits.

Collecting revenue at first sale, as VAT or a registration tax, or annually through an ownership tax, affects
vehicle ownership and replacement but does not target vehicle usage. Since the unrecovered social costs
(environmental impact, congestion) are related to usage, taxes on fuel are a better proxy.
7 The ideal tax to target these externalities would be some combination of fuel levies and electronic road pricing or congestion charging. The balance between the taxes affects vehicle ownership and use, and countries, including Ireland, which rely heavily on taxing vehicle acquisition or ownership create incentives for lower levels of ownership accompanied by higher annual mileage by fewer vehicles. There is an additional feature which concerns the used car market. Taxes levied on first sale become embodied in used car prices and the large variations in tax strategy prevent the emergence of a single market in Europe for used cars. If the tax systems come to be harmonised around fuel (or carbon) taxes and direct charges such as tolls, prices on acquisition would differ only due to differences in VAT rates, which are limited. At present there is a strong impediment to the emergence of a normal secondary market in used vehicles, even between neighbouring countries (Denmark and Germany, Spain and Portugal, or Ireland and the United Kingdom) because new car prices differ so much. This is due mostly to registration taxes, not to VAT differentials. Taxation is a ‘national competence’ in the EU structure and the European Commission has been unable to pursue sufficient tax harmonisation to create a truly single market in vehicles for this reason. Cross-border trade is inhibited by requirements to re-register and pay additional taxes, and such trade as occurs in used vehicles tends to be in one direction. This important component in the European single market, the car market, has become balkanised through the inability of the European Commission to make progress on tax harmonisation. Fuel Taxes in European Countries The ACEA report also presents data for January 2020 on fuel taxes. The forecourt price of auto-fuel is heavily taxed in Europe and in some other non-European countries, although there are some, including oil producers, where forecourt prices are below the ex-refinery price due to government subsidies. The principal element in the tax at retail is fuel excise duty but some countries impose separately a carbon tax on energy products (including solid fuels and heating oil) which applies to auto-fuel, as well as VAT. The variation in fuel excise is clear from the next table. Tax competition between fiscal jurisdictions is limited by the capacity of fuel tanks but there is known to be substantial ‘fuel tourism’ in border regions. Of Ireland’s remaining 26 EU partners after the departure of the United Kingdom, 18 have lower excise on petrol and 8 charge more. The highest excise on petrol is in the Netherlands, more than double the figure for Bulgaria. The highest excise on diesel is in Italy, not quite double the lowest EU member, again Bulgaria. Excise duties per litre are generally lower for diesel than for petrol. The ‘discount’ for diesel in Ireland is not exceptional – 12 of the 26 partner countries remaining in the EU have larger discounts when expressed in cent per litre. Importantly the United Kingdom has no discount, nor does EU member Belgium. Virtually all road freight vehicles have diesel engines, and this has influenced the taxation policies of governments. To the extent that road freight is seen as an intermediate input into the export sector there is a logic to a lower rate of tax – countries typically seek to avoid taxes on exports. Petrol demand comes mainly from private cars and the higher rate of tax can more clearly be identified as a consumption tax. However, the recent rise in the popularity of diesel cars has altered this perspective – the preferential
8

treatment of diesel has leaked across into the private car fleet, at one time consisting almost entirely of
petrol-powered vehicles.

                    Table 1.3: Excise on Auto-Fuels, January 2020, in EU Countries.

                                  Excise Duties on fuels in €/1,000 litres

          Country                            Unleaded Petrol              Diesel
          Austria                            515                          425
          Belgium                            600                          600
          Bulgaria                           363                          330
          Croatia                            520                          413
          Cyprus                             429                          400
          Czech Republic                     499                          425
          Denmark                            631                          429
          Estonia                            563                          493
          Finland                            702                          530
          France                             683                          594
          Germany                            654                          470
          Greece                             700                          410
          Hungary                            366                          338
          Ireland                            602                          495
          Italy                              728                          617
          Latvia                             509                          414
          Lithuania                          466                          372
          Luxembourg                         472                          355
          Malta                              549                          472
          Netherlands                        800                          503
          Poland                             383                          337
          Portugal                           643                          488
          Romania                            373                          342
          Slovakia                           555                          393
          Slovenia                           547                          469
          Spain                              504                          379
          Sweden                             619                          438
          EU minimum rates                   359                          330

Source: European Commission, TEDB – ‘Taxes in Europe’ database

In addition to carbon emissions, diesel engines are responsible for low-level emissions which, especially
in cities, are believed to be responsible for reductions in air quality and resulting damage to human health.
In consequence several cities are pursuing policies designed to discourage diesel emissions, including
exclusion of large commercial vehicles in Dublin and a differential congestion charge in London. Some
cities are contemplating a full prohibition, not readily enforceable with current technology, and there have
been calls in many countries for the tax gap between petrol and diesel to be narrowed or closed. It should
9
be conceded that car manufacturers have responded to these concerns and the newer diesel models have
greatly reduced NOx emissions.
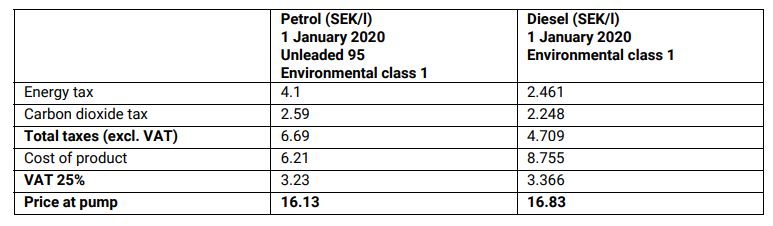
The figure shown in Table 1.3 for Sweden, which has moved further towards a carbon tax system with a
reduced excise component, results in a higher retail price for diesel than for petrol, as explained in the
detailed discussion in the national chapter of the ACEA report2.
Table 1.4: The Build-up of Retail Prices for Auto-Fuel in Sweden.
Swedish pump prices in January were higher for diesel than for petrol, despite the slightly lower carbon
content and lower energy tax, because of the high product cost for diesel at that time. There is now a
diesel glut because of the demand collapse induced by COVID and some technical factors peculiar to the
diesel refining process3.
Closure of the excise differential favouring diesel versus petrol in Ireland has been considered in recent
reports of the Tax Strategy Group (TSG). While worldwide crude prices have recovered from the lows seen
in May, futures markets do not see a major rebound and lower retail prices in Ireland suggest that it is
timely for the TSG to revisit the issue. The matter is considered further in Chapter 5 below.
Charges for Road Use in Europe
No country in Europe has moved decisively to direct charging for the use of road infrastructure, although
there has been some movement in this direction in recent decades. Some roads are tolled for
2
The sheer complexity of motoring taxes in Europe is illustrated by the length of the ACEA report, which does not
treat all the issues comprehensively and yet runs to 314 pages.
3
https://www.hellenicshippingnews.com/swamped-by-diesel-refiners-struggle-with-coronavirus-recovery/10 some or all users, often to fund the private financiers of new schemes as in Ireland but also to ration urban street capacity through cordon charges, as in London, Stockholm, and other cities. More extensive reliance on direct charging is already in evidence across the continent, driven by concerns about traffic management and the imperatives of climate action. The figures shown in Table 1.1 for toll income are incomplete and misleading – the zero entries for Ireland and the United Kingdom are incorrect. Both countries have tolls on some roads and bridges and London has cordon charges for vehicles entering the central area. The countries, according to the figures as shown, with the highest share attributed to tolls are Austria, where the preponderance of through traffic has stimulated political support for tolling; France, where the national motorway routes are tolled; and Sweden, where Stockholm and Gothenburg have cordon charges. Revenue from congestion charging schemes can be substantial – had the COVID downturn not intervened, the London system would have generated over €400 million in gross revenue for the year 2020, most of which is hypothecated to the financial support of bus transport in the city. Acquisition Tax (VRT) in Ireland Ireland’s reliance for revenue on the acquisition tax, called Vehicle Registration Tax (VRT), is not merely an outlier, it is incongruous at a time when the fleet is acknowledged to contain too many older, high- emission vehicles. It is desirable to encourage fleet replacement, ultimately to electric vehicles (EVs) in a country where electricity generation has already been decarbonised and further substantial decarbonisation is feasible and is planned. Ultimate conversion of the fleet to electric propulsion calls into question the even greater reliance in Ireland on fuel taxes, the justification for which consists in part of charging for carbon emissions. As currently structured the VRT is discouraging the purchase of new internal combustion engine (ICE) cars in circumstances where the shift to electric cars has been slow and is not expected to accelerate, on the figures in the government’s Climate Action Plan (CAP), until the end of the decade. In the meantime the practical choice, especially for first-time buyers and for low-income purchasers, is between new ICE cars, where emissions from newer models are decreasing, or used imports from the UK, many of which are five or six years old and even older. The VRT system has resulted, for 2019, in fully one-half of Irish demand met from used imports with higher carbon emissions and including a high proportion of diesel cars which are increasingly criticised because of non-carbon emissions. Ireland has, for its level of economic development and real consumer income, a notably lower rate of car ownership than might be expected and a higher annual mileage per car. The chart shows ownership rates per 1,000 population for 2018. The countries with higher car ownership rates than Ireland include several with annual per capita household income lower, in some cases far lower, than Ireland, including Poland, Estonia, Slovenia, Czech Republic, Portugal, Lithuania and Greece. Not one of the six countries with car ownership below the Irish figure have higher household income: Slovakia, Croatia, Bulgaria, Hungary, Latvia, and Romania are relatively poor countries by European standards. Based on household income, Ireland would be expected to have a car ownership to population
11

ratio towards the top of the European rankings. Instead it ranks 21st out of the EU-27, alongside another
high-income country, Denmark, which also has high taxes on the acquisition of private cars.

Source: Eurostat

Discouraging car ownership is not the same thing as discouraging car use. Emissions, and other indirect
costs such as congestion, derive from car use, not from acquisition or ownership. The Irish VRT system
has also encouraged the importation of used vehicles from the United Kingdom, the only other country in
Europe which drives on the left and thus has the steering wheel on the right. The UK is a far larger market
and the second-hand trade in the UK can readily meet Irish demand for entry-level and less expensive
vehicles. There is a known ‘vintage’ effect in emissions, so a fleet continually replenished with older cars
from the UK will have a slower rate of conversion to the newer, and lower-emission, ICE models.
Discouraging ownership in Ireland, especially of newer cars, is not guaranteed to deliver lower overall
mileage and can result in a fleet whose emission characteristics for ICE vehicles are not improving as
quickly as is possible.

The Irish economy continued its recovery from the financial crash through the period from 2016 to 2019.
It could have been expected that new car sales would expand. Total acquisition of cars, new and used
12

imports, did increase, by about 3%, but the composition moved adversely. Prices to the customer for new
cars have risen by around €3000 at all price points, reflecting increased manufacturers’ prices with VRT
and VAT additions. The effect was to price the cheaper new cars out of the market, and new car sales fell
by 21%, the fall concentrated in the cheaper end of the market.

                              Table 1.5: The New Car Market in 2016 and 2019.

               Customer Price €          Sales in 2016       Sales in 2019         % Change
                less than 20,000            31,363               21,288               -32.1
               20,000 – 25000               30,760               15,325                -50.2
               25,000 - 30,000              31,981               22,690                -29.0
               30,000 - 35,000              26,592               20,988                -21.1
               35,000 - 40,000               9,099               13,769               +51.3
               40,000 - 45,000               5,335                8,137               +52.5
                45,000 – 50,000              4,132                5,287               +28.0
                50,000 plus                  6,997                8,264               +18.1
                Total                      146,259              115,756               -20.9
Source: SIMI

It is in the lower price brackets, especially for models costing up to €30,000 new, that the price increases
were felt. Demand is sensitive to price in this area of the market and sales of new cars under €30,000 fell
by 34,801. Used imports rose by roughly the same amount. It is striking that sales of more expensive cars
rose strongly over this three-year period.

Overall additions, new and used, were about the 225,000 level consistent with fleet replacement but the
composition is unfavourable to the attainment of fuel economy and emission reduction – the median age
of the used imports is high, which means that they are coming from an earlier generation of cars offering
inferior performance.

Manufacturers and distributors maintain that the viability of the market needs to be viewed in the round:
without sales of the more expensive ICE models, the industry does not have the resources to provide
cheaper, low-emission ICE cars, nor to invest in the electric car production capacity for the future.
13
Chapter 2: The Economics of the Climate Action Plan
In July 2019 Minister Richard Bruton TD published the government’s Climate Action Plan4. The document,
prepared by the Department of Communications, Climate Action and Environment, was subsequently
considered by an all-party Oireachtas committee which broadly endorsed its conclusions.5 A first Progress
Report6 on the Climate Action Plan has also been released.
In this chapter it is argued that the Climate Action Plan is an unsatisfactory basis for a cost-effective climate
policy. The analysis underlying the document has not been fully revealed and where it has been made
public is not convincing. The plan needs revision if it is to form the basis for a climate strategy which seeks
out and implements the policies likely to achieve what should be the shared objective of countries around
the world, controlling the climate at minimum economic cost.7
The point of departure for Irish climate policy has been the framework and targets deriving from Ireland’s
commitments as a member of the European Union.
European Union Climate Policy – the Emissions Trading System
The European Union has pursued an active policy to reduce greenhouse gas emissions in member states.
The two most important components have been the ETS (Emissions Trading System) and an agreed set of
national targets for emissions which fall outside the scheme. The ETS is a cap-and-trade system
established in 2005 which allocates emission allowances to firms whose production processes entail the
release of carbon and other greenhouse gases. Sectors covered include electricity generation and many
heavy industries, including paper products, cement and steel. The ETS cover emissions from more than
11,000 power stations and industrial plants in the EU and four neighbouring countries, as well as airlines
that operate within Europe.
Allowances are allocated to firms (mainly free, and ‘grand-parented’, that is, based on historical
emissions) and can be sold if not required, while allowances can be purchased where the firm’s production
volume has risen beyond its allocation. Roughly 45% of Europe’s greenhouse gas emissions is covered by
the ETS, but this figure varies across countries. In Ireland only 29% of total emissions are covered by the
workings of the ETS, leaving 71% to be addressed through national policy. This imposes a differential
burden on domestic policy in Ireland.
The price of allowances is determined daily by supply and demand in a secondary market (the ‘trade’ part
of cap-and-trade), the largest such market in the world, while the European Commission withdraws
4
https://www.dccae.gov.ie/en-ie/climate-action/publications/Documents/16/Climate_Action_Plan_2019.pdf
5
https://data.oireachtas.ie/ie/oireachtas/committee/dail/32/joint_committee_on_climate_action/reports/2020/2
020-01-13_report-on-consultation-on-ireland-s-final-integrated-national-energy-climate-plan-2021-2030_en.pdf
6
https://assets.gov.ie/38342/3c550a8b60574f298a76591d3f565d1e.pdf
7
McCarthy, Colm and Sue Scott (2008): https://www.esri.ie/publications/controlling-the-cost-of-controlling-the-
climate-the-irish-governments-climate-change14
allowances from the market over time (the ‘cap’). The system is designed to limit emissions towards an
ultimate target while permitting companies to make their own decisions along the way, incentivised to
control emissions through fuel and technology choices. If the price of emissions in the secondary market
rose steadily over time towards levels consistent with climate stabilisation, firms would have incentives
also to avoid investment in assets likely to be stranded. Europe is responsible for about 11% of world
emissions, so a successful policy would ideally require all other significant countries, notably China and
the USA, the largest and second-largest emitters, to achieve similar levels of carbon charging. These three
large economic units, China, the USA, and the EU, have been responsible recently for about 55% of total
worldwide emissions.
Estimates of the ultimate price to be placed on carbon (and equivalent greenhouse gases) have been
computed and there is an extensive literature on the matter. Figures in the range €80 to €100 per tonne
are often cited and the necessary ultimate figure could be higher. The ETS has been criticised on the
grounds that there has been an excess of allowances in the market in recent years, resulting in a price
that is too low, and that the price has been unstable, failing to provide a clear signal to those planning
technology investments.
An uncertain future path for the carbon price makes the return on investment uncertain, in contrast to
the alternative to cap-and-trade, a straightforward tax on carbon emissions designed to increase
predictably over time. The history of the traded emissions price, in € per tonne, in the ETS is shown in the
chart.
Chart 2.1: The Price of Emissions Traded under the ETS, € per tonne.
Source: Reuters15
Prices have only recently re-attained the level which prevailed prior to the financial crash. Moreover, the
price has been unstable. Investors who committed to expensive carbon-saving technologies at €30 per
tonne before the financial crash will have regretted their decisions. The ETS has not delivered the
predictable and steady rise in the real carbon price recommended by economists thirty and more years
ago as the best signal to potential investors in carbon-saving technologies. Nor has the system delivered
substantial emission reduction in the sectors covered – the decline after the financial crash was fully
reversed by 2013, the supply of permits facilitating the price decline evident in Chart 2.1 and encouraging
the resurgence in demand.
Chart 2.1: Emissions in the ETS Sector, 2008 to 2019.
The COVID crisis has depressed electricity demand and industrial output in the first half of 2020, resulting
in another price decline and renewed volatility – the closing price for the three-month contract on May
7th was €19.52. Since the COVID crisis became a major concern in February, this contract has ranged from
a high of €25.82 to a low of €14.88.16
Chart 2.3: The Price of Three-Month Emissions Futures.
As recently as August 2017 the five-year contract had traded for several years below €5 per tonne, a
fraction of the price estimated to be the shadow cost of carbon emissions decades earlier. In Ireland, since
the budget of October 2019, the carbon tax was increased from €20 to €26, a figure acknowledged as a
step towards an ultimate figure of €80 to €100 or even more. Cap-and-trade systems where quantity
rather than price is fixed by policy can give rise to instability of this type and the theoretical issues were
first raised in a widely-cited journal article by the American economist, the late Martin Weitzman, as long
ago as 1974.8
Economists have long drawn attention to a series of arguments favouring a carbon tax over the cap-and-
trade model chosen by the EU.9 Carbon tax rates are predictable, encouraging investment in carbon-saving
technology. There is no need for the allocation of emission permits to existing industries and hence no
scope for political favouritism or for the inhibition of new entrants. There are fewer opportunities for
corruption.
Most importantly a carbon tax, if adopted by all economically significant countries, would diminish
demand for carbon-intensive goods and services everywhere and would leave the allocation of
8
Prices vs. Quantities, Martin L. Weitzman, The Review of Economic Studies, Vol. 41, No. 4 (October 1974), pp.
477-491.
9
Nordhaus, W. D. (2008), A Question of Balance: Weighing the Options on Global Warming
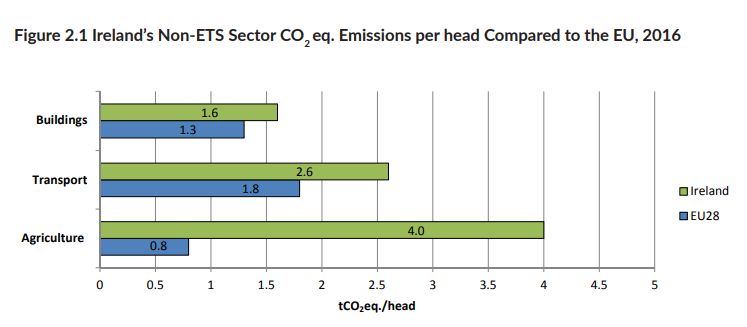
Policies, New Haven, CT, Yale University Press.17 production to play out through international trade and comparative advantage. Enterprise-based allocations of allowances cannot readily accommodate the efficient international division of economic activity. European Union Policy – National Emission Targets For the 55% of emissions arising across Europe outside the ETS sectors, in areas such as transport, heating and ventilation of buildings, and agriculture, the EU has pursued a policy of national targets for each member state. The ETS targets are pan-European and, at least in principle, the ETS does not discriminate between member states. The non-ETS sector, where emission reduction is to be attained through quantified national targets, has great potential to disfavour those states most exposed to the process of target selection. Ireland is one of those states – only 29% of Irish emissions are in the pan-European ETS, with 71% covered by the allocated national target. The high share of non-ETS emissions in the Irish total is illustrated in this chart from the CAP document. Irish emissions for buildings and transport, measured on a consumption basis, are somewhat above the EU average. But the main explanation for Ireland’s status as an outlier in the EU is the figure for agriculture. Agricultural emissions are measured on a production basis, and most Irish food output is exported to Europe and around the world. On a consumption basis, per capita emissions in all categories, in Ireland and in other high-income EU countries, are likely to exceed the European average. For buildings and transport, Irish people are responsible, as consumers, for 1.1 tonnes of ‘extra’ emissions per annum, or 35% above the EU per capita average of 3.1 tonnes. But the excess for agriculture, this time measured on a production basis, is three times the combined excess for buildings
18

and transport at 3.2 tonnes. Irish people are responsible, on the figures as measured according to the EU
methodology, for five times the EU average per capita emissions from the farm sector.

Most of the apparent excess of per capita emissions in Ireland arise from the treatment of agriculture,
which is measured on a production basis, thus including emissions which relate to consumption elsewhere
in Europe and beyond. This calculation, regularly reproduced without reference to the method of
measurement in official documents and media commentary, is no more than a confirmation that Ireland
is a successful producer of farm produce. The country has a low population density, advantages of climate
including rainfall, plentiful productive farmland and hence an agricultural surplus exported to countries
whose endowment of soil and climate are less favourable to agricultural production.

The EU policy of national targets for the non-ETS sectors, of which there have been several iterations, has
attracted criticism on the grounds that base-years are arbitrary, the selection of targets is unsystematic,
and the measurement of emissions is a mish-mash of production-based and demand-based
methodologies. The crucial weakness is the territorial basis of the chosen targets. The economist Dieter
Helm, noting recently that the COVID pandemic brings only a temporary pause to emissions growth, puts
it thus:

‘The key flaw in the EU and UK net zero ambitions - which the pause should be used to address - is the
focus on unilateral territorial production targets. The flaw results in raising the incentive to switch from
home production to imports of high carbon intensive goods and services. The correct target if the aim is
to cease being a cause of global warming, is consumption, not production. It is simply not true, as the UK
Climate Change Committee claims in its 2019 Net Zero Report, that: “By reducing emissions produced in
the UK to zero, we also end our contribution to rising global temperatures”.’ 10

The national emission targets which provide the point of departure for the Irish government’s Climate
Action Plan are subject to the same criticism. It is true that if all countries achieve net zero on a production
basis then the world achieves net zero. But that is also true if every country achieved net zero on a
consumption basis, and it is not even necessary that every country reach net zero on any basis, only that
the planet should do so. Indeed, it is highly improbable that an optimal worldwide allocation of a net zero
planetary target would imply net zero in each of the world’s approximately 200 national territories. While
the Kyoto and successor international accords, culminating in the Paris Agreement ratified in October
2016, specify national emission targets, they are voluntary and unenforceable. Countries can ignore the
targets or withdraw from the agreement, as the USA has done. The EU targets are binding on member
states who cannot withdraw a la carte from EU policies, and there are penalties for non-compliance.

The EU’s targets are calculated relative to a base year, originally to base 1990. Voluntary target-setting in
Kyoto and successor worldwide agreements has followed the same template. Whatever year is

10
  http://www.dieterhelm.co.uk/energy/climate-change/climate-change-has-not-gone-away-cop26-net-zero-and-
the-coronavirus/
19

chosen, subsequent fortuitous events will render the targets sub-optimal. Russia saw a steep recession
through the 1990s after the collapse of the Soviet Union while China enjoyed an unprecedented boom.

Russia easily met its reduction obligations while Chinese emissions grew rapidly. Not surprisingly countries
have felt that these targets, relative to a distant base year, are not binding when circumstances change
as they invariably do over the time-horizon of plans lasting a decade and more. Fast-growing economies
have undershot their commitments while countries suffering economic setbacks have claimed credit for
unearned emission reductions. Any policy of quantitative reduction targets is arbitrary in this sense. The
1995 Kyoto agreement and its influence on the design of EU policy attracted this criticism in the 2008 ESRI
McCarthy and Scott report:11

‘…..any base-year approach penalises fast-growing economies and those which were energy-efficient in
the base-year. It benefits slow-growth economies, thus encouraging a spatial misallocation of economic
activity, and rewarding those, such as Russia, which were energy-inefficient in the base-year. This partly
explains why Russia joined and the USA did not. By contrast tax-based policies avoid the need for
quantitative baselines altogether.’

The same report notes that the constancy of percentage reduction targets over any long period can also
lead to sub-optimal outcomes: least-cost technologies become available discontinuously and the best
path for ultimate reductions may involve unequal annual emission cuts, an important consideration with
the deployment of new technologies such as electric road vehicles.

The European Commission has powers to impose penalties for non-compliance, so the process of target-
setting has serious potential consequences. That process has been opaque, and it is not clear that cost-
minimisation, at national or European level, has been the driving concern. The measurement of each
member-state’s emissions has also been the target of criticism. Some of the non-ETS emissions are
measured by consumption, some by production, and the methodology of measurement has not been
favourable to some members, including Ireland. The production-side measurement of emissions in sectors
such as agriculture involves a potentially perverse attribution of responsibility for emission reduction and
conflicts with both efficiency and fairness.

Ireland’s Emission Reduction Targets

Data from the Environmental Protection Agency12 show adverse recent trends in Ireland’s emissions in
the non-ETS sector, the largest portion, whose reduction under the EU’s Effort Sharing Regulation (ESR)

11
  https://www.esri.ie/publications/controlling-the-cost-of-controlling-the-climate-the-irish-governments-climate-
change

12
     https://www.epa.ie/ghg/currentsituation/
20
is a national responsibility and the focus of public policy in each member state. Emissions in the ETS sector,
while an EU-wide rather than a national policy target, are relevant indirectly, in that rising ETS emissions
can inhibit the feasibility of compliance in the non-ETS sector or can increase the costs of compliance.
Any cumulative failure to meet non-ETS targets by specified dates such as 2020 and 2030 triggers financial
penalties for the transgressing EU member.
Chart 2.3: Actual and Target non-ETS Emissions, Ireland.
Targets are cumulative: a state which exceeds the ceiling for a given year must reduce emissions faster in
later years to avoid penalties. Non-ETS emissions in Ireland were below target in the three years 2013,
2014 and 2015 during recovery from the financial crash but have exceeded target by increasing amounts
in 2016, 2017 and 2018. It is expected that 2019 will have seen a further overshoot – the data are not yet
available – but emissions will likely have fallen again in 2020 due to the COVID shutdown of economic
activity.
The CAP, released in July 2019, pre-dates the shutdown and identified a likely failure to meet both 2020
and 2030 non-ETS emission ceilings. The excess for 2020 will now be lower (bear in mind that it is the
cumulative figure which matters, not just the once-off annual figure for 2020) but the projected growth
in emissions to 2030, and consequent overshoot, could nonetheless materialise with post-COVID
recovery.
The next chart is also taken from the CAP document and compares projected emissions to the EU target
in the dominant non-ETS sector – projected emissions in the ETS sector do not have to meet a national-
level target.21 From 2021 Ireland’s emissions from the non-ETS sector, a higher portion of the total than elsewhere in the EU, are required to decline substantially to 2030. A steady increase is instead projected, resulting in a growing overshoot and a compliance requirement for remedial action. The emissions in the ETS sector are also expected to rise, despite ambitious plans for renewables to achieve further displacement of high- carbon sources in power generation. The CAP translates these projections of excess emissions into the overall cut needed in the non-ETS sector. No domestic response is required to the projected growth in ETS emissions – the rise in this sector (power generation and heavy industry) is seen as taking care of itself, a European rather than an Irish concern. The CAP states: ‘..... over the entire 2013 to 2020 period Ireland is projected to cumulatively exceed its compliance obligations by between 16.3 MtCO2eq. and 17 MtCO2eq. Some of these have already been acquired.’ Since the 2020 excess will be reduced by the COVID downturn, the amount of allowances to be purchased by Ireland to cover past overshoots will be less than had been feared and neither the quantity nor the price of allowances already purchased to cover the gap is publicly available.
22

The Selection of Measures Proposed in the Climate Action Plan

The CAP identifies measures under a range of headings designed to accelerate emission reduction,
additional to those which would have arisen as the National Development Plan (NDP) unfolded. These
measures were intended to secure a reduction in Ireland’s projected non-ETS emissions, but it would have
fallen short of the EU targets.

In the discussions about government formation between the Fianna Fáil, Fine Gael and Green parties, the
annual target for emission reduction in Ireland, which corresponds to the non-ETS figure, was became an
issue, with reports that the Greens favoured the annual 7% reduction finally adopted while a reduction of
2% was envisaged in the CAP. There is a big difference over a ten-year time horizon – if 2020 non-ETS
emissions turn out to be around the 2018 figure of 45 million tonnes, a decade of 2% annual decline would
yield a 2030 figure of 37 million, an 18% cumulative cut, but an annual reduction at 7% would reduce
emissions by 52% to just 22 million. While the measures identified in the CAP would not be adequate to
achieve the 7% annual reduction, there are grounds for concern about the cost, feasibility and efficiency,
including carbon efficiency, of the measures now included in the draft Programme for Government.

The principal driver of the measures selected in the CAP is a report from the consultants McKinsey for the
Department of Communications, Climate Action and Environment. A passage on page 31 proclaims:

‘This Plan identifies the pathways that will create the least burden, while also offering the most long-term
opportunities and benefits’ and elsewhere states:
23

‘An important factor in choosing policies to deliver the 2% per annum reduction is a realisation that in the
period between 2030 and 2050, a much steeper decline of 7% per annum will have to be achieved based
on achieving a minimum 80% emissions reduction by 2050, relative to 1990. One important implication
of this for the period to 2030 is to ensure that all investment choices make sense in terms of decarbonising
by 2050, and we avoid creating stranded assets by choosing what may appear to be cheaper options in
terms of our 2030 decarbonisation goal.’

The full report from McKinsey (MACC) has not been released – only a slide presentation of its findings
from the Department, lacking technical detail, has been made available. Some aspects of the CAP appear
not to be fully aligned with the summary McKinsey findings and we consider this aspect in Chapter 6. It is
not possible, without access to the full McKinsey document, to assess whether the measures chosen in
the CAP are likely to yield the targeted emission reductions at least-cost. In several important sectors
there are reasons for doubting whether this is the case. Moreover, there are doubts whether certain of
the key policies are capable of implementation as envisaged. The Climate Action Plan includes elements
which may not be desirable, may not be feasible, or both. Three components of the CAP illustrate these
concerns, the proposals for electricity, transport, and agriculture.

Electricity Generation and Transmission in the CAP

The unpublished report from McKinsey is claimed, in the CAP, to have located least-cost pathways to the
emission reduction targets. However, the CAP document admits, on page 34, that:

‘The MACC does not address the cost of enabling infrastructure (e.g. the Electric Vehicle (EV) charging
network, and the electricity infrastructure such as offshore wind connections, transmission and
distribution, and system services), or other barriers to change. Much of this enabling infrastructure is
already required to support current decarbonisation targets and has already been identified in Project
Ireland 2040. In addition, the cost of infrastructure does not grow in line with increasing decarbonisation
ambition. Furthermore, sensitivity analysis, conducted in preparation of the MACC and targets, confirms
that the same scale and pace of technology deployment would be required for targets under this plan
even if the cost of infrastructure was added to the cost of the relevant technologies.’

In the absence of detailed costings, it is impossible to evaluate the credibility of these assertions. A
report13 released in March 2020 by the Irish Academy of Engineering estimated that the investment bill
for the ETS sector, including generation, transmission and distribution capital costs, would reach €20
billion, some of which would be private investment in renewables and some would be investment by the
state companies Eirgrid and ESB Networks, the cost of which would be postalised across all electricity
consumers. Aside from direct support via the REFIT price guarantee scheme, being replaced by an auction
system, renewables generators enjoy a cross-subsidy from electricity consumers through below-cost
charges for network augmentation occasioned by their developments.

13
     http://iae.ie/publications/ideas-for-programme-for-government/
24
The strong growth in the requirement for electricity network investment is driven largely by two factors,
the 70% target for the share of renewables in the generation mix and the planned growth in the facilitation
of data centres in Ireland. Extra onshore and offshore wind and solar farms will require extensive provision
of high voltage transmission lines and interconnectors, as will supply to data centres, major gobblers of
electricity which have been accommodated to a surprising extent in Ireland. The capacity of the data
centres already here exceeds substantially any demand arising in Ireland, so the country has chosen to
become an exporter of data management and hence of electricity, the main input. It is not explained in
the CAP why such a large proportion of Europe’s demand for data management has chosen Ireland. In the
ordinary course of events it would be expected that northern European countries would enjoy a large
share of data centre provision, since temperature control is more readily facilitated. But the decisions to
locate in Ireland on such an extraordinary scale (29% of power demand is expected by Eirgrid to come
from data centres within a few years) may also have their motivation in the failure to require full costs,
including infrastructure costs, from the data centre companies.
If there is any overall constraint on the construction of windfarms and solar generation facilities, their
contracted supplies to data centres, a feature of the public communications strategy of several data
centre operators, diminishes the availability of low-carbon power to the non-ETS sector. The extensive
Irish commitment to data centres could have a cost to consumers generally, through penalties for non-
compliance with national targets or extra costs of non-ETS emission reduction.
The CAP commits to an ambitious target for renewable penetration in the power generation sector and
Ireland’s current substantial fleet of windfarms has been assembled at considerable cost in support
payments whose burden falls on electricity customers. Economists have drawn attention repeatedly to
the so-called ‘waterbed effect’, which they regard as a design flaw in European policy, see Pahle et al
(2018).14 When someone sits on a waterbed, depressing its height at that location, the water goes
somewhere else, raising the height at another point. So it is with the ETS: a country which expands
renewables will have spare allowances and these will be traded away to emitters elsewhere. An efficient
ETS system with a declining overall Europe-wide emission ceiling would adequately incentivise low-carbon
technologies without ad hoc subsidy schemes, it is argued. On this view, exceptional effort to expand
renewable power in countries like Ireland facilitates the retention of coal-fired capacity in Poland and
Germany, without any beneficial impact on overall European emissions.
Cost is not the only concern with the CAP targets for the electricity industry. The enormous roll-out of
windfarms and solar units envisaged will necessitate a major programme of upgrading to the transmission
network. The construction of new high-voltage lines in Ireland has been controversial and no new lines
have been completed in recent times. The interconnector with Northern Ireland, planned almost twenty
years ago, has finally received clearance after a Supreme Court appeal in the Republic but has faced delays
in Northern Ireland and construction has yet to commence. The onshore transformer station for the
Ireland-France interconnector in county Cork is being opposed vigorously by residents’ groups and there
is active community opposition to many other projects around the country.
14
https://www.strommarkttreffen.org/2018-04_Pahle_Preserving_the_environmental_integrity_of_EU_ETS.pdf25 The Proposals for Transport The central proposal is to ‘Accelerate the take up of EV cars and vans so that we reach 100% of all new cars and vans being EVs by 2030. This will enable achieving our target of 950,000 EVs on the road by 2030. This means approximately one third of all vehicles sold during the decade will be Battery Electric Vehicle (BEV) or Plug-in Hybrid Electric Vehicle (PHEV)’. Only zero emission vehicles would be available for sale after 2030. Motor industry experts are doubtful that any widespread take-up of electric cars is feasible in the years immediately ahead. Even with the €5,000 grant and remission of vehicle registration tax, electric cars are not price competitive and manufacturers’ prices are unlikely to fall significantly until production at scale becomes feasible. This may not happen until the mid-2020s and the intermediate CAP target of 180,000 on the road by 2025 is optimistic. At present the Tesla 3, a popular model in Ireland, costs €47,000 for the basic version, after subsidies. The volume new car market is located at a price point closer to €30,000. The availability of fast chargers around the country is a serious constraint on take-up. The grant to the ESB of €10 million from the Climate Action Fund15 last year will finance fast chargers at a total of 140 locations, which compares to 1,500 filling stations nationwide for petrol and diesel. Fast chargers can deliver about 100 kilometres of driving range in six minutes, according to the ESB. Until this level of service reaches availability comparable to the filling station network, the attractions of electric vehicles for non-urban drivers will be limited. Vehicle registration data by county is a poor indicator of the geographical spread of car ownership and use – buyers in some rural counties, as well as fleets, often opt for a D (Dublin) registration number, distorting the figures. But data is available from CSO on car kilometres travelled by county and the Sustainable Energy Authority of Ireland has kindly provided data on the take-up by county of the €600 grant for home chargers. The pattern is as shown in the table. 15 https://www.dccae.gov.ie/en-ie/news-and- media/publications/Documents/38/Low_Emission_Vehicle_Taskforce-Phase2Report.pdf
26

                  Table 2.1: Electric Car Ownership and Annual Kilometres by County.

           County                         Electric Car Ownership-         Annual Car Kilometres-

                              % of National Total             % of National Total

                 Dublin                                37.5                              21.3

                 Kildare                                6.7                               4.9

                 Meath                                  6.0                               4.2

                Wicklow                                 5.4                               3.2

                 All Others                            44.4                              62.2

                Total                                100.0                              100.0

                East Region                           55.6                               37.7

Sources: CSO, SEAI

The take-up of electric cars in Ireland has been limited but has also been in the wrong places – average
kilometres driven per car in Dublin is only 68% of the figure for Leitrim, whose drivers do the highest
annual total. Moreover, Dublin has a low car ownership rate – the central area and inner suburbs have
the lowest car ownership rate in Ireland. As a result, Dublin’s share of national car kilometres is only 21.3%.
The East region (Dublin plus the adjoining counties of Meath, Kildare, and Wicklow) has 55.6% of the
country’s electric cars but accounts for just 37.7% of national car kilometres. In terms of bang-for-a-buck,
the subsidies to electric car purchasers are bad value – the high-mileage motorist in Leitrim or Roscommon
is the best target, but the uptake in rural counties is much lower than in Dublin.

There is a chicken and egg problem – fast chargers have substantial capital cost but will deliver little
revenue until electric cars are widely adopted. Adoption is inhibited by the current sparse coverage and
rolling out a loss-making network is unattractive to commercial operators. One option, not considered in
the CAP, would be to encourage ESB to roll out a fast charger network ahead of demand in the rural
counties, recovering the losses through a regulated addition to electricity bills. There is a commitment to
review policy in the draft Programme for Government just released.

If the electric car targets are unrealistic, the practical option for the years immediately ahead is the re-
casting of motoring taxes in a manner designed to encourage fleet replacement with more fuel-efficient
petrol and diesel models.
27 Agriculture in the Climate Action Plan Ambitious targets have been set for the reduction of emissions in agriculture based on the perception that agriculture’s share in total Irish emissions is unusually large, which as we have seen reflects the production-side measurement methodology. It is also based in part on the recent increase in the national herd and there have been suggestions that a lower herd might eventually become a policy objective. As with other elements in the CAP, it is not clear that the measures for agriculture will deliver least-cost emission reductions either at Irish or European level. The EU system of milk quotas was abolished from April 2015. Prior to this date farmers had to constrain milk output to an allocated figure. The quota system had arisen initially to curb excess production enabled by intervention at politically determined prices, resulting in butter mountains, wine lakes and ultimately extensive reforms in agricultural policy. The quota abolition made it feasible for the more efficient farmers to expand production and the biggest beneficiary has been Ireland. The EU Milk Observatory provides data16 which permit analysis of the pattern of response to quota abolition. For the EU-28, output of cows’ milk has grown at 1.3% per annum or by 5.5% over the period from the final quota year of 2014 to 2018, the most recent year for which the figures are available. In Germany, France, Italy and the United Kingdom, four large countries which between them had been producing about 55% of the European total, the quota abolition has had little effect. There has been a significant increase in two medium-sized producers, Poland and the Netherlands, but the stand-out dairy sector has been Ireland, which has overtaken Spain with a 35% output increase in just four years. The implication is that the quota system was holding back production in Ireland. Since the intention of the reform was to remove the quantity constraint and rely instead on market forces to re-allocate activity, the new allocation must be assumed to reflect superior economic efficiencies in those countries where output has increased fastest. 16 https://ec.europa.eu/info/sites/info/files/food-farming-fisheries/farming/documents/eu-dairy-historical- production-stocks-series_en.pdf
You can also read