Environment and Innovation - Ofgem Report 2017/18 - Western Power Distribution
←
→
Page content transcription
If your browser does not render page correctly, please read the page content below
Environment and Innovation
Ofgem Report 2017/18

Executive Summary                                                                                                                                             2
WPD’s Environment and Innovation
Report aims to provide all of our                     Environmental highlights                                Challenges
stakeholders with a transparent and                               • R
                                                                     e-certification and transition to the
public account of our environmental                                 new ISO14001:2015 environmental
and innovation performance over the                                 management standard across the
last twelve months.                                                 WPD network
                                                                  • Roll-out of SF6 camera detection
We will use this report to provide an all-inclusive                 equipment across the business
                                                                                                              • Maintaining and improving progress
overview that includes clear justification for our                • Reduction in our Business Carbon
                                                                                                                 in RIIO-ED1 business environmental
actions and the benefits to our customers.                          Footprint
                                                                                                                 outputs
                                                                  • Significant reduction in office
                                                                                                              • Further reducing the tonnage of waste
Reducing our impact on the environment                              energy use
                                                                                                                 we produce and finding alternative
and embracing the increase in low carbon                          • Decrease in the overall tonnage              disposal routes other than landfill
technologies is one of our key RIIO-ED1                             of waste we produce
                                                                                                              • Maintaining and developing our
outputs. To this end throughout 2017-18                                                                          ISO14001:2015 certification
we have achieved the following improvements:
                                                                                                              • Ensuring our environmental performance
                                                                                                                 and compliance record is maintained
                                                      Innovation transition highlights
                                                                                                              • Investment in smart enabling solutions
                                                                  • 1.4m miles driven as part of our          • Large scale adoption of low carbon
                                                                    Electric Nation project                      technologies (LCTs) by customers
                                                                  • Over 120km of network assessed f          • Providing visibility of network congestion
                                                                    or losses optimisation                    • Forecasting future energy volumes
                                                                  • Over 1,610 users of the Carbon               across the network
                                                                    Tracer App and growing                    • Driving value from the smart
                                                                  • Over £3m of innovation work                  meter programme
                                                                    completed through UK SMEs
                                                                  • New seasonal boundaries for OHL
                                                                    capacity identified
Contents                                                                                                      3
1.0 Introduction                                   Appendices

1.1 Who we are and what we do                 4   Appendix A
1.2 Our network                               5   East midlands RRP environmental innovation 2017/18   58
1.3 Improvement opportunities                 6   South wales RRP environmental innovation 2017/18     58
1.4 Stakeholder engagement                    7   South west RRP environmental innovation 2017/18      58
                                                   West midlands RRP environmental innovation 2017/18   58

2.0 Managing our environmental impact              Appendix B
                                                   RRP Environmental innovation commentary 2017/18      58
2.1 Introduction                             10
2.2 Protected Landscapes                     10
2.3 Oil leakage                              12
2.4 Carbon impact and climate change         14
2.5 Other environment related activities     29

3.0 Smart grids, innovation and our
role in the low carbon transition

3.1 Introduction                             39
3.2 Progress of the innovation strategy      40
3.3	Roll-out of smart grids and Innovation
     into business as usual                  46
1.0 Introduction                                                                                                                  4
1.1 Who we are and what we do

We are one of the six Distribution
Network Operators (DNOs) who
deliver electricity to homes and                                                                        Nottingham
businesses across England, Wales and
Scotland. Our network, which serves
7.9m customers, is the largest in the UK,                                            Birmingham   Coventry
operating from the Lincolnshire coast,
across the Midlands, South Wales and
the South West to the Isles of Scilly.
                                                                           Cardiff
Our four key business tasks are:
1. O perating our network assets to ensure we                                       Bristol
    ‘keep the lights on’ for all of our customers
2. Maintaining the condition and therefore
    reliability of our assets
3. Fixing our assets should they get damaged
    or if they are faulty
4. Upgrading the existing network or building
    new ones to provide additional electricity                  Plymouth
    supply or capacity to our customers

Our role is simple
We are not a supplier. We do not buy and sell
                                                     Isles of
                                                     Scilly
                                                                                                        7.9M
                                                                                                         Our network, which
electricity, or directly bill customers. Our costs                                                       serves 7.9m customers,
account for around 18% of an average annual                                                              by area in the UK
domestic electricity bill which customers pay
to their supplier.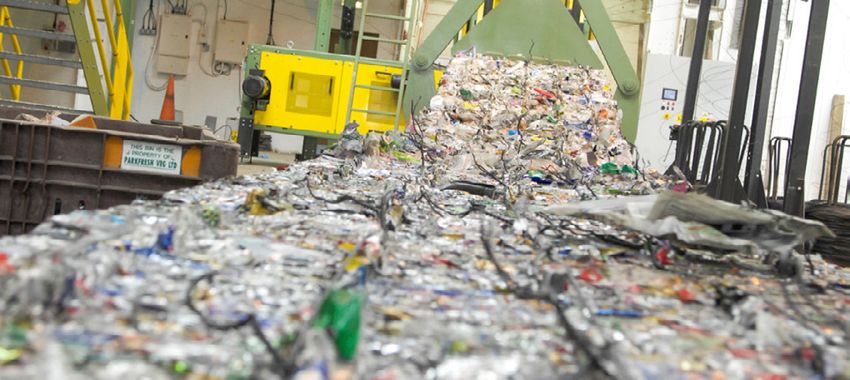
1.0 Introduction                                                                                                                                 5
1.2 Our network

The electricity network we operate includes:                                                                               Low carbon Low carbon
                                                       Transferred at 275,000v or        Voltage reduced in
                                                      400,000v around the country       order to supply loads              generation technologies
• Transformers that convert electricity from one
  voltage to another
• Underground cables and overhead lines that
  carry electricity across long distances
• Switches to turn the electricity on or off, or to
  alter its route
• Service connections to take the electricity into                                           Western Power Distribution
  customers’ premises
• Our network sits between the National Grid
  transmission network and the end customer

 Asset Type            Units    WPD Total
 Overhead lines        Km       90,000

 Underground cable     Km       135,000                 Power         Transmission                                                      Supply
                                                                                               Distribution Network
                                                      Generation        Network
 Transformers          Each     181,800

 Switchgear            Each     299,000
                                                      GBSO (National Grid) currently responsible for real-time            Electricity
 Poles                 Each     1,374,000             management/co-ordination of generation and demand                     meter

 Towers (pylons)       Each     15,000

 Customer numbers      Each     7,900,000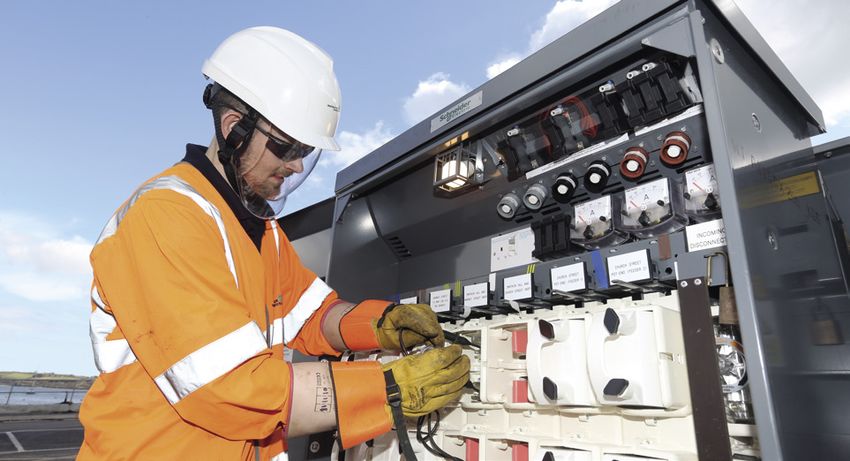
1.0 Introduction                                                                                                                                                     6
1.3 Improvement Opportunities
                                                  A reduction in technical network losses
We are committed to ensuring
                                                                        • Installing oversize transformers when replacing assets at highly loaded locations
that we meet all of our compliance
                                                                        • Using larger sized cables when installing new network in Low Carbon Technology
obligations while minimising the
overall impact that our activities                           £            (LCT) hotspots
                                                                        • Undertaking innovation projects specifically related to technical losses
have on the environment in which
we work and operate.

Wherever possible we aim to adopt best            A reduction in our carbon footprint
practice to continually improve on our
environmental performance.                                              • All replacement vehicles to have lower CO2 emissions than those they are replacing
                                                                        • Ensuring all new or refurbished WPD buildings achieve a minimum rating of ‘Excellent’
As such during RIIO-ED1 we have committed                                 for new build and ‘very good’ for refurbishment under the BREEAM* rating
to achieve the following environmental                                  • Reducing the amount of waste we produce and send to landfill
improvements (outputs) throughout
our business:

                                                  Reduction in the leaks from our equipment, specifically;

                                                                        • The volume of oil lost through leaks from fluid filled cable
                                                                        • The volume of SF6 gas that is lost from switchgear
                                                                        • Installing effective oil containment ‘bunds’ around plant containing high volumes of oil

                                            *
                                                Building Research Establishment Environmental Assessment Method
1.0 Introduction                                                                                                             7
1.4 Stakeholder Engagement

Engagement with stakeholders is
core to WPD’s operations. We
continue to identify opportunities for
improvement and ensure our resulting
outputs are appropriate, efficient
and measurable.

Stakeholders attending our events say they
engage with us because we act on their
feedback. One example of this is our annual
workshops, which hosted 250 stakeholders
at six events in 2017/18. We were able to engage
with them on the appropriateness of our current
Business Plan outputs including fifteen actions
under the ‘environment’ banner.

Stakeholders also discussed the outcomes they
wanted to see achieved in RIIO-ED2 (our next
price control period). Many expressed a keen
interest in seeing investment in innovation,

                                                                                                     250
                                                   Stakeholders were asked to decide how we
particularly storage, smart metering and a         should address a number of key issues including
sustainable network, and a sizeable majority       changes in our flood risk planning and the use
focused on environmental issues like the           of electric vehicles.
decarbonisation of energy and sustainability.                                                        Stakeholders at six
                                                                                                     events during 2017/18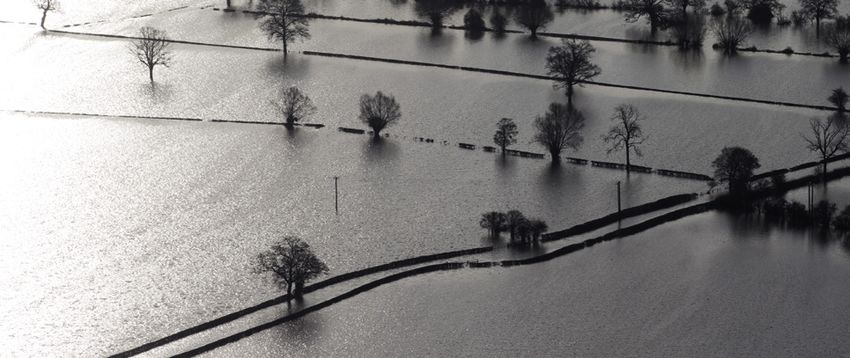
1.0 Introduction                                                                                                                                                          8
Flood Risk Planning                                    Electric Vehicles                                            69% of stakeholders voting wanted new
                                                                                                                    measurable outputs for electric vehicles
On a scale of 1-10, stakeholders ranked the            On a scale of 1-10 stakeholders ranked the issue
                                                                                                                    immediately rather than waiting for RIIO-ED2:
issue of changes in flood risk planning                of electric vehicles (for WPD to address) as 7.9/10.
(for WPD to address) as 7/10.
                                                                                                                    Stakeholders also said:
                                                       Stakeholders were asked:
Stakeholders were asked:
                                                                                                                    • Charging capacity in domestic properties
                                                       Should we have a specific output related to
                                                                                                                      may become redundant as the future of
Should we amend our ED1 outputs to reflect             electric vehicles, e.g. ‘XX number of charging
                                                                                                                      electric vehicles might not be in individual
any agreed changes in flood planning or do             points installed’? Should we demonstrate how
                                                                                                                      car ownership.
we address this within ED2?                            we have mitigated the impact of changes in
                                                       demand as a result of increasing electric                    • Electric vehicle charging should be in wide
Almost half of those stakeholders voting across        vehicle charge points?                                         bays near substations.
the six events felt that flood risk planning should                                                                 • WPD could consider incentivising drivers
continue to sit within the current Business Plan                                                                      to charge their cars in such locations.
Framework.

Fig. 1.4a Flood risk                                                                   Fig. 1.4b Electric Vehicles

 It is something for WPD to                                                            It is something for WPD to
   be mindful of and have a                                                              be mindful of and have a
plan to address, but within                                                           plan to address, but within
  the current Business Plan                                                             the current Business Plan
                 framework                                                                             framework

                                                                                               It requires new,
It requires new, measurable
                                                                                            measurable outputs
        outputs immediately
                                                                                                   immediately

                                                                                                It requires new,
It requires new, measurable
                                                                                                     measurable
        outputs in RIIO-ED2
                                                                                            outputs in RIIO-ED2

                              %                                                                                      %
                                   10

                                            20

                                                      30

                                                              40

                                                                       50

                                                                                                                             10

                                                                                                                                   20

                                                                                                                                          30

                                                                                                                                                 40

                                                                                                                                                       50

                                                                                                                                                              60

                                                                                                                                                                     70
1.0 Introduction                                      9
Losses and Innovation
Losses are a function of network usage and we
expect the network to be used more in the future
as a result of The Carbon Plan (e.g. due to the
increased use of electric heat pumps and vehicles).
We have already begun to prepare for this change
by installing larger cables and transformers.
In addition to making ‘engineering’ changes
to our network a number of innovative projects
will be undertaken to ensure we prepare for
this change.

For example, working with Manx Utilities we are
undertaking the first UK initiative to measure
losses on the network. We are currently recording
losses of less than 5% of total energy distributed.

Key themes and issues raised by stakeholders
on losses and innovation at our annual
workshops included:

• New developments should all have three-phase
  supply available.
• WPD should encourage competition or
  collaboration between DNOs to reduce losses.
2.0 Managing our environmental impact 10
2.1 Introduction While overhead lines are widely accepted as The £7.6m is the total for our four licence areas
being part of the countryside, there are a number for eight years and is split according to Ofgem’s
All of our operational activities have of protected landscapes, including National Parks allowance caps for each electricity network
and Areas of Natural Beauty (“AONB”) across licence area across England and Wales as follows:
the potential to impact upon the
our geographical footprint where removing
environment. As a certified ISO14001 our overhead lines and replacing them with • West Midlands: £2.3m
operating organisation our robust underground cables would visually improve • South West: £3.0m
environmental management system matters. We coordinate the undergrounding of
• East Midlands: £0.9m
ensures that any risk to the environment overhead lines with established steering groups
• South Wales: £1.4m
is minimised and that as a company we consisting of representatives from AONBs and
continually improve how we manage all National Parks who help us identify and prioritise
where work will take place. We provide The work carried out by licence area is as follows:
environmental aspects associated with
information and appropriate assistance to
our operational activities. stakeholders to help them in scheme selection Table 2.2 – Undergrounding in National Parks
including budget costing and feasibility and AONB’s (km)
assessments. The years in which funds are spent
Target Completed
2.2 Protected Landscapes are dependent on the views of the steering
for RIIO-ED1 (to date)
group, and the timescales needed to develop
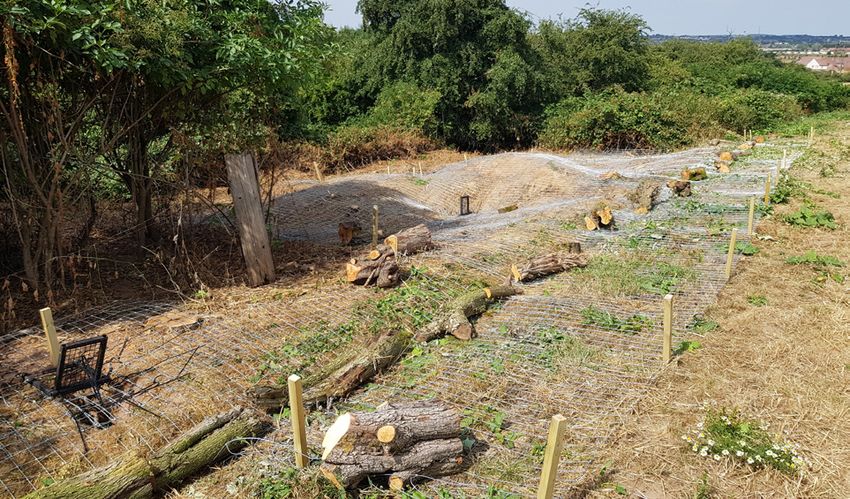
We operate 90,000km of overhead and implement the schemes. West Midlands 14 7.9
lines predominantly in rural locations.
As part of the Ofgem-approved voluntary
East Midlands 10 5.3
initiative, following stakeholder engagement
and feedback, our approved business plan for
the regulatory period 2015-2023 includes a total South Wales 10 1.3
sum of £7.6m for undergrounding of overhead
lines in National Parks and AONBs. South West 21 2.2
WPD Total 55 16.72.0 Managing our environmental impact 11
2.2.1 Scheme selection and engagement/
consultation • Our stakeholders consider the best use of • The selection criteria for projects in each
• We believes that projects should be selected the funds available when selecting projects. WPD region is discussed and agreed by
by stakeholders/interest groups. We implement Usually, but not always, this means focusing the Steering Groups for those areas.
these projects within the regulatory rules and on ‘iconic’ sites.
take into account any technical or planning • The Steering Group discusses and agrees
constraints (such as consents or environmental/ • Steering Groups are encouraged to ensure which projects are to be put forward for
planning restrictions). that National Parks or AONBs which have implementation with reference to a Visual
previously had little or no investment are Amenity Impact Assessment Form. our
• The principal groups concerned with project encouraged or assisted to bring schemes employees do not participate in any voting.
promotion, selection and also stakeholder forward. The Steering Groups may need
engagement are the National Parks and to decide the level of funds to be allocated
• Stakeholder feedback, like comments from
AONBs in our area, along with affiliated to these areas, using a fair and pragmatic
parish councils for example, is encouraged
organisations (for example ‘friends of’ groups) approach.
and collated. It is one of the criteria the
and other stakeholders/interest groups such Steering Groups consider when selecting
as environmental organisations (CPRE, • Depending on the location and terrain, the schemes and allocating funds.
Natural England, Natural Resources Wales). time to implement a project can vary greatly.
For example, village projects with low voltage
Across all four of our licence areas, with our
• Our principal stakeholders select projects lines or sites with many habitats or archaeological
steering groups we are currently assessing
and put them forward for consideration. constraints normally take longer.
a number of projects for completion in this
eight year regulatory period. These pipeline
• We rely on principal stakeholders/interest • We assist stakeholders as much as possible projects are in various stages of development
groups to carry out their own engagement with information needed to select suitable but those that have been approved and are
and consultation on projects before putting candidate projects. We work with them to ready for construction equates to potential
these forward. The degree and type of establish the technical viability of proposed 21km of overhead lines to be undergrounded.
engagement varies and it is up to these projects and we provide high-level cost Further projects will also be added to the list
organisations to determine what is estimates to assist in high-level decision- at our steering groups’ instigation.
appropriate and proportionate. making about which projects may be suitable
for consideration.2.0 Managing our environmental impact 12
2.3 Oil Leakage To minimise environmental damage we aim All leak rates are recorded and a database
to ensure that: of leak and cable information held centrally.
In order to improve insulation properties and Monthly reports of fluid filled cable leaks are
enhance cooling some older styles of electricity • Fluid levels in all our cables are monitored submitted to both the Environment Agency
cable contain oil. Leaks from these cables can remotely, the loss of pressure triggering an and Natural Resources Wales.
occur from time to time when equipment is alarm in our Control Centres. This enables
damaged or seals deteriorate so we must take us to react quickly to any leak event. 2.3.1 Improving leak location
steps to reduce the number of leaks and to We have introduced a tagging system using a
minimise the environmental impact of them • Leaks are located quickly preferably using small amount of perfluorocarbon tracer (PFT)
when they occur. perfluorocarbon tracer (PFT) and repaired. that can be readily detected above ground
when a cable leak occurs. This helps to quickly
The risks associated with operating fluid pinpoint the leak location and speeds up the
filled cable (FFC) and related assets can • Cables with a history of high leak rates are
repair process. The use of PFT reduces the
be reputational, regulatory and financial. selected for replacement.
environmental impact of the leak by quicker
The primary risk is associated with the leakage detection, lowers associated costs, avoids
of insulation oil into the environment causing Additional mitigation may range from visual inconvenience to customers and minimises the
pollution, loss of fluid and ultimately cable inspection or PFT tracing, to spot repair, amount of excavation required to locate a leak.
pressure. Leaks typically occur as the cable sectional drain and seal or the full extraction
sheath deteriorates with age, at joint failures of the cable.
or as a result of third-party damage.
Older types of higher voltage cables (33kV and
above) also contain oil-based fluids to assist in
the insulation and cooling of the cable. Again
these cables sometimes leak due to third-party
damage or age-related deterioration. New higher
During RIIO-ED1 we have voltage cable designs do not use oil-based fluids
and therefore any risks associated with these
committed to applying cables will reduce over time.
PFT to ALL cables with
a history of leakage.2.0 Managing our environmental impact 13
2.3.2 WPD Fluid Filled Cable Reported Table 2.3.2 WPD FFC Reported Information
Information
2012/13 2013/14 2014/15 2015/16 2016/17 2017/18
Since 2012/13 we have achieved the following
across our business: FFC in service (km) 871 700 785 755 739 731
Volume of oil in service
2,325,794 2,167,663 2,106,920 2,024,588 2,097,250 1,587,367
(litres)
Volume of oil used to
16%
43,123 22,216 30,950 17,291 17,251 23,358
top up cables (litres
Total length of FFC in service
has reduced by 140km or 16%
2017/18 witnessed an increase in the reported FFC oil leakage - All WPD
volume of FFC leaks; this was due to a number 50,000
of reasons; 45,000
31%
Total volume of oil in service (FFC)
• Improved reporting of FFC across our business
• Better detection of FFC leaks
40,000
35,000
30,000
has reduced by 738,427 litres or 31%
• Maturing assets 25,000
20,000
• Severe winter weather conditions experienced
in the latter half of 2017/18 15,000
10,000
46%
Volume of oil used to top up cables
5,000
0
Base
2015-16
2016-17
2017-18
2018-19
2019-20
2020-21
2021-22
2022-23
has reduced by 19,765 litres or 46%
Actual Target2.0 Managing our environmental impact 14
2.3.3 Oil mitigation schemes
In 2017/18 a total of 23 oil mitigation schemes
associated with fluid filled cables have been
completed across the business. A number of
schemes have involved the application of PFT
to detect leaks quicker and with minimal
disruption to the network.
2.4 Carbon Impact and Climate Change
2.4.1 Business Carbon Footprint
Our Business Carbon Footprint (BCF) details
the impact that our operational activities have
on the environment in terms of associated
carbon dioxide (CO2) emissions. We measure
and report our BCF using equivalent tonnes
of carbon dioxide (tCO2e). The data compiled
and the figures which we report follow a
recognised methodology as described
within international business carbon footprint
standards, the Greenhouse Gas (GHG)
reporting protocol and ISO14064-1.
Our BCF takes account of our energy usage from operational transport (road) and fuel combustion
All of our published BCF data has been verified offices, transport emissions (operational and also takes account of a number of our larger
and data assured for accuracy and compliance business), fuel combustion and the release of contractor emissions as required under the
with the standards detailed above. greenhouse gases (SF6). The reported data for Ofgem reporting requirements.2.0 Managing our environmental impact 15
Table 2.4.1a Annual BCF Reporting
WPD Carbon Footprint Report (tCO2e)
2012/13 2013/14 2014/15 2015/16 2016/17 2017/18
Aspect Scope
Total tCO2e Total tCO2e Total tCO2e Total tCO2e Total tCO2e Total tCO2e
Buildings – electricity 2 12,098.2 9,979.9 12,454.4 10,997.7 10,622.2 7,633.5
Buildings energy usage Buildings – Other fuels 1 191.6 260.1 207.6 193.1 192.5 220.2
Substation electricity 2 28,836.7 24,856.9 27,578.7 25,813.8 22,981.6 19,618.6
Road 1 33,335.9 35,400.6 40,018.8 37,804.8 34,902.6 33,329.5
Rail 1 0.0 0.0 0.0 0.0 0.0 0.0
Operational transport*
Sea 1 0.1 0.1 2.4 2.4 0.24 0.24
Air 1 1,253.0 1,624.4 1,428.1 1,831.0 2,163.5 2,113.6
Road 3 3,903.7 3,792.9 3,304.0 5,116.2 3,196.5 3,395.3
Rail 3 10.8 20.8 21.6 20.6 21.97 21.8
Business transport
Sea 3 0.1 0.1 0.0 0.3 0.97 0.1
Air 3 30.1 53.9 106.4 41.5 92.37 124.1
Fugitive emissions SF6 1 6,063.4 7,384.9 8,282.1 14,307.5 9545.7 10,689.5
Fuel Combustion* Diesel / Gas oil 1 3,653.2 11,836.7 8,574.1 7,100.9 7,041.6 6,382.3
Total Carbon (tCO2e) 89,376.7 95,211.1 101,978.1 103,229.8 90,761.7 83,528.7
Network Losses 1 2,384,281.5 1,896,261.7 1,906,640.7 1,687,342.2 1,530,164.6 1,377,491.8
Total carbon (tCO2e) including losses 2,473,658.2 1,991,472.8 2,008,618.8 1,790,572.0 1,620,926.3 1,461,020.5
Scope relates to definitions in DEFRA guidance and is detailed in the commentary at Appendix B. *Includes contractor emissions2.0 Managing our environmental impact 16
Our annual performance in almost all of the elements that make up our Fig.2.4.1a Annual BCF (tCO2e) excluding network losses
BCF has been positive, resulting in an annual reduction in company BCF
120,000
(excluding losses) of 8%. Specifically companywide this includes;
Contractor
100,000 emissions
18% 7%
80,000
WPD
60,000 emissions
Reduction in annual Increase in annual 40,000
RIIO-ED1
building energy use business transport
20,000 5% Reduction
– 2017/18 – rail journeys Target
0
2012/13
2013/14
2014/15
2015/16
2016/17
2017/18
2018/19
2019/20
2020/21
2021/22
2022/23
However the total BCF (excluding losses) has been affected by the significant
increase in the leakage and scrappage of SF6 from switchgear and an increase
in the carbon equivalent associated with our company business transport. Fig.2.4.1b Annual BCF (tCO2e) including network losses
3,000,000
13%
Contractor
2,500,000 emissions
2,000,000
Increase in total SF6 WPD
emissions since 2012/13 1,500,000 emissions
1,000,000
Losses
500,000
Progress to achieve our target by the end of 2022/23 will continue
to be challenging. 0 RIIO-ED1
5% Reduction
2012/13
2013/14
2014/15
2015/16
2016/17
2017/18
2018/19
2019/20
2020/21
2021/22
2022/23
Target2.0 Managing our environmental impact 17
As shown opposite, the main contributors to Fig.2.4.1c Business Carbon Footprint - WPD
our Business Carbon Footprint (BCF) excluding 8%
losses are buildings energy usage, operational
transport and fugitive emissions. During 2017/18
we enhanced the methodology and the data we 13%
collect for SF6 by also including the volume of 33% Buildings energy usage
gas ‘missing’ from scrapped equipment. We have
Operational transport
been able to obtain data for the ED1 period and
4%
this has led to an increase in SF6 leakage being Business Transport
reported. This data was not included in the
original data used to set targets so we have Fugitive emissions
provided additional comparisons that show
Fuel combustion
performance on a like-for-like basis.
(see section 2.4.2)
42%
We have the following initiatives in place to try • Building energy use (operational and
to improve overall BCF performance: non-operational) accounts for 33% of BCF.
We have been installing low energy lighting
• Fugitive emissions (consisting mainly of SF6 and undertaken an energy efficiency review
gas leakage) make up 13% of the total BCF. at non-operational sites which has led to a
We continue to investigate alternatives to SF6 reduction in electricity usage in offices
via an ongoing innovation project (NIA funded and depots.
project SF6 Alternatives) and we have invested
in four infrared SF6 detection cameras which
• We are also focused on reducing emissions
enable us to quickly pinpoint the source of
from operational transport (making up 42%
leaks. We replace any 11kV distribution assets
of BCF) through the ongoing replacement
that leak, if a repair is not possible, and
of older vehicles with more fuel efficient
we replace EHV assets if they have leaked
alternatives.
three times.2.0 Managing our environmental impact 18
Reducing Emissions from Vehicles Table 2.4.1b Emissions variations for operational vehicle replacements
Our network is spread over an area of 55,500km2 Emissions – operational vehicle replacements
so we need to operate a significant fleet of
vehicles to serve this territory effectively. CO2e emissions CO2e emissions
Previous Vehicle Current vehicle
Emissions are reported as part of our Business (grams per km) (grams per km)
Carbon Footprint and are calculated based Fiat Doblo SWB 137 Transit Connect SWB 115
on fuel usage data, in line with the published
Fiat Doblo LWB Euro5 137 Transit Connect LWB 115
2017 DEFRA conversion factors. Procurement
processes are used to ensure that when our Landrover 110 295 Isuzu D Max 183
vehicles reach the end of their useful lives,
Landrover 110 MEWP 295 Isuzu D Max MEWP 183
they are replaced with more efficient options.
An example of replacements for some of our Transit 350 LWB RWD 234 Transit MWB FWD 130psi 176
most commonly used operational vehicles
Transit 350 2.2 E5 228 Transit Custom 310 157
shows this process in practice (data comes
from the vehicle registration certificate). Ford Fiesta Van 1.5 98 Vauxhall Corsa 94
In 2017/18 228 operational vehicles were
replaced with emission alternatives as per
the Table 2.4.1b.2.0 Managing our environmental impact 19
Fig. 2.4.1d WPD vehicle fuel use (litres) per year (2012-2018) Fig. 2.4.1e Total WPD fuel use (litres) per year (2012-2018)
2,600
Annual fuel use per 5% Total annual 5%
2,500 9,500,000
WPD vehicle – litres Reduction Target fuel use – litres Reduction Target
2,400 9,100,000
2,300 8,700,000
2,200 8,300,000
2,100 7,900,000
2,000 7,500,000
2012/13
2013/14
2014/15
2015/16
2016/17
2017/18
2018/19
2019/20
2020/21
2021/22
2022/23
2012/13
2013/14
2014/15
2015/16
2016/17
2017/18
2018/19
2019/20
2020/21
2021/22
2022/23
We measure the contribution of vehicle emissions Elements such as range between charging, Analysis of the project is being undertaken in
to our overall BCF performance in terms of fuel payload (the weight capacity of the vehicle) and conjunction with the University of South Wales;
usage converted to equivalent tonnes of carbon usage will be reviewed in order to identify how and the vehicles are likely to remain operational
dioxide (tCO2e). Performance during 2017/18 appropriate these vehicles are for future use. for around six years depending on performance.
provided a small reduction in terms of litres of At this stage in the project, we have identified
fuel used per WPD vehicle in addition to a slight some reliability issues with charging, cell failure
reduction in terms of total fuel use. Accordingly and limits to range and payload in comparison
we are still making good progress towards with diesel equivalents which we are continuing
meeting our RIIO-ED1 5% reduction target to address.
for annual fuel use.
In 2014 we began an initiative to trial commercial
We also continue to trial vehicles that use vans which have been converted to dual
alternative fuels. Currently we have three fuel – specifically hydrogen. We purchased
electric operational vehicles in use; these and converted two vehicles and they became
vehicles continue to be assessed. fully operational in April 20182.0 Managing our environmental impact 20
Building Energy Use Table 2.4.1c Non-operational Depot Site Current Performance
BREEAM Rating.
We operate from 59 offices that vary in age and Fig. 2.4.1f Company building electricity use
construction. We know that when refurbishment Non-operational (tCO2e) – taken from depot SMART meter.
of these buildings takes place, there are BREEAM Rating
Depot Site
opportunities to improve their energy efficiency. 14,000.00
Leicester Excellent
12,000.00
In West and East Midlands, many offices were Birmingham Very good
new or refurbished to the BREEAM standard 10,000.00
of ‘excellent’ or ‘very good’ when facilities Local improvements include:
8,000.00
were being developed for our local team
based operational structure, and all new builds • Installation of motion sensors 6,000.00
achieved the ‘excellent’ rating. • Improvements to air conditioning units 4,000.00
• Low energy lighting 2,000.00
In the South West and South Wales our properties
are older, with more scope to implement energy 0.00
The property redevelopments, improved
2022/23
2020/21
2021/22
2019/20
2012/13
2018/19
2014/15
2015/16
2016/17
2013/14
savings measures. Whenever refurbishment work
2017/18
employee awareness and energy efficiency
is planned we ensure, where appropriate, that
improvements, are leading to energy savings.
it is carried out to the “very good” standard
under BREEAM to reduce energy consumption.
This is evident in the electricity usage we recorded
The “very good” standard is the highest which
in our overall BCF reporting. We propose to Company electricity RIIO-ED1 5%
can be achieved for a refurbished building. use (tCO2e) Reduction Target
save around 5% of electricity used in offices and
depots over the RIIO-ED1 period. As demonstrated
During 2017/18, we successfully completed the
we are more than meeting this target with a
following BREEAM refurbishments/new builds:
reduction 36.9% since 2012/13.2.0 Managing our environmental impact 21
2.4.2 Sulphur Hexafluoride (SF6) Fig. 2.4.2a Actual percentage loss of SF6 to Total bank
SF6 gas is used throughout our industry as an insulating
medium in switchgear. Although it provides many
1.20%
benefits, it is a potent greenhouse gas (1kg SF6 is SF6 Leakage rate (%)
1.00%
equivalent to 22 800kg CO2e). There are currently no
viable alternatives to SF6 and so it is replaced when 0.80%
Target leakage rate (%)
necessary on a like for like basis. We will continue to 0.60%
replace older oil filled switchgear with SF6 insulated
0.40%
switchgear and we predict that our total SF6 bank will
0.20%
be approximately 23,000 kg by 2023 – an increase of
10,000kg on our baseline year. 0.00%
2010/11
2011/12
2012/13
2013/14
2014/15
2015/16
2016/17
2017/18
2018/19
2019/20
2020/21
2021/22
2022/23
The graph on the right shows that the volume of
SF6 leaked annually is very small at less than 0.2%.
As detailed right the data for SF6 emitted in 2015/16 Fig. 2.4.2b Annual SF6 emissions (kg)
and 2016/17 has been restated and added to the
current RRP E2 and E3 tables for each of our licence 800
areas. The data has been restated based on an
enhanced methodology used to calculate the 2017/18 600
SF6 emissions using the following data sources;
400
• SF6 top-up figures as reported on our company
asset database 200
• Scrapped units returned empty to our company 0
plant centres
2010/11
2011/12
2012/13
2014/15
2016/17
2013/14
2018/19
2020/21
2021/22
2022/23
2015/16
2017/18
2019/20
• Units returned empty to manufacturers
• Hawker Siddeley GVR return programme
*Includes all top-ups, units returned to manufacturers’ and scrapped units2.0 Managing our environmental impact 22
The methodology measures the amount of Table 2.4.2b
SF6 emitted during installation, service and
Measure DNO Target Actual* RAG Comments
decommissioning. The new methodology now
includes the amount of SF6 from scrapped units SF6 emissions (emissions West Midlands 0.36% 0.06% Like for like comparison against
as a percentage of SF6 bank). target set ahead of enhancements
returned to plant centres, manufacturers and
East Midlands 0.29% 0.10% to data collection.
the GVR return programme. The SF6 may have
been emitted over the life of the unit, rather South Wales 0.38% 0.44%
than being attributable to a particular year.
The enhanced SF6 emission data now included South West 0.38% 0.64%
in the RRP Tables is set out below and tCO2e Actual values excludes contribution from ‘missing’ SF6 derived from scrapped equipment.
*
calculated accordingly within the tables;
Overall the level of leakage is reducing over When a leak becomes apparent, we locate
Table 2.4.2a time as older units are replaced with new units its source so that a strategy can be developed
which also contain lower levels of SF6. to manage the situation, taking into account
WPD SF6 emissions (kg) the potential for repairs and the lead times
When replacing switchgear, we give priority for replacement switchgear to assist in the
Reported Revised Reported Revised
15/16 15/16 16/17 16/17
to the switchgear with the highest leak rates. identification of leaks we have purchased four
Within RIIO-ED1, we have committed to replacing SF6 cameras and trained staff in their use.
East
45.17 75.61 35.47 53.8 any 11kV distribution assets that show signs of
Midlands
leakage and any higher voltage assets that have The amount of SF6 lost is expressed as a
West leaked three times. SF6 leaks are monitored and percentage of the overall ‘bank’ of switchgear
163.58 352.64 51.97 207.9
Midlands
logged within our asset database – the volume containing SF6 as this will vary over the period
South of leaks is determined by the volume of gas of RIIO-ED1. The target is based on a four-year
88.35 93.9 77.7 88.3
Wales required to top-up the asset or the amount average of emissions between 2009/10
South taken out of the unit if it is to be replaced. Leaks and 2010/11.
99.65 105.3 63.4 74.0
West are identified by either a low gas alarm being
triggered via control systems or from a low gas
reading on a gauge identified during a switching During RIIO-ED1, we have
operation or a routine substation inspection.
committed to reducing the
volume of SF6 lost by 17%.2.0 Managing our environmental impact 23
2.4.3 Distribution Losses However, new renewable energy sources tend
Introduction to Losses to be smaller and well spread out; so they are
The importance of reducing electrical losses often connected to the low voltage network
all on distribution networks is growing as a and the power may then have to flow back to
result of the increase in intermittent distributed the high voltage network to reach its customers.
generation and higher production costs. Previous networks were not designed for
The energy lost in distribution creates a financial distributed generation, so it may not be the
cost which is paid for by the customer. DNOs most efficient. Our network is already changing
are obliged, as part of their licence, to reduce to incorporate distributed generation and
loses on their networks as far as reasonably losses are a priority consideration when making
practicable. The energy lost which includes these changes.
theft, accounts for unnecessary carbon
Causes of Losses
emissions, which impacts climate change.
Distribution network losses can be broadly
Reducing losses effectively can also increase
defined as the difference between the electrical
the network capacity. This is crucial with energy
energy entering the distribution network, and the
consumption likely to increase sharply over
electrical energy exiting the distribution network.
the next 15 years, as a result of The Carbon Plan
and the uptake of new technologies like electric
Distribution network losses are conventionally
vehicles and heat pumps become more common.
broken down into two categories:
This means network loading will increase, which
will increase losses, as explained in the variable
• Technical losses
losses section. Losses may increase further
due to the increase in distributed generation. Reducing losses can also effectively increase • Non-technical losses
By reducing losses wherever possible, it could the capacity of our network, as less power needs
reduce the need for costly network reinforcement to be delivered to produce the same output. Electrical losses are very difficult to measure
projects. In addition to the environmental accurately. As the meter-data from customers
effect, the financial cost of losses contributes The electricity network was designed for large cannot currently be recorded accurately or
to customer bills. Any financial savings that centralised generators to supply power to the frequently therefore non-technical losses are
loss reduction produces should ultimately be high voltage network and then this would flow difficult to account for.
passed on to consumers directly. through the low voltage network to customers.2.0 Managing our environmental impact 24
Technical Losses Phase Imbalance Power Factor
The total amount of technical loss is made up of a A network which does not have its load evenly There are two ways to define the power in a
fixed component (a function of the network itself, distributed across all three phases will have system. The real power is the capacity of the
independent of the load on the network) and a higher currents in at least one phase meaning system to do work. The reactive power is the
variable component which is dependent on the it is not optimised for losses. There will also product of the voltage and the current flowing.
level of load on the network. Variable losses may be currents flowing in the neutral conductors The power factor is the ratio of the real power
also be impacted by the power factor, network if they are present. Due to the quadratic to the reactive power. Where the power factor
imbalance and the effects of harmonics. dependence of losses on current discussed is less than unity the current has to increase
above, this load imbalance across the three to deliver the required amount of real power,
Fixed Losses phases will increase losses. which results in a loss. This has historically been
Some electrical energy is dissipated by network an issue for installations used by industrial and
components and equipment such as transformers Imbalance is found on all parts of the low-voltage commercial customers, where most motor loads
or conductors as a result of being connected to (LV) network due to customers who use one or or power electronic loads were seen.
the network and being energised. Even if no two phases having different load consumptions. Developments in domestic power electronics
power is delivered to customers, the system has On the high-voltage (HV) network, imbalance is and heat pumps mean we will start to see this
losses just because it is electrically energised. due to the uneven distribution of single-phase issue occurring more on domestic networks.
These losses take the form of heat and noise and transformers or two wire spurs and different
are called ‘fixed losses’ or ‘no-load losses’, loads on each phase for three-phase customers. Since 2010 we have included an excessive
because they are independent of how much The most obvious way to reduce phase reactive power charge for HV and LV half hourly
electrical energy the network delivers. imbalance is to carefully balance the aggregated metered, via the Use of System Charge, have a
Transformers’ energisation is responsible for the load on each phase, but as customer power factor of 0.95 lagging. This is to ensure
majority of the fixed losses (although this consumption is not always predictable and varies that the reactive power is kept to the minimum
equipment also gives rise to variable losses). at different times of day, this can be difficult. as with any load the WPD has to cater for the
reactive power for the sizing of the circuit even
though that reactive power is not being
used effectively.2.0 Managing our environmental impact 25
Non-technical Losses Fig. 2.4.3a Breakdown of distribution losses
Non-technical losses are caused by actions
that are external to the power system. They LV 19%
refer to lost energy that is not directly related
HV/LV 22%
to the transportation of electricity and occur
independently of the physical, technical HV 25%
characteristics of the network (technical losses).
EHV/HV 5%
Cases of non-technical loss cannot be fixed
by upgrading equipment or altering network EHV 9%
design. Instead investigations, audits and
132/EHV 6%
collaborations with other bodies are required.
This kind of loss involves the abstraction of 132 kV 8%
electricity with a loss of revenue to both the
SC 6%
network operator and the supplier.
Non-technical losses fall into two main Both of these types of losses can only be
categories: Theft in Conveyance and Unmetered reduced by investigations, audits, enforcement
Supplies. Theft in Conveyance is where an illegal and correction
connection to the network is made, or where
properties do not have a registered supplier. Where Do Most Losses Occur?
Unmetered supply occurs on equipment such Network modelling work described in the SOHN
as street lamps and traffic lights, which are losses report [1] predicted that the distribution
impractical to meter, due to the number of units. of electricity at LV produces the most losses on
Instead, their consumption is estimated based our network. The service cable and LV cables
on standard power usage figures and the number supplying electricity to properties account
of units. These estimations can be inaccurate for 25% of the total losses. The distribution
and result in energy not being correctly billed. transformers add another 22% with the
The extent of unmetered supply losses is 11kV network accounting for another 25%.
relatively small but not insignificant, but theft in The higher voltages (33kV and 132kV) make
conveyance costs us 2.8GWh of energy a year. up the remaining 28%. These percentages
vary between urban and rural networks.2.0 Managing our environmental impact 26
Losses Strategy vehicles, photo voltaic (solar), energy storage • We have established a specific losses engineer
Our Losses Strategy is updated annually and (battery) and heat pumps as part of the Losses within the Policy Section to take into account
details the approach to losses and all of the Discretionary Reward application in 2018, Our the losses policies developed within the
interventions that have been planned. This losses strategy plans will be completed alongside Network Strategy and Innovation Team;
includes both programmes of asset replacement the normal business as usual. The strategy • The continued pro-active replacement of 1,996
that we are undertaking and innovation projects provides an introduction to the theory behind distribution transformers;
that aim to provide new solutions for loss losses and the main ways that they can be
• The design intervention for losses on new
reduction in the future. produced with descriptions of our approach to
installation of 8,184 distribution transformers
loss reduction through asset replacement,
and 11,880 kilometres of underground cables;
This year sees a change in the focus of the strategy. improved understanding, stakeholder
With the replacement of pre 1958 transformers, engagement and revenue protection. • A review of our policies to ensure losses are a
the tapering of circuits and use of 95mm² Al LV priority consideration for all of our investment
and 11kV cables no longer permitted, we are Activities Undertaken in the Regulatory Year decisions;
looking at new and innovative areas to reduce This section contains all the various areas that we • The upgrading of the existing modelling tool for
losses. For instance, we are taking a lead from are currently focusing on with a view to reducing LV mains of our network, to output direct losses
the motor industry and government announcements losses going forward. These actions will enable data and be compatible with smart-meter data;
to restrict the sales of petrol and diesel cars by us to reorganise the network to make it run more • A comprehensive programme of stakeholder
targeting the effect electric vehicle charging will efficiently with the revenue protection, engagement including biennial stakeholder
have on the LV network. identifying actions that can be taken to prevent consultation events;
or reduce energy loss to theft or unmetered • The development of a new losses page on
Vehicle charging is likely to be the first major low supplies. However, there are also some our website;
carbon technology demand to be seen on the low discussions, particularly in the network design
• The ability to now identify units lost to supplier
voltage network, which has to be accommodated section of policies which we will be able to
side abstraction, unmetered supplies and theft
as a result of the Government’s introduction of implement following innovation projects which
in conveyance throughout the period.
The Carbon Plan – 2050. With this in mind and the WPD has undertaken to better understand
work carried out for ENA Technical Losses losses. Where appropriate, we have referenced
Working Group and research completed by the the SOHN recommendations to which the
Engineering Consultants WSP, we will be carrying actions correspond.
out a project on new network design and retro-
fitting of networks to take into account electric2.0 Managing our environmental impact 27
The Losses Investment Profile Cost Benefit Analysis, Tools and Methodologies For some analysis, the Ofgem CBA spreadsheet is
over the RIIO-ED1 Price We will only undertake loss reduction activities not sufficient and a bespoke model is constructed.
Control Period when a CBA has found them to be economically When this is the case, we produce a simplified
Under our current business plan, we have not beneficial. We use the standard Ofgem CBA version in the Ofgem format and publish the
allocated any funds specifically for the reduction spreadsheet and financially value losses using the bespoke CBA to explain the full methodology.
of electrical losses. Instead, investments into Ofgem agreed figure of £48.42 per MWh. This
asset replacement are taken from the network figure is the average wholesale cost of energy in The environmental benefits can be calculated
reinforcement budget when it is seen to be 2011/12, expressed in 2012/13 prices. It is using the agreed equivalent carbon emissions
economically viable to do so, under the Cost intended to represent the societal cost of losses. conversion factor of 0.41205 kg CO2e per KWh.
Benefit Analysis (CBA) scheme described in
section 2.4.3.5. Table 2.4.3a Current Assessment of Distribution Losses
We also have a number of innovation projects 2012/13 2013/14 2014/15 2015/16 2016/17 2017/18
which aim to help reduce losses. These projects Total annual losses
5,158 4,103 4,125 3,651 3,713 3,918
are funded by the Network Innovation Allowance (GWh)
(NIA). Projects such as the Losses Investigation, Carbon equivalent
2,384,281 1,896,261 1,906,640 1,687,342 1,530,164 1,377,491.8
which has set up a fully monitored LV network on (tCO2e)
the Isle of Man, are aimed solely at improving the
understanding of losses. While projects such as
FALCON, which was aimed at smart-grid related
techniques, have other primary aims, their Fig. 2.4.3b Total Annual Losses (GWh) Fig. 2.4.3c Carbon Equivalent (tCO2e)
outputs benefit losses as well. NIA funding is
provided by Ofgem to all Distribution Network 6,000 3,000,000
Operators (DNOs) to run technical or innovation
4,000 2,000,000
projects directly related to their network, which
have the potential to deliver financial benefits 2,000 1,000,000
to customers. 0 0
2012/13
2013/14
2014/15
2015/16
2016/17
2017/18
2012/13
2013/14
2014/15
2015/16
2016/17
2017/182.0 Managing our environmental impact 28
Table 2.4.3b Summary of losses and benefits from activities in RIIO-ED1.
Interventions Savings Interventions through Savings through
Proposal
per Annum per Annum (kWh) RIIO-ED1 RIIO-ED1 (MWh)
Transformers
Replace pre-1958 transformers 250 2,694,543 1,996 21,556
Install a minimum size of pole-mounted
575 68,072 4,600 545
transformer
Discontinue 315kVA ground-mounted
448 1,140 3,584 9
transformers
Cables
Discontinue small size service cables 343 km 412,629 2,744 3,301
Upsizing LV cables 694 km 3,049,799 5,552 24,398
Discontinue small size 11kV cables 448 km 951,421 3,584 7,611
Imbalance
Correct Imbalance at LV substations Per substation 1,014 Per substation tbc2.0 Managing our environmental impact 29
2.5 Other environment related Full certification across all four licence areas
activities since 2015;
Benefits of ISO14001:2015:
2.5.1 Certification and transition to
ISO14001:2015 • Validates our environmental management
Since 2011 we have been certified to system (EMS)
ISO14001:2004 Environmental Management • Provides confidence to interested parties and
Systems however the standard has recently regulators
undergone a major revision to ISO14001:2015. • Provides a consistent environmental
We successfully transitioned and gained management approach across WPD
certification to the new standard in May 2017.
• Helps to ensure legal compliance
In order to achieve certification to the 2015
standard we had to take into account a number • Demonstrate our value of good environmental
of specific changes to the structure, content stewardship
and focus of the revised standard.
We transitioned to the new ISO14001:2015
During the transition and certification process standard in May 2017.
no major non-conformances were raised and by
the end of the 10-day audit just six minor non- Five key approaches on the new ISO 14001:2015
conformances were outstanding. Throughout
1 2 3 4 5
the course of 2017/18 those minor findings have
been addressed and successfully closed out.
Emphasis Focus on Effective Greater Life cycle
Six monthly surveillance audits continue to be
on leadership strategic fit & communication protection for perspective
undertaken by our auditors throughout the three
risk management & awareness environment
year certification period and we continue
to demonstrate effective and responsible Greater commitment An increased Driven through Proactive initiatives, Each stage of a
environmental management via the company from the top alignment with a communication objective measurements product or service;
ISO14001:2015 certificate. management unique context, strategy and its & improving from development
strategic direction effectiveness environmental to end-of-life is on
and risk orientation performances focus2.0 Managing our environmental impact 30
2.5.2 Waste Management
We continue to segregate our waste at all of our depot locations
We work closely with all of our waste contractors
and transport units into the following waste streams:
ensuring that where possible waste streams are
diverted from landfill and that we always apply
the principle of the waste hierarchy.
Redundant cabling and metal work is segregated
at our depots and collected by one of two
dedicated contractors who we have worked with
for many years. We receive monthly revenue for
the collected metal/cable and this waste is, in
turn, processed and eventually returned to the
marketplace for re-use.
Metal Cable Dry mixed General waste
recyclables
Wooden poles from our networks are collected (Cardboard/paper/plastics)
from many of our non-operational depots.
Previously the poles, which are classed as a
hazardous waste, would have been disposed of via
landfill, but we now dispose of them at a waste to
energy plant in the north of England, avoiding
expensive landfill costs and complying with the
waste hierarchy. During 2018/19 we hope to be
proceeding with a small scale creosote removal
trial in South Wales which would, if successful
potentially remove the creosote from wood poles Wood Organics Redundant wood Hazardous
and therefore re-classify the waste as non- poles waste
hazardous and therefore reusable. We have been
(Batteries/contaminated rags/
in discussion with Natural Resources Wales, who used electrical insulating oil/
are supportive of the project and we look to aerosols/fluorescent tubes)
commence the trial in late 2018/19.2.0 Managing our environmental impact 31
Fig. 2.5.2a Percentage breakdown of WPD Fig. 2.5.2b Tonnage of total waste
Waste 17/18 (not including metal and cable)
6,000
C&D
General (landfill)
General
(not landfill) 4,000
DMR
Organic
Wood 2,000
Hazardous
2013/14
2014/15
2015/16
2016/17
2017/18
Poles
Tanker
In 2018/19 we will be awarding new waste RIIO-ED1 Target – Waste The percentage of our waste disposed of to
management contracts across the business. One Our RIIO-ED1 Business Plan states that we will landfill has decreased by approximately 11%
of the key performance requirements of the new reduce the amount of waste sent to landfill by 20% since our baseline year (2012/13 - 52%, 2017/18
contracts will be to reduce the overall tonnage of over the first two years of RIIO-ED1 and 5% per - 41%). Much of this reduction can be attributed
waste we produce and maximising the amount of annum thereafter. This target does not include the to the avoidance of treated wood poles being
waste sent for non-landfill disposal. A challenge recycling of our scrap metal and cable. diverted from landfill, improvements in office
moving forward will be to improve on the amount recycling and greater employee and contractor
of dry mixed recycling we send for recycling / The overall tonnage of waste produced by us has waste management awareness.
recovery. The last 12 months has seen a reduced to 5,344 tonnes from 5,839 tonnes in
significant shift in the viability of the plastics 2016/17 a reduction of 8.4%. However the
recycling market. Waste contractors are requiring percentage of this total tonnage which has been
higher and cleaner grades of plastic to make disposed of to landfill increased slightly in 2017/18
recycling viable. Lower grades, for example to 2,189 tonnes from 2,162 tonnes in 2016/17 an
plastic cups, are no longer considered to be increase of 1.2%. We have looked at the reasons for
suitable for general recycling. this in order to continue to achieve reductions2.0 Managing our environmental impact 32
2.5.2.c Tonnage of waste to non-landfill 2.5.2.d Tonnage of waste to landfill
4,000.00 3,500
3,000
3,000.00
2,500
2,000.00
2,000
1,000.00
1,500
0 1,000
2013/14
2014/15
2015/16
2016/17
2017/18
2013/14
2014/15
2015/16
2016/17
2017/18
2.5.2.e Annual percentage waste to landfill vs. non-landfill 2.5.2.f Percentage of waste to landfill
70.00 60%
60.00 % Waste 50%
non-landfilled
40%
50.00
30%
40.00
% Waste 20%
30.00 landfilled
10%
20.00 0%
Base
2013-14
2014-15
2015-16
2016-17
2017-18
2018-19
2019-20
2020-21
2021-22
2022-23
10.00
0.00
2013/14
2014/15
2015/16
2016/17
2017/18
Although the % age of our waste sent to landfill has increased this year, we are still on target to achieve
our RIIO-ED1 target by 2022-23. What is encouraging is that the actual tonnage of waste we produce
has reduced for the first time since we started reporting on RIIO-ED1 performance.2.0 Managing our environmental impact 33 Although the percentage of our waste sent to landfill marginally increased this year, we are still on target to achieve our RIIO-ED1 target by 2022-23. What is encouraging is that the actual tonnage of waste we produce has reduced for the first time since we started reporting on RIIO-ED1 performance. Waste initiatives During 2018/19 we will continue to target the tonnage of waste we produce across our business – employing the principles of the waste hierarchy wherever possible as well continuing to focus on the amount of waste being reused and recycled. We will specifically: • Work closely with our new waste contractors to identify innovative ways to reduce waste and to segregate waste at source. • Aim to further decrease the actual tonnage of waste that we produce as a business and further investigate innovative ways, alongside suppliers and manufacturers, to reduce the amount of packaging waste and improve the reuse/ recyclability of items we purchase. • Investigate with manufacturers the opportunities to reduce the amount of embedded waste, via improved design and life cycle analysis of the products that we routinely purchase like electrical equipment, operational vehicles and information technology equipment.
You can also read