Safety and Shipping Review 2021 - An annual review of trends and developments in shipping losses and safety - Allianz Global Corporate ...
←
→
Page content transcription
If your browser does not render page correctly, please read the page content below
ALLIANZ GLOBAL CORPORATE & SPECIALTY

Safety and Shipping
    Review 2021
An annual review of trends and developments
in shipping losses and safety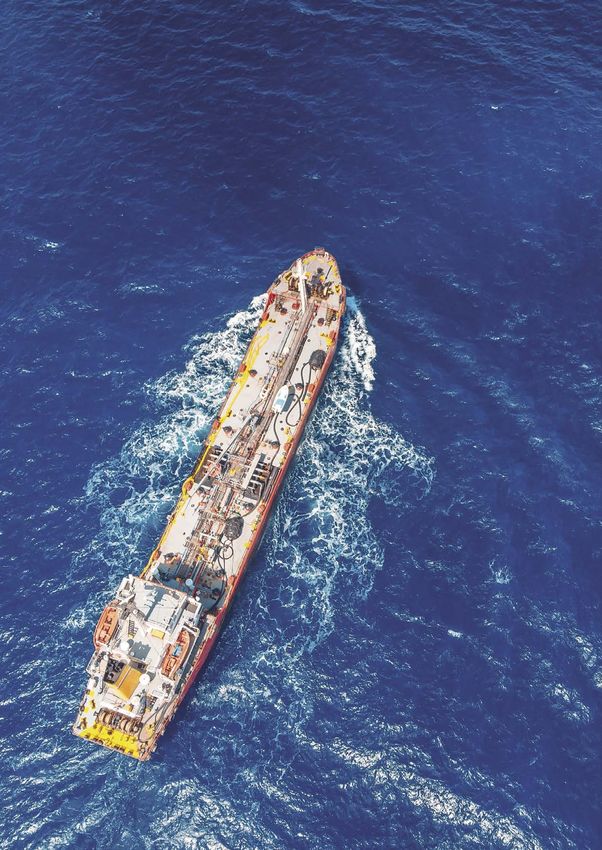
SAFETY AND SHIPPING REVIEW 2021

About AGCS
Allianz Global Corporate & Specialty (AGCS) is a leading
global corporate insurance carrier and a key business
unit of Allianz Group. We provide risk consultancy,
Property‑Casualty insurance solutions and alternative risk
transfer for a wide spectrum of commercial, corporate and
specialty risks across 10 dedicated lines of business.

Our customers are as diverse as business can be, ranging
from Fortune Global 500 companies to small businesses,
and private individuals. Among them are not only the
world’s largest consumer brands, tech companies and the
global aviation and shipping industry, but also satellite
operators or Hollywood film productions. They all look to
AGCS for smart answers to their largest and most complex
risks in a dynamic, multinational business environment and
trust us to deliver an outstanding claims experience.

Worldwide, AGCS operates with its own teams in 31
countries and through the Allianz Group network and
partners in over 200 countries and territories, employing
around 4,400 people. As one of the largest Property-
Casualty units of Allianz Group, we are backed by strong
and stable financial ratings. In 2020, AGCS generated a
total of €9.3 billion gross premium globally.

www.agcs.allianz.com

2
PAGE 4

                                    Executive summary
                                    PAGE 10

                                    Losses in focus: 2011 to 2020

                                    Trends
                                    PAGE 18

                                    1. The Covid factors
                                    PAGE 28

                                    2. Larger vessels
                                    PAGE 38

                                    3. Supply chains and ports
                                    PAGE 42

                                    4. Security and sanctions
                                    PAGE 48

                                    5. The environmental picture

Cover image: Adobe Stock, 3-D design of Suez Canal blockage
Publication photos: Adobe Stock unless otherwise stated
                                                                    3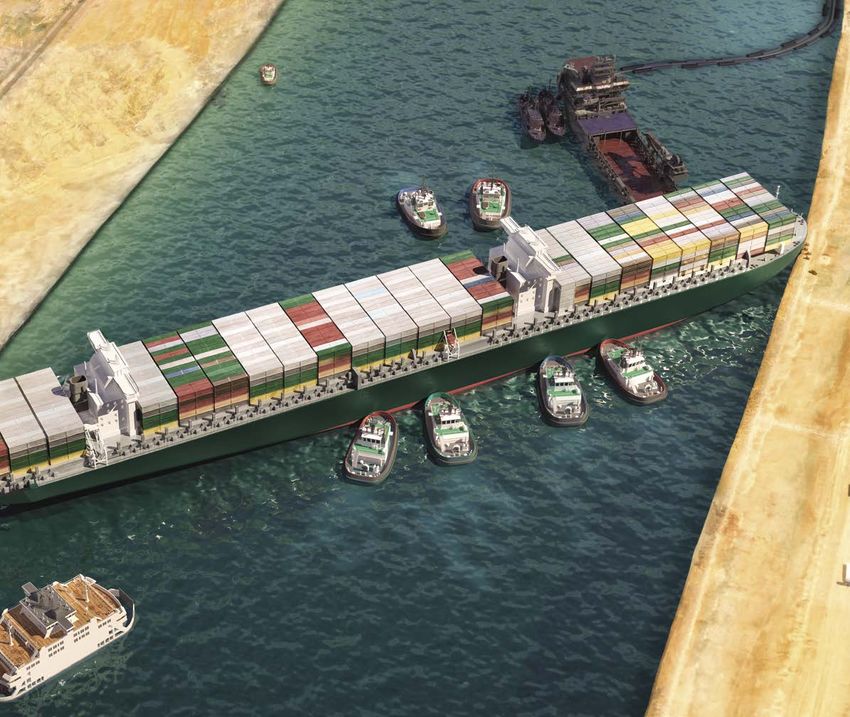
SAFETY AND SHIPPING REVIEW 2021

                                                                                        Safety and Shipping

Executive                                                                               876 total losses in 10 years

summary                                                                                            ↓
                                                                                        49 total losses in 2020.
AGCS' Safety and Shipping Review identifies loss                                        50% decline over a decade
trends and highlights a number of risk challenges
for the maritime sector.

                                                                                        18 cargo ships lost in 2020 –
                                                                                        37% of all vessels lost
The international shipping industry is      significant increases in loss activity
responsible for the carriage of around      to rank second and third. South East
90% of world trade so the safety of         Asian waters are also the major loss
vessels is critical. The sector continued   location of the past decade (224
its long-term positive safety trend         incidents), driven by a number of
through 2020 with the number of             factors including high levels of local
reported total losses of over 100GT         and international trade, congested
remaining stable at 49 compared with        ports and busy shipping lanes,
48 a year earlier. This means annual        older fleets and extreme weather            2,703 shipping incidents
shipping losses have halved over the        exposure. Together, the South China,        in 2020 – down 4% year-on-
past decade (2011 – 98), although           Indochina, Indonesia and Philippines,       year. Machinery damage is
2020 represented the first time in five     East Mediterranean and Black Sea,           the top cause
years that losses have not declined,        and Japan, Korea and North China
suggesting the loss total could be          maritime regions account for half of
stabilizing around the minimum              the 876 shipping losses of the past 10
achievable level.                           years (437).

The 2020 loss year represents a             Cargo vessels accounted for more than
significant improvement on the rolling      a third (18) of all vessels lost in 2020.
10-year loss average (88), reflecting       The number of losses involving cargo
the positive effect of an increased         and passenger vessels increased year-
focus on safety measures over time,         on-year. Analysis shows cargo vessels
such as regulation, improved ship           account for 40% of total losses over
design and technology, and risk             the past decade (348).
management advances.
                                            Foundered (sunk/submerged) was
South China, Indochina, Indonesia           the main cause of total losses during
and Philippines is the global loss          2020, accounting for one in two.
hotspot, accounting for a third of all      Contributing factors include bad
losses in 2020 (16), with incidents up      weather, poor visibility leading to
slightly year-on-year (2019: 14). The       contact, flooding and water ingress
East Mediterranean and Black Sea            and machinery breakdown. The
(7) and Arabian Gulf (4) regions saw        number of fires/explosions resulting in

4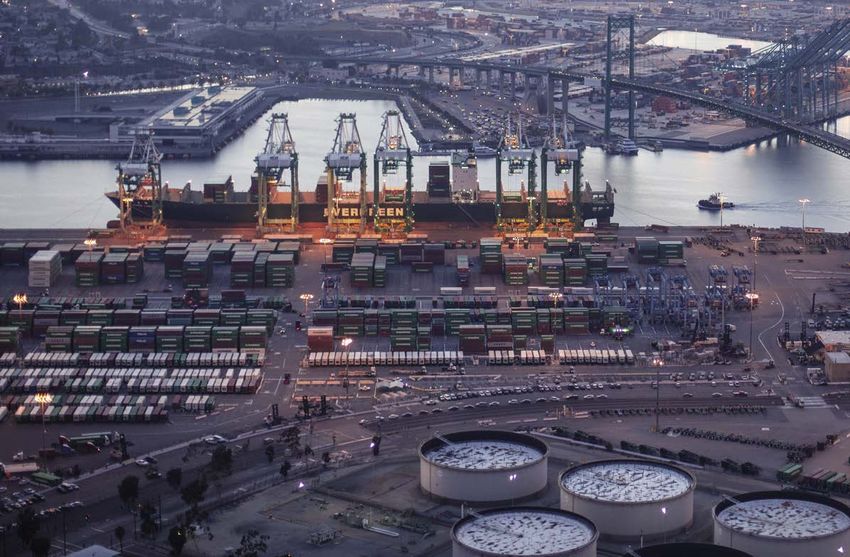
SAFETY AND SHIPPING REVIEW 2021

Review 2021 In Numbers

   1,500%
   increase in container-carrying
                                            18,000
                                            containers on the Ever Given
   capacity in 50 years                     during the Suez Canal blockage

    6 incidents involving the       95% of crew kidnappings       579 incidents in 2020 in       1 in 3 total losses in 2020
    most accident-prone             reported at sea in 2020       the British Isles, North       occurred in South China,
    vessels in 2020 – a Greek       in the Gulf of Guinea         Sea, English Channel           Indochina, Indonesia and
    Island ferry and a RoRo                                       and Bay of Biscay region       Philippines – the global
    in Canadian waters                                                                           hotspot

                                            total losses of vessels increased again   although this was down year-on-
                                            year-on-year, hitting a four-year high    year. Machinery damage/failure was
                                            of 10. Collectively, foundered (sunk/     the top cause of shipping incidents
                                            submerged) (54%), wrecked/stranded        globally, accounting for 40%.
                                            (20%) and fire/explosion (11%) are the
                                            top three causes of total losses over     The East Mediterranean and Black
                                            the past decade, accounting for 85%.      Sea region has seen the most shipping
                                                                                      incidents over the past decade (4,556).
                                            The number of reported shipping           Of the 26,000+ incidents over the past
                                            casualties or incidents declined          decade, more than a third (9,334)
                                            slightly from 2,818 to 2,703 in 2020      were caused by machinery damage
                                            or by around 4%. The British Isles,       or failure – over twice as many as the
                                            North Sea, English Channel and Bay        next highest – collision.
                                            of Biscay region saw the highest
                                            number of reported incidents (579),

                                                                                                                               5
SAFETY AND SHIPPING REVIEW 2021

26,000+                                                                                                 reported shipping incidents
                                                                                                        over the past decade

Covid-19 factors                                                replace them. Extended periods at sea can lead to mental
                                                                fatigue and poor decision making, which ultimately impact
Despite the devastating economic impact of Covid-19, the        safety. Crewing issues came under the spotlight in the
effect on maritime trade has been less than first feared,       wake of the Wakashio incident in July 2020 when the
demonstrating the resilience of the shipping industry. Global   vessel ran aground off the coast of Mauritius, spilling oil in
seaborne trade volumes declined only by around 3.6% in          the process.
2020, and are on course to surpass 2019 levels this year.
                                                                With so many crew members stuck on board vessels there
While the cruise industry and the car carrier segment have      are serious concerns for the next generation of seafarers.
been worst affected by the pandemic, the industry’s three       Covid-19 is impacting training and development and the
largest markets – tankers, bulkers and containers – have        sector may struggle to attract new talent due to working
been quick to recover. Global container throughput in           conditions. Any shortage could impact the surge in
the first months of 2021 exceeded pre-pandemic levels.          demand for shipping as the economy and international
However, the recovery is volatile and dependent on the          trade rebounds.
success of vaccinations and the ongoing effects of the
pandemic. Surges in demand for goods combined with              Overall, Covid-19 has had only limited impact on marine
Covid-19-related delays at ports and shipping capacity          claims to date. Hull insurance has seen little direct impact.
management problems have led to congestion at peak              Marine liability insurers are expected to face passenger
times and a shortage of empty containers, particularly          liability claims from cruise ships. Cargo insurers have seen
in Asia, highlighting the need for effective backhaul of        an uptick in perishable goods claims. However, the surge in
empty containers in the shipping sector. The global nature      demand for shipping, coupled with the pandemic, has put
of the sector, and the lack of spare capacity within it,        shipyards under pressure. There is an increased cost of hull
means problems in one region can have ripple effects            and machinery claims due to delays in the manufacture
around the world. In June 2021 it was estimated that there      and delivery of spare parts, as well as a squeeze on
was a record total of 300 freighters awaiting to enter          available shipyard space. The costs of salvage and repairs
overcrowded ports.                                              has also increased. Potentially, insurers could see an
                                                                uptick in machinery breakdown claims if Covid-19 has
The crew change situation is a humanitarian crisis which        affected crews’ ability to carry out maintenance or follow
continues to have a major impact on the health and              manufacturers’ protocols. Machinery breakdown claims
wellbeing of seafarers. In March 2021, it was estimated         could arise from the reactivation of the cruise ship industry
that some 200,000 seafarers remained on board vessels           if maintenance protocols have not been followed – there
with a similar number urgently needing to join ships to         have also been fires on board vessels in lay-up.

6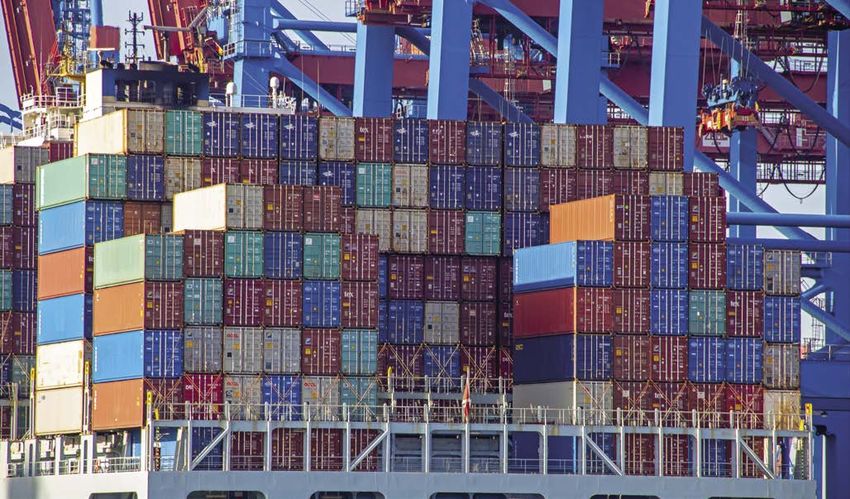
SAFETY AND SHIPPING REVIEW 2021
Larger vessels. Larger exposures in ignition and/or complicate detection and firefighting.
The other contributing factor is the fire detection and
The blocking of the Suez Canal by the Ever Given fighting capabilities relative to the size of the vessel.
container ship in March 2021 is the latest in a growing Major incidents have shown container fires can easily
list of incidents involving large vessels. Container ships, get out of control and result in the crew abandoning the
car carriers and bulk carriers have grown larger in recent vessel on safety grounds, thus increasing the size of loss.
decades as shipping companies seek economies of scale An International Union of Marine Insurance working
and fuel efficiency, a trend that is likely to continue with group on container ship fire safety is working on a draft
environmental pressures. Despite the Covid-19 pandemic, of recommendations to the International Maritime
ever larger vessels are on order. Organization (IMO) in respect of improved fire detection
and firefighting capabilities on board container ships.
Larger vessels present unique risks. Responding to Other industry organizations are also taking action. The
incidents is more complex and expensive. Port facilities problem of mis-declared cargo is not so easily addressed
and salvage equipment to handle large ships are because the problems are often within the supply chains.
specialized and limited. Approach channels to existing
ports may have been dredged deeper and berths and Container losses at sea also spiked last year and have
wharfs extended to accommodate large vessels but the continued at a high level in 2021, disrupting supply chains
overall size of ports has remained the same. If the Ever and posing a potential pollution and navigation risk. The
Given had not been freed, salvage would have required number of container losses is the worst in seven years.
the lengthy process of unloading some 18,000 containers, More than 3,000 containers were lost at sea in 2020,
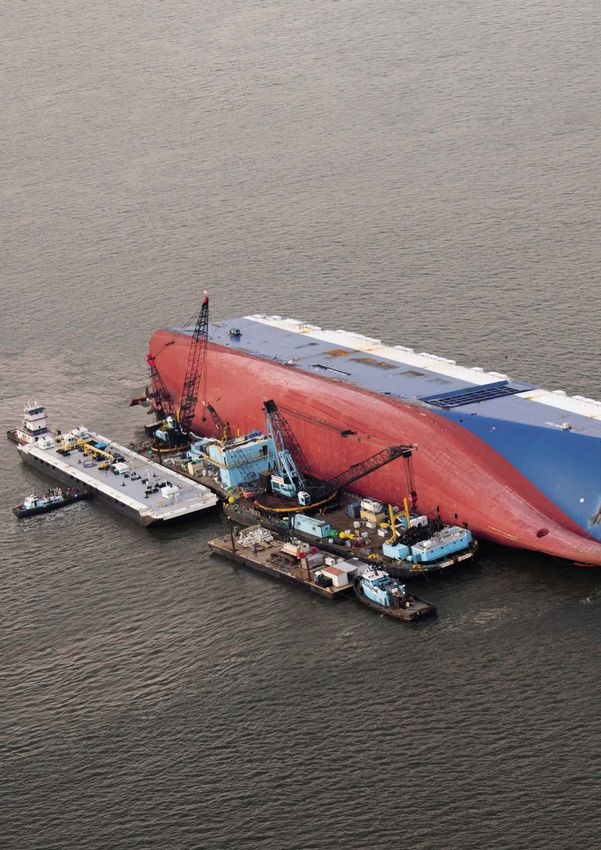
requiring specialist cranes. The wreck removal of the large while more than 1,000 alone fell overboard during the
car carrier, Golden Ray, which capsized outside the US port first months of 2021. This compares with an average of
of Brunswick with more than 4,000 vehicles on it in 2019, just 1,382 containers lost each year from around 6,000
has taken well over a year and cost several hundreds of container vessels in operation. The rise in container losses
millions of dollars. may be driven by a combination of factors, such as larger
ships, more extreme weather and a surge in freight rates
The number of fires on board large vessels has increased and mis-declared cargo weights (leading to container
significantly in recent years. There was a record 40 cargo stack collapse) and the surge in demand for consumer
related fires or one every 10 days in 2019. In 2020, the goods. There are growing questions for how containers are
number of incidents declined slightly, but was still above secured on board ships.
the average. Vessel size has a direct correlation to the
potential size of loss. Car transporters/RoRo and large There have also been a number of losses involving very
container vessels are at higher risk of fire with the potential large ore carriers (VLOCs), particularly converted ones.
for greater consequences should one break out. VLOCs can pose a higher than usual exposure due to
the risks of cargo liquefaction, structural failings and
Container ship fires often start in containers, which can the added challenge of salvage and wreck removal.
be the result of non-declaration or mis-declaration of Repeated deviations from the cargo loading plan can
hazardous cargo, such as self-igniting charcoal, chemicals lead to structural fatigue in the long-term and result in
and batteries. When mis-declared, these might be catastrophic consequences.
improperly packed and stowed on-board, which can result
7
SAFETY AND SHIPPING REVIEW 2021

Delay, supply chain and port risk                              Middle East, processing around two thirds of Lebanon’s
accumulation issues                                            external trade. Meanwhile, the EU, the US and China have
                                                               billions of dollars of trade flowing through their ports
Maritime supply chain resilience is in the spotlight after     every quarter. Such exposure in a busy port can have huge
a series of recent events. The Ever Given incident sent        consequences. And for insurers, this represents a massive
shockwaves through global supply chains that are critically    accumulation of risk which requires modeling.
dependent on seaborne transport with the repercussions
lasting for months. It compounded delays and disruption        Security and sanctions concern mount
already caused by trade disputes over the past year,
extreme weather in the US and, of course, the fact the         The Gulf of Guinea has emerged as the world’s piracy
shipping industry was already dealing with disruption          hotspot, accounting for over 95% of crew numbers
caused by the pandemic and surges in demand for                kidnapped worldwide in 2020. Last year, 130 crew were
containerized goods and commodities.                           kidnapped in 22 separate incidents in the region – the
                                                               highest ever – and the problem has continued in 2021.
Recent years have also seen major delays to shipping           Vessels are being targeted further away from the shore –
from floods and droughts on key inland shipping routes,        over 200 nautical miles (nm) from land in some cases. The
including the Mississippi in the US and Rhine in Europe.       Covid-19 pandemic could exacerbate piracy as it is tied to
Climate change volatility is increasingly impacting            underlying social, political and economic problems, which
shipping. Going forward, the shipping industry needs to be     could deteriorate further. Former hotspots like Somalia
more proactive in addressing and mitigating the impacts        could even re-emerge.
of extreme weather. More accurate weather forecasting
and technology will help shipping companies plan ahead         The crippling ransomware attack against the Colonial oil
and take action to avoid losses, such as to delay departure,   pipeline in the US in May 2021 should be a wake-up call
seek shelter, or reroute to an alternative port.               for the maritime industry. As a critical part of the global
                                                               supply chain, the shipping industry could increasingly
Potential claims scenarios resulting from delays and           become an attractive target for criminals and politically
disruptive weather include spoilage of refrigerated            motivated attacks. All four of the world’s largest shipping
cargoes in container shipments, hull claims from bulk          companies have already been hit by cyber attacks.
shipments where vessels face longer waiting times at           Shipping and logistics firms experienced three times as
anchor because of high water levels and flooding of stock      many ransomware attacks last year as in 2019.
in RoRo shipments from storms if primary storage areas
are at maximum capacity.                                       Geopolitical conflict is increasingly played out in cyber
                                                               space. Recent years have seen a growing number of GPS
Political risks are also impacting maritime transport and      spoofing incidents, particularly in the Middle East and
supply chains. In 2020, a trade dispute between China          China, which can cause vessels to believe they are in a
and Australia resulted in more than 60 vessels being           different position than they actually are. Concerns have
stranded at sea for up to nine months, unable to deliver       been growing about a potential cyber attack on critical
their cargoes of thermal coal and unable to change crew.       maritime infrastructure, such as a major port or shipping
Conflicts in the Middle East and piracy in Africa also         route. Although an accident, the Suez Canal blockage
continue to threaten.                                          shows the disruption a momentary loss of propulsion or
                                                               steering failure can cause. Increased awareness of – and
Last year’s devastating explosion at the port of Beirut        regulation around – cyber risk is translating into an uptake
in Lebanon in August 2020 added to industry concerns           of cyber insurance by shipping companies, although mostly
over the storage of hazardous goods and concentrations         for shore-based operations to date.
of risk at ports. Ammonium nitrate, which caused the
explosion, is a widely used chemical and can be found in       The burden of international sanctions continues to rise,
ports and warehouses across the world. However, it should      posing both a compliance and safety risk. In a worrying
be stored away from combustible materials and away             development, some vessels have been switching off
from populated areas or critical services. The explosion,      Automatic Identification Systems (AIS) as they seek to hide
which resulted in the total losses of at least three vessels   their location and defy US sanctions. This can obviously
in the port – together with the Tianjin explosion in China     have a detrimental impact, given the potential for a serious
in 2015 – also highlight the concentrations of risk in the     incident to occur, such as a collision.
world’s largest ports. Beirut is a major gateway to the

8
SAFETY AND SHIPPING REVIEW 2021

The environmental picture                                      Sailing in Arctic waters poses a number of risks, including
                                                               unpredictable and extreme weather conditions, long
Since January 1, 2020, the cap on the sulphur content of       periods of darkness, and the remoteness of routes from
ships’ fuel was cut to 0.5% (from 3.5%). Known as IMO          infrastructure and emergency response services. In the
2020, the mandatory limit is expected to reduce emissions      event of an accident the cost of salvage and environmental
of harmful sulphur oxide (SOx) emissions from shipping         impact could be considerably higher than in non-Arctic
by 77%. To date, the transition to low-sulphur shipping has    waters. Analysis shows there were 58 reported shipping
been smoother than many predicted, although insurers           incidents in Arctic Circle waters during 2020 – up by 17
have seen a number of machinery damage claims related          year-on-year and the highest total for three years.
to scrubbers, which remove SOx from exhaust gases for
vessels using heavy marine fuel, and arising from the use      The international shipping industry produced just over
of “blended” low-sulphur fuels. In some cases, the use of      one billion tons of greenhouse gases (GHG) in 2018,
low-sulphur fuels has led to severe damage, and some           almost 10% more than in 2012. Today’s existing fleet and
significant claims from the cost of repairs and loss of        technology will not get the shipping industry to the IMO’s
earnings because critical spare parts were not available.      GHG target of a 50% cut in emissions by 2050. Meeting
                                                               these targets will require substantial investments in
Arctic shipping continues to gather momentum. In the           research and development and big changes in ship design
last five years, cargo traffic along the Northern Sea          and propulsion, which will have implications for risk and
Route (NSR) has grown almost fivefold, reaching 33mn           supply chains. Ships will be significantly different in 20
tons in 2020 and it is predicted that this could increase to   years’ time. However, an understanding of risk needs to be
100mn tons by 2030. However, climate change concerns           key to the transition to low-carbon shipping. As seen with
may hamper further development. A growing number of            large container ships, advancements that do not focus on
companies have pledged not to ship goods through the           risk can lead to unintended consequences.
Arctic Ocean on environmental grounds.

                            200,000
    Seafarers stranded
    on board vessels in
           March 2021

                            18,000+
          Containers on
         the Ever Given

                            876
  Total losses of vessels
           (2011 - 2020)

                                                                                                                        9
SAFETY AND SHIPPING REVIEW 2021

Losses
  in focus
The analysis over the following pages covers both total losses
and casualties/incidents. See page 56 for further details.

Total losses by top 10 regions 2011-2020 and 2020

                                                                                                                                                                                            Russian Arctic and
                                                                                           British Isles, N. Sea,                                                                           Bering Sea
                                                                                           Eng. Channel and
                                                                                62         Bay of Biscay                                                                                                   23
                                                                                                                                                                                                           3

                                                                                 3                                                                                                         87
                                                                                                                         East Mediterranean
                                                                                                                         and Black Sea
                                                                                                     126
                                                                                                                                                              224                           2
                                                                                 34
                                                           West
                                                           Mediterranean                                                                                                               Japan, Korea and
                                                                                                       7                        42                                                     North China

                                     2   West Indies                                                       Arabian Gulf         4
                                                                                                           and approaches                                     16
                                                                                                                                              24
                                                                            37                                                                                           S. China, Indochina, Indonesia
             190                                   3                                                                27                                                   and Philippines
                                                                                                                                         Bay of
                                          S. Atlantic and East              3                                       1                    Bengal
                                          Coast South America
                                                                                                                East African Coast
                                                                      West African Coast

              5

            Other
                          49 total losses in 2020                                                                       Total losses by region: 2011 - 2020

                          876 total losses between 2011 and 2020                                                        Total losses by region: 2020

Total losses by year 50% drop over a decade
                                                            150
Annual shipping losses have halved                                                     128
compared with 10 years ago,                                 120                                         111
                                                                                                                                       105
although 2020 represented the first                                       98                                                                         99
                                                                                                                           90                                       95
time in five years that losses have                              90

not continued to decline.                                                                                                                                                          53
                                                                 60                                                                                                                               48              49

Vessels over 100GT only                                          30
                                                                         2011         2012             2013              2014         2015          2016        2017              2018          2019             2020

                                                                                                                                                         Source: Lloyd’s List Intelligence Casualty Statistics
10                                                                                                                                            Data Analysis & Graphic: Allianz Global Corporate & Specialty
SAFETY AND SHIPPING REVIEW 2021
2020 review
Total losses by top 10 regions
From January 1, 2020 to December 31, 2020
Annual
The database shows 49 total losses over 100GT Region Loss
Change
at the end of 2020 around the world – a similar S. China, Indochina, Indonesia and Philippines 16 ↑2
number to 2019 when 48 were reported. South
East Mediterranean and Black Sea 7 ↑3
China, Indochina, Indonesia and Philippines
Arabian Gulf and approaches 4 ↑4
remains the main loss hotspot, accounting for
British Isles, N.Sea, Eng. Channel and Bay of Biscay 3 =
a third of all losses (16), representing a small
Russian Arctic and Bering Sea 3 ↑2
increase year-on-year. The East Mediterranean
S. Atlantic and East Coast South America 3 ↑2
and Black Sea (7) and Arabian Gulf (4) regions
West African Coast 3 =
both saw significant increases in loss activity to
Japan, Korea and North China 2 =
rank second and third.
West Indies 2 ↑1
East African Coast 1 =
Other 5
Total 49 ↑1
2011 - 2020 review
Total losses by top 10 regions
From January 1, 2011 to December 31, 2020
Region Loss
The 2020 loss year (49) represents a significant
improvement on the rolling 10-year loss average S. China, Indochina, Indonesia and Philippines 224
(88) – down 45%. South China, Indochina, East Mediterranean and Black Sea 126
Indonesia and Philippines remains the top loss Japan, Korea and North China 87
hotspot of the past decade. This is driven by a British Isles, N.Sea, Eng. Channel and Bay of Biscay 62
number of factors including high levels of local Arabian Gulf and approaches 42
and international trade, congested ports and West African Coast 37
busy shipping lanes, older fleets and exposure to West Mediterranean 34
extreme weather. East African Coast 27
Bay of Bengal 24
Together, the top 10 maritime regions account for Russian Arctic and Bering Sea 23
close to 80% of all losses over the past decade Other 190
with the South China, Indochina, Indonesia and Total 876
Philippines, East Mediterranean and Black Sea,
and Japan, Korea and North China regions
alone accounting for half of all losses.
Vessels over 100GT only
Source: Lloyd’s List Intelligence Casualty Statistics
Data Analysis & Graphic: Allianz Global Corporate & Specialty
11SAFETY AND SHIPPING REVIEW 2021
Total losses by type of vessel
2011 - 2020
Cargo vessels account for 40% of total losses over the past decade.
Top 5 vessel types lost
60
50
40
Cargo 30
Fishery
20
Bulk
10
Passenger
Tug 0
2011 2012 2013 2014 2015 2016 2017 2018 2019 2020
Total losses by type of vessel: 2011 – 2020
2011 2012 2013 2014 2015 2016 2017 2018 2019 2020 Total
Cargo 37 61 40 31 40 34 54 17 16 18 348
Fishery 14 12 13 15 16 10 8 12 10 10 120
Bulk 14 11 15 5 13 5 7 2 2 2 76
Passenger 7 7 8 11 6 11 5 6 3 5 69
Tug 2 7 7 7 6 7 4 4 4 3 51
Chemical/Product 4 8 10 2 3 7 4 1 1 40
RoRo 3 6 2 5 6 9 1 4 1 37
Container 3 7 4 4 5 5 3 2 1 1 35
Other 5 3 6 4 4 3 1 4 5 35
Supply/Offshore 2 3 2 3 3 2 2 1 1 19
Dredger 2 1 1 1 1 3 2 1 12
Tanker 4 1 1 2 3 1 12
Barge 3 1 3 1 2 1 11
LPG 1 1 1 1 2 6
Unknown 1 2 1 1 5
Total 98 128 111 90 105 99 95 53 48 49 876
Vessels over 100GT only
Source: Lloyd’s List Intelligence Casualty Statistics
12 Data Analysis & Graphic: Allianz Global Corporate & SpecialtySAFETY AND SHIPPING REVIEW 2021
2020 review
Total losses by type of vessel
January 1, 2020 to December 31, 2020
Cargo vessels accounted for more than a third of all
vessels lost in 2020. Foundering was the most frequent
cause of loss and most cargo vessels were lost in South
East Asian waters. The number of losses involving cargo
and passenger vessels increased year-on-year.
49
| Cargo 18
| Fishery 10
| Passenger 5
| Tug 3
Total
| Bulk 2
| Chemical/Product 1
| Container 1
| Dredger 1
| RoRo 1
| Supply/Offshore 1
| Tanker 1
| Other 5
The huge explosion in Beirut in Lebanon on August 4, 2020 resulted in the
reported total losses of at least three vessels in the port.
Vessels over 100GT only
Source: Lloyd’s List Intelligence Casualty Statistics
Data Analysis & Graphic: Allianz Global Corporate & Specialty
13SAFETY AND SHIPPING REVIEW 2021
Total losses by cause
2011 - 2020
Foundered (sunk/submerged) (54%), wrecked/stranded (20%) and
fire/explosion (11%) are the top three causes of total losses over the
past decade, accounting for 85% of all losses.
Top 5 causes of loss
70
60
50
40
Foundered
30
Wrecked/stranded
20
Fire/explosion
Machinery damage 10
Hull damage 0
2011 2012 2013 2014 2015 2016 2017 2018 2019 2020
Total losses by cause: 2011 – 2020
2011 2012 2013 2014 2015 2016 2017 2018 2019 2020 Total
Foundered (sunk/submerged) 46 54 70 50 66 48 57 31 31 24 477
Wrecked/stranded (grounded) 28 29 21 18 19 20 15 11 4 7 172
Fire/explosion 9 14 15 7 9 12 8 6 9 10 99
Machinery damage/failure 6 15 1 5 2 10 9 2 1 51
Hull damage (holed, cracks etc.) 3 7 1 5 2 4 5 1 1 29
Collision (involving vessels) 3 5 2 2 7 2 1 2 1 2 27
Contact (e.g. harbor wall) 2 1 3
Missing/overdue 2 1 3
Piracy 1 1
Miscellaneous 2 2 1 2 1 1 5 14
Total 98 128 111 90 105 99 95 53 48 49 876
Vessels over 100GT only
Source: Lloyd’s List Intelligence Casualty Statistics
14 Data Analysis & Graphic: Allianz Global Corporate & SpecialtySAFETY AND SHIPPING REVIEW 2021
2020 review
Total losses by cause
January 1, 2020 to December 31, 2020
Foundered (sunk/submerged) was the main cause of total
losses reported during 2020, accounting for one in two
losses. Contributing factors included bad weather, poor
visibility leading to contact, flooding and water ingress and
machinery breakdown.
49 Total
| Foundered 24
| Fire/explosion 10
| Wrecked/stranded 7
| Collision 2
| Machinery damage/failure 1
| Miscellaneous 5
The number of fires/explosions resulting in total losses increased
again year-on-year, hitting a four-year high of 10 vessels.
Vessels over 100GT only
Source: Lloyd’s List Intelligence Casualty Statistics
Data Analysis & Graphic: Allianz Global Corporate & Specialty
15SAFETY AND SHIPPING REVIEW 2021
Total losses in
all regions 2020
3 Russian Arctic and
Bering Sea
3
British Isles, N. Sea,
Eng. Channel and
1 Newfoundland Bay of Biscay
7 East Mediterranean 2 Japan, Korea and
North China
1 1
and Black Sea
North American West
West Coast Mediterranean
16
Gulf of Mexico
1 4 Arabian Gulf
2
and approaches
West Indies
S. China, Indochina, Indonesia
and Philippines
3
total S. Atlantic and East
Coast South America 1 East African Coast
49 West African
Coast 3
1 South American West Coast
Vessels over 100GT only
This map shows the Region Loss Share
approximate locations 1 S. China, Indochina, Indonesia and Philippines 16 33%
2 East Mediterranean and Black Sea 7 14%
of all 49 reported total 3 Arabian Gulf and approaches 4 8%
losses during 2020. British Isles, N.Sea, Eng. Channel and Bay of Biscay 3 6%
Russian Arctic and Bering Sea 3 6%
4
S. Atlantic and East Coast South America 3 6%
West African Coast 3 6%
Japan, Korea and North China 2 4%
5
West Indies 2 4%
East African Coast 1 2%
Gulf of Mexico 1 2%
Newfoundland 1 2%
6
North American West Coast 1 2%
South American West Coast 1 2%
West Mediterranean 1 2%
Source: Lloyd’s List Intelligence Casualty Statistics
16 Data Analysis & Graphic: Allianz Global Corporate & SpecialtySAFETY AND SHIPPING REVIEW 2021
2020 review
All casualties/incidents including total losses
From January 1, 2020 to December 31, 2020
Top 10 regions Loss Annual
2020: While the number of total losses has Change
remained stable over the past year, the number British Isles, N.Sea, Eng. Channel and Bay of Biscay 579 ↓ 28
of reported shipping casualties or incidents
East Mediterranean and Black Sea 429 ↓ 38
declined slightly from 2,818 to 2,703 or by
S. China, Indochina, Indonesia and Philippines 265 ↑ 10
around 4%.
Great Lakes 180 ↓ 16
West African Coast 146 ↑ 48
The British Isles, North Sea, English Channel and
North American West Coast 137 ↑ 17
Bay of Biscay maritime region saw the highest
Baltic 113 ↓ 29
number of reported incidents (579), although
Iceland and Northern Norway 108 ↓1
this was slightly down year-on-year. Machinery
West Mediterranean 105 ↓ 48
damage/failure was the top cause of shipping
Japan, Korea and North China 93 ↓9
incidents, accounting for 40%.
Other 548
Total 2,703 ↓ 115
2011 - 2020 review
All casualties/incidents including total losses
2011 – 2020
Top 10 regions Loss
2011 – 2020: The East Mediterranean and
Black Sea region is the location of the most East Mediterranean and Black Sea 4,556
shipping incidents over the past decade (4,556), British Isles, N.Sea, Eng. Channel and Bay of Biscay 4,382
accounting for 17%. S. China, Indochina, Indonesia and Philippines 2,488
Baltic 1,551
Of the 26,000+ reported incidents over the Great Lakes 1,442
past decade, more than a third (9,334) were Japan, Korea and North China 1,393
caused by machinery damage or failure – well Iceland and Northern Norway 1,082
over twice as many as the next highest cause, North American West Coast 1,003
collision (3,288). West Mediterranean 992
West African Coast 890
Other 6,283
Total 26,062
Note: All figures are based on reported total losses for the year-end 2020. Vessels over 100GT only
2020’s total losses may increase slightly in future as, based on previous years’
experience, developments in losses sometimes lead to a number of total losses
being confirmed after year-end. The average variance over the past nine years
has been an increase of one total loss per year. However, in some years this can
increase, with up to several additional losses being notified for one year. Vessels over 100GT only
Source: Lloyd’s List Intelligence Casualty Statistics
Data Analysis & Graphic: Allianz Global Corporate & Specialty
17SAFETY AND SHIPPING REVIEW 2021 1. The Covid factors 18
SAFETY AND SHIPPING REVIEW 2021

The shipping industry has shown
great resilience through the
pandemic but the crew change
crisis, volatile trade volumes
and constraints on capacity
continue to have significant
implications. And although the
pandemic has had only a limited
impact on marine claims to date,
that doesn’t mean it will be all
smooth sailing in the future.

                                       19
SAFETY AND SHIPPING REVIEW 2021
Covid creates surges in
trade volumes and risks
Following sharp falls during the early part of the pandemic,
global trade volumes have since rebounded. However, volatility
in demand, constraints on capacity and the ongoing impact of
Covid-19 are causing major congestion at ports and disruption to
supply chains. In May 2021, Covid-19 outbreaks at Guangdong
Province in southern China and one of the busiest ports in the
world, Yantian in the city of Shenzhen, brought further delays.
However, despite the devastating economic “Trade volumes did not fall off a cliff as
impact of Covid-19, the effect on maritime trade expected and now we see a strong recovery in
has been less than first feared. According to several parts of the industry. The pandemic is
Clarksons Research1 , global seaborne trade also testament to the reliance of the shipping
volumes declined only by an estimated 3.6% in industry. Shipping companies learned the
2020, and are on course to surpass 2019 levels lessons of the global financial crisis, and as a
this year. The roll-out of Covid-19 vaccines is result, are in a good position this time around.”
expected to “supercharge” global growth in
2021, said Euler Hermes2 at the end of 2020. Data from the Institute of Shipping4 showed
Vaccines could push forward the global trade global container throughput in the first months of
recovery by one year, with trade in goods 2021 exceeded pre-pandemic levels, increasing
already returning to pre-crisis value levels at by 6.4% 5 in January 2021 compared to January
end-2020, it said at the time. 2020. Changes in consumption and shopping
patterns triggered by the pandemic, combined
While the cruise industry and the car carrier with an easing of lockdowns and government
segment have been worst affected by the stimulus packages, has led to increased demand
pandemic, the industry’s three largest markets for manufactured consumer goods, typically
– tankers, bulkers and containers – have been moved in shipping containers.
quick to recover. The container market has staged
a remarkable recovery, as increased demand Similarly, the dry bulk market has benefited from
and restricted supply resulted in a surge in freight the recovery of commodity prices. Demand for
rates. By early 2021, freight rates from China to agricultural materials, coal, iron ore and other
South America had jumped 443% and by 63% on metals has caused commodity prices to rise
the route between Asia and North America’s sharply, helping drive up transportation costs
eastern coast, according to the United Nations by more than 50% 6 . The average daily earnings
Conference on Trade and Development3. of dry bulk carriers saw a more than threefold
increase in the first three months of 2021
“Coronavirus has shown that unpredictable compared to the start of 2020, its highest value
events are just that,” says Justus Heinrich, in 10 years.
Global Product Leader Marine Hull at AGCS.
20SAFETY AND SHIPPING REVIEW 2021
There has been increased demand
for manufactured consumer goods,
typically moved in containers
However, the recovery is volatile and dependent Other factors are likely to affect shipping
on the success of vaccinations and the ongoing capacity in the months ahead. In the dry bulk
effects of the pandemic. Despite a recovery in the market, few ships were ordered in 2020 while
price of oil, seaborne oil shipments in 2020 ended the scrapping rate was twice as high as in 2019.
the year lower – crude oil trade down 8% and oil Orders for new container ships picked up in the
product trade down 12% – while tanker revenues last quarter of 2020, following several years of
per day7 fell from a peak in April 2020 to their deferred orders, although there is a lag of two
lowest level in over 20 years in January 2021. to three years between the placement of vessel
orders and delivery.
Even the container market has had its ups and
downs. Surges in demand combined with Covid- There are risks associated with volatile trade
19-related delays at ports and shipping capacity volumes, says Captain Rahul Khanna, Global
management problems led to congestion at Head of Marine Risk Consulting at AGCS:
peak times. Having retrenched at the start of the “Unpredictable, sudden sharp downturns and
pandemic, carriers, ports and shippers were all surges in demand are difficult to manage at the
taken by surprise by the stronger than expected best of times, and can lead to capacity issues
demand in the second half of 2020, which led to and supply chain disruption. In the early stage of
a shortage of empty containers in Asia. Covid-19, many ships were taken out of service –
either scrapped or in layup – and this has led to
“The current supply chain disarray in the container some supply constraints.”
trade highlights the need for effective backhaul of
empty containers,” says Captain Andrew Kinsey, The surge in demand for consumer goods has
Senior Marine Risk Consultant at AGCS. “As a also been cited as a potential contributing factor
result of trade imbalances shipping lines are faced in the recent rise in incidents of containers lost at
with significant volumes of empty containers in sea. Stacking of containers on vessels is reported
the US and North Europe that need to be returned to be at very high levels in order to service this
to Asian ports. When callings are canceled due demand with concerns growing about whether
to congestion this exasperates the shortage of containers are being safely secured on board.
available teus to load out bound cargoes.”
1 Splash247.com, Clarksons predicts seaborne trade volumes will surpass 2019 levels this year, March 8, 2021
2 Allianz Research, Vaccine Economics, December 18, 2020
3 UNCTAD, Shipping during Covid-19: Why container freights have surged, April 23, 2021
4 Institute of Shipping Economics and Logistics, Container throughput still above level before Corona crisis, March 30, 2021
5 Institute of Shipping Economics and Logistics, Leading container ports again achieve double digit growth rates, January 2021
6 Institute of Shipping Economics and Logistics, 2020/2021 dry bulk traffic development - ore export ports are back on track, March 2021
7 Institute of Shipping Economics and Logistics, The poor start in 2021 leaves quite some room for recovery in the tanker market, March 2021 21SAFETY AND SHIPPING REVIEW 2021
Crew change crisis could have
long-term consequences
The crew change crisis continues to have a major impact on the health and
wellbeing of seafarers, with potentially long-term implications for safety.
Covid-19-related travel and border restrictions, If crews are fatigued a vessel could potentially
and the widespread suspension of international be considered unseaworthy under international
flights, have significantly impacted the ability maritime law.”
of ship operators to conduct crew changes.
Between March and August 2020 only 25% of Crew changes are also a compliance risk.
normal crew changes were able to take place According to the International Labour
(ICS) 8 while at least half a million seafarers have Organization (ILO) Maritime Labour Convention
been affected. (MLC) crew should serve no more than 11
months continuously at sea and are entitled
As of March 2021, it is estimated that some to access onshore medical facilities and care.
200,000 seafarers9 remained on board According to the IMO, Covid-19 has caused
commercial vessels, unable to be repatriated many seafarers to serve significantly longer
and past the expiry of their contracts, with a than the 11 months agreed by the ILO. If ships
similar number of seafarers urgently needed to are unable to operate safely in compliance with
join ships to replace them. On any given day, international rules, vessels may have to suspend
nearly one million seafarers are working on their operations.
some 60,000 large cargo vessels worldwide,
according to the IMO. The ongoing crew crisis is likely to have long-
term consequences for the shipping industry,
The crisis raises serious welfare, safety and according to Kinsey. “With hundreds of
regulatory concerns. In addition to humanitarian thousands of crew members stuck on board
and crew welfare issues, there is an increasing vessels or on extended contracts, I have serious
risk that crew fatigue could lead to human error concerns for the next generation of seafarers.
and even serious accidents. The situation with Covid-19 means that we are
not training and developing them, while the
“Timely crew changes are vital to the safe sector may struggle to attract new blood due to
operation of shipping, and seafarers spending current working conditions,” says Kinsey.
extended periods on board are more at risk of
mental health issues, exhaustion, fatigue, anxiety “Shipping is likely to experience a surge in
and mental stress,” says Captain Nitin Chopra, demand as the economy and international
Senior Marine Risk Consultant at AGCS. trade rebounds with vaccinations. However,
many crews are fatigued and have been under
“There needs to be a global collaborative effort immense strain from Covid-19 for over a year.
to get crews off ships. But the industry also Potentially, we could see a shortage of seamen if
may need to take measures to give crew some the industry struggles to retain or recruit.”
respite, such as adjustments to working hours.
22SAFETY AND SHIPPING REVIEW 2021
The crew crisis took on a new dimension in 2021.
As Covid-19 infection rates escalated in India,
one of the world’s largest sources of seafarers,
ports – including Singapore, Hong Kong and the
UK - barred vessels and crew that had recently
visited India. Vessels also stopped calling at
Indian ports, which are an important stopover
for trade between Europe, Africa and Asia.
In a bid to resolve the current crisis, the IMO
established a Seafarer Crisis Action Team and,
working with the International Chamber of
Shipping (ICS), developed a ‘Framework of
Protocols’ for safely conducting crew changes.
The IMO and other organizations have
repeatedly urged governments to designate
seafarers and port personnel as “key workers”, The Wakashio ran
exempt them from national travel or movement aground off the coast of
restrictions, facilitate emergency repatriation
and prioritize vaccinations. Mirroring these calls, Mauritius in July 2020
more than 450 shipping companies and allied
organizations signed the Neptune Declaration
on Seafarer Wellbeing and Crew Change10 .
A global vaccination programme is likely to be
Extended periods at sea can lead to mental the answer to the crew change crisis, although
fatigue and poor decision making, which the situation is complicated by the international
ultimately impact safety, says Khanna. “The nature of shipping, explains Khanna.
mental health and wellbeing of seafarers is a
massive issue that desperately needs to be dealt In March 2021, the ICS12 warned that lack of
with. While there is recognition of the problem – access to vaccinations for seafarers is placing
as seen in the Neptune Declaration – this issue shipping in a "legal minefield", and could cause
cannot be dealt with by the shipping industry disruption to supply chains from cancelled
alone and can only be solved in partnership with sailings and port delays. Vaccinations could
governments and other stakeholders.” soon become a compulsory requirement for
work at sea because of reports that some states
Crewing issues came under the spotlight in the are insisting all crew be vaccinated as a pre-
wake of the Wakashio incident in July 2020 condition of entering their ports. However, over
when the vessel ran aground off the coast of half the global maritime workforce is currently
Mauritius, spilling hundreds of tons of oil in the sourced from developing nations, which could
process. Reports11 indicated at least two of the take many years to vaccinate. In addition, the
crew had been on board the vessel for more vaccination of seafarers by shipping companies
than 12 months, unable to disembark when their could also raise liability and insurance issues,
contracts expired because of restrictive including around mandatory vaccination and
quarantine rules worldwide. privacy issues.
8 International Chamber of Shipping, The Covid-19 pandemic: The crew change crisis
9 International Maritime Organization, Crew changes: A humanitarian, safety and economic crisis
10 The Neptune Declaration on Seafarer Wellbeing and Crew Change
11 Lloyd's List, Two Wakashio crew were on board for more than a year, August 17, 2020
12 International Chamber of Shipping, Shipping companies in 'impossible position' as proof of seafarer vaccinations poses legal minefield, March 22, 2021 23SAFETY AND SHIPPING REVIEW 2021
The Golden Ray salvage operation
has been complex and costly
24 Photo: ShutterstockSAFETY AND SHIPPING REVIEW 2021
Covid-19 delays hit
cost of claims
Overall, Covid-19 has had only limited impact on marine
claims to date, although the pandemic has increased the cost
of some large claims, and may yet result in claims in future as
vessels in lay-up return to service, and as the potential impact
of the crew crisis and any delays in maintenance is revealed.
Hull insurance has seen little direct impact from Salvage is another impacted area. For example,
the pandemic, although vessels in lay-up, in the salvage and wreck removal of the Golden
particular cruise ships, led to some large Ray car carrier, which ran aground near the Port
accumulation exposures, especially in hurricane- of Brunswick in the US state of Georgia in 2019,
exposed Florida and the Caribbean. Marine suffered a setback when a number of the
liability insurers are expected to face passenger salvage crew tested positive for Covid-19.
liability claims related to cruise ships, while
cargo insurers have experienced an uptick in “The availability of resources and the movement
perishable goods claims. of people has been significantly impacted by
Covid-19 and the imposition of border and travel
It is still early days however, according to restrictions. This has resulted in delays for hull
Heinrich. “The frequency of marine claims has not and machinery claims, pushing up costs of
reduced, despite the slowdown in trade in 2020. salvage and repairs,” says Khanna.
Most ship owners have maintained operations
throughout the pandemic, and now we see a Chopra also believes the pandemic may
surge in demand and increased freight rates for influence marine insurance claims further down
container shipping and bulk carriers. Before we the line: “Covid-19 has created an environment
draw conclusions on the impact of Covid-19, we of elevated risk for the shipping industry, which is
will have to see how claims develop in 2021.” having to operate under very difficult
circumstances. Covid-19 measures at ports, crew
The surge in demand for shipping, coupled with fatigue, disruption to maritime supply chains,
the pandemic, has put shipyards under pressure, surges in demand for shipping and the increased
Heinrich continues. “We are seeing an increased use of virtual pilots can all affect exposures.”
cost of hull and machinery claims due to delays
in the manufacture and delivery of spare parts, Potentially, insurers could see an uptick in
as well as a squeeze on available shipyard machinery breakdown claims if Covid-19 has
space, which is in short supply.” affected crews’ ability to carry out maintenance
and repairs, or follow manufacturers’ protocols,
Chopra concludes.
25SAFETY AND SHIPPING REVIEW 2021
Cruise ships – return to service
brings reactivation risks
In May 2021, the MSC Virtuosa became the first
cruise ship to set sail from the UK in 14 months.
A few weeks prior to that, Carnival’s Costa Cruises
returned to service for the first time in 2021 in the
Mediterranean, with sailings from Italy.
26Machinery breakdown claims could arise if SAFETY AND SHIPPING REVIEW 2021
reactivation or maintenance protocols are
not followed on cruise ships
With the roll-out of Covid-19 vaccinations, most “Most cruise ships have been in warm lay-up,
cruise operators have been tentatively preparing and would have been frequently moved and
for a limited return to operations. A more maintained by a skeleton crew. Machinery
substantial return to service is expected later in breakdown claims could arise if reactivation or
2021 with the reopening of the US market. maintenance protocols are not followed, but
cruise ships typically have some of the highest
For the cruise industry, reopening will mean standards of maintenance,” says Turberville.
reactivating the 300-strong global cruise ship
fleet, which has been in lay-up. Although some In March 2021, a fire broke out on the MSC
operators have taken the opportunity to retire Lirica cruise ship, which was in warm lay-up in
some older vessels early. Last year Carnival the port of Corfu. The fire reportedly started in a
announced it is to remove 13 ships from its fleet lifeboat, although all 51 crew were unharmed. In
and delayed deliveries of new ships. June 2020, a fire broke out on the cruise ship
Asuka II, which was also in lay-up at the port of
The cruise fleet that emerges from the pandemic Yokohama, although it was quickly extinguished.
will be younger and more modern, although
there are potential risks as vessels come out of
lay-up, according to Chris Turberville, Head of
Marine Hull and Liabilities UK at AGCS.
27SAFETY AND SHIPPING REVIEW 2021
2. L arger vessels.
Larger exposures
Vero eos et accusam
et justo duo Dolores et
ea rebum.
As the Suez Canal incident demonstrated only too well, ever-
increasing vessel sizes continue to pose a disproportionately
large risk with costly groundings, fires and record levels of
container losses at sea.
28SAFETY AND SHIPPING REVIEW 2021
Mega-ship risks are occupying the attention
of insurers after the Suez Canal blockage
Suez Canal incident
latest to cause concern
The blocking of the Suez Canal The latest in a growing list of incidents involving
by one of the largest container large vessels, the Ever Given has added to
concerns in the industry that the risks associated
ships in service in the world – with large ships may soon outweigh the benefits.
the Ever Given – in March 2021
caused huge delays to hundreds “We need to look more closely at how we can
minimize the risks of mega-ships, especially in
of vessels waiting to transit ports or in bottleneck passages like the Suez
the canal, one of the biggest Canal or the Panama Canal, given the disruption
we have seen that grounding incidents can
chokepoints on the critical East- cause. If a ship runs aground in one of these
West trade shipping route. The waterways, specialized tugs would be needed
blockage was estimated to have and the port and canals should have access to
adequate resources in relatively short time,” says
affected an estimated $9.6bn of Captain Rahul Khanna, Global Head of Marine
goods each day, or around 12% Risk Consulting at AGCS.
of total world trade.
29
21SAFETY AND SHIPPING REVIEW 2021
Container ships, car carriers and bulk carriers have grown Unique risks
larger in recent decades as shipping companies seek
economies of scale and fuel efficiency, a trend that is likely Very large vessels present some unique risks. In particular,
to continue with climate change and the introduction responding to incidents is more complex and expensive.
of greenhouse gas emissions reduction targets for the Port facilities and salvage equipment to handle large ships
industry. Despite the Covid-19 pandemic, ever larger is specialized and limited, while salvage and wreck removal
vessels are on order. In December 2020, Ocean Network is more expensive and often still uncharted territory.
Express ordered six new container ships with capacity in
excess of 24,000 teu. The HMM Algeciras, introduced in “Port infrastructure has not kept pace with the increasing
April 2020, is currently considered to be the world’s largest size of vessels,” says Captain Nitin Chopra, Senior Marine
container ship with capacity of just under 24,000 teu. Risk Consultant at AGCS. “While approach channels to
existing ports have been dredged deeper and berths and
While economies of scale have helped drive the trend for wharfs extended to accommodate ultra large vessels,
larger and larger vessels, there have been unintended the overall size of existing ports has remained the same.
consequences, according to Captain Andrew Kinsey, As a result, ‘a miss’ can turn into ‘a hit’ more often for the
Senior Marine Risk Consultant at AGCS. ultra large container vessels.” Last year, a container ship
collided with another vessel and a dock crane in the port of
“Just because it is possible to build large ships, it does not Busan due to insufficient ballast water1 , Chopra notes.
mean we should,” says Kinsey. "The different consequences
of larger vessels are now becoming more apparent, In the case of the Ever Given, had the vessel not been
including impacting supply chains. Large vessels and freed, salvage would have required the lengthy process
the ports required to handle them present a massive of unloading some 18,000 containers, requiring specialist
accumulation of risk, while the costs are disproportionately cranes. The wreck removal of the large car carrier, Golden
greater when things go wrong.” Ray, which capsized outside the US port of Brunswick
with more than 4,000 vehicles on it in 2019, has taken
For a number of years insurers have warned about the well over a year and cost insurers several hundreds of
growing risks associated with larger vessels, including millions of dollars. The complex salvage operation, which
the problem of fires on large container ships, says Justus has required the vessel to be cut into sections in situ, has
Heinrich, Global Product Leader Marine Hull at AGCS. been plagued by delays from Covid-19 infections, winter
“Exposure continues to grow as more large container ships weather, fires and chain link failures.
and cruise ships are added to the world shipping fleet.
We have continued to see a number of near misses over “Very large container ships and other large vessels are a
the past year. The blocking of the Suez Canal shows these volatile risk for insurers to underwrite and will increasingly
concerns are valid.” require more and more input from risk consulting and claims,”
says Heinrich. “As exposures grow, insurers will have to ask
Insurers have already seen a number of very large claims if they are able to insure some types of large vessels, or if
from fires and groundings for large container ships as well they can only be underwritten as part of a mixed fleet.”
as fire and stability issues for car carriers. Large ore carriers
have also seen losses while the grounding of the cruise AGCS is undertaking analysis of losses involving large
ship Costa Concordia remains one of the most expensive vessels by size and type to identify areas of potential
marine insurance losses in modern times at almost $2bn. volatility and to better understand the potential loss,
The Suez Canal Authority has sought around $600mn from Heinrich adds.
the Ever Given's liability insurer and the Egyptian
government detained the vessel as it negotiated with
insurers. A compensation deal was eventually signed in
July 2021, leaving the vessel free to leave the waterway.
More recently, the industry is seeing the biggest spike in
lost containers at sea in seven years. “Large claims from
container ship fires and groundings, as well as the loss
of thousands of containers at sea, all have one common What are some of the lessons to be
thread – the increasing size of vessels,” says Khanna. learned from the Suez Canal blockage?
30 1 SWZ Maritime, Container ship ONE lacking ballast when it hit terminal crane in Busan, May 11, 2020SAFETY AND SHIPPING REVIEW 2021
50 years of container ship growth
1968 Encounter Bay 1,530 teu
1972 Hamburg Express 2,950 teu
1980 Neptune Garnet 4,100 teu
1984 American New York 4,600 teu
1996 Regina Maersk 6,400 teu
1997 Susan Maersk 8,000+ teu
2002 Charlotte Maersk 8,890 teu
2003 Anna Maersk 9,000+ teu
2005 Gjertrud Maersk 10,000+ teu
2006 Emma Maersk 11,000+ teu
2012
Marco Polo (CMA CGM) 16,000+ teu
2013
Maersk Mc-Kinney Møller 18,270 teu
2015
MSC Oscar 19,000+ teu
2017
OOCL Hong Kong 21,413 teu
2021
HMM Algeciras 24,000 teu
Container-carrying capacity has increased by around
1,500% since 1968 and has almost doubled over the
past decade. Ever larger vessels are on order.
Increase in size of ships in graphic is not to scale
Approximate ship capacity data: Container-transportation.com; AGCS
Source: Allianz Global Corporate & Specialty 31SAFETY AND SHIPPING REVIEW 2021
The Maersk Honam caught fire in March
2018 while sailing in the Arabian Sea
Photo: Wikimedia Commons
Fire claims buck the positive
overall trend for hull losses
The number of fires on board container ships has increased
significantly in recent years, which may in part be a reflection of
their increasing number in the global fleet – 2019 saw a record
year (40 cargo-related fires or one every 10 days)2 .
32You can also read